Abstract
The shear behavior of the Bolt-Grout interface has a significant effect on the stability of a bolting system. In this paper, a series of shear tests were conducted on Bolt-Grout interfaces, and the effects of rib spacing, rib angles, and normal stress on the shear characteristics and failure modes of the Bolt-Grout interface were investigated. The results showed that the shear strength varied nonlinearly with an increase in rib spacing and angle, and also that it increased linearly with an increase in normal stress. With smaller rib spacings, the effect of rib spacing on peak shear strength was more apparent. The failure modes of the interface can be categorized as shear-slip failure, shear-break failure, and composite failure. The proportion of shear-slip failure and shear-break failure mainly depends on the rib spacing, rib face angle and normal stress.
1. Introduction
Rock bolting is an important means of improving the mechanical properties of a rock mass, and fully grouted bolts, which have the advantages of good support effects and low support costs, are widely used in the field of civil, tunnels and mines, as well as other elements of rock engineering [1,2,3,4]. The fully grouted bolting system is made of surrounding rock, grout, bolt, Bolt-Grout and grout-rock interfaces. The bolting effect of fully grouted bolts are mainly influenced by the type of bolt [5,6], the grout material [7], the type of surrounding rock [8,9], and the interaction at the Bolt-Grout interface [10,11]. Extensive pullout experiments show that the Bolt-Grout interface is the weakest component, and its failure is one of the main forms of failure of the bolting system [10,11,12], as seen in Figure 1. The Bolt-Grout interface is an important part of the load transfer of the bolting system, and its shear strength is primarily determined by the bonding force, frictional force, and mechanical interlock force between the interfaces [13]. In addition to the surrounding pressure, the frictional force and mechanical interlock force are influenced by the bolt profile [2,11,13,14]. Therefore, studying the shear characteristics of the Bolt-Grout interface is essential to improving the support impact of rock bolting systems [15].
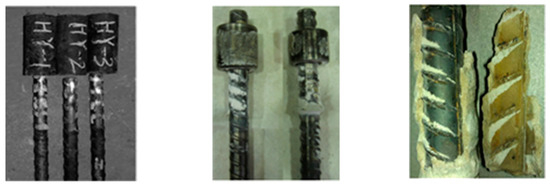
Figure 1.
Interface failure of Bolt-Grout in pull-out test [3].
Many scholars have conducted a great deal of research on the failure process of the Bolt-Grout interface. Numerous techniques are used in this research, such as laboratory testing, theoretical analysis and numerical simulations [16,17,18,19,20,21]. The pull-out test is a common approach to investigating bolt systems that is frequently employed to investigate shear mechanical characteristics. It was found that the mechanical properties of the Bolt-Grout interface were influenced by many factors, including the anchorage agent, confining pressure, and the bolt profile [22,23,24,25]. According to Yokota et al. [1,26], the anchorage agent material significantly affects the bolting effect of the rock bolting system. By appropriately adjusting the anchorage agent material and optimizing the material ratio, it is possible to improve the Bolt-Grout interaction and raise the bolting system’s bearing capacity. Through tests, Moosavi et al. [27] discovered that the higher the confining pressure, the higher the bonding capacity and the lower the dilation. According to Hanson et al. [28], increasing the bolt’s surface roughness coefficient can improve the Bolt-Grout interface’s mechanical interlock force and frictional force, enhancing the interface’s shear strength and serving the intended objective of enhancing the bolting effect. Cao et al. [13] discovered a strong correlation between the bolt profile and the mechanical behaviors of the interface. Tao et al. [22] conducted experiments on rebar bolts with five different rib spacings, finding that the bolting force increased with rib spacing and reached a maximum of 48 mm rib spacing. According to Hyett et al. [24], the peak stress and displacements of the bolts are directly related to the rib spacing and rib height. Oreste, P et al. [29] concluded that the interaction between the anchor and the rock can be influenced by changing the main geometric parameters of the bolt. The profile parameter that matters most for rebar bolts that are subjected to axial loads during load transmission is the rib spacing [22].
While the pull-out test has been used extensively in bolting system studies, it does have several disadvantages. Firstly, the rock bolting system is a classical composite system; the bolt is wrapped in the rock, and the pull-out test reflects the comprehensive effect of the support system, which makes it difficult to assess the mechanical properties and failure characteristics of the Bolt-Grout interface [16,30,31]. Secondly, the shear stress along the axial direction of the bolt in the pull-out test is exponentially distributed rather than uniformly distributed. Consequently, the results obtained may exhibit significant errors compared to the actual situation. To overcome these shortcomings, direct shear tests have been employed to study the mechanical characteristics of the Bolt-Grout interface. Wang et al. [32] conducted shear tests containing two realistic molt profiles and found that bolt B2 with larger rib angles performed better in shear at low initial normal stresses, while bolt B1 with larger rib spacing performed better in shear at high initial normal stresses. Yokota et al. [1,33] evaluated the effects of confining stress, bonding material strength, rib angle, and ribs on the interface’s shear behavior. Zhang et al. [15] investigated the effects of bar spacing, bar height and grout proportion, and the results showed a significant correlation between the interface’s peak shear strength and deformability, as well as the grout mixture and bolt profile.
Previous studies have concentrated on examining the impact of individual factors on the effectiveness of bolting systems. In addition, the rib spacing and angle in the surface profile of the bolt have greater influences on the interface, but the shear mechanical properties and failure mechanism regarding the Bolt-Grout interface under the influence of bolt surface morphology necessitate further investigation [34]. Based on these considerations, this study has systematically conducted shear tests on Bolt-Grout specimens with varying rib spacings and angles. The above research is of great significance in enhancing the bolting effect to increase the stability and safety of the bolting project.
2. Shear Test
2.1. Specimen Preparation
The specimen of the Bolt-Grout interface consisted of a steel part and a grout part. Referring to Zhang et al. [15,35,36], the simplified 2D surface profile of the steel plate was used to simulate the bolt rod. The concept and process to make a flat specimen of the grout-rock interface is shown in Figure 2. The lateral boundary conditions of the unfolded surface have been simplified by the bolt’s real force to create a two-dimensional shear model, as seen in Figure 2b.
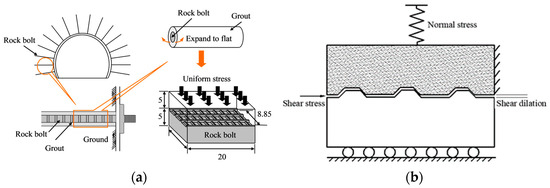
Figure 2.
The shear model of Bolt-Grout interface [34]. (a) Schematic diagram of the Bolt-Grout system (unit: mm) [32]. (b) Two-dimensional shear modeling of the Bolt-Grout interface.
It is especially important to choose the anchor material reasonably in the indoor test. In this paper, the steel used for the preparation of rebar bolts was selected as the bolt unfolding specimen, featuring a specimen size of L × W × H = 200 mm × 100 mm × 50 mm. The main geometrical parameters of the bolt surface profile are the bolt rib spacing L, the rib height h, the rib width a, the rib angle θ, and the angle of thread rise α, shown in Figure 3. In this paper, the rib spacing and angle were selected as the main variables of the test to be investigated, and the rib height h and transverse rib width a of each steel plate specimen were 1.2 mm and 1.9 mm, respectively.
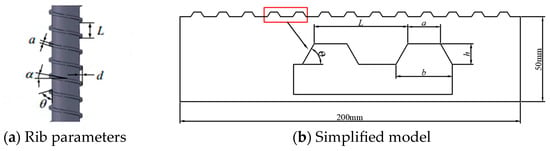
Figure 3.
(a) Rib parameters. (b) Simplified model. Parameters of rebar rib and simplified model (The red box in (b) are ribs).
Referring to the study of Wang et al. [32], high-strength gypsum sourced from Kuraray Noritake Dental was used to make the grout part. The specimen preparation process was as follows:
In the preparation of the gypsum specimens, the steel mold was placed in a mold the size of L × W × H = 200 mm × 100 mm × 100 mm. The mold was brushed with mineral oil; then gypsum and water were mixed according to the mass ratio of 2:1, and stirred well with a mixer; the stirred gypsum slurry was poured into the mold and put on the shocking table for 1 min to exclude the air bubbles. Finally, the excess gypsum slurry was scraped with a scraper to keep the surface of the specimen flat. The plaster reached a certain strength after 30 min of resting, the mold was removed, and the specimen was taken out and cured in the air environment for 7 d to get the molt-grout specimen. Specific process is shown in Figure 4. The physico-mechanical parameters of gypsum are shown in Table 1.
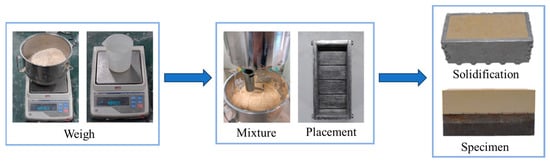
Figure 4.
Flow chart of preparation of mortar specimens.

Table 1.
Physico-mechanical properties of plaster.
2.2. Test Apparatus
Bolt-Grout interfaces were tested in shear using a CNC-type shear test set-up [37,38], which is shown in Figure 5. The apparatus consisted of a loading system, data acquisition and a controlling system. Throughout the test, the top shear box could move in a normal direction but not the shear direction, while the lower box could only move in the shear direction. Controlling the servo-controlled hydraulic pump and the hydraulic cylinders applied the maximum of both the normal and shear forces at 200 kN. Two LVDTs were positioned parallel to the lower shear box’s surface to measure the displacement brought on by the shear forces, and four LVDTs were positioned on top of the shear box to measure the normal displacement. The precision of the LVDTs was 0.001 mm, with a range of 0–20 mm.
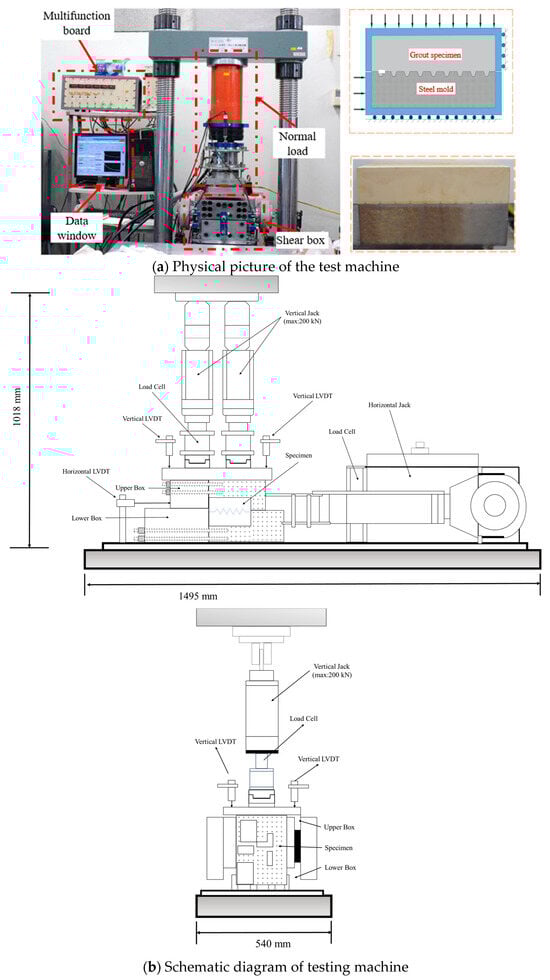
Figure 5.
CNC shear testing machine.
2.3. Test Scheme and Process
This paper has chosen five different rib spacings and five different rib angles based on the surface profiles of bolts that are frequently used in field engineering applications. Shear tests were performed on the specimens, and the effects of the rib spacings and rib angles on the shear characteristics of the Bolt-Grout interface were investigated. Figure 6 and Figure 7 depict the several steel molds with varying rib angles and spacing.
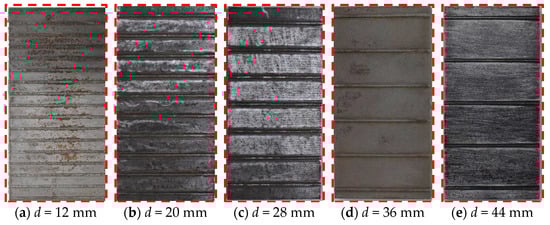
Figure 6.
Steel molds with different rib spacings.
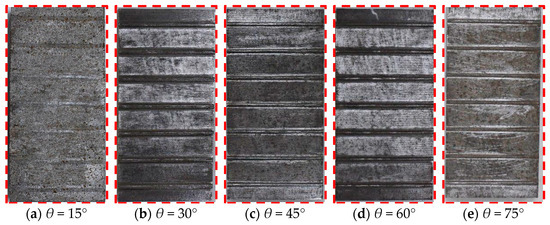
Figure 7.
Steel molds with different rib angles.
The initial radial pressure at the interface occurred due to the annular disturbance stress and grouting pressure during installation of the bolt, and the magnitude of the initial radial pressure on the bolt varied due to the different types of rock mass and different stress conditions. The studies of Hyett and Aziz et al. [24,39] have shown that the initial radial stress because of engineering disturbances and stress redistribution after the completion of anchor installation is usually less than 10 MPa; thus, five different normal stresses were chosen in this research.
Before the test, the engaged gypsum specimen and steel mold were put in the shear box, with the gypsum specimen on top and the steel plate specimen on the bottom. Subsequently, the normal stress was applied at a rate of 0.5 MPa/min using the load control mode until a constant value was reached, which was then maintained throughout the test. After that, a shear stress was applied, and the displacement control was used with a loading rate of 0.5 mm/min. The detailed test scheme is shown in Table 2.
Table 2.
Bolt-Grout shear test scheme.
3. Test Results
Choosing reasonable rib spacing and angles can enhance the bolting effect, which in turn ensures the stability and safety of the rock engineering. In this section, rib spacing and angles are taken as the main parameters to illustrate the variation characteristics of shear dilation and shear stress-shear displacement curves in order to study the mechanical characteristics and failure modes in regard to different rib spacing and angles.
3.1. Shear Stress-Shear Displacement Curves
The shear stress-shear displacement curves of interfaces for five rib spacings under various normal stresses are displayed in Figure 8a–e. From these figures, the curves for each of the five groups, with varying rib spacings, clearly show a typical trend of peak-shaped curves. These curves can be classified into six stages, as shown in Figure 8f.
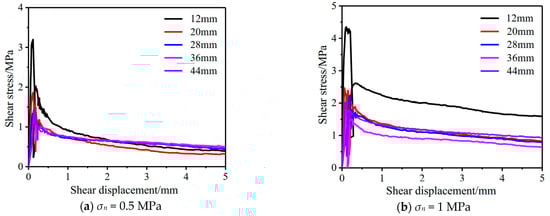
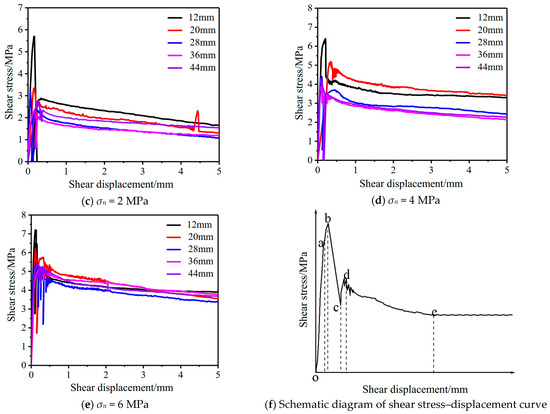
Figure 8.
Bolt-Grout interface, shear stress-displacement curves with different rib spacing (Points o, a, b, c, d and e in subfigure (f) are the initial point, the deformation critical point, the first peak point, the minimum point, the second peak point and the stable point respectively).
The first stage is the pre-peak elastic deformation stage (o–a). The shear stress increases linearly and quickly, reaching roughly 80–90% of the peak strength. This stage exhibits an approximately linear mechanical behavior, and the shear stiffness is large.
The second stage is the pre-peak nonlinear deformation stage (a–b). During this stage, the shear stiffness gradually drops and the shear stress reaches its peak. The microcracks at the interface sprout and expand rapidly, penetrating along the entire shear surface. The interface begins to produce irreversible plastic deformations. Under the continuous action of the shear force, the interfacial gypsum bumps continuously wear out, resulting in weakened interfacial engagement and reduced interfacial shear stiffness.
The third stage is the stress drop stage (b–c). The shear stress drops sharply, showing typical brittle damage characteristics, and the sharp drop in stress is sometimes accompanied by a low sound of specimen fracturing. In this stage, due to the shear stress exceeding its shear strength, resulting in crushing or shearing of the gypsum between the ribs, the interface failure will produce a slight slip behavior within a short period of time.
The fourth stage is the shear stress rebound stage (c–d). The shear stress rebound is followed by up-and-down fluctuations in the phenomenon, and the curve is jagged. This is because the original Bolt-Grout interface failure, with the shear displacement, continues to advance, and the upper and lower two specimens produce a new interface. The new boundary at the re-contact once again features interactions, so the shear stress begins to increase, coupled with the generation of new cracks. Changes in crack distribution and the lubricating effect of the debris caused the shear stress curve to fluctuate irregularly in a saw-tooth shape.
The fifth stage is the strain softening stage (d–e). This stage of the interface still has a certain bearing capacity. This capacity aids in the increase in shear displacement and gradual reduction, demonstrating the clear strain softening phenomenon.
The sixth stage is the residual friction stage (e-). The curve tends to flatten out, and the shear stress tends to the residual strength.
Figure 9a–e shows the shear stress-displacement curves of interfaces under different normal stresses with five different rib angles. Two types of curves were observed. The first type, which is the peak-type, shows that the overall trend of the curve for the Bolt-Grout interface is relatively unaffected by the rib angle when it exceeds 15°. In this case, the rib angle has minimal bearing on the curve’s general behavior, and the curve’s overall change rule essentially remains constant under varying normal stresses, which is in line with the typical trend of the peak curve. The second type is one with no peak where, at a rib angle of 15°, the shear stress-displacement curve and the other rib angle exhibit a different shear stress-displacement curve trend with no discernible peak. The first peak-type curve has a similar trend to the shear stress-displacement curve, with different rib spacing.
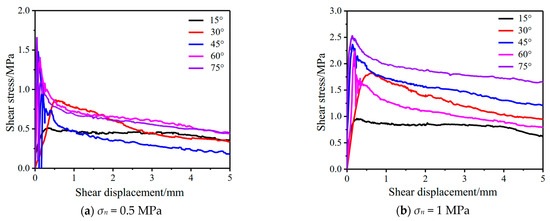
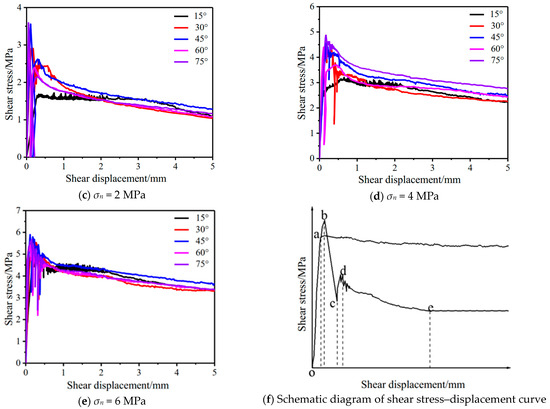
Figure 9.
Bolt-Grout interface, shear stress-displacement curves with different rib angles (Points o, a, b, c, d and e in subfigure (f) are the initial point, the deformation critical point, the first peak point, the minimum point, the second peak point and the stable point respectively).
As shown in Figure 9f, the non-peak-type curves can be analyzed in two distinct stages:
The first stage is the elastic deformation stage (o-a), which is similar to the first stage of the peak-type curve. This stage is characterized by a sharp and significant rise in a short amount of time as the shear stress grows quickly and practically linearly. The mechanical behavior is nearly elastic, and the shearing does not cause irreversible changes in the interface.
The second stage is the residual friction stage (a-). Similar to the sixth stage of the peak-type curve, the shear stress fluctuates slightly, basically unchanged, and there is no obvious shear stress drop phenomenon, the change tends to flatten out, and enter into the residual stage.
From the test results, the shear stress-shear displacement curves conform to the peak-type, except for the rib angle of 15°. The main reason for this phenomenon is that there is a rib angle of 15°, and the height of the rib is low, so there is a higher probability of interface slipping with increasing shear displacement. The grout surface does not easily produce brittle failure, so the shear stress will not fall sharply, and therefore the curve has no obvious peak shear stress.
3.2. Shear Strength Characteristics
When the failure occurs in the Bolt-Grout interface, the interface strength is the strength of the rock bolting system. Therefore, studying the properties of the interface shear strength is essential.
3.2.1. Effect of Rib Spacing on Shear Strength
Figure 10 illustrates the variation of peak strength with rib spacing under different normal stresses. The change rule of peak strength is the same, i.e, the increase in rib spacing shows the change trend of decreasing and then increasing. Meanwhile, the smaller the rib spacing, the more obvious the change. For example, when the normal stress was 0.5 MPa, the shear strength decreased by 1.33 MPa and 0.15 MPa when the rib spacing was increased from 12 mm to 20 mm and 28 mm to 36 mm, respectively. The figure also shows that, under all typical stress conditions, the shear strength at 44 mm rib spacing surpasses 36 mm, which is due to the change in the failure mode.
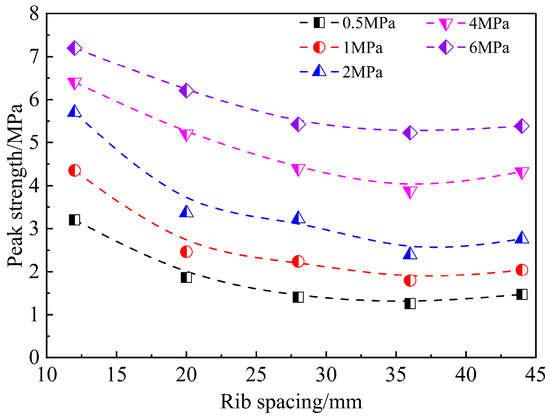
Figure 10.
Effect of rib spacing on peak shear strength.
Figure 11 illustrates the variation of residual strength with rib spacing under different normal stresses. As the rib spacing rises, the residual shear strength generally exhibits a trend of dropping and then increasing. It is significant to observe that, at 0.5 MPa, the residual shear strengths for all five rib spacings are comparable. The rib spacing has a minimal effect on the residual shear strength. This is because the residual shear stress is mainly generated by the friction of the interface. The interface friction is weaker at 0.5 MPa, and changing the rib spacing no longer affects the interface friction.
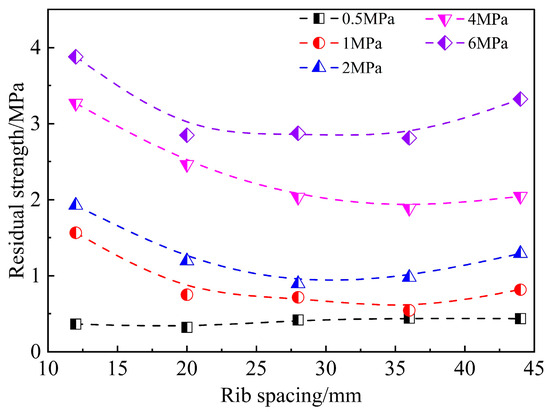
Figure 11.
Effect of rib spacing on residual shear strength.
Both peak and residual shear strength increase with increasing normal stress in a roughly linear correlation, which was exhibited by the five sets of data with different rib spacings. This is because the meshing effect and frictional resistance at the Bolt-Grout interface rise with an increase in normal stress, which in turn causes an increase in shear stress.
3.2.2. Effect of Rib Angle on Shear Strength
Figure 12 illustrates the variation of peak strength with rib angles under different normal stresses. The pattern of variation is the same for all five normal stress conditions, as the peak strength exhibits a trend of initially increasing, followed by a decrease, and then subsequently increases with the increase in rib angle. There is a continuous increase in the peak strength from 15° to 45° of the rib angle. However, the growth rate begins to decrease, indicating a diminishing return on increasing the rib angle. Subsequently, when the rib angle is more than 45° to 60°, the peak shear strength begins to decrease. Finally, the peak shear strength begins to recover again as the rib angle continues to increase. The reason is that shear-slip failure mainly occurs when the rib angle is small, with the increase in the rib angle, the protruding part of the gypsum specimen starts to shear-break failure, and the peak shear strength increases; meanwhile, the increasing angle will make the protruding part of the gypsum specimen more easily sheared, and the peak strength decreases; the promotion of shear is no longer evident when the angle reaches a particular magnitude, but the interfacial meshing effect is more significant, and the peak strength goes back up. There exists a relative optimum value for the rib angle, and the greatest value of peak strength can be considered to occur when the rib angle is 45°.
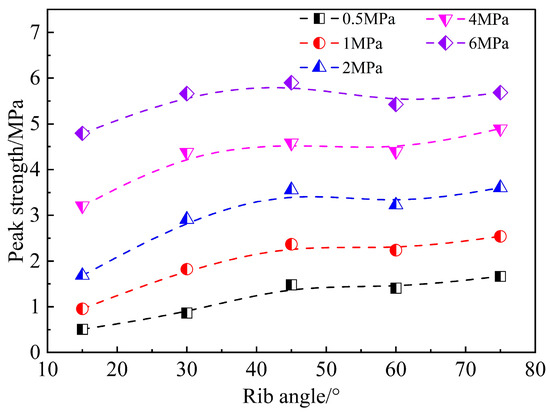
Figure 12.
Effect of rib angle on peak shear strength.
Figure 13 illustrates the variation of residual strength with rib angles under different normal stresses. Compared with the peak strength, the residual strength is less affected by the rib angle, but the rule of change is similar, with the increase in the rib angle, the residual shear strength exhibits a trend of initially increasing, followed by a decrease, and then subsequent increase, when the rib angle of 45°, it can be considered that the residual shear stress appeared to be the maximum value. The reason for this phenomenon is that shear-slip failure occurs when the rib angle is small, and as the rib angle increases, shear-break failure begins to occur; shear-slip produces smaller debris, which is manifested as smaller residual shear stress and shear break-break failure make the bulge failure more serious, and the interface is rougher, with a larger residual shear stress. The effects of normal stresses on peak and residual shear strength for different rib angle conditions are the same as for different rib spacing conditions.
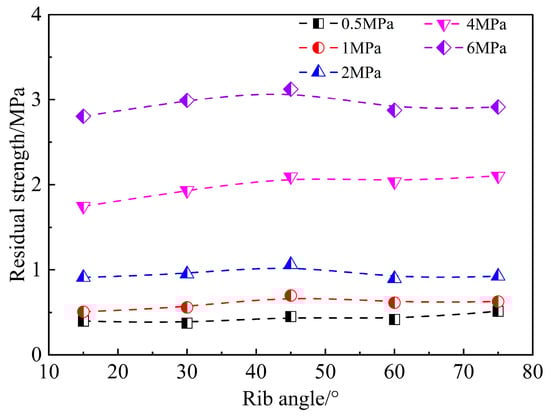
Figure 13.
Effect of rib angle on residual shear strength.
3.3. Shear Dilation Behavior
Since the normal displacement curves exhibited a similar trend for specimen under different normal stress conditions, we take the normal stress of 2 MPa as an example to illustrate the shear dilation behavior of Bolt-Grout interface. Figure 14 and Figure 15 illustrate the normal displacement-shear displacement curves for different rib spacings and rib angles under a normal stress of 2 MPa. When the rib spacing is small, such as 12 mm and 20 mm, the normal displacement decreases because the gap at the Bolt-Grout interface is compacted in the early phases; afterward, the normal displacement progressively rises due to the shear dilation; finally, due to the existence of the “climbing effect”, the normal displacement exhibits a cyclical pattern of initial decrease followed by a subsequent increase. For larger rib spacing, such as 28 mm, 36 mm and 44 mm conditions, the trend of normal displacement is approximately the same, and all show a tendency to decrease and then increase before leveling off. The rib spacings have different effects on the normal displacement in the final stage of shear, which is mainly due to the increase in rib spacings, the number of ribs in the interface decreases, so that the “climbing effect” is no longer obvious, and the number of cyclic changes in normal displacement decreases.
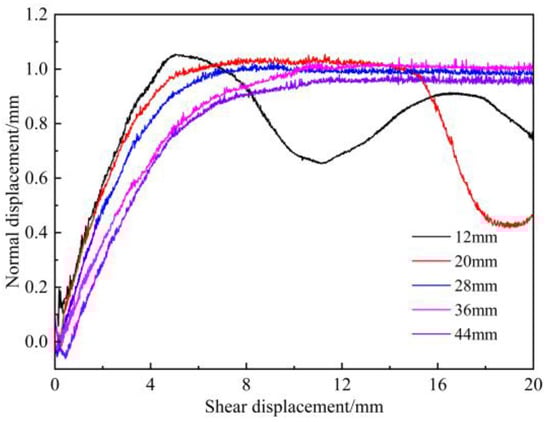
Figure 14.
Normal displacement-shear displacement curves of Bolt-Grout interface under different rib spacings (σn = 2 MPa).
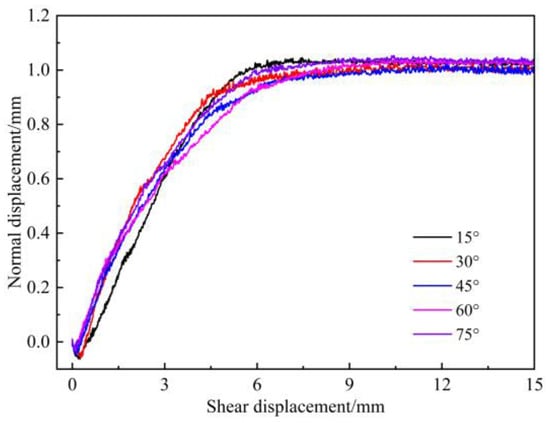
Figure 15.
Normal displacement-shear displacement curves of Bolt-Grout interface under different rib angles (σn = 2 MPa).
The normal displacement-shear displacement curves under different rib angle conditions have roughly the same morphology, and the normal displacements show a tendency to decrease and then increase and then level off, as shown in Figure 12. In the early stage of shear, the difference in normal displacement under different rib angle conditions is small, which is because the change in normal displacement at this stage is caused by the compression density and elastic deformation, and the internal cleavage and elastic modulus of each specimen are the same again. As the shear displacement increases, the discrepancy in the normal displacement among various rib angles becomes more pronounced, the normal displacement was the largest at 15° and the smallest at 30°, and with the increase in rib angle, the normal displacement showed a tendency of decreasing first and then increasing. This is because shear expansion and slippage failure mainly occur at 15°, and there is no shear fracture failure, and the normal displacement is larger, and the phenomenon of raised shear-break failure occurs at 30°, and the normal displacement is smaller.
3.4. Interface Shear Failure Characteristics
The interface shear failure modes can be mainly categorized into the following three types: shear-slip failure, shear-break failure and combined failure. From the test results, the Bolt-Grout interface exhibits different failure modes with different rib spacing, normal stress and rib angle [34]. The study of interfacial shear failure characteristics is crucial for analyzing the shear failure mechanism of the Bolt-Grout interface, and then analyzing the shear mechanical properties of the rock bolting system [40].
3.4.1. Influence of Rib Spacing on Interface Failure Modes
For ease of exploring the impact of varying rib spacings, we conducted specific analysis on the failure morphology of the interface under σn = 2 MPa for five different rib spacings, as illustrated in Figure 16. The angle θ indicates the inclination angle of the crack created along the upper right side of the gypsum specimen, and i indicates the angle between the shear break direction and the horizontal direction in the figure.
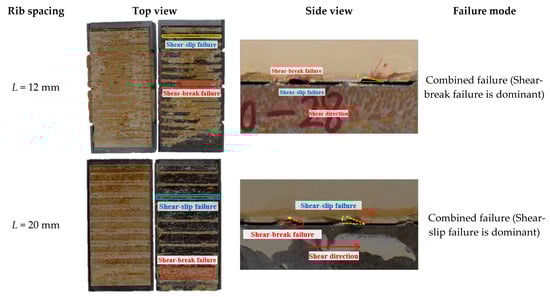
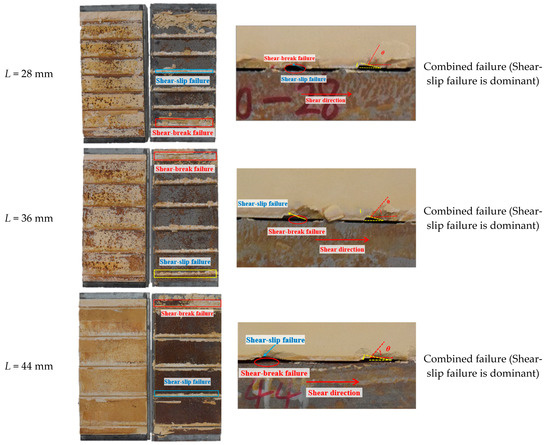
Figure 16.
The failure patterns of interfaces under different rib spacing.
When L is 12 mm, i is about 17° (which finally produces a nearly horizontal macroscopic rupture band), and θ is about 25°. Most of the gaps between the ribs have been filled with worn or sheared gypsum debris, in which the narrower and lighter color debris band near the root of the ribs is debris generated by the shear-slip failure, while the wider and yellowish debris band between the two ribs is debris generated by the shear-break failure. There is a certain gap between the upper and lower specimens, and the gypsum near the ribs of the upper specimen is not all sheared, which indicates that shear-slip failure was generated. Therefore, the interface failure mode is a combined failure, but mainly shear-break failure.
When L is 20 mm, according to the side view, the upper and lower specimens are completely separated and partially sheared at the edge of the gypsum between the two ribs, where i is about 21°, and θ is about 43°. There is a certain gap between the upper and lower specimens, and the gypsum near the rib of the upper specimen is not completely sheared, which indicates that shear-break failure is generated, so the interface failure mode is a combined failure. From the top view, most of the gypsum debris is located near the root of the ribs and the debris zone is narrow. No obvious large-scale shear-break failure has occurred, so shear-slip failure accounts for a larger proportion of the combined failure.
When the rib spacing was 28 mm, 36 mm and 44 mm, respectively, the interface failure morphology was similar to that of the interface failure morphology when the rib spacing was 20 mm, the failure modes were all combined failures, and the shear-slip failures accounted for a larger proportion.
3.4.2. Influence of Rib Angle on Interface Failure Modes
For ease of exploring the impact of varying rib angles on interface failure modes, we conducted a specific analysis on the failure morphology of the interface under normal stress σn = 2 MPa for five different rib spacings, as illustrated in Figure 17.
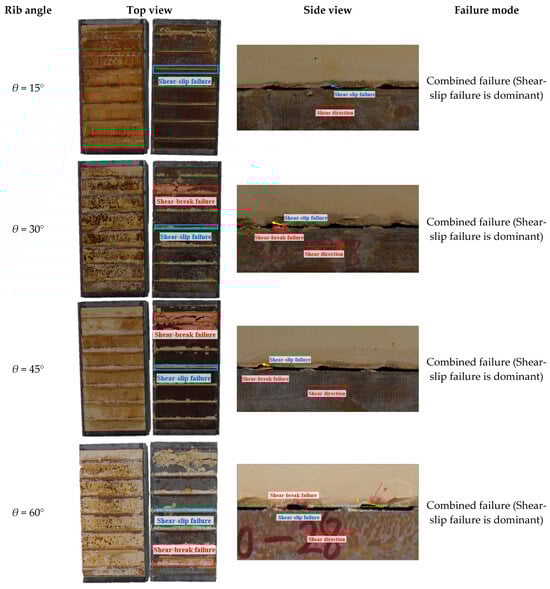
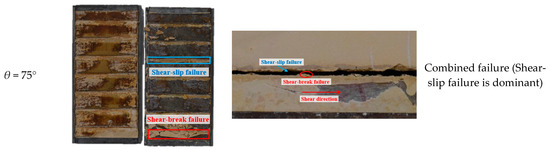
Figure 17.
The failure patterns of interface under different rib angle.
When the rib surface angle θ = 15°, according to the top view, most of the gypsum debris is located near the root of the ribs. The failure is mostly abrasion failure occurring in climbing, and there is no obvious shear-break or compression-shear crushing, so the interface failure mode is mainly shear-slip failure. Because the rib angle is small at this time, the gypsum protrusion and the inclined surface of the rib are gentle, indicating that the interface roughness and undulation are small. With the increase in shear displacement, the gypsum protrusion is prone to climbing along the inclined surface of the rib, and in the process of climbing, the gypsum contact interface with the rib due to the restriction of the normal stresses. Part of the gypsum debris is left in the vicinity of the rib, which generates the shear-slip failure.
When the rib angle θ = 30°, according to the top view, most of the gypsum debris is located near the root of the ribs, and there are large pieces of debris and wider debris bands. The proportion of shear-break failure has increased, but the failure mode is still dominated by the shear-slip failure. This is because, as the rib angle increases, the gypsum bulge and the inclined surface of the ribs become steeper, indicating that the interface roughness and undulation increase, and with the increase in shear displacement, the difficulty of climbing increases. The climbing phenomenon is rarer in occurrence, and shearing occurs at the edge part of the bulge, making the percentage of shear-failure increase.
When the rib angle is 45°, 60° and 75°, the interface failure morphology is similar to that of the interface failure morphology when the rib angle is 30°. Also, the failure modes are all combined failure, and the shear-slip damages are dominant; however, due to the difference of the rib angle, the proportion of shear-break failure has changed.
3.4.3. Influence of Normal Stress on Interface Failure Modes
To study the impact of normal stress on the failure mode, the interface failure morphology pattern of five normal stresses under the conditions of 28 mm rib spacing and 60° rib angle were selected for analysis, as shown in Figure 18. When the normal stress is low, such as 0.5 MPa, the surface of the gypsum specimen produces many nearly parallel tilted failure surfaces, placing the gypsum specimen upward over the raised portion of the steel plate. There is only a small amount of gypsum debris at the ribs of the bolt specimen, and the debris zone is also narrower. This indicates that shear-slip failures are predominant, with a small number of shear-break failures as well. When the normal stress is 1 MPa and 2 MPa, the shear failure mode is a combined failure. The analysis shows that the share of shear-slip failure decreases and the share of shear-break failure increases with raise normal stress.
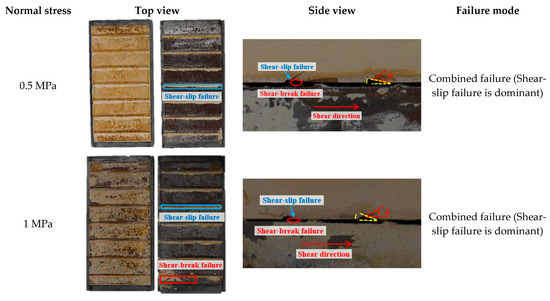
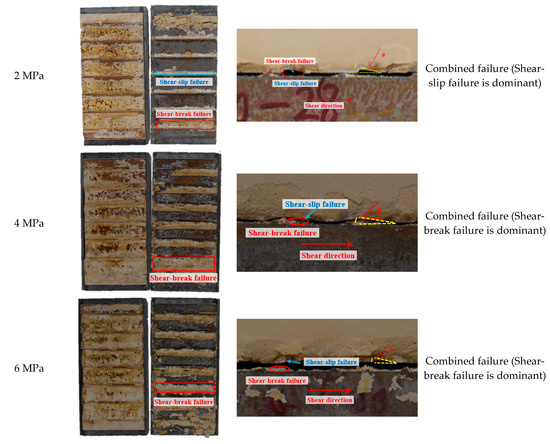
Figure 18.
The failure patterns of interface under different normal stresses.
4. Discussion
As reported in this study, different profile parameters of bolts exhibited different shear performances in the direct shear tests. The shear strength of the interface increased first, and then decreased with an increase in rib spacing. This result is consistent with the observation of Aziz et al. [41], who performed a push-out test and found the loading capacity of the bolt increased as rib spacing increased from 12.5 mm to 37.5 mm, before then decreasing with a continued increase in rib spacing. The decrease in shear strength is mainly attributed to the bolt surface roughness decreases with increasing rib spacing. The continued increase in shear strength with increasing rib spacing is due to the change of failure modes. When the rib spacing increases to a certain extent, shear-break failure becomes the dominant failure mode. The shear strength increases significantly with increasing rib face angles and does not change significantly when the rib face angle exceeds 45°. When the rib angle is small, the lower shear strength is due to the fact that the shear slip behavior was triggered more easily. When the rib angle exceeds 45°, the proportion of shear-break failure remains almost constant, resulting in insignificant changes in shear strength.
5. Conclusions
This study examines the impact of rib spacing, rib angle, and normal stress on the shear behavior and failure mode of the Bolt-Grout interface. The following conclusions can be drawn:
- (1)
- The shear strength of the Bolt-Grout interface demonstrated a pattern of decreasing and then increasing with the rise of rib spacing. With smaller rib spacings, the effect of rib spacing on peak shear strength was more apparent. Furthermore, the changes in shear strength with varying rib angles followed a similar pattern, displaying an initial increase, followed by a decrease, and then another increase. It is possible to speculate that, at a 45° rib angle, the peak and residual shear strength reached their maximum values.
- (2)
- The shear process with different rib spacing and angles was accompanied by a normal deformation phenomenon. When the rib spacing was small, the normal displacement decreased in the test’s early phases due to the compression of the internal gap of the specimen. Thereafter, the shear-slip phenomenon occurred, and the normal displacement gradually increased. Finally, due to the existence of the “climbing effect”, the normal displacement produced a cyclic change of decreasing and then increasing. When the rib spacing was large, the normal displacement changes were roughly the same and showed an initial decrease, followed by an increase, and then tended to flatten. The shear dilation curves under various rib angle conditions shared a similar morphology, with normal displacements exhibiting a pattern of decrease, increase, and then stabilization.
- (3)
- The failure modes of the interface can be categorized as shear-slip failure, shear-fracture failure, and composite failure. Although the interface failure modes universally manifest as combined failures, the proportion of shear-slip failure and shear-break failure undergoes variations due to the influences of rib spacing, rib angle, and normal stress.
Author Contributions
Conceptualization, Z.Z. and J.L.; methodology, Y.J. and H.L.; investigation, Z.Z. and Y.W.; resources, H.L. and Y.J.; data curation, S.Z. and Q.S.; writing—original draft preparation, Z.Z., J.L. and Y.W.; writing—review and editing, H.L. and C.W.; visualization, S.Z. and Q.S.; funding acquisition, H.L. and Y.J. All authors have read and agreed to the published version of the manuscript.
Funding
This research was funded by the National Natural Science Foundation of China (No. 52104093) and the Shandong Provincial Natural Science Foundation (No. YDZX2022141).
Institutional Review Board Statement
Not applicable.
Informed Consent Statement
Not applicable.
Data Availability Statement
Data associated with this research are available and can be obtained by contacting the corresponding author upon reasonable request.
Conflicts of Interest
Author Zhaoyun Zhang was employed by the company Dongtan Coal Mine, Yankuang Energy Group Company Limited. The remaining authors declare that the research was conducted in the absence of any commercial or financial relationships that could be construed as a potential conflict of interest.
References
- Yokota, Y.; Zhao, Z.; Nie, W.; Date, K.; Iwano, K.; Okada, Y. Experimental and Numerical Study on the Interface Behaviour between the Rock Bolt and Bond Material. Rock Mech. Rock Eng. 2019, 52, 869–879. [Google Scholar] [CrossRef]
- Shang, J.; Yokota, Y.; Zhao, Z.; Dang, W. DEM simulation of mortar-bolt interface behaviour subjected to shearing. Constr. Build. Mater. 2018, 185, 120–137. [Google Scholar] [CrossRef]
- Ma, S.; Nemcik, J.; Aziz, N. An analytical model of fully grouted rock bolts subjected to tensile load. Constr. Build. Mater. 2013, 49, 519–526. [Google Scholar] [CrossRef]
- Salcher, M.; Bertuzzi, R. Results of pull tests of rock bolts and cable bolts in Sydney sandstone and shale. Tunn. Undergr. Space Technol. 2018, 74, 60–70. [Google Scholar] [CrossRef]
- Obara, Y.; Maeno, Y.; Kawano, R.; Ito, F.; Nakahara, F. Bond Failure of Rock Bolts and Cable Bolts in a Pull-out Test. Doboku Gakkai Ronbunshu 2002, 708, 97–106. [Google Scholar] [CrossRef] [PubMed][Green Version]
- Li, X.; Aziz, N.; Mirzaghorbanali, A.; Nemcik, J. Behavior of Fiber Glass Bolts, Rock Bolts and Cable Bolts in Shear. Rock Mech. Rock Eng. 2016, 49, 2723–2735. [Google Scholar] [CrossRef]
- Cao, C.; Ren, T.; Cook, C. Introducing aggregate into grouting material and its influence on load transfer of the rock bolting system. Int. J. Min. Sci. Technol. 2014, 24, 325–328. [Google Scholar] [CrossRef]
- Chen, Y. Experimental study and stress analysis of rock bolt anchorage performance. J. Rock Mech. Geotech. Eng. 2014, 6, 428–437. [Google Scholar] [CrossRef]
- Ferrero, A.M. The shear strength of reinforced rock joints. Int. J. Rock Mech. Min. Sci. Geomech. Abstr. 1995, 32, 595–605. [Google Scholar] [CrossRef]
- Thenevin, I.; Blanco-Martín, L.; Hadj Hassen, F.; Schleifer, J.; Lubosik, Z.; Wrana, A. Laboratory pull-out tests on fully grouted rock bolts and cable bolts: Results and lessons learned. J. Rock Mech. Geotech. Eng. 2017, 9, 843–855. [Google Scholar] [CrossRef]
- Chen, J.; Hagan, P.; Saydam, S. A new laboratory short encapsulation pull test for investigating load transfer behavior of fully grouted cable bolts. Geotech. Test. J. 2018, 41, 435–447. [Google Scholar] [CrossRef]
- Biumel, M. Performance of Grouted Bolts in Squeezing Rock. In Proceedings of the International Symposium on Rock-Soil Anchoring, Turin, Italy, 2–5 September 1996; pp. 81–86. [Google Scholar]
- Cao, C.; Ren, T.; Cook, C.; Cao, Y.J. Analytical approach in optimising selection of rebar bolts in preventing rock bolting failure. Int. J. Rock Mech. Min. Sci. 2014, 72, 16–25. [Google Scholar] [CrossRef]
- Fearon, R. The Effect of Stress Change on the Bond Strength of Fully Grouted Cable Bolts; University of Toronto (Canada) ProQuest Dissertations Publishing: Toronto, ON, Canada, 1992. [Google Scholar]
- Zhang, C.Q.; Cui, G.J.; Chen, X.R.; Zhou, H.; Deng, L. Effects of bolt profile and grout mixture on shearing behaviors of bolt-grout interface. J. Rock Mech. Geotech. Eng. 2020, 12, 242–255. [Google Scholar] [CrossRef]
- Martin, L.; Tijani, M.; Hadj Hassen, F.; Noiret, A. Assessment of the bolt-grout interface behaviour of fully grouted rockbolts from laboratory experiments under axial loads. Int. J. Rock Mech. Min. Sci. 2013, 63, 50–61. [Google Scholar] [CrossRef]
- Zhu, Z.D.; Shu, X.Y.; Li, Z.; Tian, H.M.; Tian, Y. Stress analysis of full-length grouted bolt under shear deformation of anchor interface. J. Mt. Sci. 2022, 19, 3286–3301. [Google Scholar] [CrossRef]
- Ho, D.A.; Bost, M.; Rajot, J.P. Numerical study of the bolt-grout interface for fully grouted rockbolt under different confining conditions. Int. J. Rock Mech. Min. Sci. 2019, 119, 168–179. [Google Scholar] [CrossRef]
- Zhao, T.B.; Xing, M.L.; Guo, W.Y.; Wang, C.W.; Wang, B. Anchoring effect and energy-absorbing support mechanism of large deformation bolt. J. Cent. South Univ. 2021, 28, 572–581. [Google Scholar] [CrossRef]
- Blanco-Martin, L.; Tijani, M.; Hadj Hassen, F. A new analytical solution to the mechanical behaviour of fully grouted rockbolts subjected to pull-out tests. Constr. Build. Mater. 2011, 25, 749–755. [Google Scholar] [CrossRef]
- Vlachopoulos, N.; Cruz, D.; Forbes, B. Utilizing a Novel Fiber Optic Technology to Capture the Axial Response of Fully Grouted Rock Bolts. J. Rock Mech. Geotech. Eng. 2018, 10, 222–235. [Google Scholar] [CrossRef]
- Tao, W.; Chen, C.; Jun, H.; Ren, T. Effect of bolt rib spacing on load transfer mechanism. Int. J. Min. Sci. Technol. 2017, 27, 431–434. [Google Scholar] [CrossRef]
- Kiliç, A.; Yasar, E.; Atis, C.D. Effect of bar shape on the pull-out capacity of fully-grouted rockbolts. Tunn. Undergr. Space Technol. 2003, 18, 1–6. [Google Scholar] [CrossRef]
- Hyett, A.J.; Bawden, W.; Macsporran, G.R.; Moosavi, M. A constitutive law for bond failure of fully grouted cable bolts using a Modified Hoek Cell. Int. J. Rock Mech. Min. Sci. Geomech. Abstr. 1995, 32, 11–36. [Google Scholar] [CrossRef]
- Ghadimi, M.; Shahriar, K.; Jalalifar, H. An Analytical Model to Predict Shear Stress Distribution in Fully Encapsulated Rock Bolts. Geotech. Geol. Eng. 2015, 33, 59–68. [Google Scholar] [CrossRef][Green Version]
- Kiliç, A.; Yasar, E.; Celik, A. Effect of grout properties on the pull-out load capacity of fully grouted rock bolt. Tunn. Undergr. Space Technol. 2002, 17, 355–362. [Google Scholar] [CrossRef]
- Moosavi, M.; Jafari, A.; Khosravi, A. Bond of cement grouted reinforcing bars under constant radial pressure. Cem. Concr. Compos. 2005, 27, 103–109. [Google Scholar] [CrossRef]
- Hanson, N. Influence of surface roughness of prestressing strand on bond performance. PCI J. 1969, 14, 32–45. [Google Scholar] [CrossRef]
- Oreste, P.; Spagnoli, G. Two-dimensional numerical analysis on the rock/bolt interaction considering shear and normal relative displacements. Tunn. Undergr. Space Technol. 2024, 143, 105492. [Google Scholar] [CrossRef]
- Hagan, P.; Chen, J.; Saydam, S. The load transfer mechanism of fully grouted cable bolts under laboratory test. In Proceedings of the 14th Underground Coal Operators’ Conference, Wollongong, Australia, 12–14 February 2014. [Google Scholar]
- Li, C.; Kristjansson, G.; Høien, A. Critical embedment length and bond strength of fully encapsulated rebar rockbolts. Tunn. Undergr. Space Technol. 2016, 59, 16–23. [Google Scholar] [CrossRef]
- Wang, C.; Jiang, Y.; Wang, G.; Luan, H.; Zhang, Y.; Zhang, S. Experimental investigation on the shear behavior of the bolt-grout interface under CNL and CNS conditions considering realistic bolt profiles. Geomech. Geophys. Geo-Energy Geo-Resour. 2022, 8, 111. [Google Scholar] [CrossRef]
- Yokota, Y.; Zhao, Z.; Shang, J.; Nie, W.; Date, K.; Iwano, K.; Okada, Y. Effect of bolt configuration on the interface behaviour between a rock bolt and bond material: A comprehensive DDA investigation. Comput. Geotech. 2019, 105, 116–128. [Google Scholar] [CrossRef]
- Aziz, N.; Nemcik, J.; Cao, C.; Jalalifar, H. Bolt profile configuration and load transfer capacity optimisation. In Proceedings of the 28th International Conference on Ground Control in Mining, ICGCM, Morgantown, WV, USA, 28–30 July 2009; pp. 48–52. [Google Scholar]
- Zhang, C.; Cui, G.; Zhou, H.; Liu, L.; Liu, Z.; Lu, J.; Cheng, G. Experimental study on shear and deformation characteristics of the rod-grout interface. Yanshilixue Yu Gongcheng Xuebao/Chin. J. Rock Mech. Eng. 2018, 37, 820–828. [Google Scholar]
- Zhang, C.; Cui, G.; Deng, L.; Zhou, H.; Lu, J.; Dai, F. Laboratory investigation on shear behaviors of bolt-grout interface subjected to constant normal stiffness. Rock Mech. Rock Eng. 2019, 53, 1334–1347. [Google Scholar] [CrossRef]
- Jiang, Y.; Li, X.; Wang, C.; Luan, H.; Zhang, S.; Wang, G.; Wang, P. Influence of Normal Stiffness and Shear Rate on the Shear Behaviors and Acoustic Emissions Characteristics of Artificial Rock Joints. Appl. Sci. 2023, 13, 1189. [Google Scholar] [CrossRef]
- Jiang, Y.; Xiao, J.; Tanabashi, Y.; Mizokami, T. Development of an automated servo-controlled shear apparatus applying a constant normal stiffness condition. Int. J. Rock Mech. Min. Sci. 2004, 41, 275–286. [Google Scholar] [CrossRef]
- Aziz, N. A New Technique to Determine the Load Transfer Capacity of Resin Anchored Bolts. In Proceedings of the Coal Operators’ Conference, Wollongong, Australia, 6–8 February 2002; pp. 176–184. [Google Scholar]
- Zhang, W.; Liu, Q.S. Analysis of deformation characteristics of prestressed anchor bolt based on shear test. Yantu Lixue/Rock Soil Mech. 2014, 35, 2231–2240. [Google Scholar]
- Aziz, N.; Jalalifar, H.; Remennikov, A.; Sinclair, S. Optimisation of the bolt profile configuration for load transfer enhancement. In Proceedings of the Coal Operators’ Conference, Wollongong, Australia, 14–15 February 2008; pp. 125–131. [Google Scholar]
Disclaimer/Publisher’s Note: The statements, opinions and data contained in all publications are solely those of the individual author(s) and contributor(s) and not of MDPI and/or the editor(s). MDPI and/or the editor(s) disclaim responsibility for any injury to people or property resulting from any ideas, methods, instructions or products referred to in the content. |
© 2024 by the authors. Licensee MDPI, Basel, Switzerland. This article is an open access article distributed under the terms and conditions of the Creative Commons Attribution (CC BY) license (https://creativecommons.org/licenses/by/4.0/).