Article

Testing of Indoor Obstacle-Detection Prototypes Designed for Visually Impaired Persons

by
Radu Păpară
*,
Loredana Grec
,
Ioana-Adriana Potarniche
and
Ramona Gălătuș Voichița
*
Basis of Electronics Department, Faculty of Electronics, Telecommunication and Information Technology, Technical University of Cluj-Napoca, 400114 Cluj-Napoca, Romania
*
Authors to whom correspondence should be addressed.
Appl. Sci. 2024, 14(5), 1767; https://doi.org/10.3390/app14051767
Submission received: 22 December 2023 / Revised: 21 January 2024 / Accepted: 17 February 2024 / Published: 21 February 2024

Abstract

:
Outdoor solutions aiding the navigation of visually impaired individuals can seamlessly transition to indoor environments. Take, for instance, the adaptation of special lanes and configurations on the floor. However, these existing solutions fall short when it comes to addressing obstacles above ground level, such as open windows, as highlighted in a previous article on the use of ultrasonic glove for visually impaired users. In response, the present proposal is a user-friendly, cost-effective solution that is capable of detecting elevated obstacles. Importantly, this solution aligns with a user’s language preferences, eliminating the need for learning new languages or possessing IT skills. Users simply specify their desired language for the prototype to communicate in, ensuring a personalized experience. The system alerts users to the presence of obstacles through varying levels of warning, calculated based on the distance between the obstacle and the user’s current position. This approach not only enhances safety but also prioritizes accessibility and ease of use.

1. Introduction

Based on the analysis performed by World Health Organization (WHO) [1], approximately 2.2 billion people globally experience varying degrees of sight loss; while the majority of individuals with visual impairments are aged 50 and above, sight loss can affect individuals of any age. The primary culprits behind sight loss are uncorrected refractive errors and cataracts.
Refractive errors occur when the eye struggles to focus images clearly, resulting in blurred vision. If not identified and treated promptly, this condition can lead to vision loss. Cataracts, characterized by a cloudy area in the eye’s lens, commonly accompany the aging process. WHO reports that more than half of Americans aged 80 or above either have cataracts or have undergone surgery to address the condition. Although cataracts can be treated through eye surgery, the unfortunate reality is that the underlying causes, such as aging and inherited genetic issues, currently lack a cure.
According to the European Blind Union (EBU) [2], over 30 million people in Europe live with various eye problems. On average, 1 out of 30 Europeans experiences sight loss, with 3 out of every 30 senior citizens over the age of 65 facing such challenges. The EBU attributes these statistics to the same prevalent conditions—uncorrected refractive errors and cataracts. Additionally, they note that women face a higher risk of visual impairment compared to men.
Visually impaired individuals commonly face challenges navigating indoor environments, contending with obstacles like walls, doors, windows, tables, chairs, and stairs. The difficulty intensifies with obstacles not linked to the floor, making them undetectable with a walking stick. Notably, open windows, wall-mounted cabinets, and occasionally cables or pipes fall into this category. The prototypes presented were specifically tested to address these challenges posed by such non-floor-connected obstacles.
The current solutions for indoor navigation [3,4,5,6,7,8] are described in Table 1.
The current solutions for indoor navigation include prototypes that are considered add ons which enhance the awareness of the user regarding the surrounding area. The main function of the developed prototype [11,12] is to detect obstacles that are not connected to the floor like open windows, cabinets, etc. The main advantage of the Pulse Code Modulation (PCM) and WAVE prototypes is that the user is not required to have IT expertise; the prototypes are user-friendly, reliable, and cost-effective and the language for the messages can be adjusted according to user need. The prototypes are user-friendly because the user can select the language and the tone for the alert messages that they will hear. They can even record their own voice and it can be transformed and used. This fact means that the messages are very clear. Furthermore, the weight of the prototype is less than 200 g, with the head or chest part containing only the sensor and the audio module. The reliability of the device is determined by the fact that the parts are protected by plastic cases and the connections are welded and secured with connectors.
The hardware expenses for constructing the prototype amount to less than EUR 20–25, with the micro-controller constituting the priciest component at around EUR 9 per unit, in the context of a small-batch order. It is worth noting that, for larger quantities, the overall hardware cost is likely to decrease further; the prototypes are slightly more expensive than conventional walking sticks, which can be acquired for EUR 10–15. Their cost-effectiveness thus becomes evident when compared to alternatives like Orcam glasses (priced at approximately EUR 6000 per pair) or mobile applications that necessitate a smartphone and a long-term subscription.

2. Materials and Methods

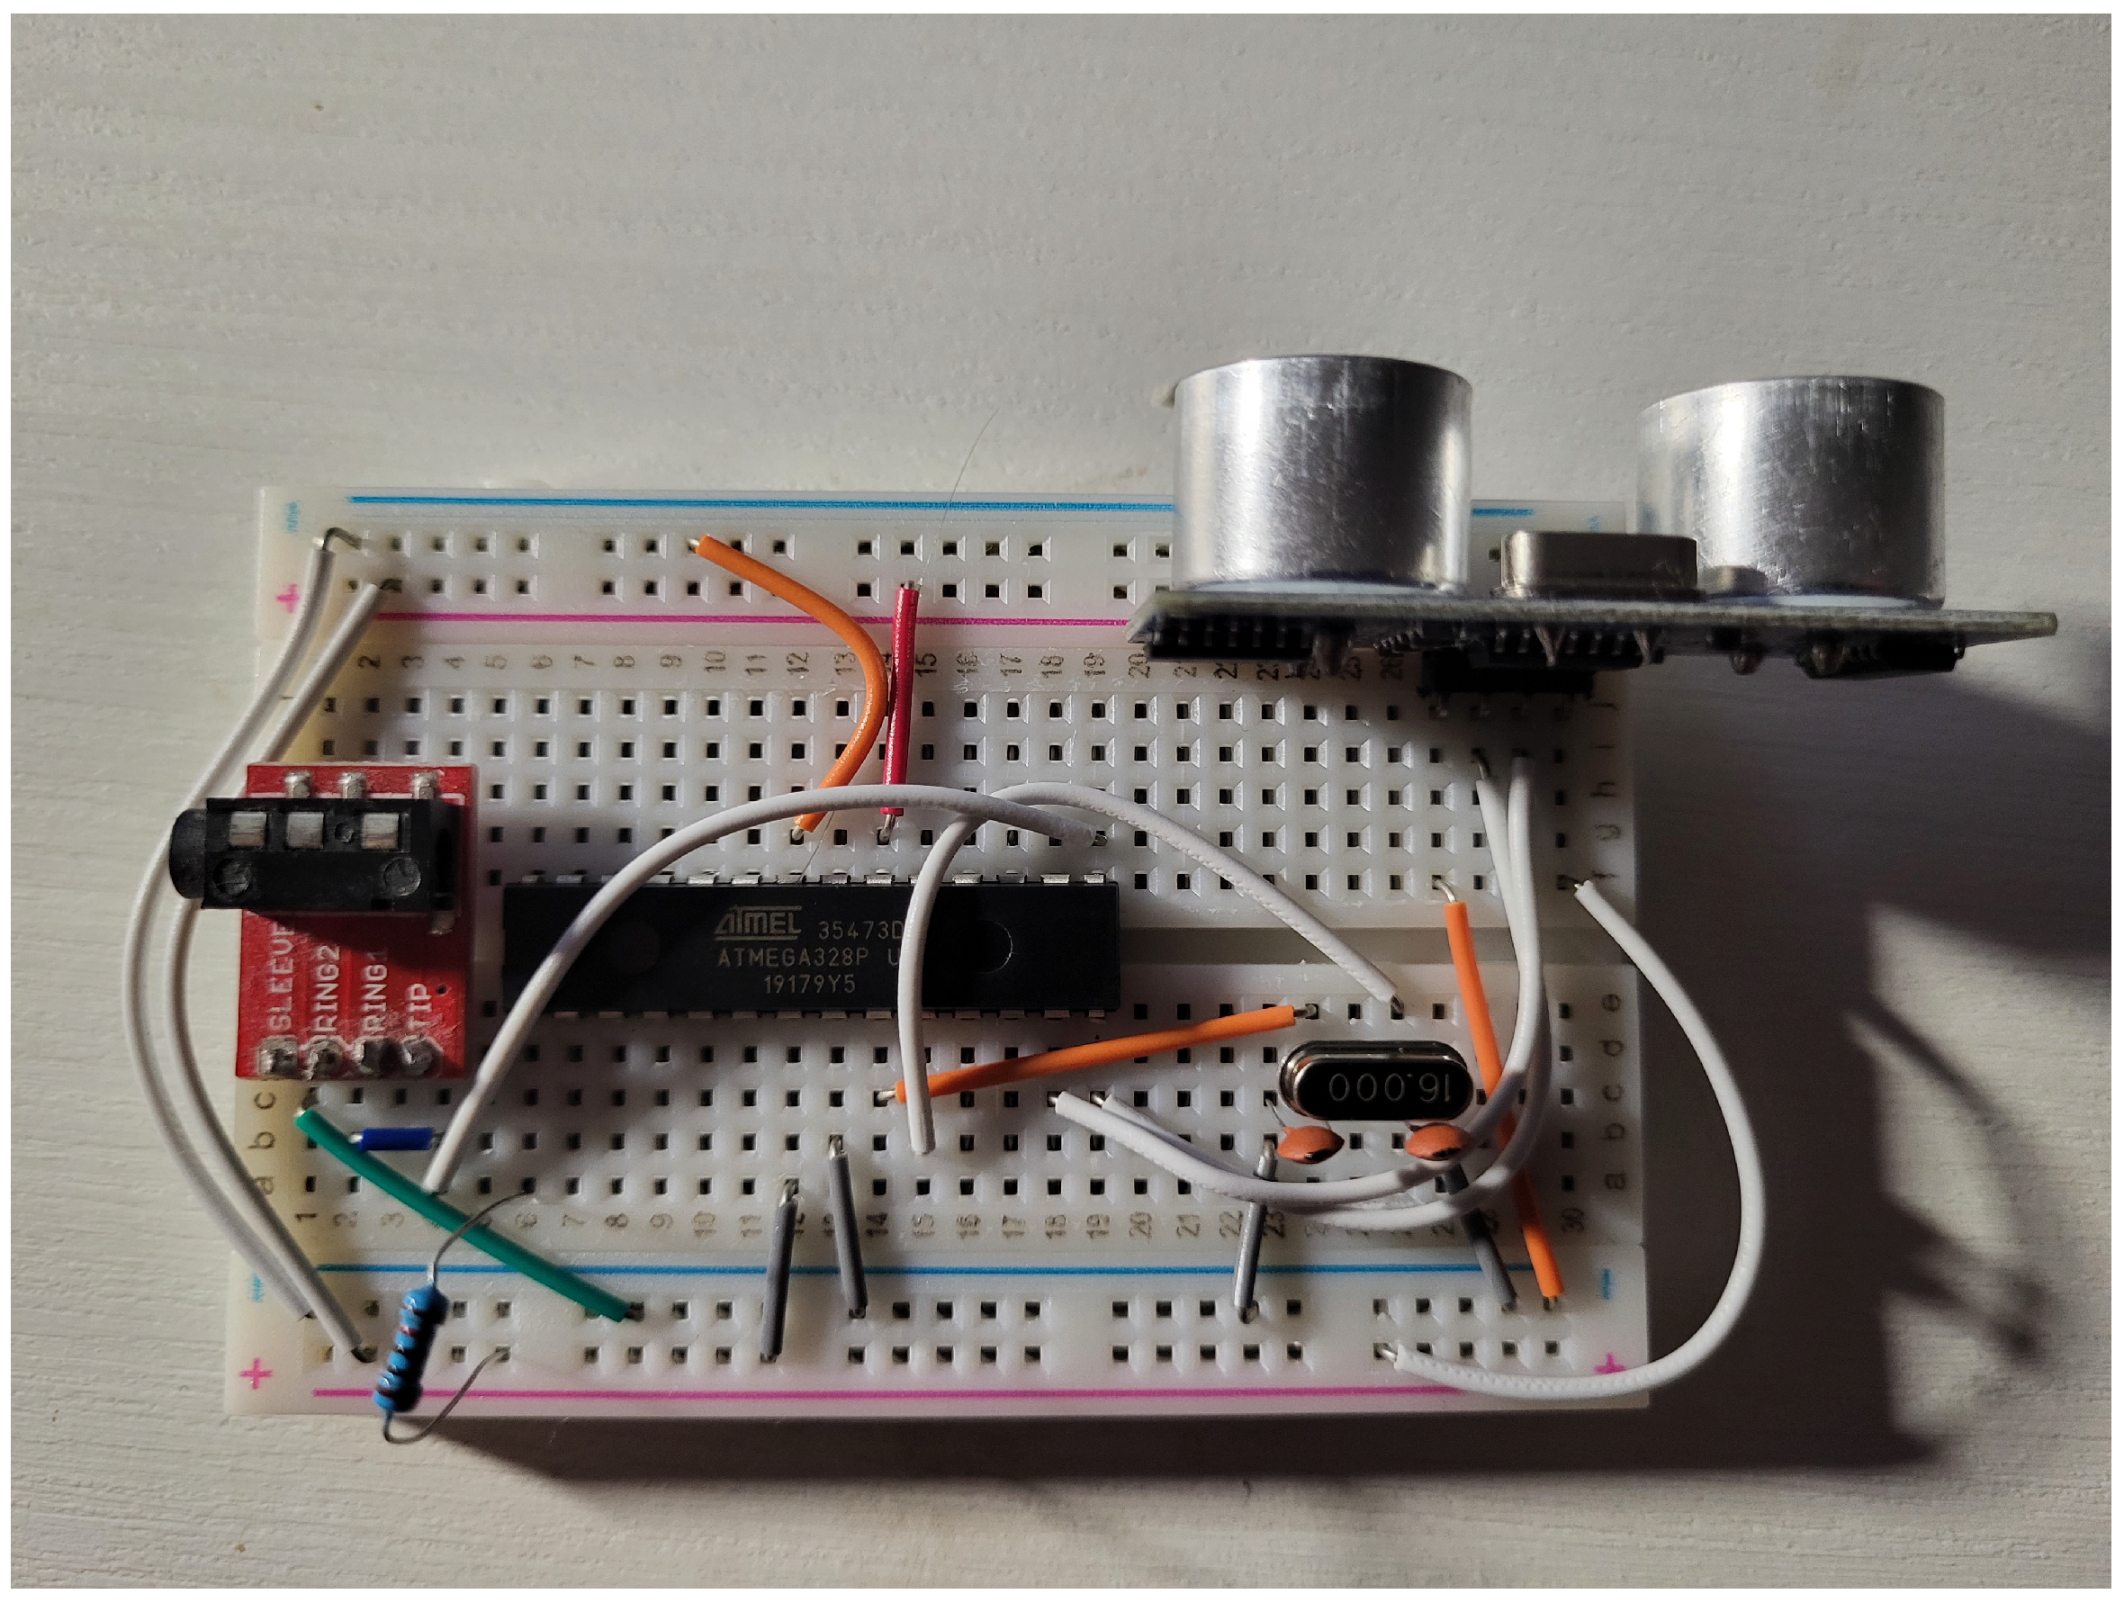
2.1. Prototypes Modules Material and Software

The PCM and WAVE prototypes [2] are reactive with the following modules: the functionality module and the user interface module.

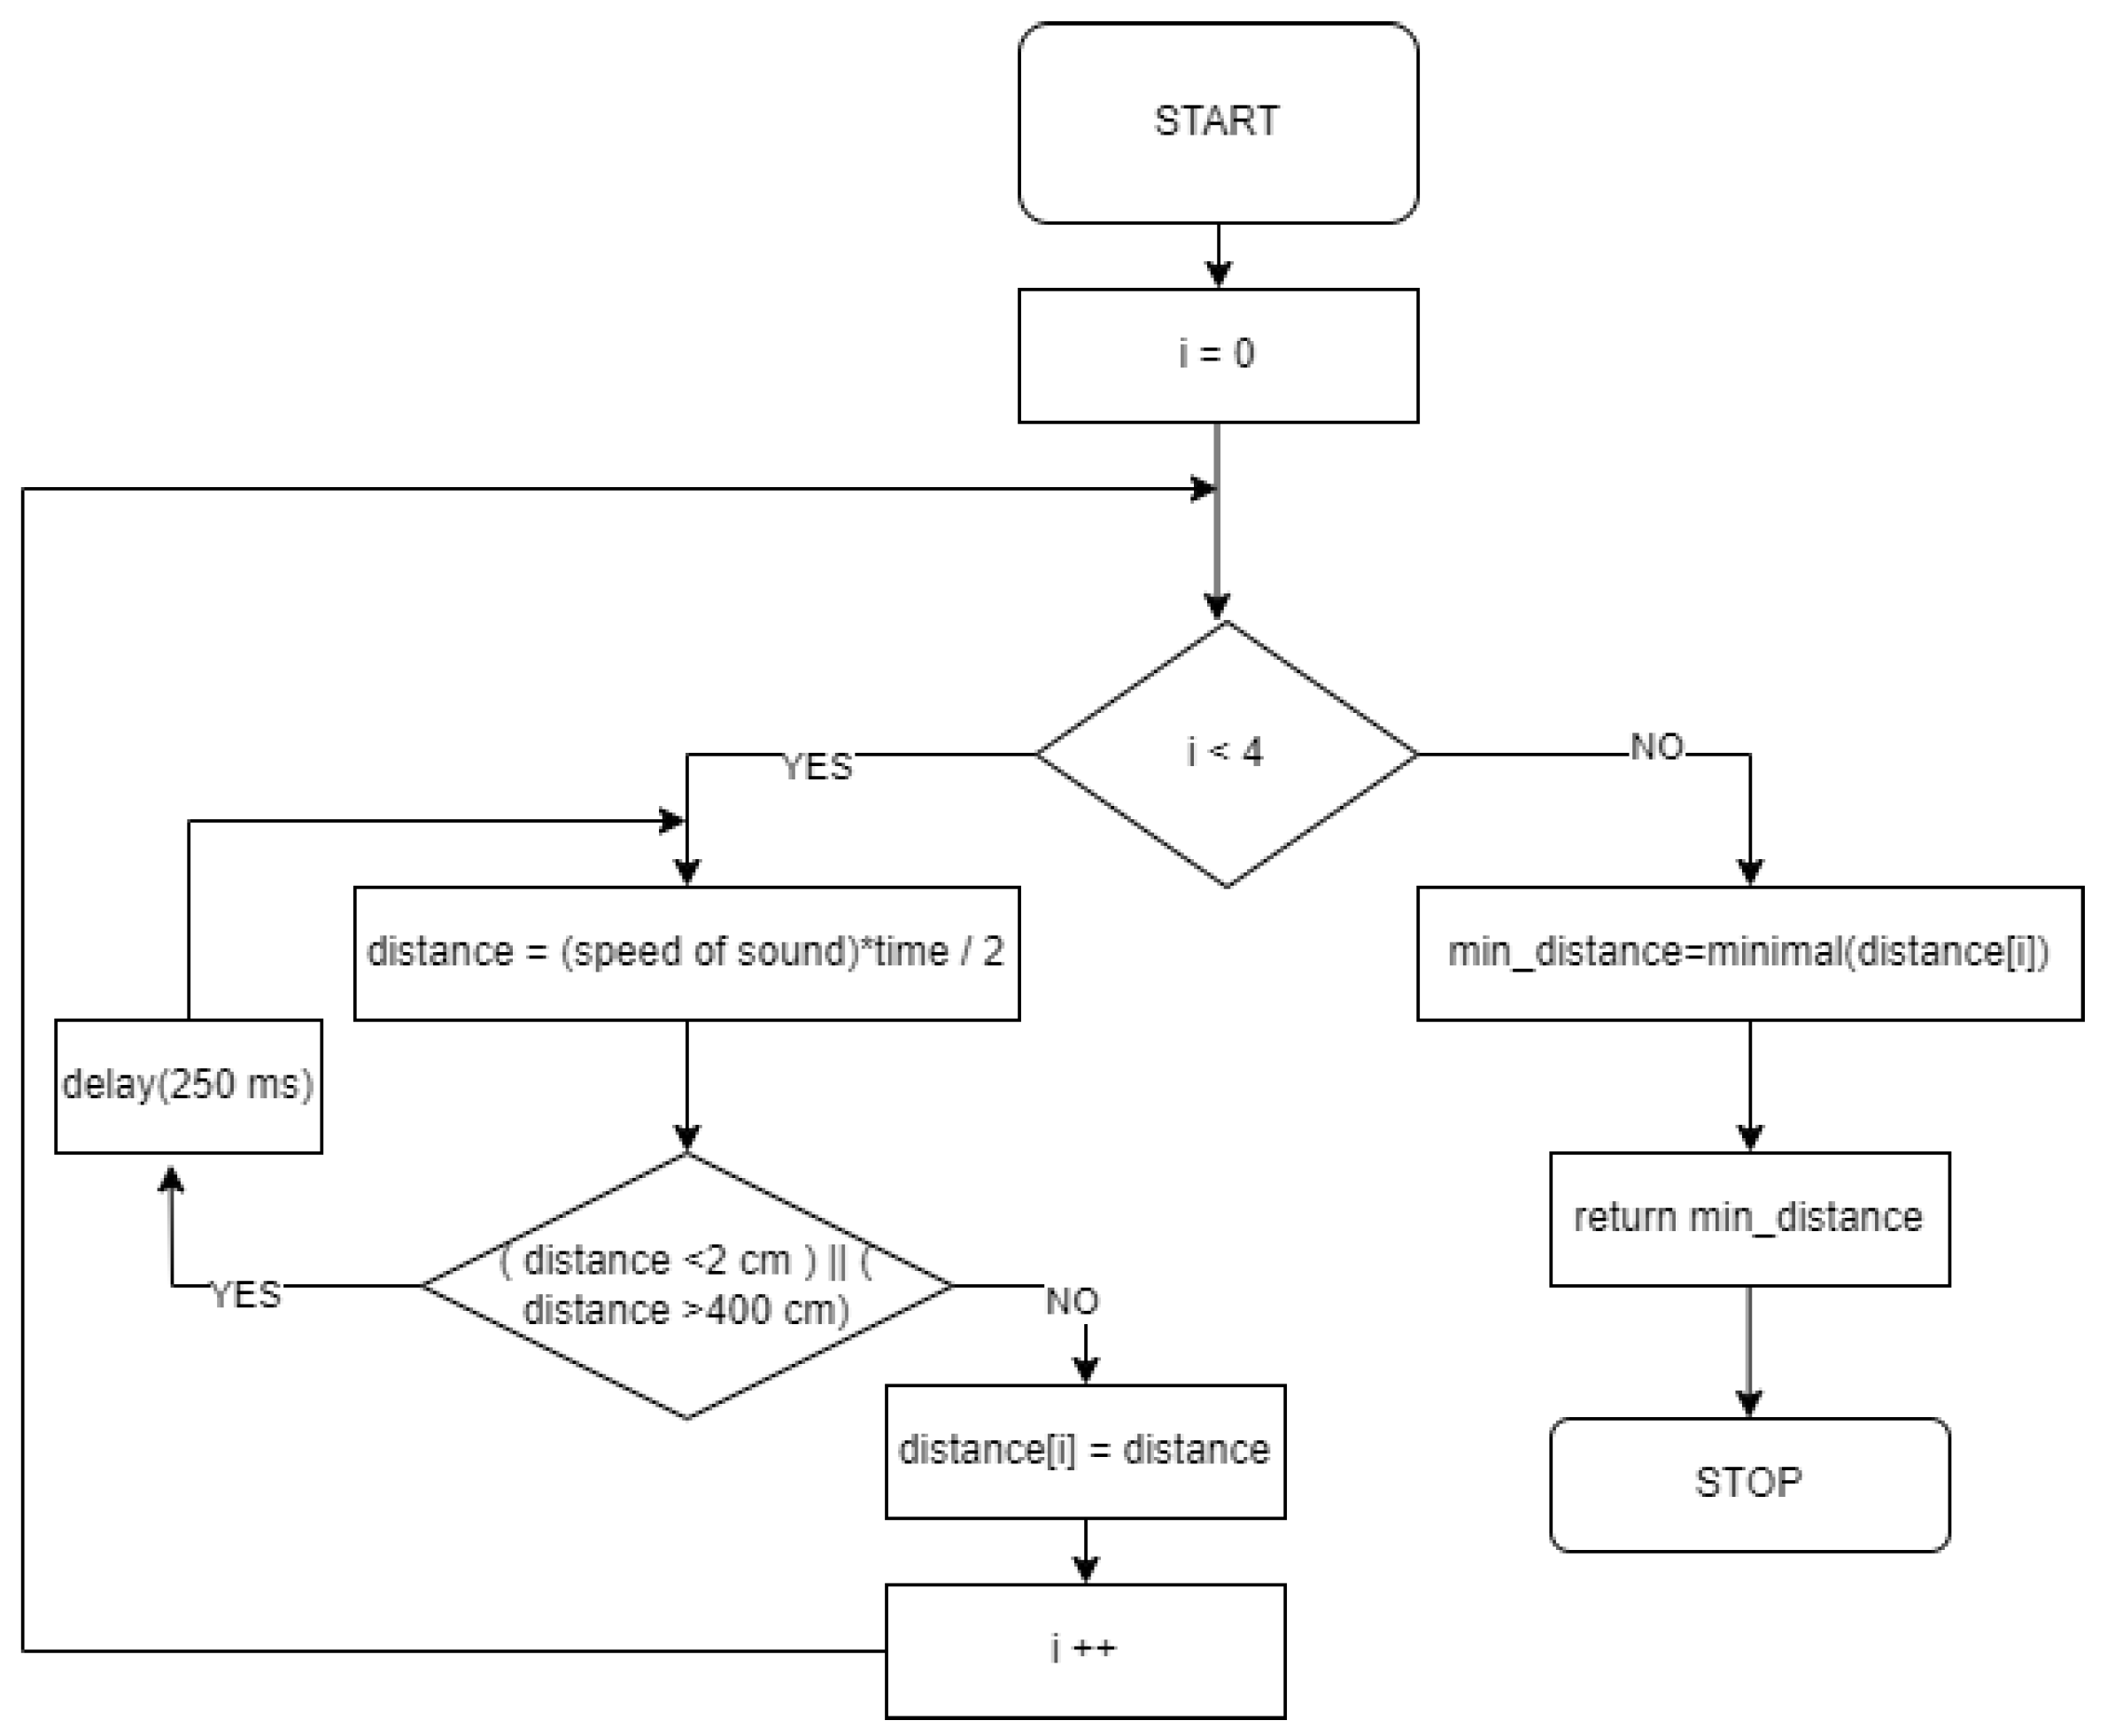
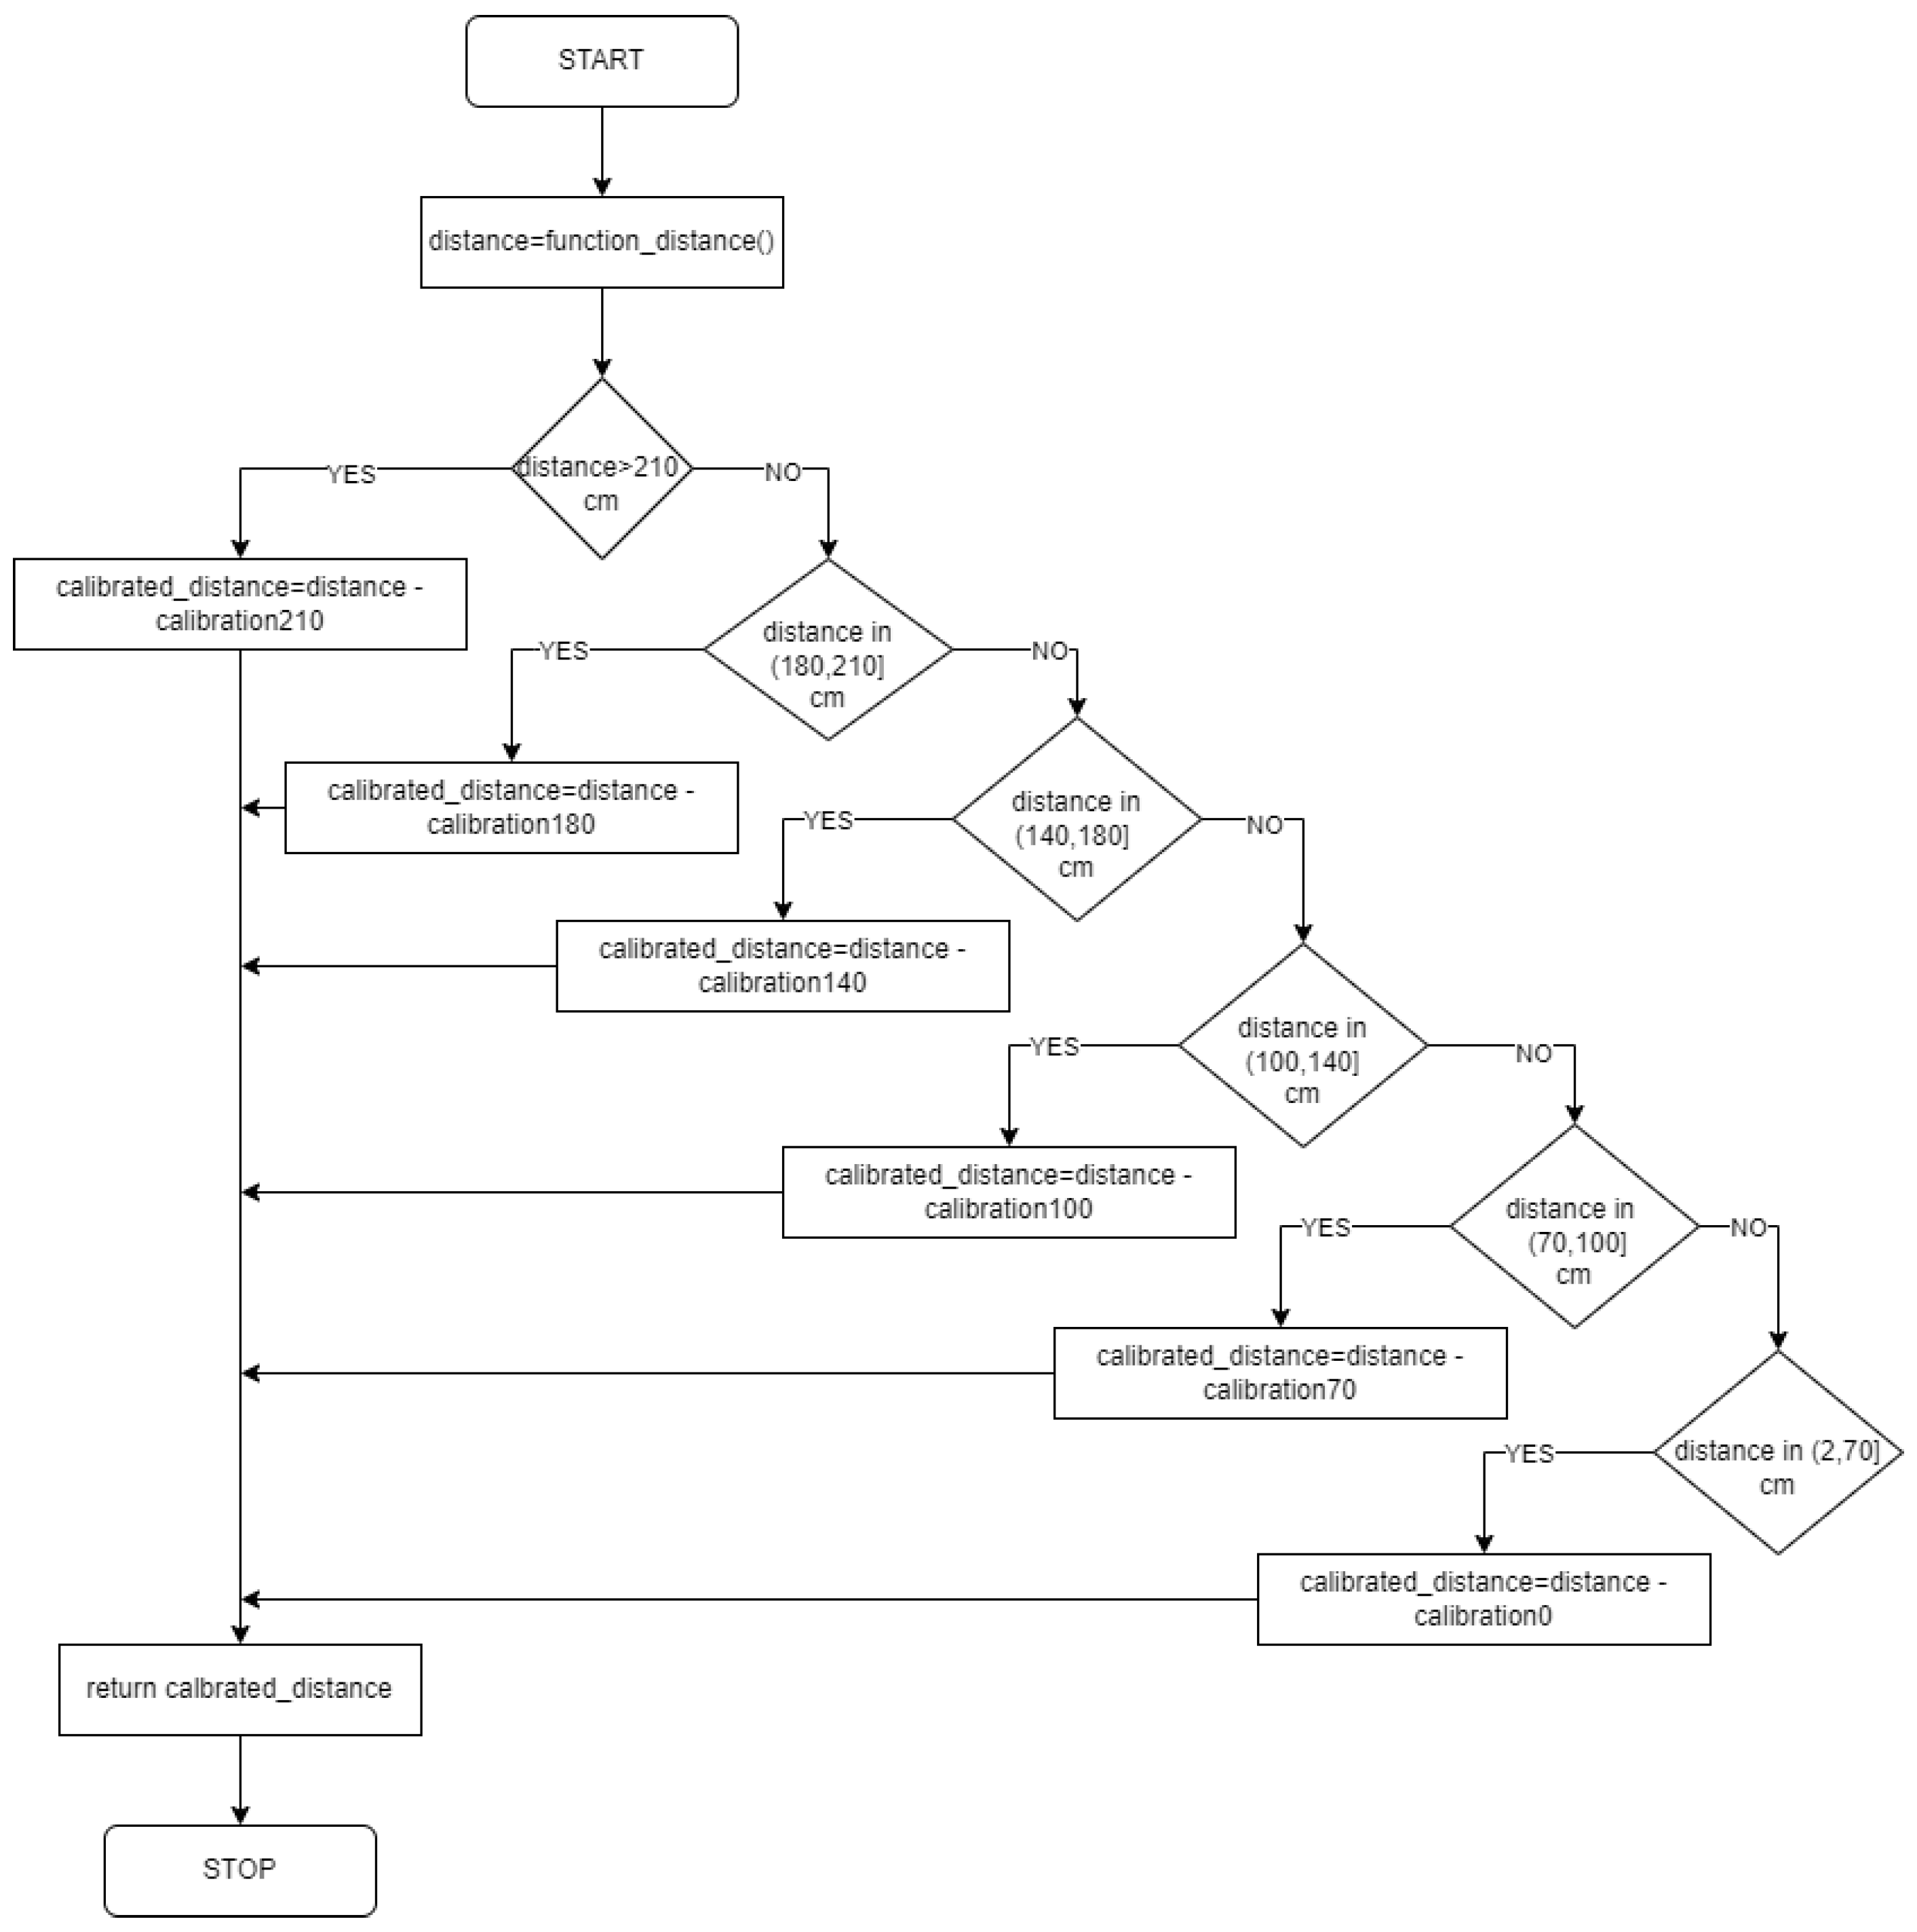
2.1.1. Functionality Module

The main function of the prototypes is to detect indoor obstacles placed in the path of the user. For this function, on the hardware part, a HC-SR04 ultrasonic sensor was chosen [13]. With a 4 m maximum range, a 15 degree measuring angle, easy use, easy maintenance, and cost-effectiveness, ultrasonic was the perfect candidate for this prototype. On the software part, the distance between the obstacles and the prototypes is calculated using two methods. The first method calculates the distance based on the algorithm described in Figure 1.
The second method adjusts this distance based on data attained while calibrating the prototypes, as shown in Figure 2.

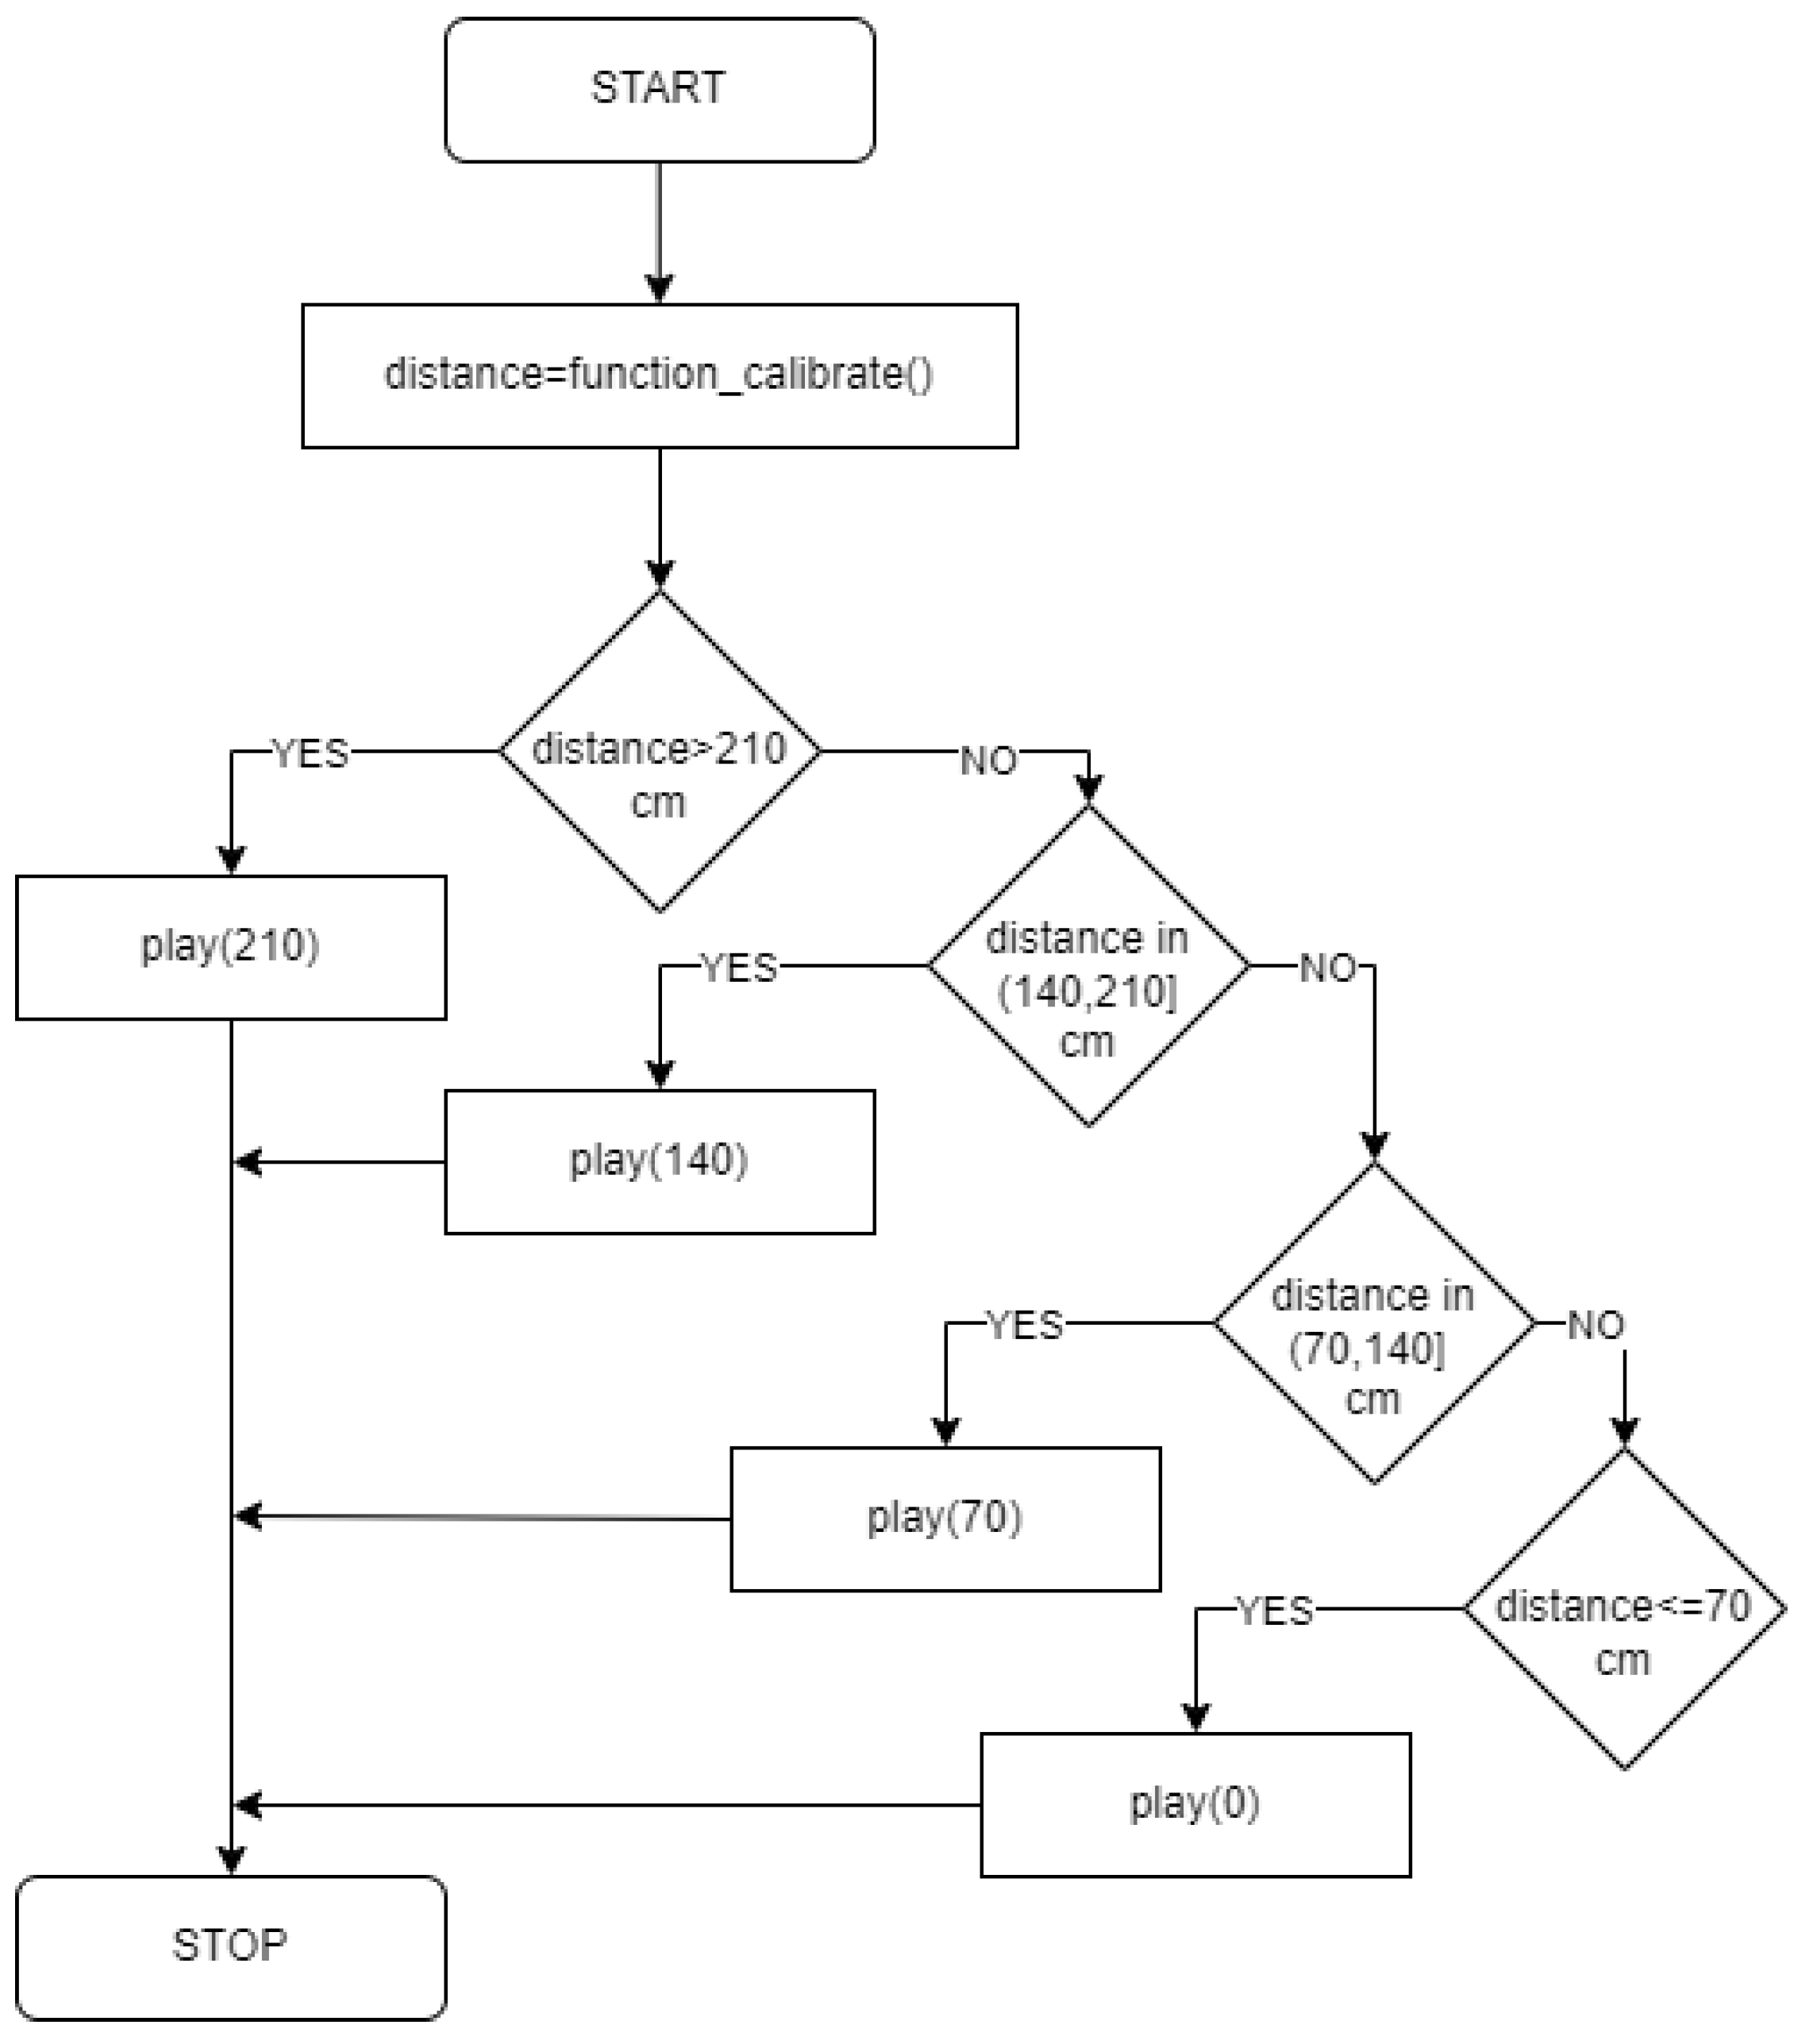
2.1.2. User Interface Module

This interface consists of the audio part, with a function relaying a message to the user regarding the situation of the path in front of the prototype. The audio part consists of a 3.5 mm jack module and a headset. The jack module is small and easy to use. The headset will have only one speaker since the target group consists of visually impaired persons and the use of two speakers, one in each ear, will render the audio system for other potential danger situations obsolete.
From a software standpoint, this module has a function in the code that takes the calibrated distance from the functional module and plays a message, as shown in Figure 3.
Since the prototypes are reactive and their only task is to notify the user regarding the path in front, no other modules or interfaces were built. The testing of the prototype required the use of a laptop for retrieving all the detected events. The laptop and the prototype were connected through the USB (Universal Serial Bus) port of the micro-controller. Log messages were inserted for testing purposes after each algorithm decision.

2.2. Audio Conversion

2.2.1. PCM Audio Conversion

Pulse Code Modulation (PCM) it a modulation method facilitating the conversion of an analog signal into a digital one. Employing PCM modulation enables the digitization of various analog information, encompassing voice, video, audio, telemetry, and more. To derive a PCM signal during transmission, the analog signal undergoes sampling at regular intervals.
The audio segment of the prototype is designed to offer the user an extensive array of customization options for the received message. Primarily, users can choose the language in which messages are transmitted. Additionally, they have the flexibility to select different voices, opt for a familiar voice, or even use their own voice.
To enable these modifications, recording the audio messages in the desired language and voice becomes imperative. This recording process can be effortlessly accomplished using any available software on a computer along with a microphone. In this study, the Audacity software was used for all the voice recordings. It is a open-source software accessible across. Subsequently, the audio file may need processing to eliminate unwanted noise or pauses between words in the message.
The subsequent step involves converting the file with the following parameters:
  • Sample per second: 16 kHz
  • Channel: Mono
  • Format: 16-bit PCM
The resulting file is exported in MP3 format and, utilizing an audio encoder, is transformed into a PCM signal that can be directly loaded into the detection program installed on the microchip. In practice, this modification can only be executed by an individual with access to the code.
Considering the memory space required for each message, the number of messages essential for the prototype’s operation, and the overall space available on the microchip (approximately 2048 bits), it was necessary to declare the messages in the program to be PROGMEN-type constants. Implementing the term PROGMEN ensures that these constants are stored during program execution in alternative memory spaces, rather than the SRAM (Static Random-Access Memory) memory type that is typically used.
The notable advantage of this prototype lies in the fact that end-users can request any language or voice type. A person with access to the source code can seamlessly modify and upload the new version to meet specific requirements.

2.2.2. WAVE Audio Conversion

The WAVE prototype simplifies the process of changing the language and voice for message transmission, primarily achieved by substituting the SD (secure digital) card with another containing the desired audio files.
For optimal and faithful message transmission, it is advisable to employ high-performance recording devices. The WAVE files to be exported should conform to the following format:
  • Bit resolution: 8 bits.
  • Audio frequency: 16 kHz.
  • Audio channel: Mono.
  • PCM format: U8.
The file names must follow a specific convention; otherwise, the program will not recognize them:
  • The STOP message corresponds to the file named 0.
  • The DANGER message corresponds to the file named 70.
  • The CAUTION message corresponds to the file named 140.
  • The CLEAR message corresponds to the file named 210.
Furthermore, it is crucial to copy the files to the root of the card; placing them in different directories will result in them not being detected.
Through the utilization of the SD card reader, this prototype offers users considerable flexibility in selecting the language and vocal tone of the messages. The change essentially entails swapping the card with another one.

2.3. Testing Environment and Methods

2.3.1. Test Environment

The main function of a test environment is to provide a controlled and isolated space where software or systems can be tested thoroughly before being deployed into a production environment. It is a simulated setting that mimics the conditions of the actual production environment as closely as possible. The test environment used for this prototype consists of the following:
  • An unfurnished room that is wide enough to enable the prototypes to be placed at different distances without other interference.
  • On the floor, different positions are marked for the obstacles (both square and cylinder).
  • From each obstacle position, markers (blue tape) are placed on the floor at the following distances: 50, 70, 100, 140, 180, 210 and 230/250 cm.
  • The prototype and a laptop that will collect the log files is placed on a table with wheels so it can be easily moved to any marker.
The following obstacles are used:
  • The square obstacle is simulated with a cardboard box with sides measuring 40 cm.
  • The cylinder obstacle is simulated using a 38 cm diameter cardboard box.
  • For a specific test: a PVC pipe with a 2 cm diameter and a matchbox.
  • Different types of materials used to simulate obstacles: cardboard, concrete, slicker, glass, mirror, MDF, paper, iron, plastic, wood, PAL, jeans, cotton, leather, linen. As a note, these materials will be tested under only one condition: in the full path of the sensor. Tor the confusion matrix results, the readings will take place for 10 min.
The obstacles will be placed in three different positions based on the location of the prototype. This is explained for the square obstacle; the same conditions were applied in testing both the square and the round obstacles as well.
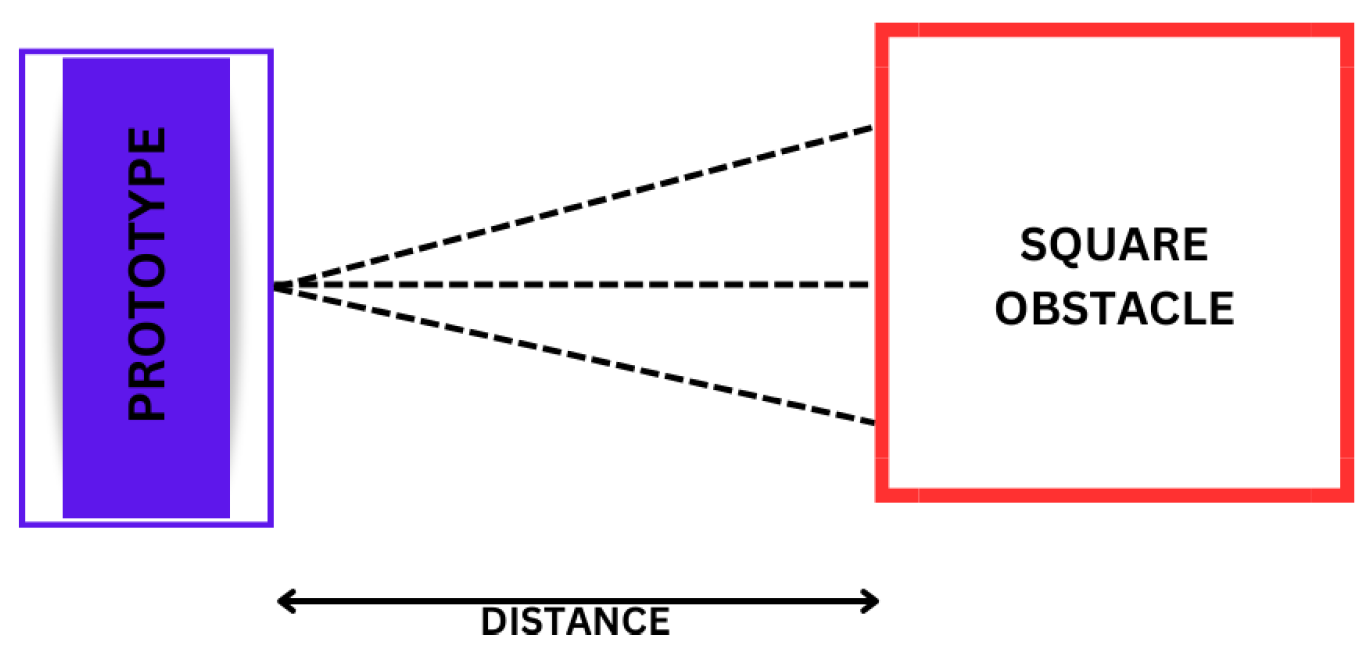
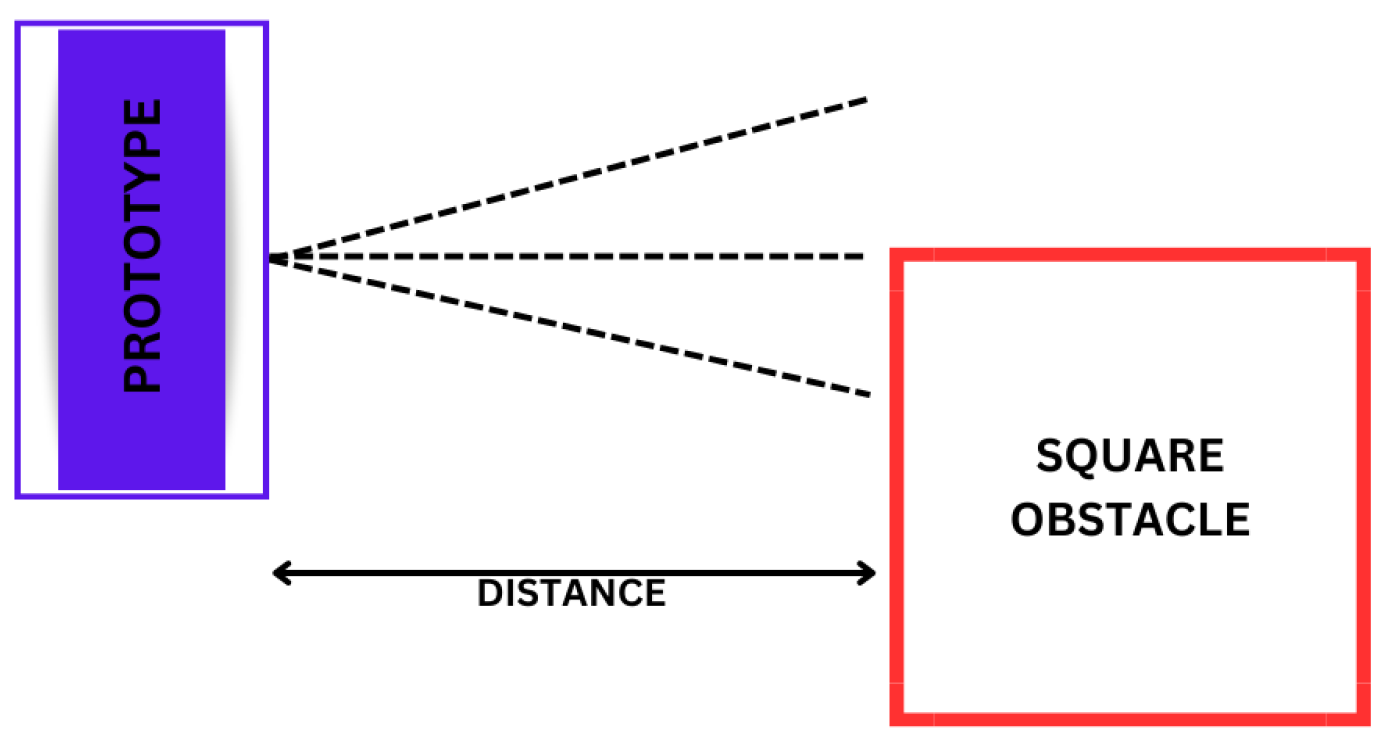
  • In the full path of the sensor’s directivity, as shown in Figure 4—the sensor has a 15 degree measuring angle.
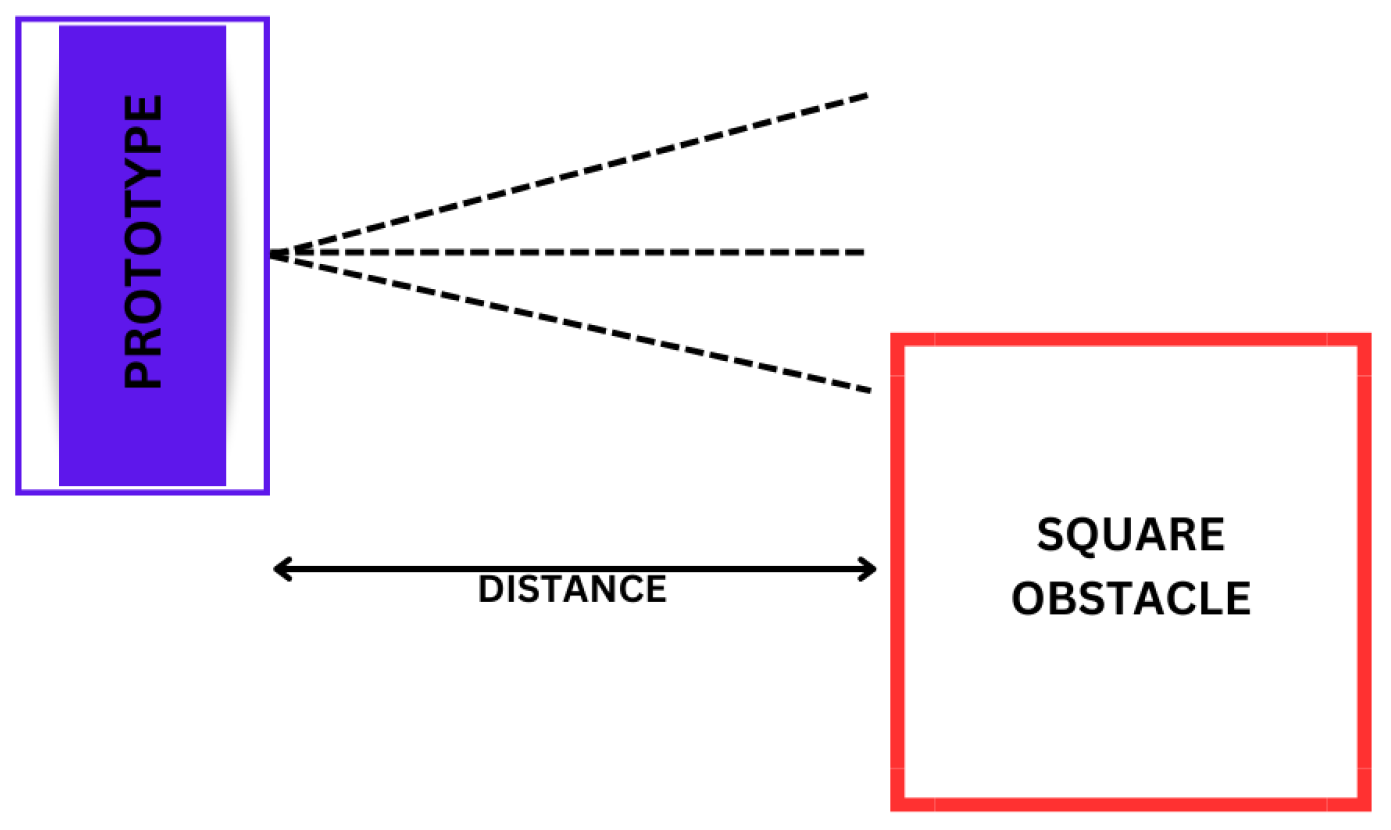
  • The obstacle is placed so it covers only half of the measuring angle of the sensor, as shown in Figure 5.
  • The obstacle is placed so it covers only a quarter of the measuring angle of the sensor, as shown in Figure 6.

2.3.2. Testing Methods

The test scenarios will consist of the following.
  • For static obstacle testing:
    • The obstacle (square or cylinder) is placed on a designated marker for position on the floor (completely in front of the sensor directivity, so it covers only half of the sensor directivity and so it covers only a quarter of the sensor directivity).
    • The prototype and the laptop are placed on a specific distance marker.
    • The test for each distance and position is conducted for 30 min, so the log file will have sufficient entries to create a confusion matrix
  • For different materials testing:
    • Each of the materials is placed completely in front of the sensor.
    • The WAVE prototype and laptop are placed on the 50 cm marker.
    • The test will be conducted for each of the materials for 10 min.
Since the goal is to reproduce an actual situation for a user that is visually impaired, the conducted tests will fall under the category of end-to-end black box testing. Black box testing [14] is a method of software testing where the tester examines the functionality of a system without knowing the internal workings of the prototype or its code. The testing method is chosen to execute end-to-end testing [15,16] since the main goal is to verify the entry (in this case, the distance between the prototype and the obstacle) with the expected exit (in this case, the audio warning that the user will hear). By choosing the distances 70, 140, and 210 cm, the edge case testing [15] scenarios for the prototypes are covered; this is not the case for the HC-SR04 sensor [13] itself.
The design and analysis of the tests took into account the channel models found in the existing literature [17].
For each situation, the following parameters will be taken in consideration and highlighted:
  • The confusion matrix predictions—as a graphic and a table in the appendix.
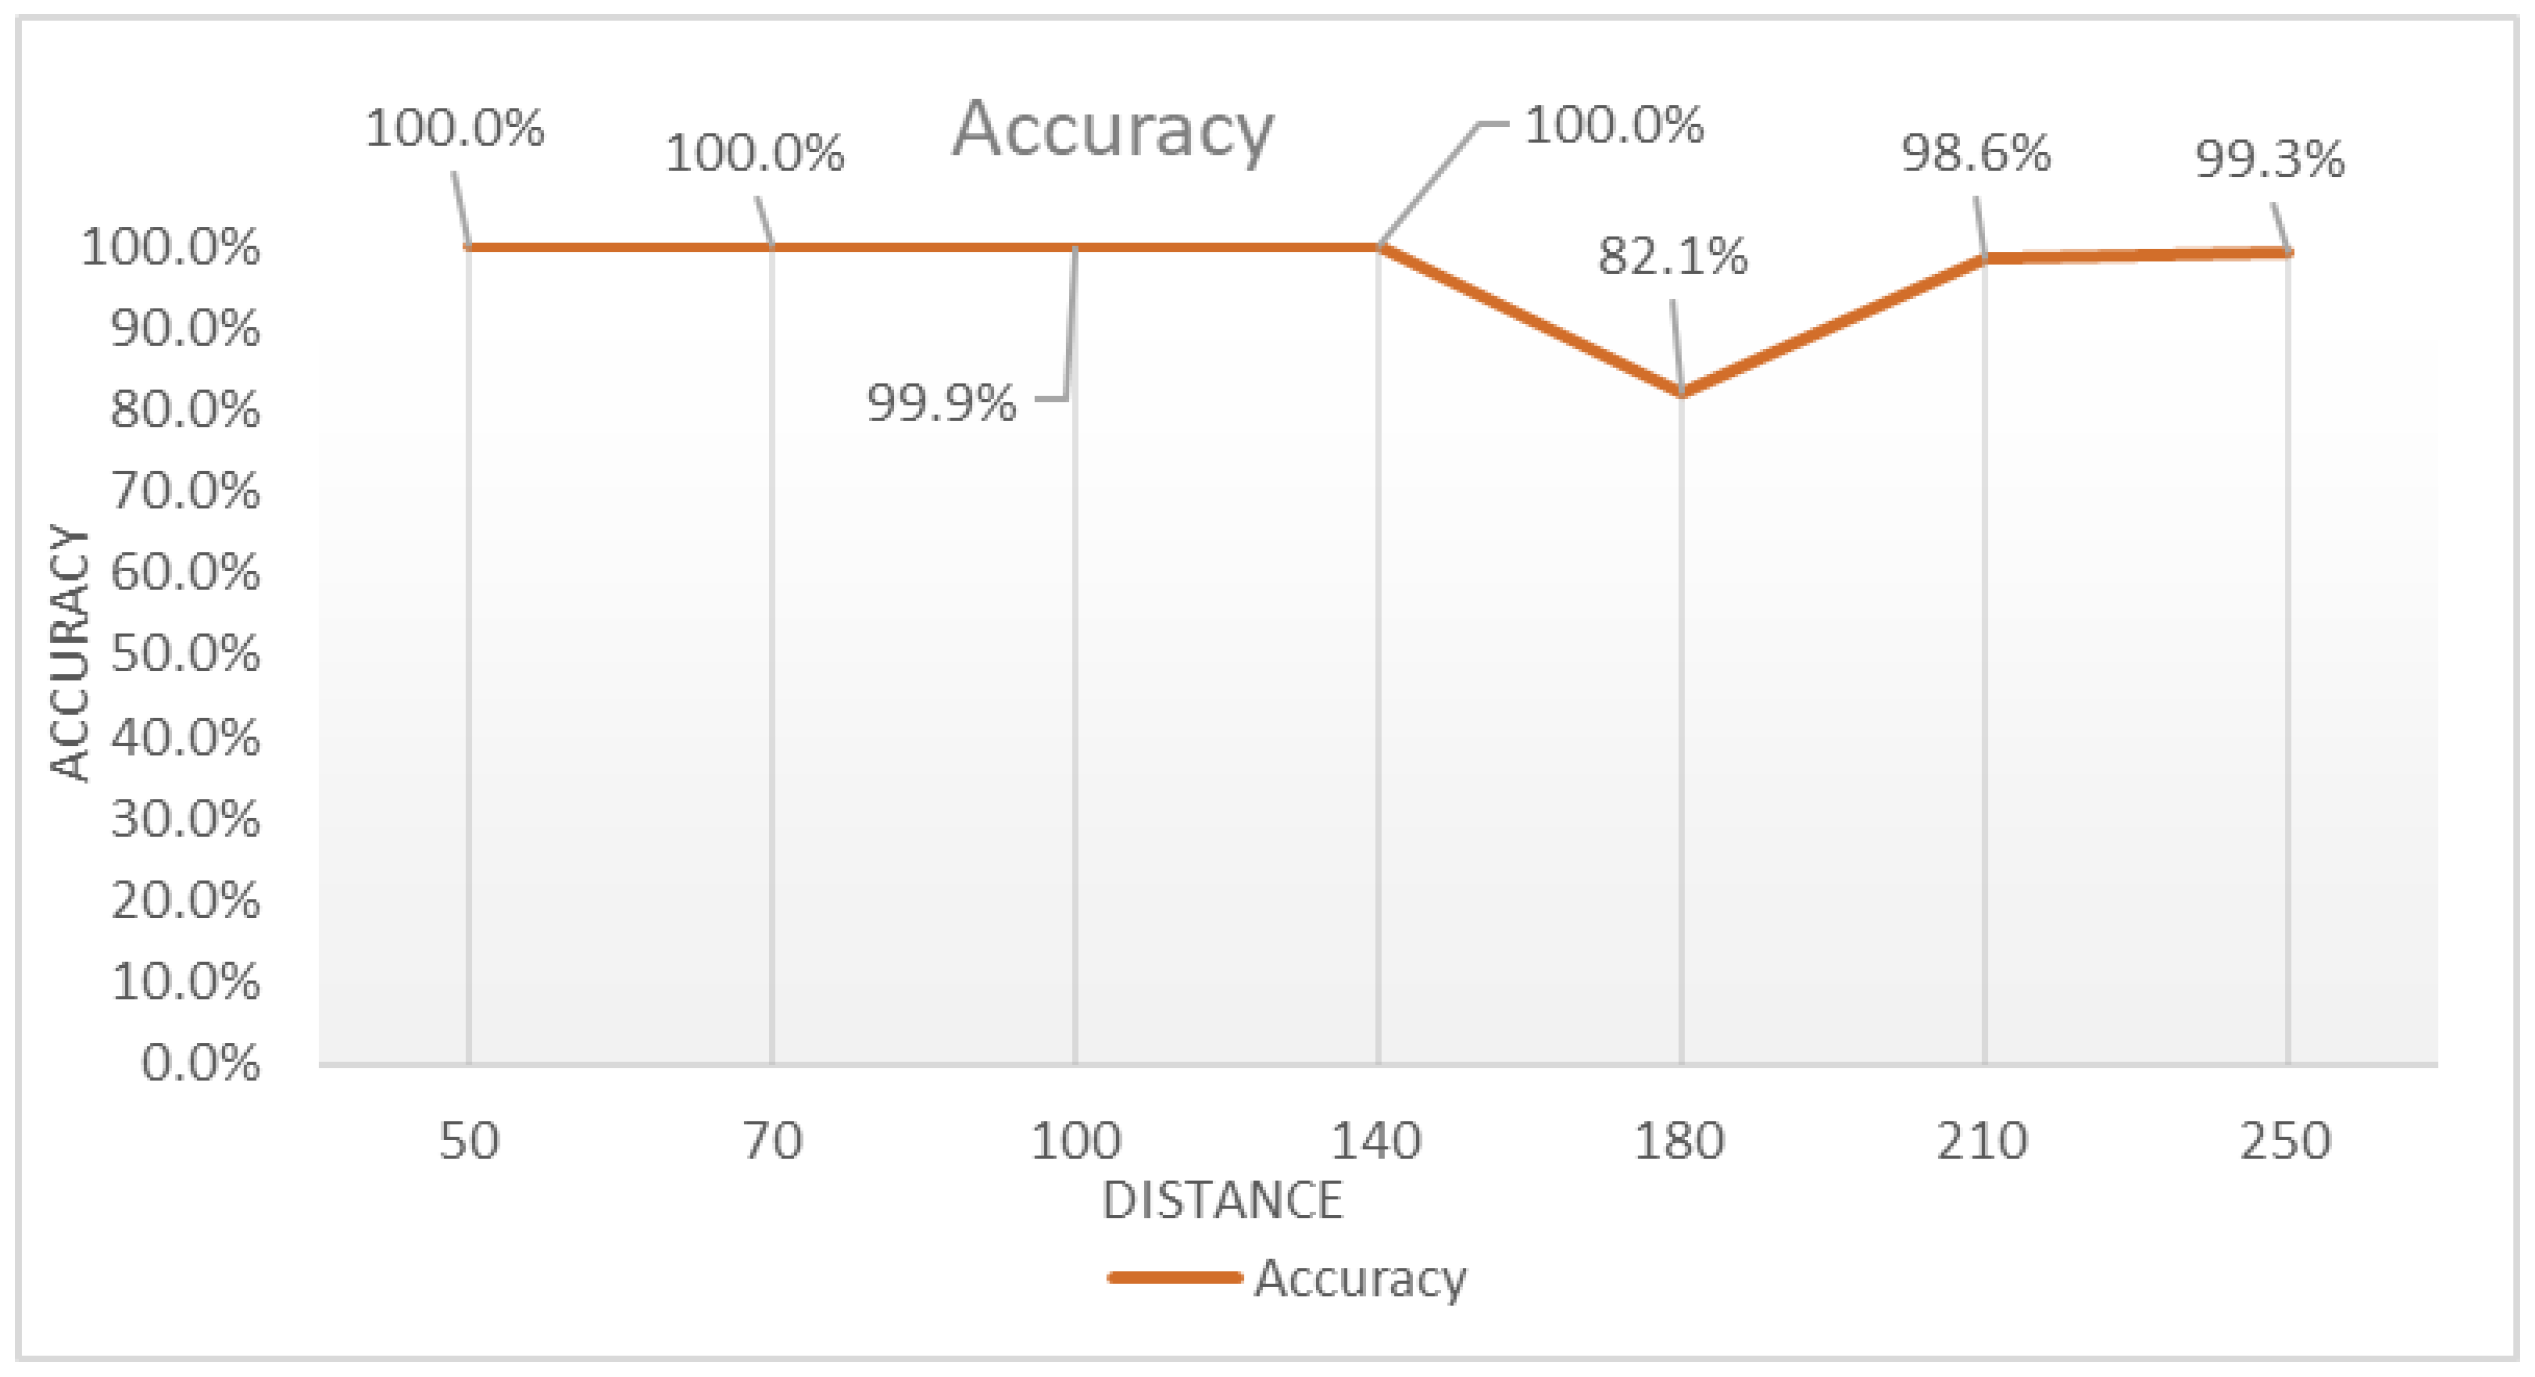
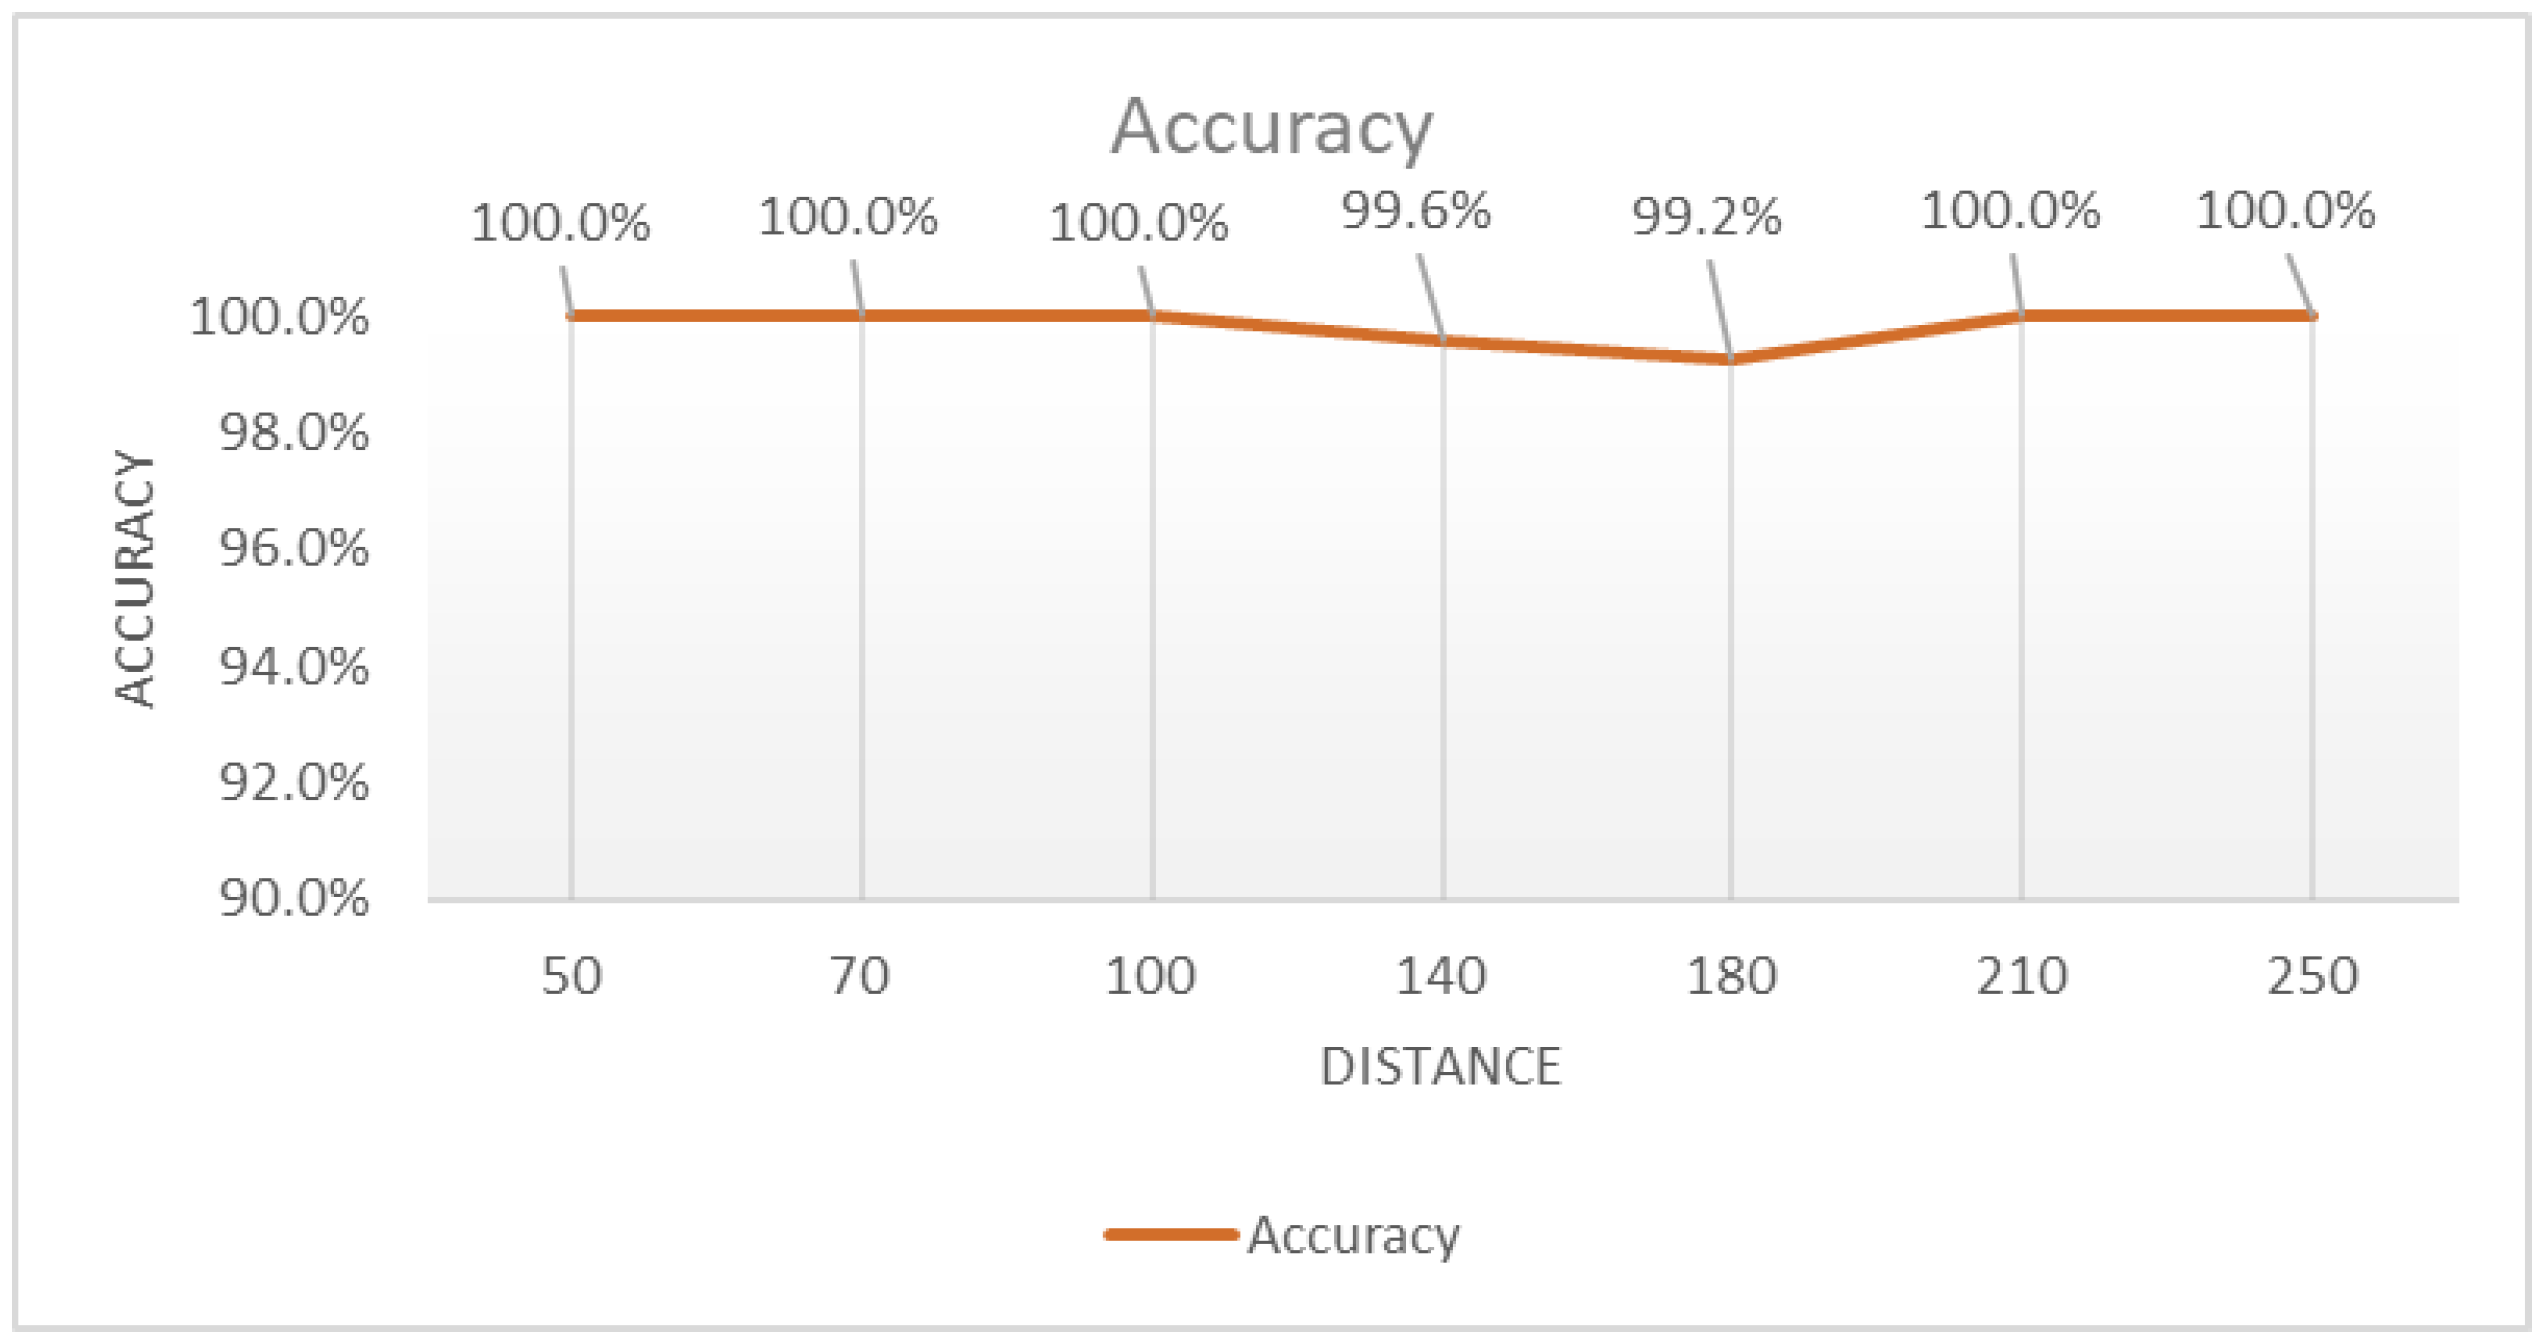
  • The accuracy for each distance—as a graphical representation—calculated using the following formula:
    A c c u r a c y = Number of correct readings Total number of readings × x   100
  • The overall accuracy of each of the prototype calculated using the following formula:
    O v e r a l l A c c u r a c y = n = 1 7 A c c u r a c y [ n ] 7
  • The critical accuracy (for the 50, 70, 100, and 140 cm distances) of each of the prototype calculated using the following formula:
    C r i t i c a l A c c u r a c y = n = 1 4 A c c u r a c y [ n ] 4

2.4. Interpretation of Results

For the interpretation of the test results, the confusion matrix [15,16] is the chosen method. A confusion matrix is a table that is often used to evaluate the performance of a classification model. It summarizes the performance of a classification algorithm by displaying the number of true positive (TP), true negative (TN), false positive (FP), and false negative (FN) predictions made by the model.
Here is a breakdown of the components of a confusion matrix:
  • True positive (TP): Instances that were correctly predicted as positive.
  • True negative (TN): Instances that were correctly predicted as negative.
  • False positive (FP): Instances that were incorrectly predicted as positive.
  • False negative (FN): Instances that were incorrectly predicted as negative.
In order to calculate the matrix components, the following equations are used:
T P = i = 1 n 1 ( m o d e l [ i ] = 1 a n d r e a l i t y [ i ] = 1 )
T N = i = 1 n 1 ( m o d e l [ i ] = 0 a n d r e a l i t y [ i ] = 0 )
F P = i = 1 n 1 ( m o d e l [ i ] = 1 a n d r e a l i t y [ i ] = 0 )
F N = i = 1 n 1 ( m o d e l [ i ] = 0 a n d r e a l i t y [ i ] = 1 )
where:
  • 1 —indicator function that returns 1 if the condition is met and 0 in all the other cases;
  • model—the measured distance by the prototype;
  • reality—the real distance measured using a measuring tape.
Considering this, the values of the confusion matrix should correspond to the following sets of data:
  • TP: results ∈ [realDistance− 2 cm, realDistance].
  • FP: results ∈ [realDistance− 5 cm, realDistance− 2 cm].
  • FN: results ∈ [realDistance + 1 cm, realDistance + 5 cm].
  • TN: any other result.
where realDistance is the distance measured with a tape between the prototype and the obstacle
For example, if the measured distance between the prototypes and the obstacle is 70 cm, then the values for the confusion matrix are as follows:
  • TP: if the prototype reading is between 68 and 70 cm and the user hears a “STOP” message;
  • FP: if the prototype reading is between 65 and 67 cm and the user hears the “STOP” message;
  • FN: if the prototype reading is between 71 and 75 cm and the user hears the “DANGER” message;
  • TN: any other prototype reading.

3. Results

In this section, the results for different testing scenarios are described, followed by the conclusions of each test state.

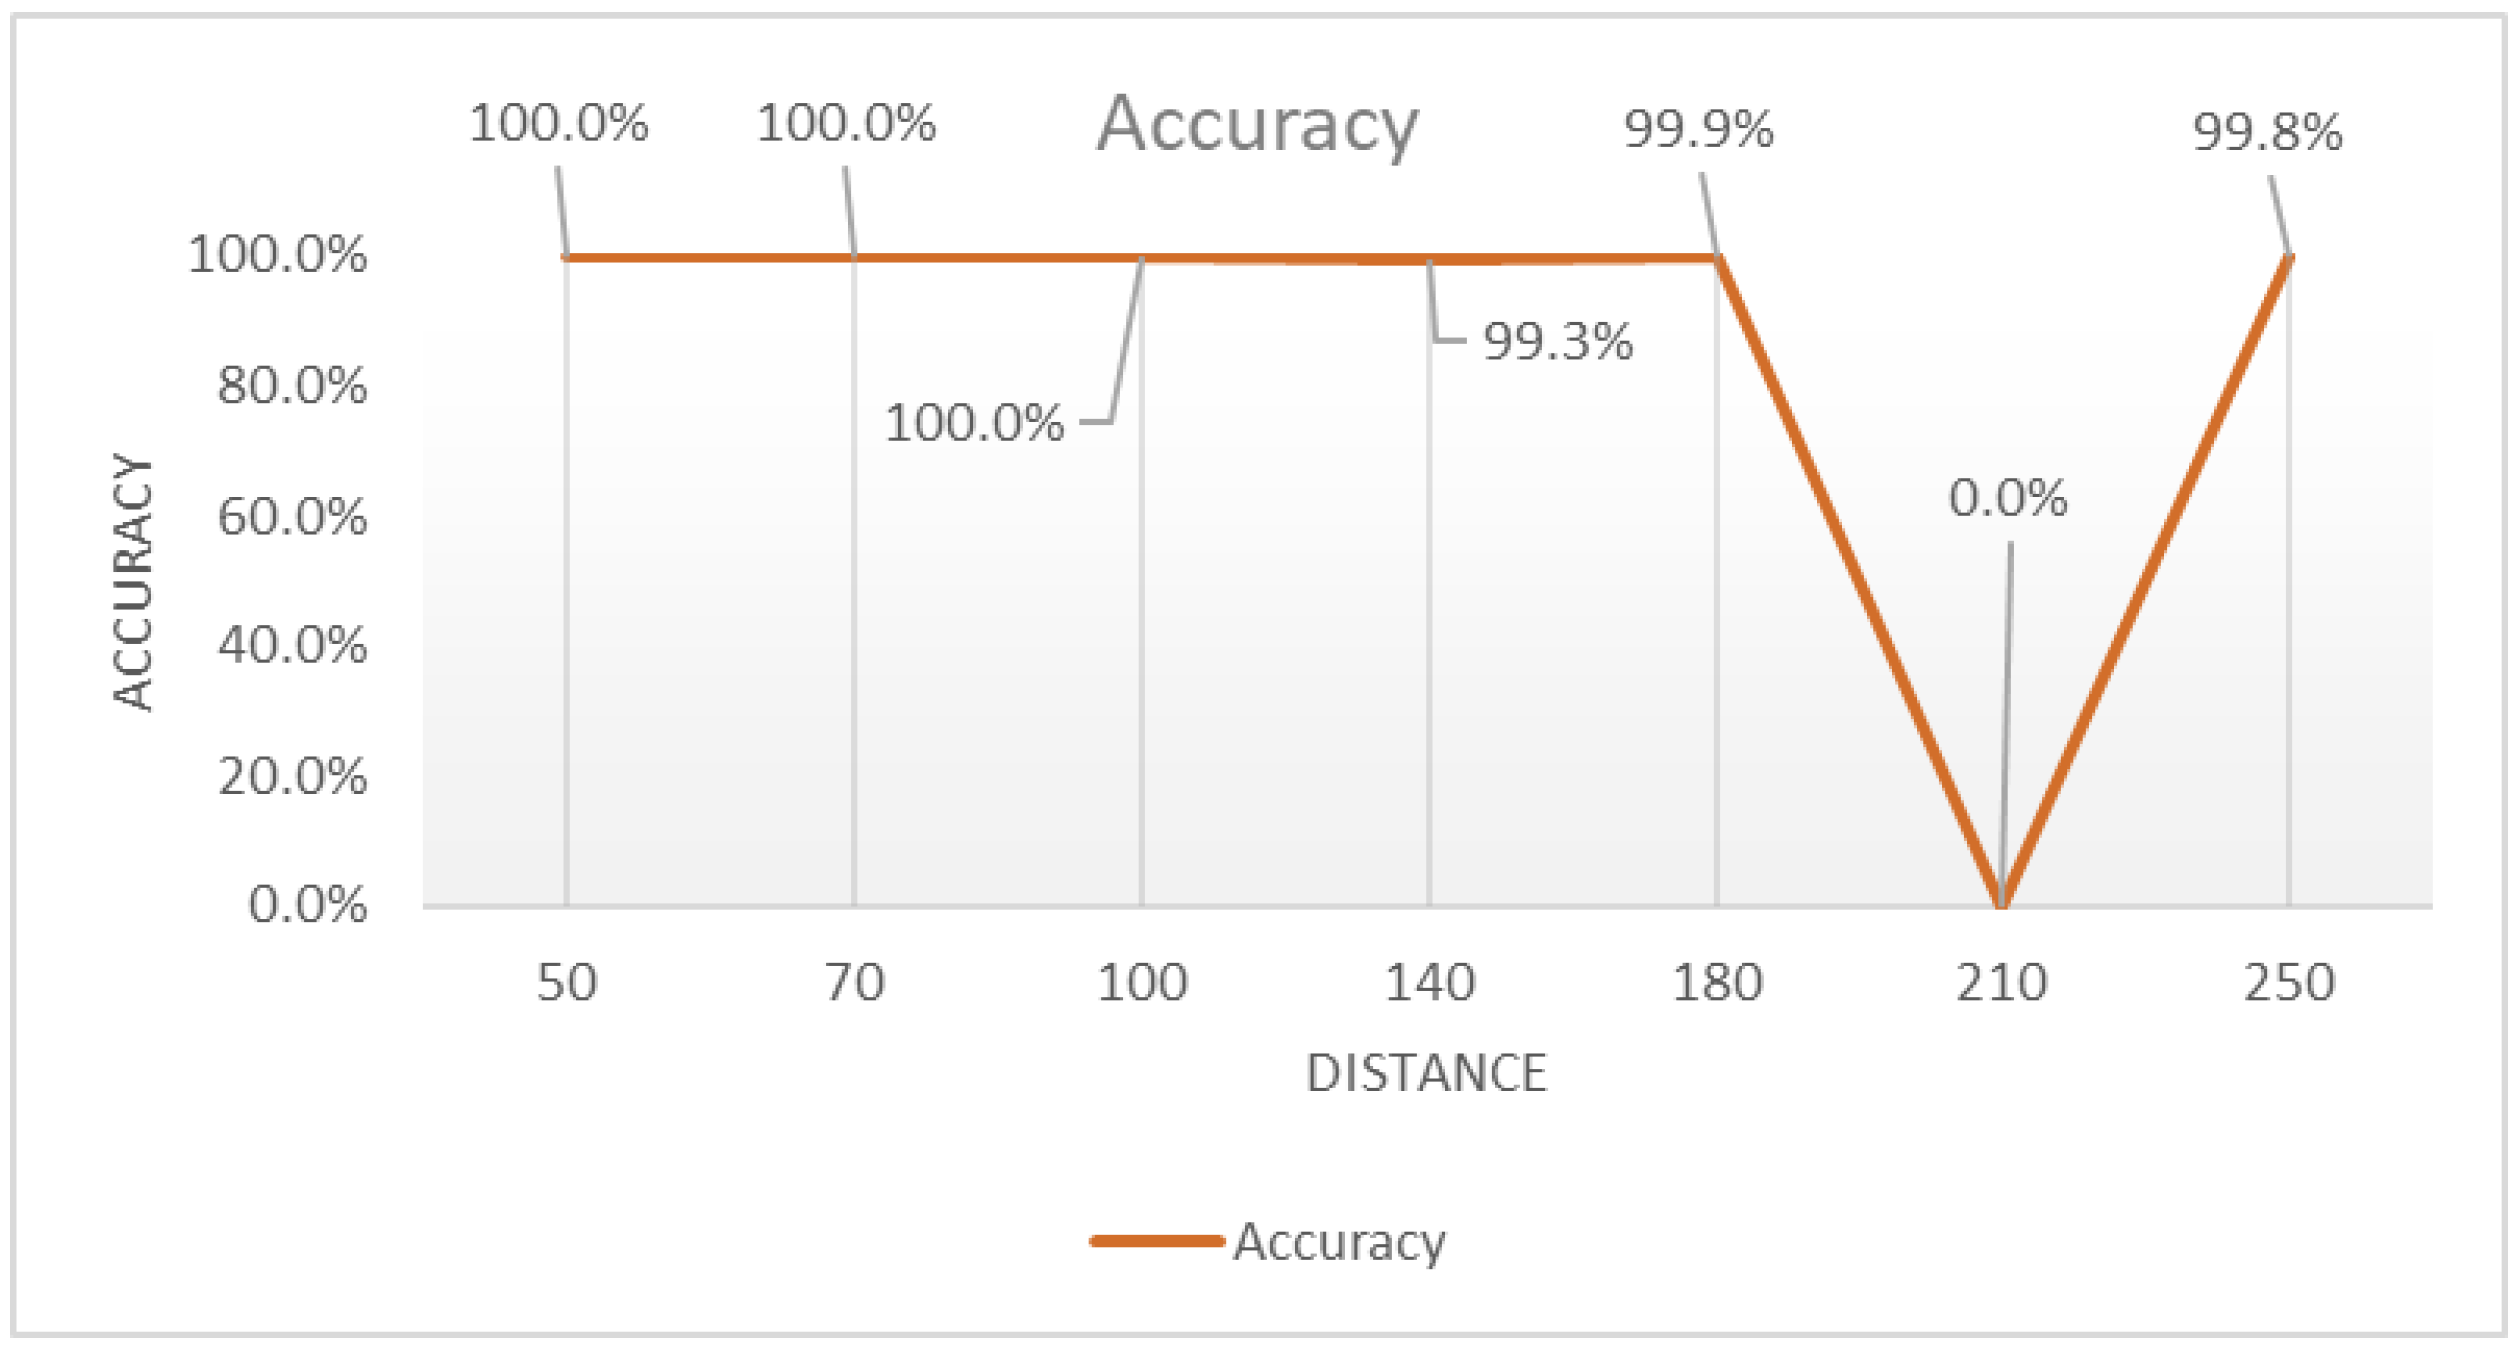
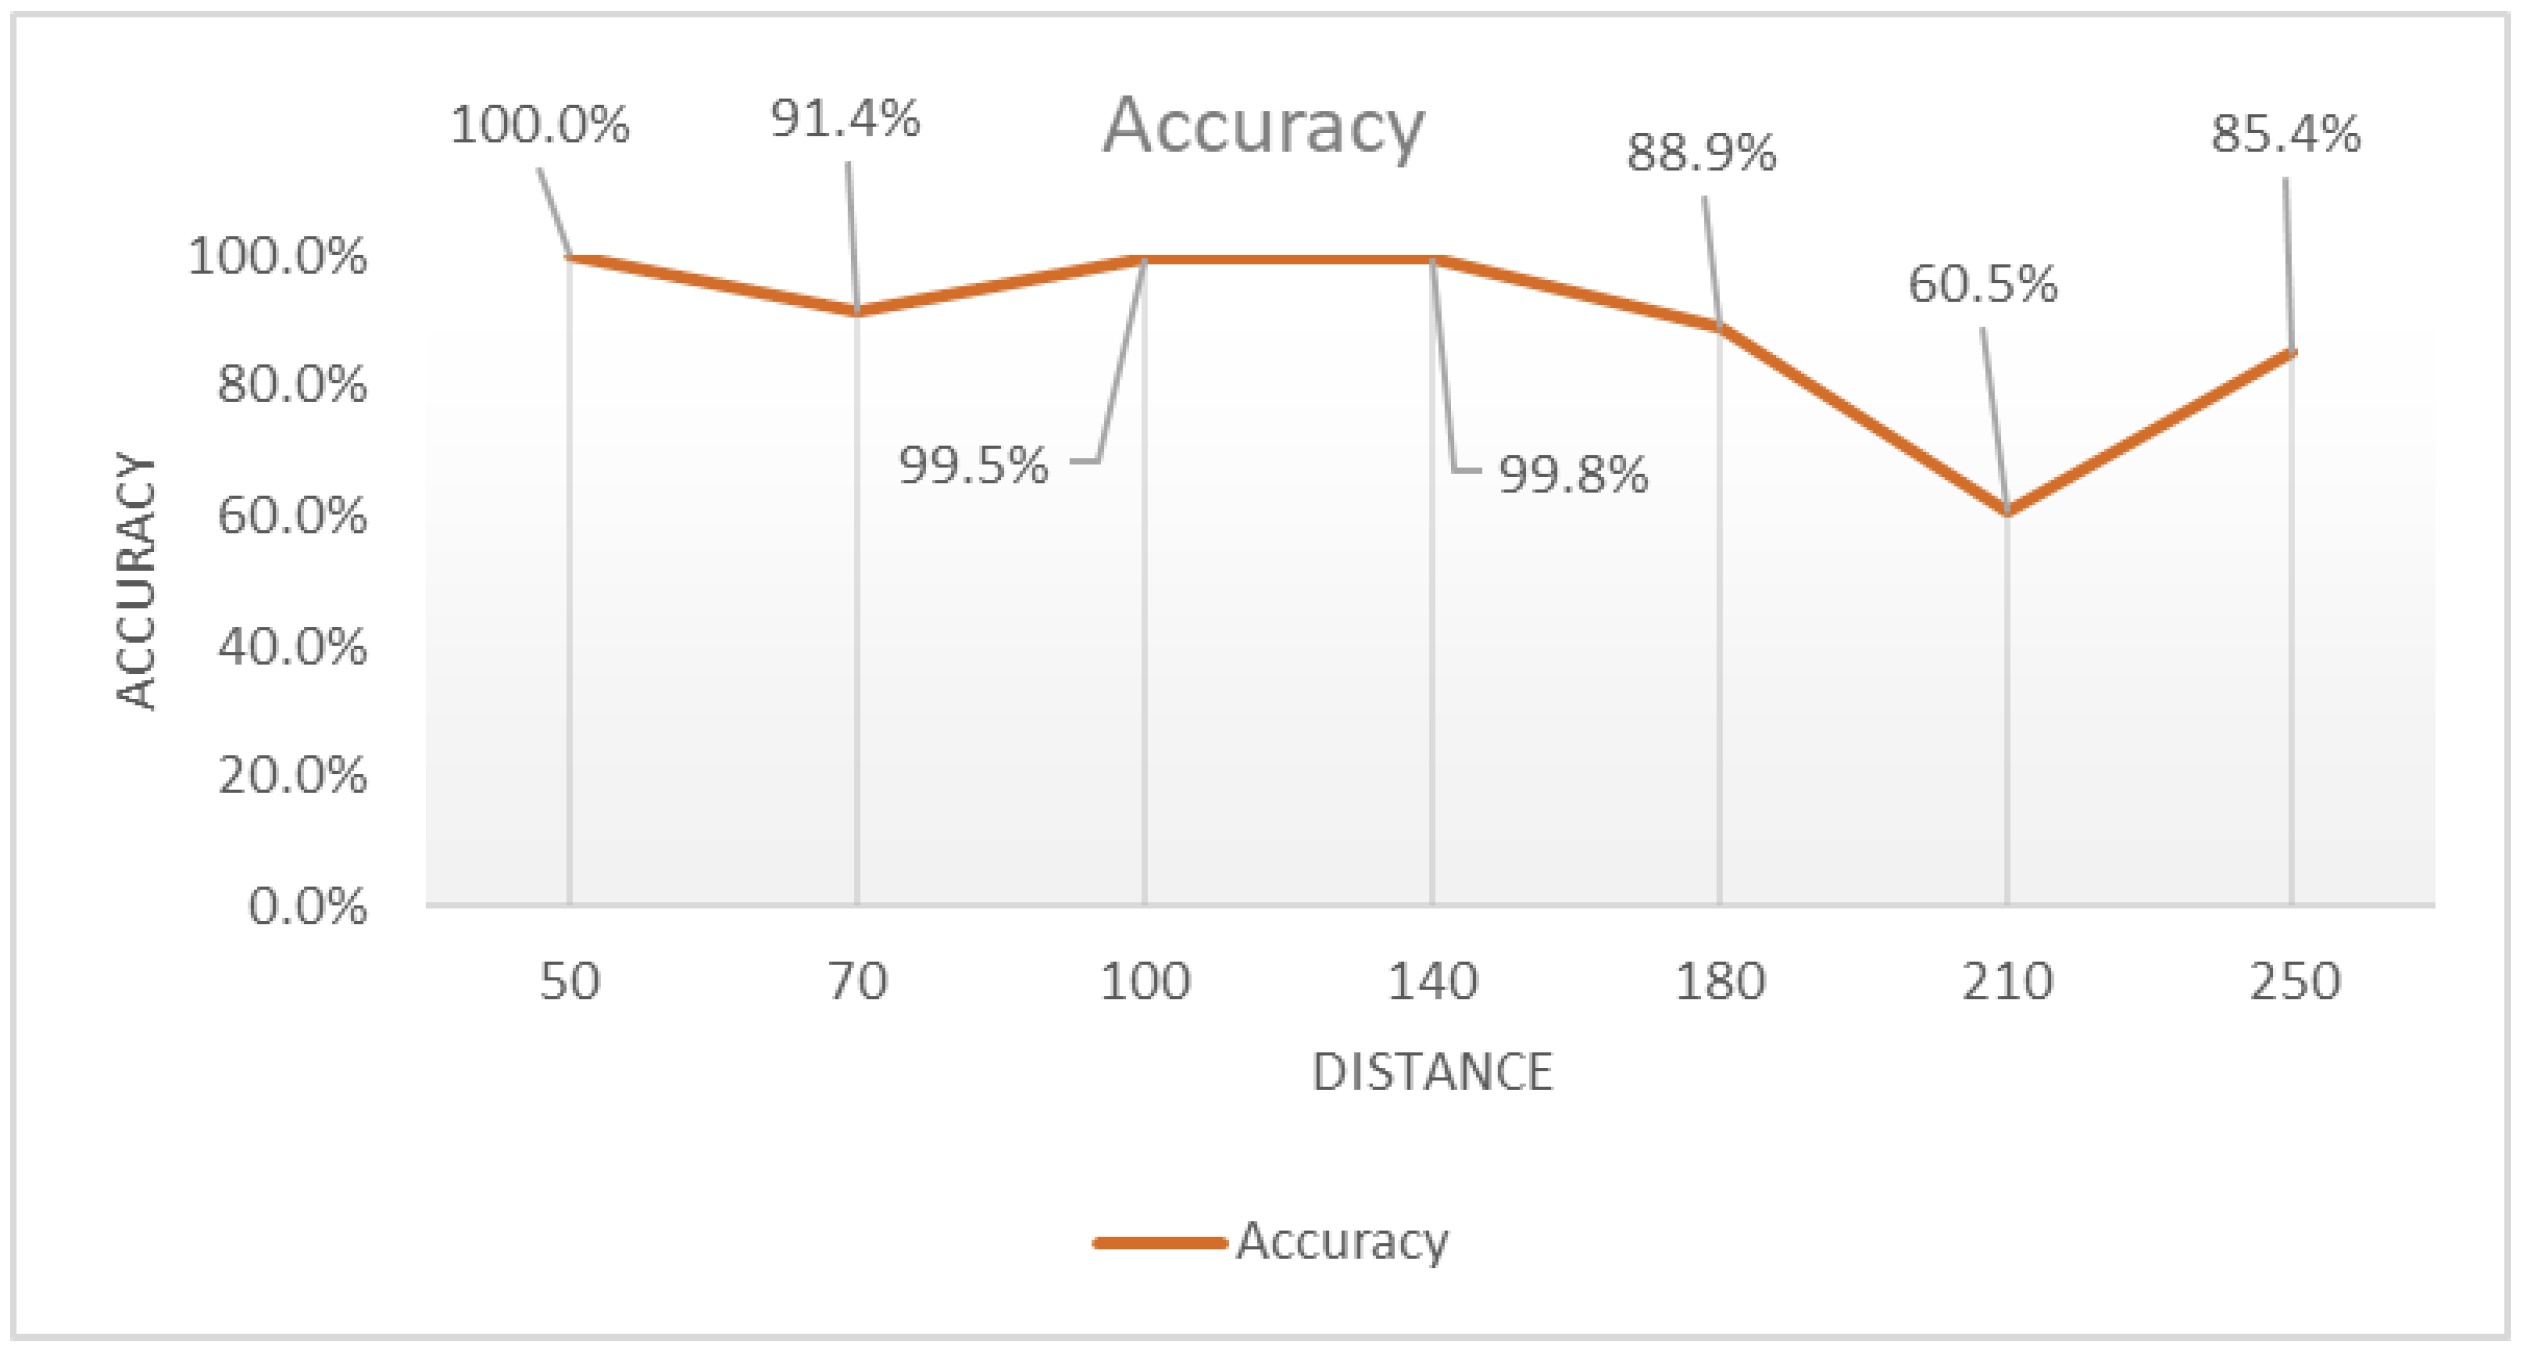
3.1. Square Static Obstacle Placed in Front of the Prototypes

The prototypes were moved to all the already marked testing distances and a log file was saved. Analyzing all the log files for those prototypes, the accuracy of the prototypes can be seen in Figure 7 and Figure 8:
The data behind these images were previously published in [2] and the testing different scenarios and methods can continue.
The readings for each distance are fewer for the WAVE prototype compared to the PCM prototype; however, the accuracy of the WAVE prototype is greater. Examining these new findings reveals that the prototype boasts an average success rate of 99.8%. Much like the previous test set, the accuracy of messages remains at 99.9% for critical distances.
The acquired data have shown that a user will successfully navigate around a square obstacle (a wall, a larger box, or a window) when it is positioned in their path.

3.2. Square Static Obstacle Placed So It Covers Half of the Prototype’s Detection Cone

The prototypes were moved to all the already marked testing distances and a log file was saved. Analyzing all the log files for those prototypes, the accuracy of the prototypes can be seen in Figure 9 and Figure 10.
The data behind these images are presented in Appendix A, Table A1.
Examining the data reveals that the prototype maintains an average accuracy of 95.6%, mainly influenced by the reduced accuracy at a distance of 180 cm. Consistent with the previous test set, the accuracy of messages remains at 99.8% for critical distances.
Based on the results, the prototype maintains an average success rate of 99.8%. As seen in the prior test set, the precision of the messages holds steady at 100% for critical distances. Inaccurate readings for greater distances, like 210 and 230 cm, do not have an immediate impact on the user. The time interval between two readings remains below 2 s, and the algorithm has effectively filtered out specific readings that are considered incorrect.
In this scenario, a secondary analysis was performed concerning the obstacle’s placement—specifically, whether it resides in the 15-degree half-cone on the emitter or receiver side of the ultrasonic sensor. Following an extensive series of tests, it has been ascertained that this particular case does not function as a valid test, taking into account the prototype’s unwavering and consistent behavior. Consequently, we have discarded this hypothesis, deeming it invalid.

3.3. Square Static Obstacle Placed So It Covers a Quarter of the Prototype’s Detection Cone

The prototypes were moved to all the already marked testing distances and a log file was saved. Analyzing all the log files for those prototypes, the accuracy of the prototypes can be seen in Figure 11 and Figure 12.
The data behind these images are presented in Appendix B Table A2.
Examining these updated results reveals a slight dip in the prototype’s success rate, averaging at 96.3%. Parallel to the previous test set, the precision of messages is maintained at 97.9% for critical distances.
The latest results indicate that the prototype maintains an average success rate of 99.8%. Consistent with the previous test set, the precision of messages stays at 99.9% for critical distances.
In conclusion, it can be affirmed that this prototype demonstrates a success rate exceeding 90% in detecting stationary square obstacles. This suggests that a prospective user of the prototype should face no challenges in navigating around windows, doors, or suspended objects within a building, provided their movement aligns with the prototype’s reading time.

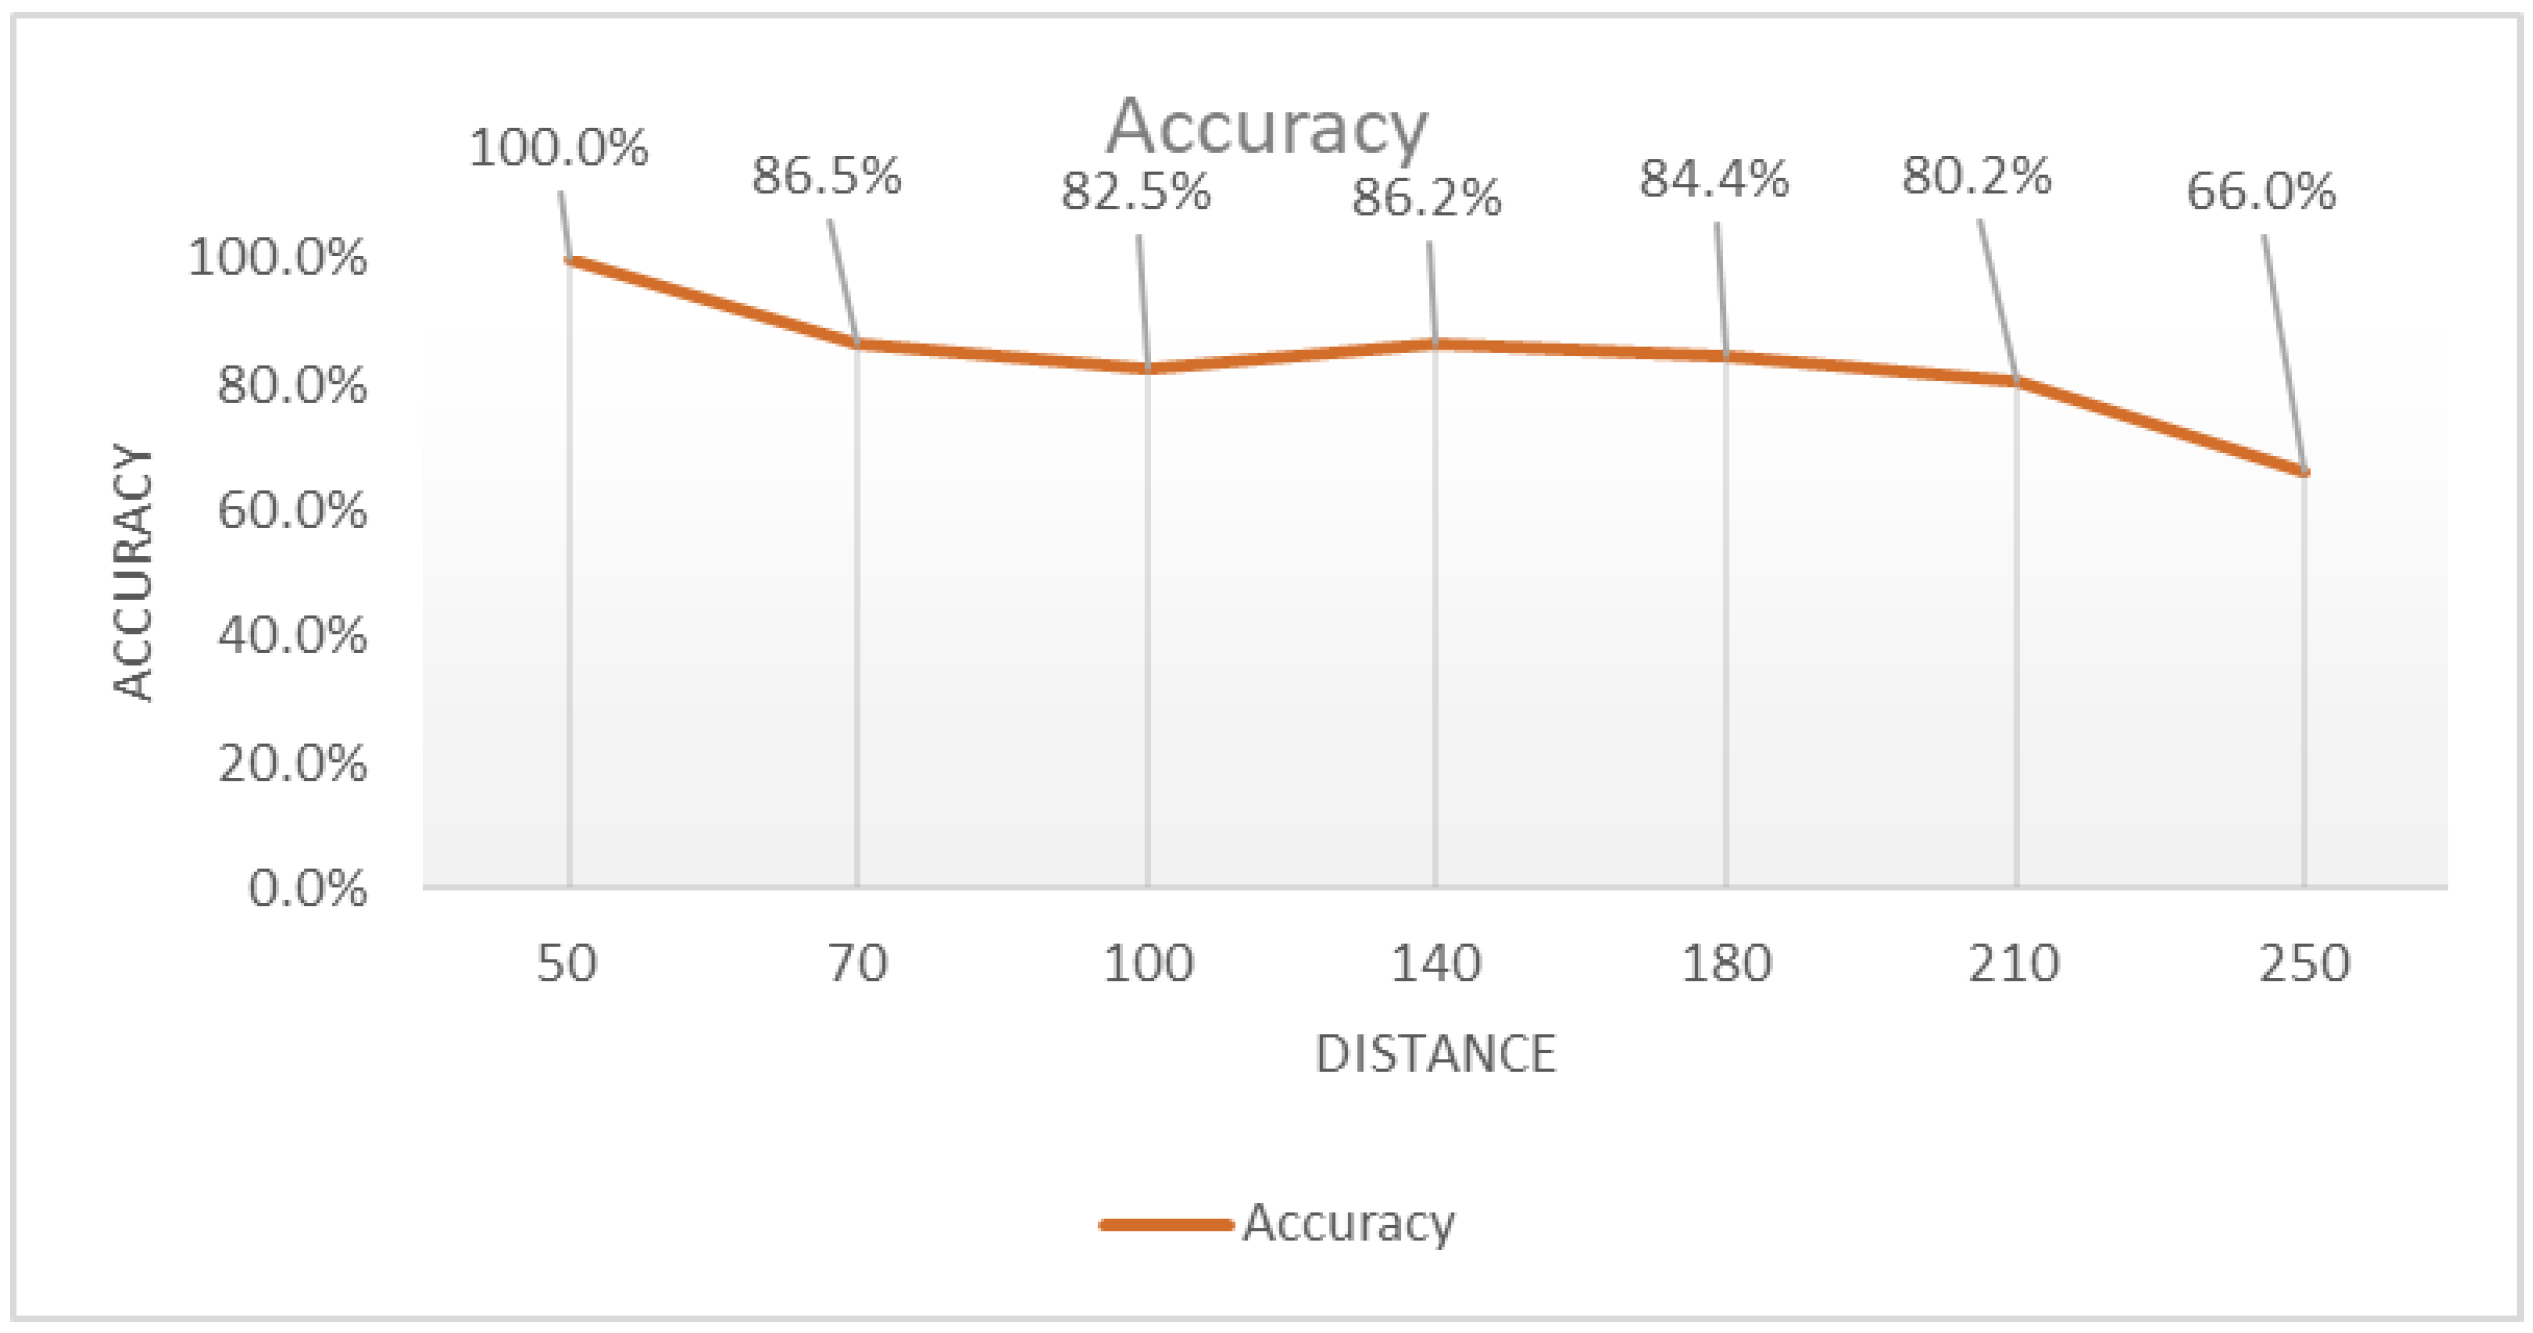
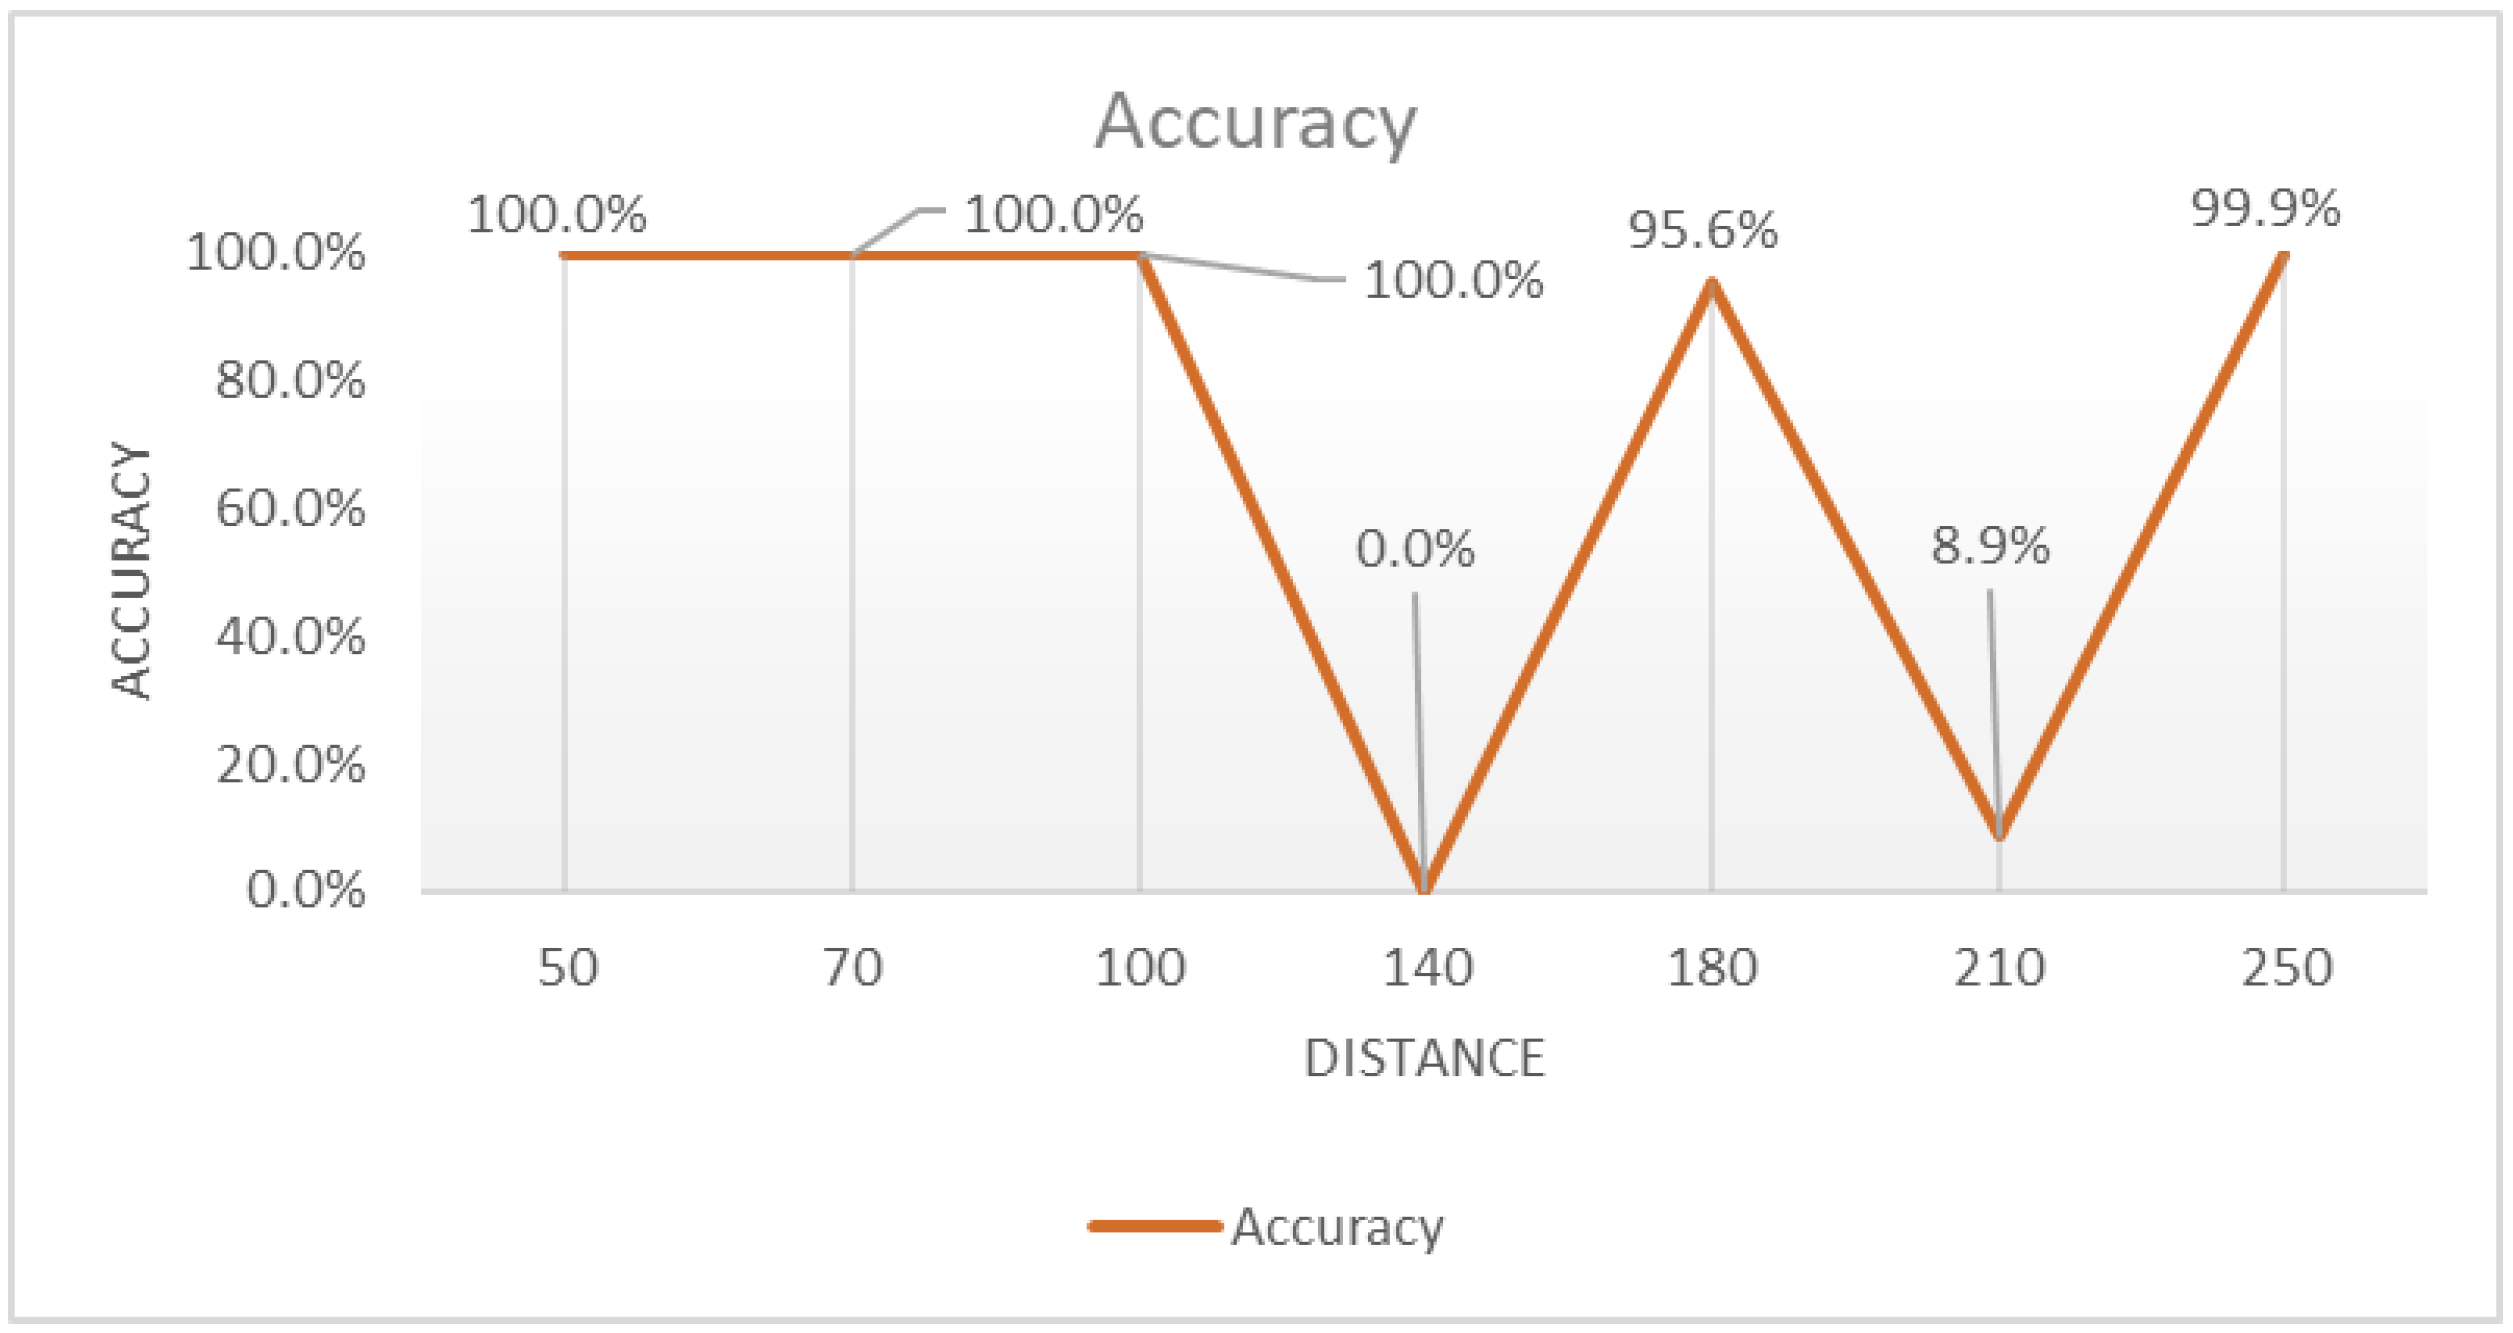
3.4. Round Static Obstacle Placed So It Covers the Full Path of the Prototypes Detection Cone

The prototypes were moved to all the already marked testing distances and a log file was saved. Analyzing all the log files for those prototypes, the accuracy of the prototypes can be seen in Figure 13 and Figure 14.
The data behind these images are presented in Appendix C, Table A3.
As noted, there has been an increase in the number of incorrect messages compared to the scenario involving a square obstacle for the same prototype. One contributing factor is the nature of the surface on which the wave reflects, coupled with the potential impact of a slight deviation from the center of the cylinder on the accuracy of distance readings.
Upon analyzing these results, it becomes apparent that the PCM prototype achieves an average success rate of 83.5%. Similar to the prior test set, the precision of messages for critical distances stands at 75.3%. For example, when the obstacle is positioned at a distance of 140 cm, the user should ideally hear the “Caution” message. However, the analysis reveals instances where the heard message is “Danger”, potentially prompting the user to prepare for obstacle navigation more swiftly than necessary. Conversely, a “Clear” message in such a scenario could pose a risk of accidents.
An issue that did not reoccur in a subsequent round of tests for the 210 cm distance is the instance of 0% accuracy, where the user would hear “Clear” instead of the expected “Caution” message. Given that this problem did not repeat and considering the greater distance involved, it is regarded as an isolated incident. Consequently, this value has been excluded from the calculation of the average accuracy.
In this context, a minor concern surfaced for obstacles with a very small diameter, less than 3 cm, situated at distances exceeding 200 cm. Occasionally, these obstacles remain imperceptible to the prototype. However, this is a minor issue, given the substantial distance between the prototype and the obstacle. Additionally, the user will receive at least one message describing the route’s status before reaching a critical juncture.
The WAVE prototype maintains a success rate very close to 100% in these conditions. Regrettably, an anomaly was detected at the 210 cm distance. In this instance, the user should have received a “Caution” message instead of “Clear”. Nevertheless, the considerable distance of 210 cm between the user and the obstacle means that there will be at least two additional route analyses before it becomes a concern.

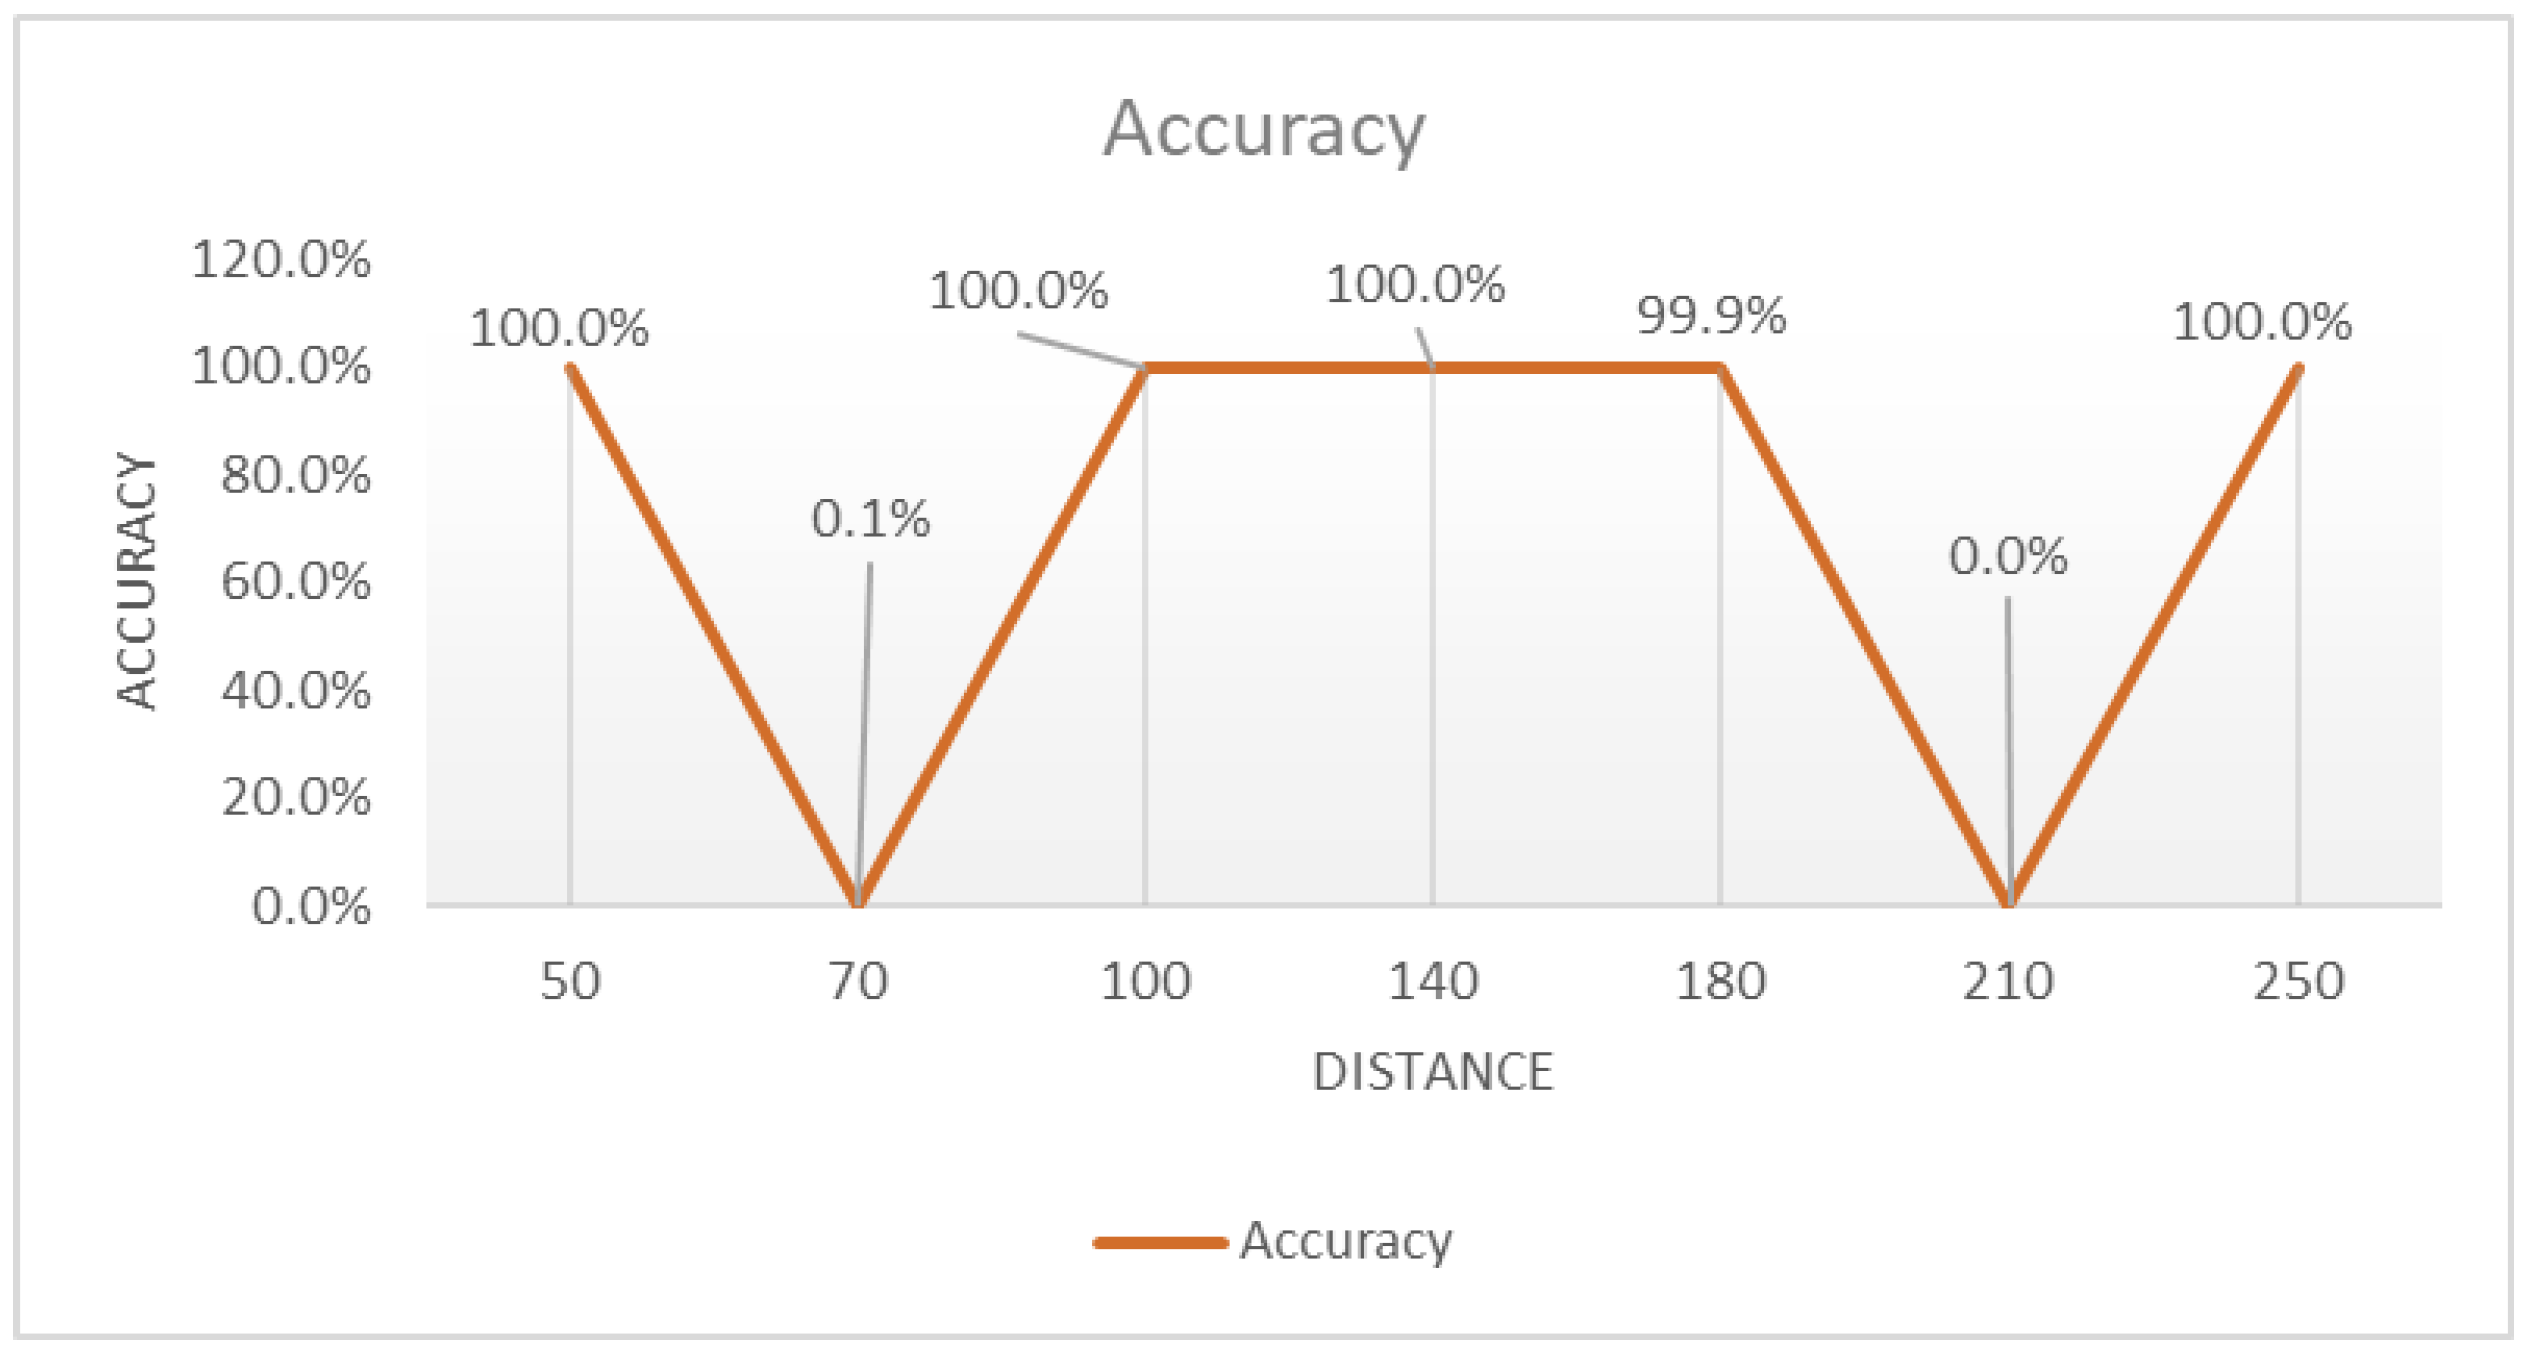
3.5. Round Static Obstacle Placed So It Covers Half the Path of the Prototype’s Detection Cone

The prototypes were moved to all the already marked testing distances and a log file was saved. Analyzing all the log files for those prototypes, the accuracy of the prototypes can be seen in Figure 15 and Figure 16.
The data behind these images are presented in Appendix D, Table A4.
Examining these results reveals that the PCM prototype maintains an average success rate of 83.7%. Comparing the results obtained in the previous test, the precision of messages for critical distances remains at 88.8%. As noted in the preceding section, for distances where erroneous messages occur in a proportion of 10% or more, it becomes apparent that these messages are overly alarming.
As evident for the WAVE prototype, the issue persists at 210 cm, and a new anomaly has arisen at 70 cm. At this distance, the error is deemed critical, as the user’s next move could lead to adverse consequences.
Upon a more thorough examination of the log file generated for this distance, it becomes apparent that the readings consistently surpass the actual distance by 1–2 cm. Subsequently, a corrective measure was introduced into the detection and decision program, successfully addressing the situation. To ensure the efficacy of this correction without introducing new problems, tests were conducted for a duration of 10 min, yielding positive results. As a result, the correction has been permanently integrated into the algorithm.
After resolving the issue in the algorithm, the new readings, shown in Figure 17, indicate the following:
As clearly seen, the accuracy of the prototype increased to 96%, with the precision for the critical distances reaching 98.9%. The correction was considered a success and was added in the final version of the algorithm.

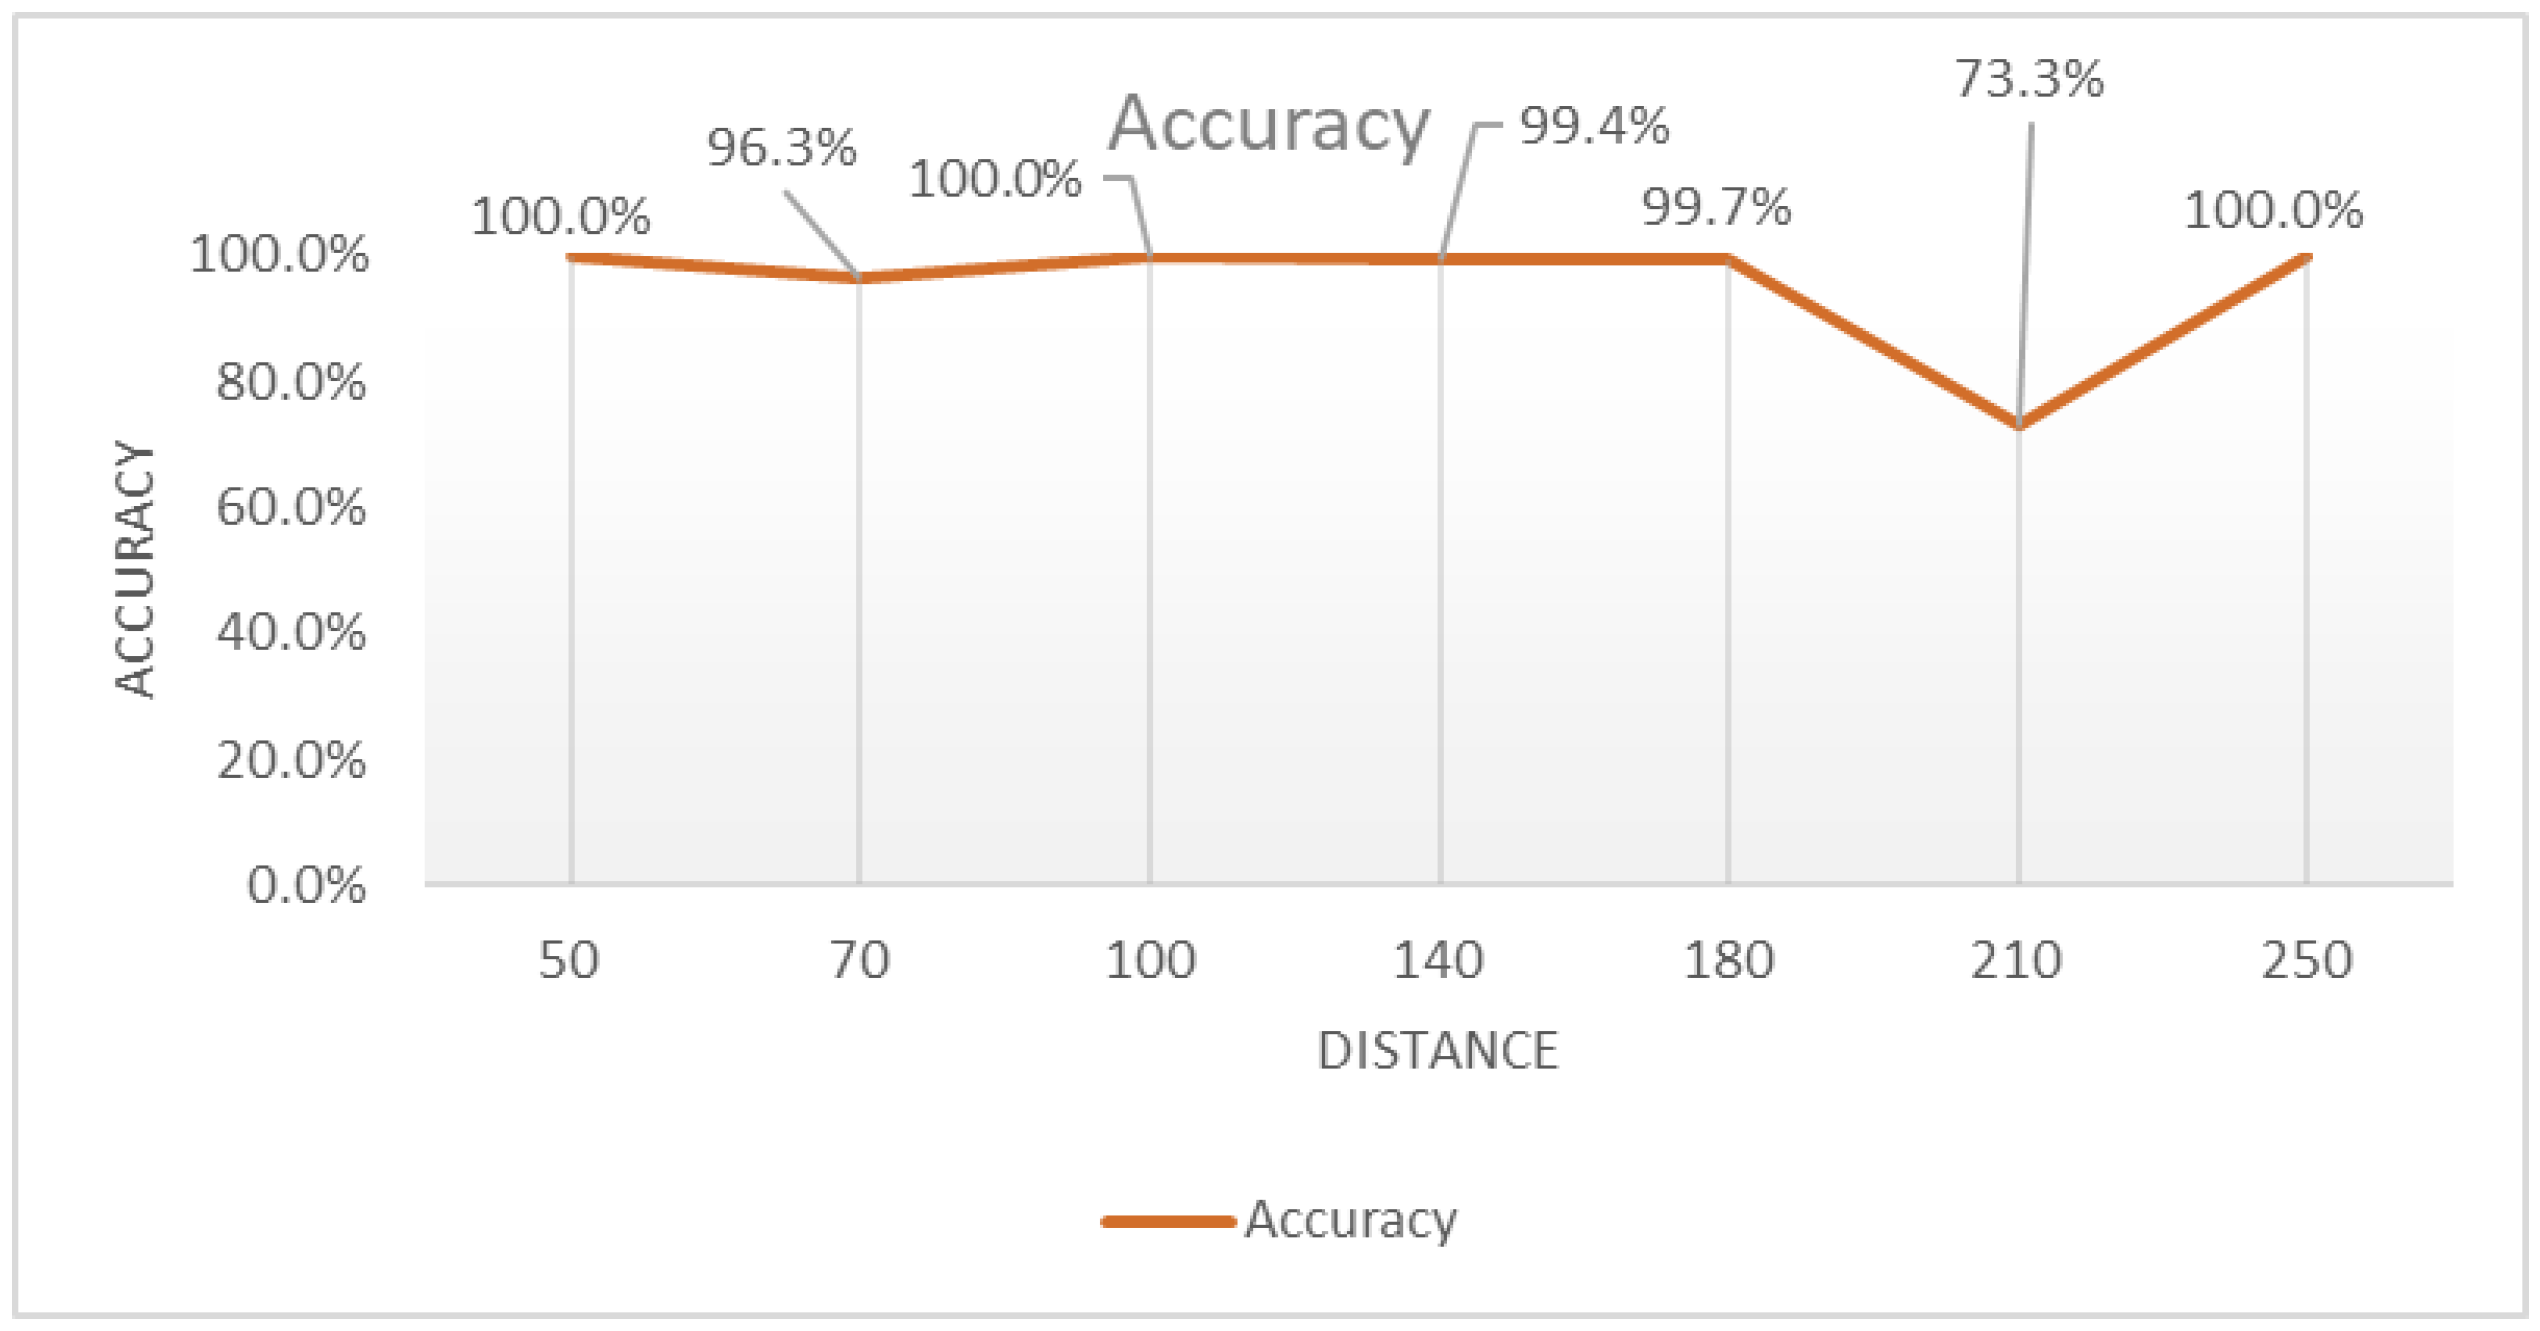
3.6. Round Static Obstacle Placed So It Covers a Quarter of the Path of the Prototype’s Detection Cone

The prototypes were moved to all the already marked testing distances and a log file was saved. Analyzing all the log files for those prototypes, the accuracy of the prototypes can be seen in Figure 18 and Figure 19.
The data behind these images are presented in Appendix E, Table A5.
Examining these latest results reveals that the PCM prototype maintains an average success rate of 89.3%. As seen in the prior test set, the precision of messages for critical distances remains at 97.6%.
It is noticeable that the recent correction implemented in the algorithm has been successful, ensuring the accuracy of the message transmitted for the 70 cm distance. Apart from the challenges encountered at 140 cm and 210 cm, the WAVE prototype maintains a success rate exceeding 90%. For shorter distances, this success rate reaches 100%. Repeated tests for 140 cm revealed an increased success rate of 98%. The potential cause of this error could be linked to the heating of the prototype during prolonged usage. This issue was observed when the prototype was used for more then 9 h without powering it down.
To sum up, the accuracy of the prototype is significantly influenced by the shape of the obstacle and its placement relative to the prototype in this scenario. Despite occasional deviations, the accuracy consistently remains above 80%, and for crucial distances, it surpasses 90%. Additionally, there is a pattern where erroneous messages correspond to a shorter distance than the actual one, making them more alarming. This feature serves as a protective measure for the user against potential hazards.

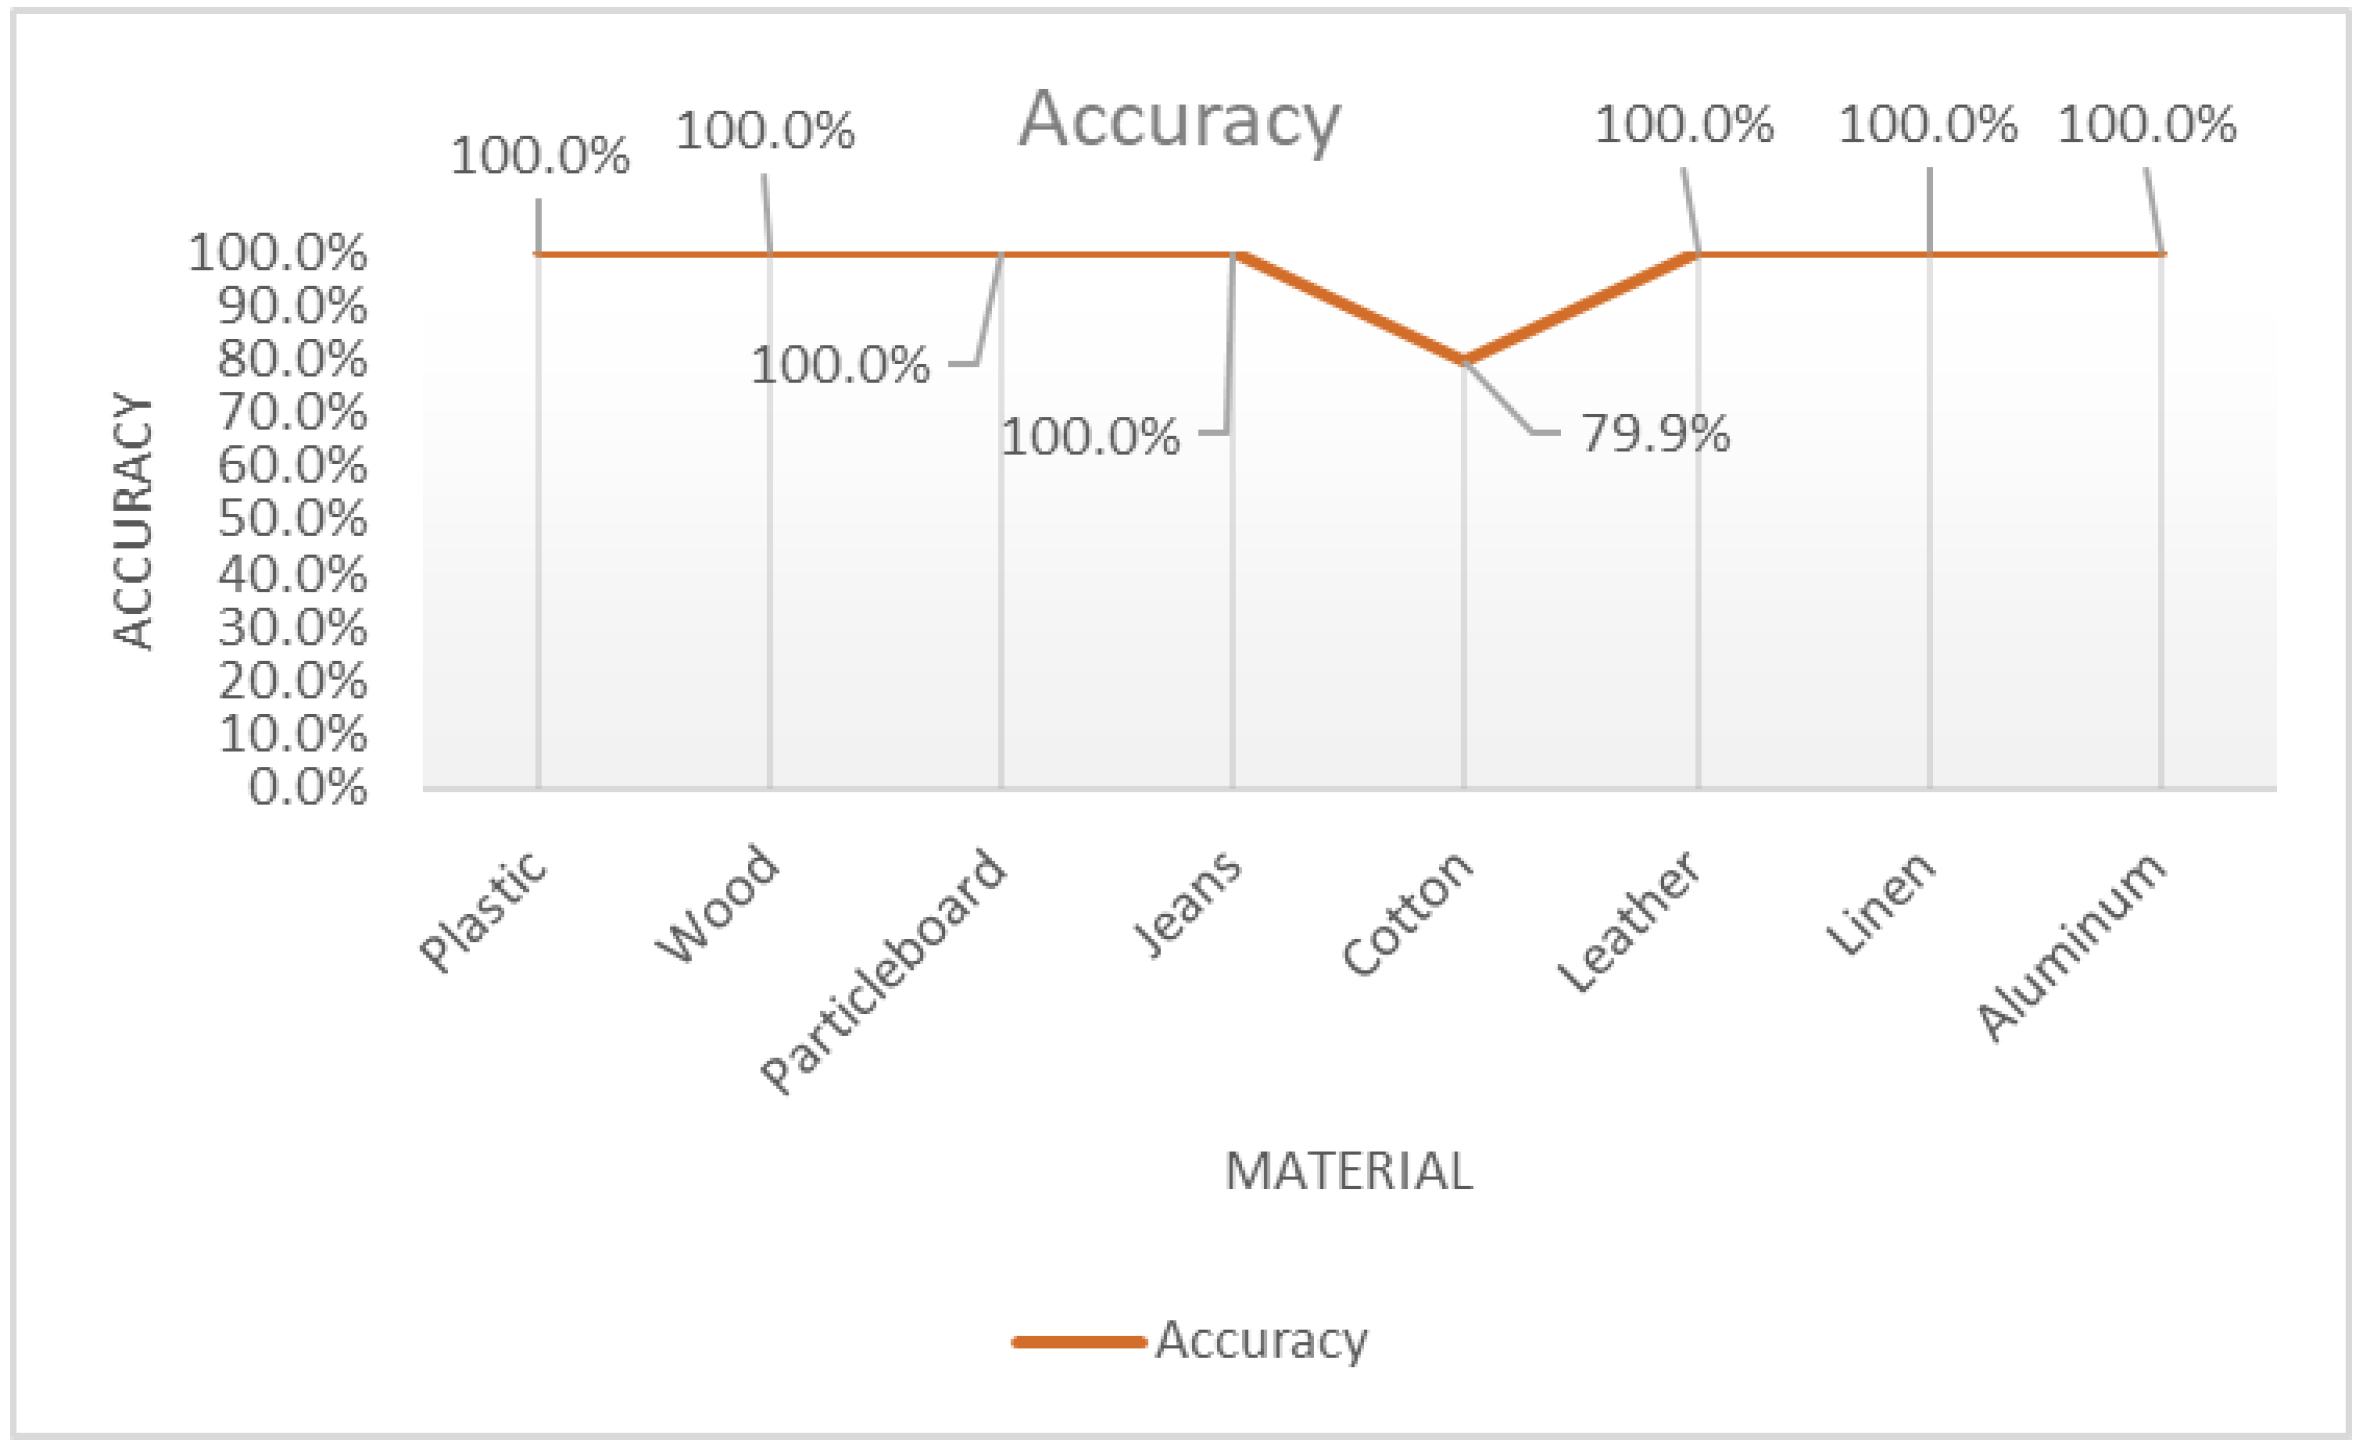
3.7. Tests with Various Materials Placed in Front of the Prototype

The upcoming series of tests aimed to assess whether materials within a building can absorb or influence the 40 kHz ultrasonic wave emitted by the HC-SR04 ultrasonic sensor.
These tests were performed utilizing only the WAVE prototype, as they pertain to the sonic wave and not variations between prototypes. The materials positioned at a distance of 50 cm from the prototype will encompass: metal, glass, mirror, concrete, plastic, wood, particleboard, MDF, canvas, denim, cotton, linen, aluminum, cardboard, leather, and paper. The prototype will conduct distance measurements for each material type over a period of 10 min.
The prototypes were moved to all the already marked testing distances and a log file was saved. Analyzing all the log files for those prototypes, the accuracy results are shown in Figure 20 and Figure 21.
In conclusion, no material was identified as being able to absorb the 40 kHz wave, while there might be specifically engineered materials designed to deflect or absorb this wave, the probability of encountering them in a civilian building is quite low. Therefore, it can be inferred that, regardless of the material composition of the obstacle, detection will occur, and the user will receive a precise message.
Based on the tests conducted thus far, it is evident that the shape and surface characteristics of the obstacle exert a more significant impact on the distance readings by the prototype than the material composition itself.

4. Conclusions

Following these comparisons and after discussions with representatives of the target group, the developed prototypes should possess the following characteristics:
  • User-friendliness.
  • High autonomy.
  • Low manufacturing cost.
  • Safety.
The initial prototype is economical, comprising solely a micro-controller programmable board, an HC-SR04 ultrasonic sensor, a 3.5 mm audio jack module, and a power supply consisting of a 9V battery and its holder. The algorithm measures the distance between the prototype and obstacles based on multiple readings at 200 ms intervals. It determines the danger level for the user and transmits an audio message. In this prototype, the message is embedded in the code written on the micro-controller of the development board. The transmitted message can be personalized in terms of both language and voice tone, offering users the option to use their own voice. Subsequently, this new code will be written to the micro-controller of the prototype’s development board.
The primary advantage of this prototype lies in its manufacturing cost. Its components, especially if low-cost micro-controller programmable board clones are utilized, can be acquired for approximately EUR 12. Additional costs include the casing and battery.
The drawbacks of this prototype include its size and the limitation that only someone with access to the source code can change the language of the messages. Furthermore, the necessity of the prototype connecting to the user’s ear with a headset restricts its placement.
The second prototype for indoor obstacle detection is similar to the first, but it uses recorded audio messages that are stored on an SD card. To read and write the audio messages on the SD card, it was necessary to include a read–write SD module in the prototype. The algorithm undergoes modifications; constants, preserving the messages transmitted by the PCM, are eliminated and replaced with a method that reads different wave files from an SD card that the user will hear. Additionally, the files must be copied to the root of the SD memory card and adhere to a specific naming convention.
Utilizing files written on an SD card to alter the language and tone in which messages are transmitted presents a significant advantage. Essentially, swapping an SD card with messages in English with another with files in Romanian will automatically change the language in which the user receives messages about the danger in front of them. This change requires no software knowledge or access.
A significant disadvantage resides in the size of the prototype. Additionally, the connection to the headset remains a limitation. Although changing the language by changing an SD card is the most significant advantage, it is also a disadvantage in that the replacement of the SD card can be challenging task for a visually impaired person due to its size and the fact that the port is not reversible.
As demonstrated by the tests conducted for these prototypes, the following conclusions can be drawn:
  • Static obstacles of square or rectangular shape placed in the user’s direction of travel will be detected and, depending on the distance between them and the prototype, will be signaled accordingly.
  • The variation in the reading count between the PCM and WAVE prototypes arises from the duration it takes for them to “speak” and the algorithm’s capability to automatically eliminate false readings.
  • Static obstacles of cylindrical shape are detected if the user is close to them, but at a greater distance, they may not be detected, or the distance between them and the prototype may be calculated incorrectly, leading to an incorrectly transmitted message.
  • Testing with different materials used as obstacles has shown that the 40 kHz sonic wave is not absorbed or reflected in a direction other than the correct one.
  • Under the conditions of very long usage of more than 9 h, the prototype can offer false readings due to overheating of the micro-controller. The addition of a radiator will add to the overall weight of the prototype and will create additional problems, so the advice is to power the prototype down after maximum 5 h of usage. This will be transmitted to the user by an alert message. This aspect will receive due attention in further developments of the algorithm.
Tests were performed for each case over a period of 30 min, except for material tests, which were conducted for 10 min. Each result of a complete test was saved as log files and analyzed, creating a two-dimensional confusion matrix whose elements were populated with the number of correct or false results.
The prototypes were miniaturized first using a breadboard, just like in the Figure 22. Materials used were a micro-controller Atmega 328, a 16 kHz quartz, two 22nF capacitors, and a 10 kOhm resistor.
After some testing, the prototypes were split into two parts: one part that has the micro-controller and the power supply and the second part hosts the ultrasonic sensor and the 3.5 mm jack module for the headset. In Figure 23, the“brain” of the detector and its components are shown, comprising the power supply and the micro-controller board.
In light of the detection part, the ultrasonic element, and the headset being specifically designed to be an add on and to serve in detecting obstacles that are above the ground and not connected to it, we provide a suggestion for the position on the body for the device to be worn; see Figure 24 and Figure 25:
The two parts are connected by a cable that allows the transmission of data from the ultrasonic sensor to the board and the transmission of audio messages to the jack module, as seen in Figure 26.

Author Contributions

Conceptualization, R.P. and R.G.V.; Hardware prototype development, R.P. and L.G.; Software development, R.P. and R.G.V.; Testing methodology, R.P., R.G.V. and I.-A.P.; Testing results analysis, R.P., R.G.V., I.-A.P. and L.G.; Supervision, R.P.; Validation, R.P., R.G.V., I.-A.P. and L.G.; Writing—original draft, R.P.; Writing—review and editing, R.G.V., I.-A.P. and L.G. All authors have read and agreed to the published version of the manuscript.

Funding

This paper was financially supported by “Network of excellence in applied research and innovation for doctoral and postdoctoral programs/InoHubDoc”, a project co-funded by the European Social Fund financing agreement no. POCU/993/6/13/153437.

Institutional Review Board Statement

Not applicable.

Informed Consent Statement

Not applicable.

Data Availability Statement

Data are available upon request from the corresponding authors. The data are not publicly available due to privacy.

Acknowledgments

The input and test results of this prototype were made possible thanks to the students of the Special School for the Visually Impaired from Cluj-Napoca and the Ilas Crina.

Conflicts of Interest

The authors declare no conflicts of interest.

Appendix A. Prototype Test Results for Square Obstacle Placement So It Covers Half of the Prototype’s Detection Cone

Table A1. Prototype test results for square obstacle placement so it covers half of the prototype’s detection cone.
DistancePCM Prototype ResultsWAVE Prototype Results
50Stop = 1101Stop = 996
Danger = 0Danger = 0
Caution = 0Caution = 0
Clear = 0Clear = 0
70Stop = 1551Stop = 994
Danger = 0Danger = 0
Caution = 0Caution = 0
Clear = 0Clear = 0
100Stop = 4Stop = 0
Danger = 1462Danger = 987
Caution = 0Caution = 0
Clear = 0Clear = 0
140Stop = 9Stop = 0
Danger = 1598Danger = 978
Caution = 0Caution = 0
Clear = 0Clear = 0
180Stop = 295Stop = 0
Danger = 0Danger = 0
Caution = 1195Caution = 947
Clear = 0Clear = 0
210Stop = 51Stop = 0
Danger = 1Danger = 2
Caution = 1435Caution = 976
Clear = 0Clear = 0
230Stop = 90Stop = 4
Danger = 0Danger = 0
Caution = 0Caution = 5
Clear = 1321Clear = 961

Appendix B. Prototype Test Results for Square Obstacle Placement So It Covers a Quarter of the Prototype’s Detection Cone

Table A2. Prototype test results for square obstacle placement so it covers a quarter of the prototype’s detection cones.
DistancePCM Prototype ResultsWAVE Prototype Results
50Stop = 1692Stop = 1029
Danger = 0Danger = 0
Caution = 0Caution = 0
Clear = 0Clear = 0
70Stop = 1416Stop = 993
Danger = 54Danger = 1
Caution = 0Caution = 0
Clear = 0Clear = 0
100Stop = 0Stop = 2
Danger = 1455Danger = 1019
Caution = 0Caution = 0
Clear = 0Clear = 0
140Stop = 69Stop = 0
Danger = 1413Danger = 995
Caution = 0Caution = 0
Clear = 0Clear = 0
180Stop = 16Stop = 5
Danger = 0Danger = 0
Caution = 1409Caution = 1027
Clear = 0Clear = 9
210Stop = 144Stop = 0
Danger = 0Danger = 0
Caution = 1309Caution = 998
Clear = 0Clear = 0
230Stop = 93Stop = 0
Danger = 0Danger = 2
Caution = 2Caution = 0
Clear = 1438Clear = 952

Appendix C. Prototype Test Results for Round Obstacle Placement So It Covers the Full Path of the Prototype’s Detection Cone

Table A3. Prototype test results for round obstacle placement so it covers the full path of the prototype’s detection cones.
DistancePCM Prototype ResultsWAVE Prototype Results
50Stop = 1517Stop = 835
Danger = 0Danger = 0
Caution = 0Caution = 0
Clear = 0Clear = 0
70Stop = 1045Stop = 885
Danger = 411Danger = 0
Caution = 0Caution = 0
Clear = 0Clear = 0
100Stop = 0Stop = 0
Danger = 1268Danger = 987
Caution = 0Caution = 0
Clear = 0Clear = 0
140Stop = 0Stop = 1
Danger = 340Danger = 1079
Caution = 811Caution = 7
Clear = 0Clear = 0
180Stop = 0Stop = 0
Danger = 0Danger = 1
Caution = 1258Caution = 968
Clear = 0Clear = 0
210Stop = 0Stop = 0
Danger = 0Danger = 0
Caution = 0Caution = 0
Clear = 1101Clear = 963
230Stop = 0Stop = 1
Danger = 0Danger = 1
Caution = 0Caution = 0
Clear = 1089Clear = 979

Appendix D. Prototype Test Results for Round Obstacle Placement So It Covers a Half of the Path of the Prototype’s Detection Cone

Table A4. Prototype test results for round obstacle placement so it covers a half of the path of the prototype’s detection cone.
DistancePCM Prototype ResultsWAVE Prototype Results
50Stop = 1476Stop = 997
Danger = 0Danger = 0
Caution = 0Caution = 0
Clear = 0Clear = 0
70Stop = 1291Stop = 1
Danger = 201Danger = 1000
Caution = 0Caution = 0
Clear = 0Clear = 0
100Stop = 258Stop = 0
Danger = 1217Danger = 988
Caution = 0Caution = 0
Clear = 0Clear = 0
140Stop = 189Stop = 0
Danger = 1243Danger = 973
Caution = 10Caution = 0
Clear = 0Clear = 0
180Stop = 221Stop = 0
Danger = 0Danger = 1
Caution = 1196Caution = 976
Clear = 0Clear = 0
210Stop = 226Stop = 0
Danger = 9Danger = 0
Caution = 0Caution = 0
Clear = 47Clear = 963
230Stop = 485Stop = 1
Danger = 0Danger = 1
Caution = 0Caution = 0
Clear = 943Clear = 957

Appendix E. Prototype Test Results for Round Obstacle Placement So It Covers a Quarter of the Path of the Prototype’s Detection Cone

Table A5. Prototype test results for round obstacle placement so it covers a quarter of the path of the prototype’s detection cone.
DistancePCM Prototype ResultsWAVE Prototype Results
50Stop = 1417Stop = 1101
Danger = 0Danger = 0
Caution = 0Caution = 0
Clear = 0Clear = 0
70Stop = 1392Stop = 998
Danger = 127Danger = 0
Caution = 0Caution = 0
Clear = 0Clear = 0
100Stop = 8Stop = 0
Danger = 1457Danger = 1020
Caution = 0Caution = 0
Clear = 0Clear = 0
140Stop = 3Stop = 0
Danger = 1505Danger = 0
Caution = 0Caution = 974
Clear = 0Clear = 0
180Stop = 162Stop = 0
Danger = 1Danger = 4
Caution = 1302Caution = 931
Clear = 0Clear = 39
210Stop = 310Stop = 0
Danger = 0Danger = 0
Caution = 862Caution = 89
Clear = 252Clear = 912
230Stop = 209Stop = 0
Danger = 0Danger = 0
Caution = 0Caution = 1
Clear = 1225Clear = 956

References

  1. World Health Organization. Vision Impairment and Blindness. Available online: www.who.int (accessed on 13 October 2022).
  2. European Blind Union. Available online: www.euroblind.org (accessed on 13 October 2022).
  3. Siu, Y.T.; Presley, I. Access Technology for Blind and Low Vision Accessibility; Aph Press, American Printing House for the Blind: Louisville, KY, USA, 2020. [Google Scholar]
  4. Wiener, W.R.; Welsh, R.L.; Blasch, B.B. Foundations of Orientation and Mobility; Afb Press: New York, NY, USA, 2010. [Google Scholar]
  5. Lancioni, G.E.; Singh, N.N. Assistive Technologies for People with Diverse Abilities; Springer: New York, NY, USA, 2014. [Google Scholar]
  6. Apostoaie, M.G.; Baritz, M.; Repanovici, A.; Barbu, D.M.; Lazăr, A.M.; Bodi, G. Visual Aid Systems from Smart City to Improve the Life of People with Low Vision. Sustainability 2023, 15, 6852. [Google Scholar] [CrossRef]
  7. Simões, W.C.; Machado, G.S.; Sales, A.M.; de Lucena, M.M.; Jazdi, N.; de Lucena, V.F., Jr. A Review of Technologies and Techniques for Indoor Navigation Systems for the Visually Impaired. Sensors 2020, 20, 3935. [Google Scholar] [CrossRef] [PubMed]
  8. Kuriakose, B.; Shrestha, R.; Sandnes, F.E. Tools and Technologies for Blind and Visually Impaired Navigation Support: A Review. IETE Tech. Rev. 2020, 39. [Google Scholar] [CrossRef]
  9. Ghebali, A. OrCam MyEye—The Best Device for visually impaired Persons. OrCam Techologies. 26 February 2023. Available online: www.orcam.com/ro-ro/orcam-myeye (accessed on 28 August 2023).
  10. ESight—Electronic Eyewear for the Visually Impaired. ESight Eyewear. Available online: www.esighteyewear.com/ (accessed on 28 August 2023).
  11. Radu, P.; Loredana, B.; Ramona, G. Ultrasonic indoor navigation prototype for visually impaired users. In Proceedings of the 2021 IEEE 27th International Symposium for Design and Technology in Electronic Packaging (SIITME), Timisoara, Romania, 27–30 October 2021; pp. 254–257. [Google Scholar] [CrossRef]
  12. Radu, P.; Loredana, B.; Ramona, G. Indoor Obstacle Detector for visually impaired Persons. In Proceedings of the 2023 23rd International Conference on Transparent Optical Networks (ICTON), Bucharest, Romania, 2–6 July 2023. [Google Scholar] [CrossRef]
  13. Circuitgeeks. Complete Guide for HC-SR04 Ultrasonic Sensor with Arduino. Circuit Geeks. 7 February 2021. Available online: www.circuitgeeks.com/hc-sr04-ultrasonic-sensor-with-arduino/ (accessed on 28 August 2023).
  14. Graham, D.; Black, R.; Veenendaal, E.V. Foundations of Software Testing: ISTQB Certification; Cengage Learning, EMEA: Andover, UK, 2020. [Google Scholar]
  15. Géron, A. Hands-On Machine Learning with Scikit-Learn and TensorFlow Concepts, Tools, and Techniques to Build Intelligent Systems, 2nd ed.; O’Reilly Media, Inc.: Sebastopol, CA, USA, 2019. [Google Scholar]
  16. Lee, W.-M. Python Machine Learning; Wiley: Indianapolis, IN, USA, 2019. [Google Scholar]
  17. Xu, L.S.; Yang, W.; Tian, H.X. A Channel Estimation Method for Ultrasonic Through-Metal Communication. IEEE Trans. Ultrason. Ferroelectr. Freq. Control 2022, 69, 823–832. [Google Scholar] [CrossRef]
Figure 1. Calculate distance between the obstacle and the prototype.
Applsci 14 01767 g001
Figure 2. Calibrate distance.
Applsci 14 01767 g002
Figure 3. Audio interface algorithm.
Applsci 14 01767 g003
Figure 4. Positioning of the square obstacle fully in front of the prototypes—view from above.
Applsci 14 01767 g004
Figure 5. Positioning of the square obstacle so it covers only half of the measuring angle of the sensor—view from above.
Applsci 14 01767 g005
Figure 6. Positioning of the square obstacle so it covers only a quarter of the measuring angle of the sensor—view from above.
Applsci 14 01767 g006
Figure 7. PCM square accuracy.
Applsci 14 01767 g007
Figure 8. WAVE prototype results.
Applsci 14 01767 g008
Figure 9. PCM prototype results accuracy.
Applsci 14 01767 g009
Figure 10. WAVE prototype results accuracy.
Applsci 14 01767 g010
Figure 11. PCM prototype accuracy.
Applsci 14 01767 g011
Figure 12. WAVE prototype accuracy.
Applsci 14 01767 g012
Figure 13. PCM prototype accuracy.
Applsci 14 01767 g013
Figure 14. WAVE prototype accuracy.
Applsci 14 01767 g014
Figure 15. PCM prototype accuracy.
Applsci 14 01767 g015
Figure 16. WAVE prototype accuracy.
Applsci 14 01767 g016
Figure 17. WAVE prototype accuracy after correction.
Applsci 14 01767 g017
Figure 18. PCM prototype accuracy.
Applsci 14 01767 g018
Figure 19. WAVE prototype accuracy.
Applsci 14 01767 g019
Figure 20. Materials first figure.
Applsci 14 01767 g020
Figure 21. Materials second figure.
Applsci 14 01767 g021
Figure 22. Detector micro-controller board.
Applsci 14 01767 g022
Figure 23. Detector micro-controller board.
Applsci 14 01767 g023
Figure 24. Placed on the head.
Applsci 14 01767 g024
Figure 25. Placed on the torso.
Applsci 14 01767 g025
Figure 26. Two-part detector.
Applsci 14 01767 g026
Table 1. Existing solutions for visually impaired persons.
SolutionAdvantagesDisadvantages
Walking stick
  • Easy to use
  • Easy to maintain
  • Easy to learn
  • Detects only obstacles connected to the floor
Guide dog
  • Easy to use
  • Reliable
  • Few dogs exist
  • Hard to train the dogs
  • Can have problems with other persons
Mobile applications
  • Easy to use
  • Many application types with different solutions for visually impaired persons
  • Few are focused on indoor navigation
  • Updates available and tested
  • Require internet connection
  • Require a mobile device
Special lines mounted on the floor
  • Easy to use
  • Work perfectly with the walking cane
  • Limited information
  • No information regarding non-floor-connected obstacles
Orcam glasses [9]
  • Specially designed to help users with visual problems
  • Lots of options like facial recognition, etc.
  • Expensive
  • Medium difficulty regarding learning how to use them
  • Limited quantity
eSight glasses [10]
  • Especially designed to help users with visual problems
  • Adjust light intensity
  • Expensive
  • Medium difficulty regarding learning how to use them
  • Limited quantity
Disclaimer/Publisher’s Note: The statements, opinions and data contained in all publications are solely those of the individual author(s) and contributor(s) and not of MDPI and/or the editor(s). MDPI and/or the editor(s) disclaim responsibility for any injury to people or property resulting from any ideas, methods, instructions or products referred to in the content.

