Technical Note

Study of Noise Effect of Slag Storage Technology on Surrounding Environment

Department of Business Management and Environmental Engineering, Faculty of Mechanical Engineering, Technical University of Kosice, 04022 Kosice, Slovakia
*
Author to whom correspondence should be addressed.
Appl. Sci. 2024, 14(4), 1678; https://doi.org/10.3390/app14041678
Submission received: 26 December 2023 / Revised: 9 February 2024 / Accepted: 14 February 2024 / Published: 19 February 2024
(This article belongs to the Special Issue Modernly Designed Materials and Their Processing)

Abstract

:
The metallurgical sector is one of the important sectors of the Slovak economy. Its integral part is the storage of metallurgical waste, which is accompanied by noise that bothers the inhabitants of the surrounding urban areas. This paper focuses on the analysis of the problem of noise propagation into protected areas located in the vicinity of the metallurgical plant. The paper describes a number of measurements that have been carried out at the slag landfill. Based on these measurements, simulations were performed using a mathematical model, and predictions of noise propagation in the exterior were made. Subsequently, noise reduction measures were proposed. The results obtained by the authors form a methodological basis for addressing such situations, since, during the solution, it was often necessary to deal with non-standard situations that were specific to the area of the technology addressed. This solution was then applied in real practice.

1. Introduction

The metallurgical industry is one of the biggest polluters of the environment. One of the decisive factors perceived by the inhabitants of the surrounding areas is noise. The noise produced by large industrial complexes usually troubles the inhabitants of protected areas within a distance of tens of kilometers. The production of large quantities of waste of various chemical and physical types is of great environmental significance. The technologies used to treat and dispose of these wastes are associated with high levels of noise emissions. At present, most of the waste is disposed of in landfills in the immediate vicinity of metallurgical plants. Metallurgical slag is a large-volume non-metallic waste from high-temperature metal production processes. One significant source of noise is the slag storage process, during which a hydraulic hammer deskulls the stuck slag, which is discharged from slag pots mounted on special single-purpose ladle cars.
The combined effects of harmful production factors such as solid aerosols, chemical factors, noise, and vibration cause risks to workers and inhabitants of the protected areas. One of the current problems is the noise pollution of the area. The areas affected are often large, as permissible values for the noise determinants are often exceeded at distances of several kilometers from the noise source. In this paper, the focus is mainly on the noise generated by the deskulling of slag pots containing metallurgical slag that is disposed of in a slag landfill.
Several authors have addressed the issue of noise in the metallurgical sector. This topic has been addressed in the work of Levi, E [1]. It is essential to address the acoustic characterization of steel industry by-products, particularly since it can lead to significant economic and environmental benefits. The authors investigated the acoustic properties of metallurgical materials using a four-microphone impedance tube and aimed to optimize their acoustic quality.
Schwietz, J. [2] focused on the estimation of the optimum moment for the most effective slag foaming with respect to the utilization of the noise level. The results obtained indicate that the correlation between the emitted noise level and the variation of the active power during melting can be used to define the starting moment of the slag foaming materials being fed into the furnace.
Innovations in the field of noise reduction in metallurgical plants of different countries were discussed in the article by the authors Butorina, I.V. et al. [3]. The establishment of a sanitary protection zone, the size of which is assessed by noise mapping, is considered an effective approach to noise reduction. At the same time, the authors recommended the use of sound absorbers with modern types of lining, vibration dampers to reduce the noise of rolling mills, and the installation of acoustic barriers to eliminate noise propagation in operating areas.
According to Botelho, C. [4], simultaneous exposure to ototoxic chemical products and noise can cause irreversible damage to workers’ hearing, even over short periods of exposure. A comparative study was conducted for workers in metallurgical plants exposed to noise alone and noise together with chemical products through audiometric tests. The results indicated that Group II had a proportionally higher rate of hearing loss compared to Group I, even after being exposed to aggressive substances for a shorter average time.
Abnormalities in technological plant operations can often be determined through regular analysis of the situation using noise maps. For example, noise management in the interior of a power plant is challenging due to its large area and the rather significant difference in the noise value distribution in different parts of the plant. Therefore, Young-Il-Kim [5] developed a noise mapping system that can model the inside of a turbine room and create a noise map by measuring the noise level at selected points. To increase the reliability of the model, the model was processed using the mapping system. The authors introduced noise reduction measures that can improve the environment, check the technology for abnormalities, and increase the reliability of the equipment through preventive maintenance.
The study reported in [6] aimed to find an identify, from a practical point of view, major policy aspects that can stimulate effective hearing conservation in working environments and are also feasible within a real industrial context. The findings were very relevant for the industry, because they identify the major influential factors for use in hearing protection on the work floor. This way, the results can serve as a base and inspiration for focused hearing conservation programs, improving the prevention of noise-induced hearing loss with effective efforts.
In [7], environmental factors that can have a negative impact on workers were introduced. The purpose was to investigate the impact of temperature, noise, and lighting on factory workers’ productivity and day-to-day health in a rubber compound manufacturing plant. The results revealed that higher levels of temperature and noise inside the factory can cause lower productivity levels. High temperatures may not only reduce productivity but also contribute to illnesses or heat stress symptoms such as headaches.
According to [8], noise is a harmful pollutant that leads to an unsanitary environment in urban areas. This study identified workers’ public health in a technological plant in Mosul City, Iraq. Workers’ health was assessed by measuring blood parameters and other biochemical parameters, such as TP, ALB, F.B.S, bilirubin, blood urea, and cholesterol. The results showed a significant change in the blood samples studied compared to the control sample. Depending on the results obtained, up to 30% of the workers tested had severe hearing troubles. This percentage was classified as acute hypoacusis (57%), severe hypoacusis (40%), and complete deafness (3%).
Manwar, VD. [9] discussed noise mapping in Indian mines and proposed three different models: one based on baseline operating conditions in two shifts (Situation A) and two other virtual situations where production targets were improved either by extending the working hours to three shifts (Situation B) or only by increased mechanization and no change in the duration of work (Situation C). In all situations, the predicted noise levels exceeded the noise limits of the process plant in the adjacent residential area. Residential areas close to crushing and raw material processing plants were susceptible to increased noise pollution. The authors recommended placing an acoustic barrier to reduce noise propagation in the vicinity of the crusher.
The objective of the paper by authors Casas, WJP et al. [10] was to identify the contribution of noise from external sources to the noise pollution generated by the process plant by comparing the sound pressure levels measured in its surroundings and those calculated by noise mapping. A metalworking manufacturing plant was selected for the measurements, and the measured data were entered into Sound Plan noise mapping software to identify the main noise sources by iteration. The placement of sub-barriers along some critically noisy walls was found to be effective, especially in the reference time interval of night, when the measures in place resulted in not exceeding the permissible levels of the noise determinants as defined by the relevant legislation.
Lokhande, S. [11] investigated industrial noise mapping for a metal processing plant and the ambient noise pollution from its operation. The complete study evaluated two different scenarios: in the first scenario, all the individual noise sources of the process plant were considered as point sources, while, in the second scenario, the entire plant was considered an area source. A regression plot was generated between the predicted and measured values for both scenarios individually. This study showed that the second scenario provided a more accurate noise prediction map than the first one.
Del Amor, MDD [12] presented a new methodology for the prediction, evaluation, and analysis of industrial noise sources, specifically for a wastewater treatment plant, in their paper. Continuous sound pressure equivalent levels were measured at several points in the vicinity of an industrial plant using an integrating sound level meter, and noise maps were subsequently generated from these values. Typical frequency spectra from each type of source were also used to calculate the source noise distribution. Several noise sources were selected to provide information on their contribution to the industrial noise around the plant. The methodology presented is a useful tool for predicting human exposure to noise and environmental impacts.

2. Materials and Methods

2.1. Materials

2.1.1. Study Area Description: Metallurgical Plant

The present paper deals with the impact of the operation of a metallurgical plant on the acoustic situation of the protected areas in its surroundings. The study mainly focuses on the noise generated during the discharge of the slag pots, which is the dominant source of disturbance in the vicinity of the protected areas of the metallurgical plant. The purpose of this paper is to determine the impact of the operation mainly on the protected areas with regards to the requirements of the Decree of the Ministry of Health of the Slovak Republic No. 549/2007 Coll. and to find out whether the permissible noise levels are exceeded.
In accordance with Decree No. 549/2007 Coll. of the Ministry of Health of the Slovak Republic, the surroundings of the metallurgical plant under consideration can be classified as category II (residential zones), which means that the permissible values of the determining variables of noise are 50 dB in the reference time interval day and evening and 45 dB in the reference time interval night. The operation of the slag landfill is continuous. The process equipment (grinding and slag sorting) is operated as required. Deskulling of the slag pots is carried out in summer at the reference time interval day and evening (6 am–10 pm) and, in winter, also at the reference time interval night (10 pm–6 am). Traffic noise associated with the operation of the metallurgical plant is not subject to assessment—car and rail traffic routes are located away from the assessment area and, due to their distance from the residential area, do not have any impact on the assessed protected area [13,14].
The dominant sources of noise in the operation of the metallurgical plant include noise from the deskulling of slag pots, handling of ladle cars, unloading of slag from slag pots, and other technological activities—transport, cooling, crushing, and sorting of slag.
A view of the metallurgical plant under consideration and the situation in its vicinity is shown in Figure 1.

2.1.2. Integrating Sound Level Meter

An integrating sound level meter of accuracy class 1 was used to measure the equivalent continuous sound pressure level and to perform the frequency analysis. During the measurements, the equivalent sound pressure level values were recorded with an averaging time of 125 ms and followed each other continuously throughout the measurement time. After subtracting the values that were not related to the monitored sound source (road traffic and human and animal sounds), the values of the determinant were established for the reference time intervals—day, evening, and night—related only to the monitored noise source. During the measurements, the microphone was mounted on a tripod at the required height and placed at the selected measurement location [15].
The measurement of noise immissions followed the internal working procedure of an accredited laboratory for the measurement and objectification of noise, which operates at the authors’ workplace.
When evaluating the results from the measurements, an expanded measurement uncertainty of U = 1.8 dB for a coverage factor of 2 (95% confidence interval) was determined in accordance with the internal regulations of the test laboratory.
Measurements of meteorological conditions in the outdoor environment were carried out simultaneously with the noise measurements.
Measurements at noise sources were carried out in order to determine the emission data of these sources. These data were used in the prediction. The measured data at the immission points were subsequently used for the calibration of the mathematical model [16].

2.1.3. Software: CadnaA

CadnaA 4.4.145 is a suitable tool for the calculation of outdoor noise propagation and for strategic noise mapping according to the EC Environmental Noise Directive. The software was used to calculate datasets from real and predicted noise values and for subsequent processing to produce noise maps.
The advantages of this software are
  • creating 3D models. The possibility of creating dimensionally accurate objects, devices, machines, etc. in 3D directly in the working environment of the software;
  • the possibility of defining the acoustic properties of objects, walls, partitions, devices, etc.;
  • the possibility to choose from 4 calculation methods;
  • calculation accuracy;
  • the possibility of finding the expected value of any point on the surface;
  • automatically takes into account the size of the space;
  • dependence of the calculation on the acoustic performance of the devices.
CadnaA limitations include
  • complexity of information and knowledge from the given area;
  • lengthy modeling;
  • higher price.
A provided experiment proved the suitability of CADNA software for the described application. The essence was to perform the adjustment (calibration) of the mathematical model so that the simulation result corresponds to the results measured in the field. CADNA software has the ability to set dozens of parameters that ultimately affect the simulation results. This software has been shown to be suitable for predicting noise propagation from such extreme sources as deskulling slag pots [17].

2.2. Methods

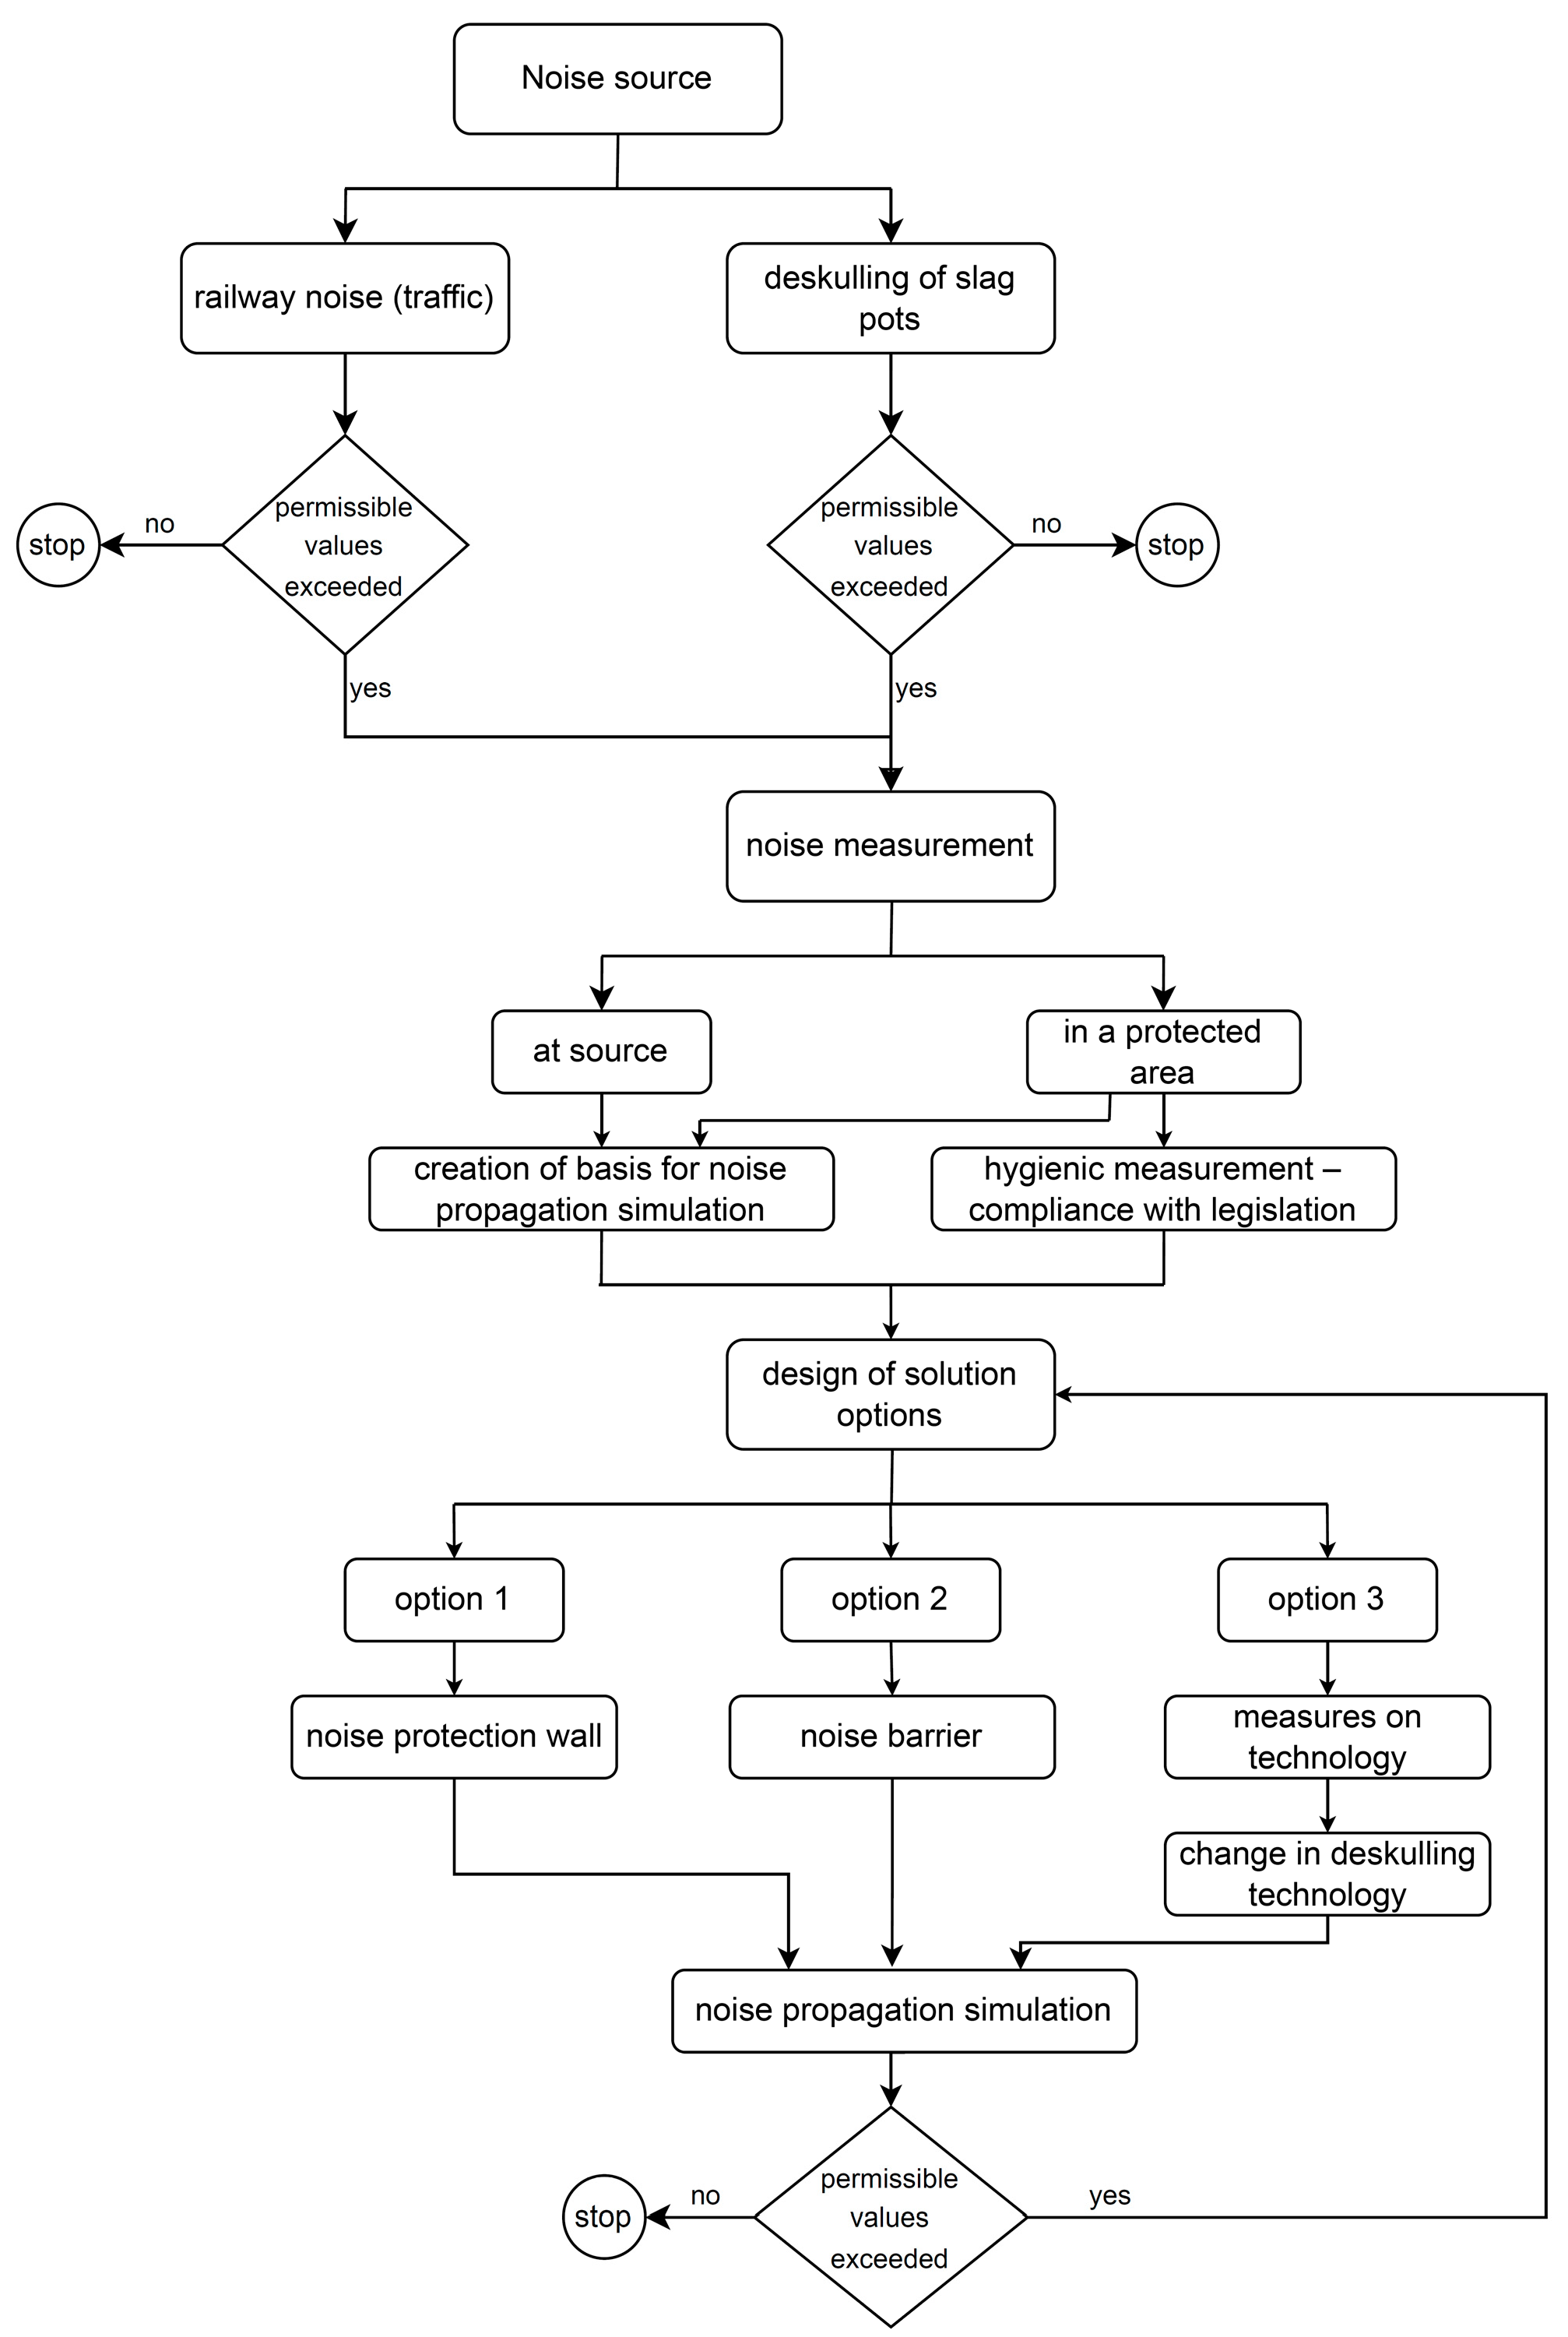
2.2.1. Design of a Methodology for Minimizing the Effects of Slag Storage Technology

The most significant effect of the slag storage technology complained about by residents from surrounding populated areas is noise. Excessive, annoying, disturbing noise, often exceeding permissible levels, has been a long-standing problem in the assessment area. The problem extends several kilometers from the source of the noise—the slag landfill, which is the waste material from the iron production technology.
The immediate source of noise is the deskulling of slag pots near the metallurgical plant. The slag generated during iron production is loaded into slag pots; see Figure 2a,b.
The critical activity that produces the highest noise levels is the deskulling of slag pots. This involves the pounding of a steel hammer weighing several tens of kilograms against a steel pot weighing several tons, in which slag is transported. In addition, the high noise levels generated during the discharge are of an impulsive nature.
The proposal of a methodology for solving the noise problem of slag dumping and its validation in practice is the basis of the present paper. To develop this methodology, an analysis of all available methods that would be able to meet the measurement requirements was carried out. Subsequently, real measurements were carried out to validate the methodology itself and to assess the range and suitability of the results obtained. The measurements were carried out in such a way that their results were also relevant to the requirements of statistical processing. The detailed methodology is shown in Figure 3.

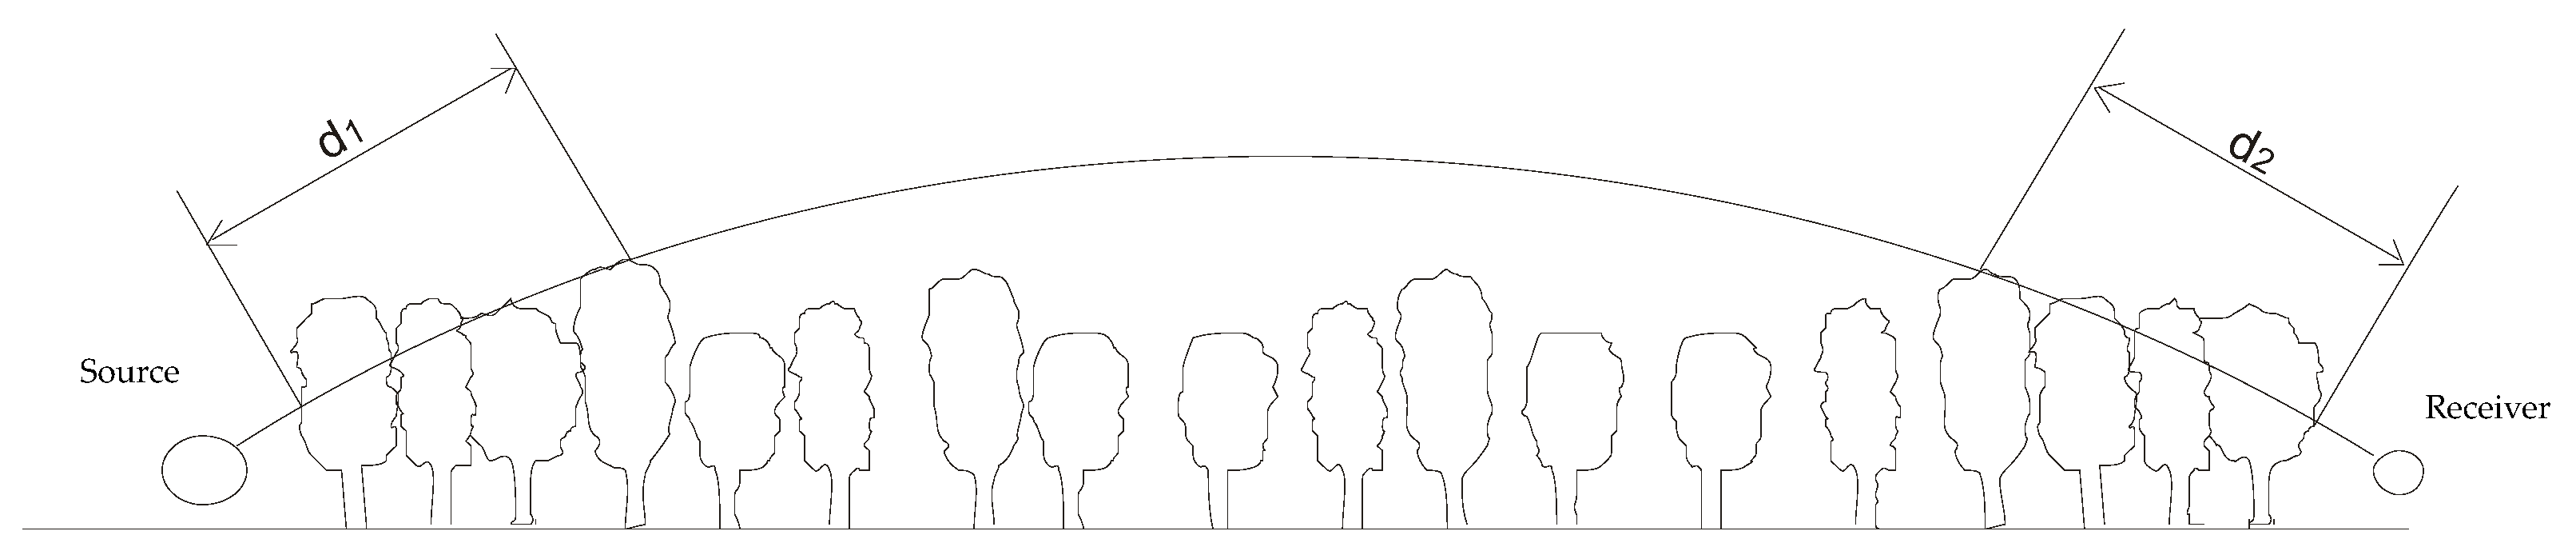
2.2.2. Theoretical Basis for the Calculation and Prediction of Noise Propagation

Modeling of Industrial Noise

Noise from industrial sources can vary in terms of the sizes/dimensions of the sources. An appropriate modeling technique must be established for the individual sources that are the subject of the assessment.
To calculate sound propagation using noise mapping methods, an input dataset is required that contains the following information:
  • source type (point, area, and line);
  • frequency spectrum of acoustic power in octave bands;
  • operating time composed on the basis of the annual average;
  • positioning using orthogonal coordinates;
  • directional characteristics of the source;
  • dimensions and spatial orientation;
  • operating conditions of the source [18,19].
The calculation of sound attenuation in the path of its propagation in the external environment makes it possible, thanks to the knowledge of the physical properties of a specific source, to predict the sound pressure level at the point of reception. The calculation is based on two special types of atmospheric conditions:
  • a decrease in the bending conditions of sound propagation (positive vertical gradient of the effective speed of sound propagation) from the source to the receiver;
  • homogeneous atmospheric conditions (zero vertical gradient of sound propagation speed) in the entire calculation area of propagation [20].
Tone components or impulse sounds emitted by industrial sound sources within the meaning of ISO 1996-2:2007 [21] are not included in this method. Temperature and humidity due to atmospheric absorption are calculated according to ISO 9613 1:1996 [22,23]. The calculations are given in octave bands ranging from 63 Hz to 8000 Hz.
However, based on methodological research, the authors consider the possible deviations of the numerical model. The paper [24] by authors Sukaj, S. et al. compared the numerical simulations of the noise propagation of wind towers to the experimental measurements performed inside houses, applying the ISO 9613. The results revealed that the application of the numerical model underestimated the actual measured value.
The final sound propagation model includes
  • calculation of attenuation under favorable conditions;
  • calculation of attenuation under homogeneous conditions;
  • geometric divergences;
  • the influence of the terrain surface and its properties;
  • diffractions;
  • reflections.

Source Description and Basic Equations

The computational assessment of industrial noise is based on the use of the ISO 9613-2 methodology. The CadnaA calculation program works on this methodology, and its algorithms correspond to the methodology used. The calculation model has been specified for favorable sound propagation conditions. The distribution of the noise load in the areas of interest was calculated on a 1 × 1 m grid at heights of 1.5 and 4.0 m above ground level. The calculation of noise from industrial sources was validated at reference calculation points at predefined heights corresponding to the calibration points at the time of the in situ measurements. These points were chosen for model validation at different distances from the processing plant. The noise map expresses the situation for the reference time intervals day, evening, and night.
Non-point sources of sound such as railway traffic or an industrial area must therefore be represented by a set of components, each of which has a certain acoustic power and vector. The attenuation calculated for the sound from a reference point within a part is taken to be representative of the sound attenuation for the whole part. Line sources can be divided into line parts and area sources into area parts, each of which is represented by a point source at its center. Point sources are assumed to be represented by the sound power obtained by standard measurement methods.
The equivalent sound pressure level in the downwind octave band at the receiving point L f T D W is calculated for each point source and its mirror sources and for each octave band of the audible spectrum according to the following equation:
L f T D W = L W + D c A   [ dB ] ,
where L W   —the sound power level in the octave band emitted by the point source and determined with respect to a reference sound power of 1 pW.
D c —a directionality correction describing the degree by which the equivalent sound pressure level from the point source deviates in a specified direction from that of the multidirectional source generating the LW sound power level. Dc is the sum of the directionality index Dl of the point source and the index DΩ, which takes into account the radiation of the sound source into a solid angle of less than 4π; for a multidirectional sound source radiating into free space, Dc = 0 dB.
A —sound attenuation in the octave band when propagating from a point sound source to an immission point.
The attenuation A in Equation (1) is given by the relation
A = A d i v + A a t m + A g r + A b a r + A m i s c   [ - ] ,
where A d i v —attenuation due to geometric divergence;
A a t m —attenuation due to sound absorption in the atmosphere;
A g r —attenuation caused by the ground surface;
A b a r —attenuation caused by a barrier;
A m i s c —attenuation caused by various other phenomena.
The individual corrections are described in Section Corrections.
The equivalent sound pressure level A in the downwind direction shall be calculated according to Equation (3) by summing the time-averaged squares of the respective sound pressures calculated using Equations (1) and (2) for each point source, for all their mirror sources, and for each octave band, as determined by Equation (3):
L A T D W = 10 log i = 1 n j = 1 8 10 0.1 L f T i j + A L f ( j )   [ dB ] ,
where n—number of contributions of the i-th source;
j—an index indicating an octave band with a center frequency of 63 Hz to 8 kHz;
A L f ( j ) —correction of the normalized A weighted sound pressure level.
The long-term time-averaged value of the sound pressure A L A T L T is calculated according to the following equation:
L A T L T = L A T D W C m e t   [ - ] ,
where C m e t —meteorological correction described in Section Corrections.

Corrections

1.
Geometric divergence A d i v
Geometric divergence is given by the spherical propagation of sound waves generated by a point source of sound in the open field. The attenuation due to geometric divergence is given by the following equation:
A d i v = 20 log d d 0 + 11   [ dB ] ,
where d —distance from the sound source to the receiver (m);
d 0 —reference distance of 1 m.
2.
Sound absorption in the atmosphere A a t m
The attenuation due to sound absorption in the atmosphere A a t m when propagating at distance d is given by the following equation:
A a t m = α d / 1000   [ - ] ,
where α—the attenuation coefficient due to sound absorption in the atmosphere (dB/km) determined in each octave band for the middle frequencies of that band [25,26,27].
3.
Ground surface effect A g r
The attenuation due to the ground surface A g r is primarily the result of the interference of sound waves reflected from the ground surface and sound waves propagating directly from the source to the point of immission.
The curvature of the propagation path towards the ground (propagation in the downwind direction) causes this attenuation to be determined primarily by the ground surface in the vicinity of the source and in the vicinity of the point of immission. This method of calculating the ground surface effect is only applied to a surface that is relatively flat and is horizontal or has a constant slope. Three distinct regions are defined for the attenuation due to the ground surface effect:
(a)
the source area is in the space from the source towards the immission point at a distance of 30 hs, with a maximum distance of dp, where hs is the height of the source and dp is the projection of the distance from the source to the immission point onto the ground plane;
(b)
the area of the immission point is in space from the immission point towards the source at a distance of 30 hr, with a maximum distance of dp, where hr is the height of the receiver;
(c)
the median area is at the distance between the source area and the immission point area; if dp < (30 hs + 30 hr), the source area and the immission point area overlap and there is no median area.
To calculate the attenuation due to the ground surface for a particular octave band, the following is required:
  • to calculate the attenuation component A s for the source area specified by the ground index G s ;
  • to calculate the A r component for the receiver area specified by the ground surface index G r ;
  • and to calculate the A m component for the median area specified by the ground surface index G m .
The total attenuation due to the ground surface for the octave band is calculated according to the following equation:
A g r = A s + A r + A m   [ - ] ,
4.
Attenuation due to the barrier A b a r
The attenuation due to the barrier A b a r shall be expressed in terms of the insertion loss. Diffraction at the upper horizontal edge of the barrier and at its vertical edges can be significant. For sound propagation in the downwind direction and for diffraction at the upper horizontal edge, the attenuation shall be calculated according to the equation
A b a r = D z A g r > 0   [ - ] ,
And for diffraction at the vertical edges by the equation
A b a r = D z > 0   [ - ] ,
where D z —insertion loss of the barrier in each octave band;
A g r —attenuation due to the ground surface without the barrier.
5.
Additional attenuation A m i s c
The A m i s c component contains the contributions to attenuation due to various effects not included in the general methods for calculating attenuation. These contributions include
A f o l —sound attenuation due to environmental propagation;
A s i t e —sound attenuation due to propagation through an industrial area;
A h o u s —sound attenuation due to propagation through a residential area [28].
The calculation of these additional attenuation contributions can be quantified by using a curved sound propagation path in the downwind direction approximated by an arc with a radius of 5 km (see Figure 4).

2.2.3. Methodology for Calculating Equivalent Noise Levels

A general procedure was used to predict noise propagation:
  • dividing the entire problem to be solved into subproblems that address a specific noise emission rate, in the form of inputting the sound power level A or sound pressure level A, from the point sources of acoustic energy used in the isophone prediction;
  • for noise sources whose sound power levels A vary over the time period under consideration, an equivalent value for the time period under consideration shall be determined;
  • for each of the point sources used, the direct propagation of acoustic energy in the outdoor environment, corrected for possible reflections from existing terrain and attenuation from existing objects, shall be addressed;
  • the resulting noise level at the site under consideration is calculated as a superposition of the effects from the individual elementary sources and the acoustic energy;
  • only the airborne noise component is considered;
  • the sound pressure values L p A e q are calculated for the reference time intervals day (6 am–6 pm), evening (6 pm–10 pm), and night (10 pm–6 am) [29,30].

3. Results and Discussion

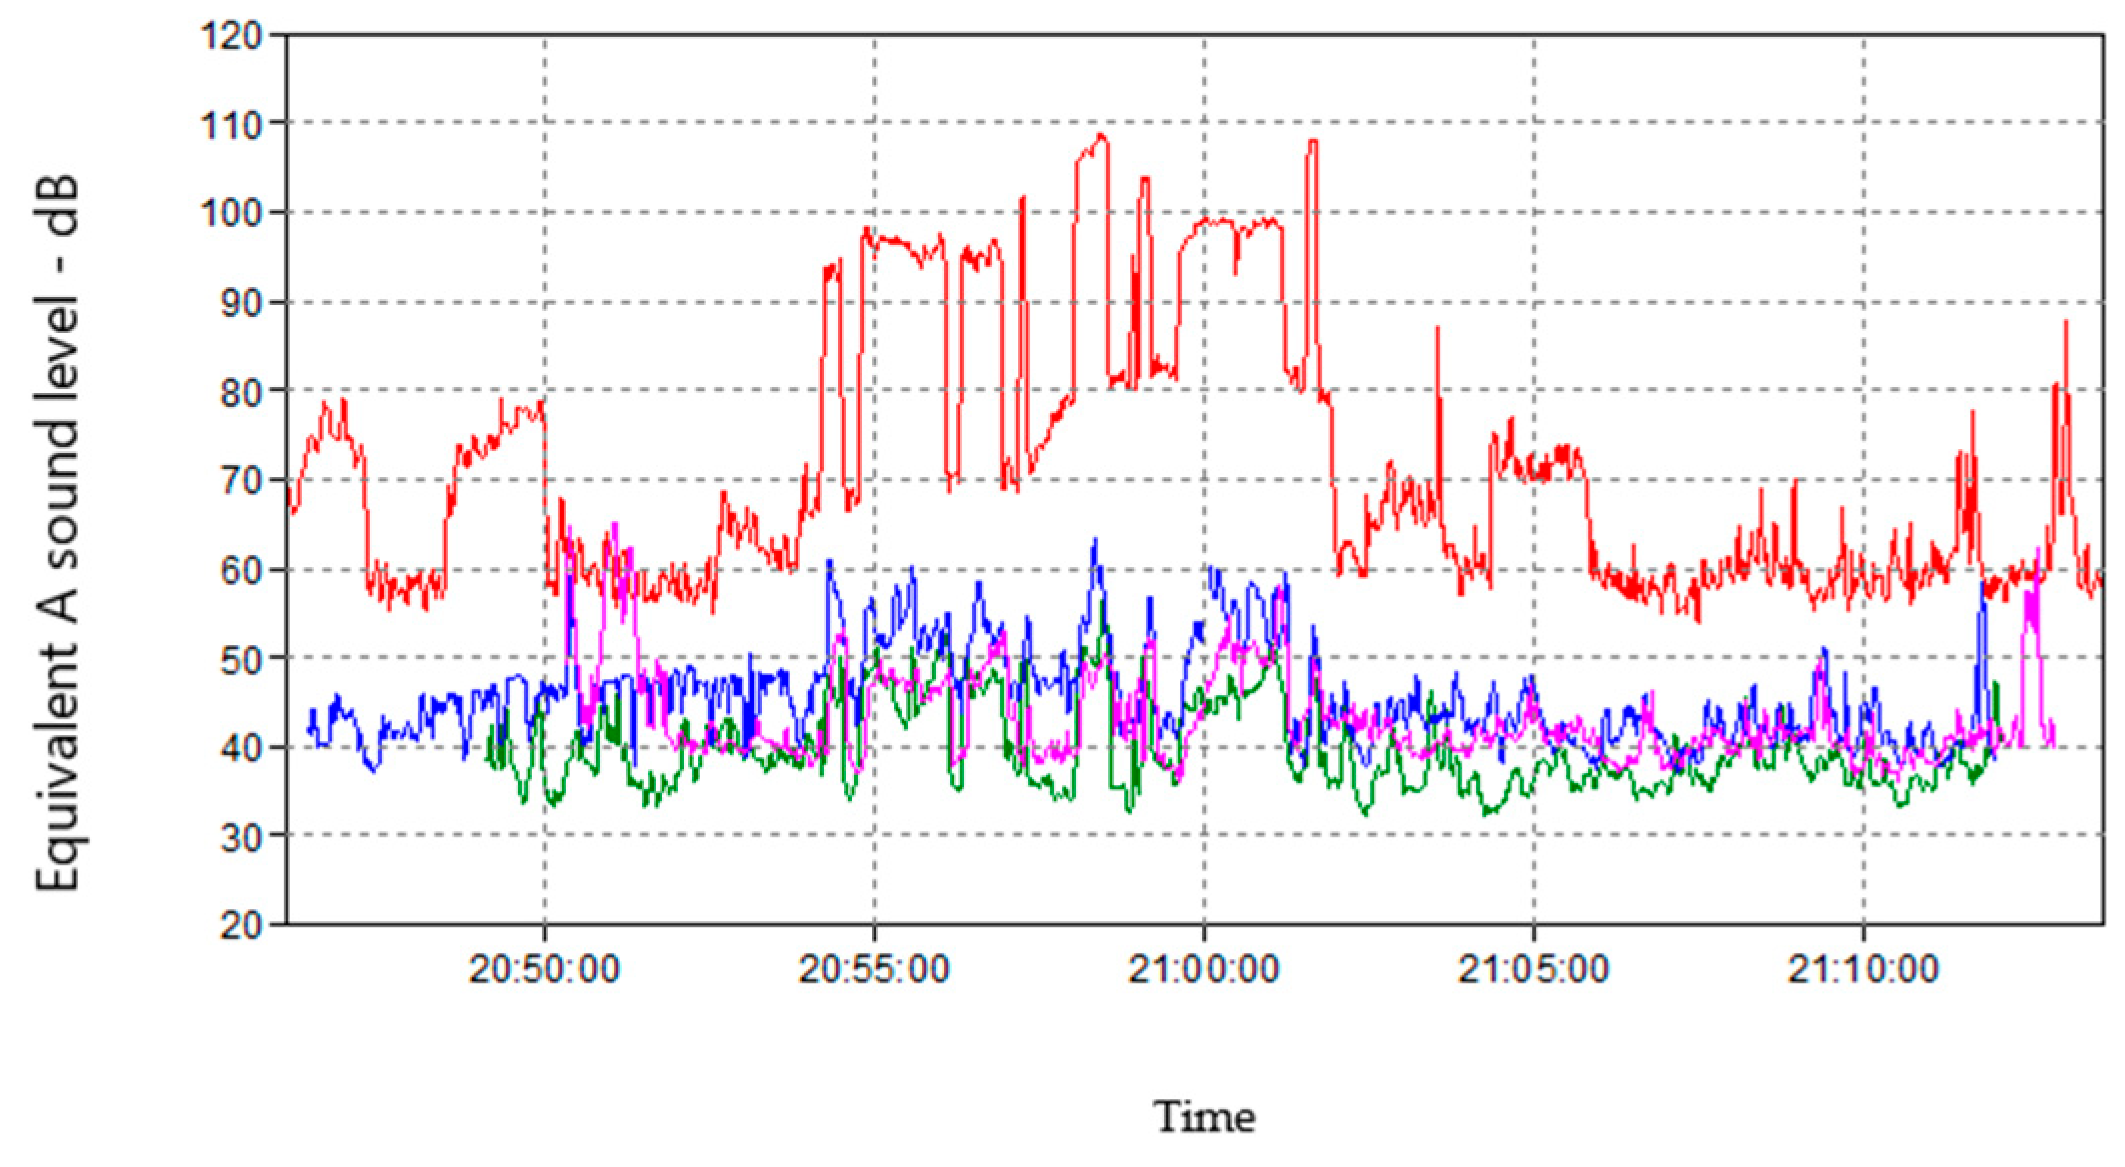
3.1. Measurement Results

In order to carry out the measurements, a detailed analysis of the individual acoustic events was first carried out, including the calculation of the emission data values for these events, namely
  • lifting the arm with a hydraulic hammer;
  • handling of the ladle car—plugging into the electrical grid;
  • lifting of the slag pot and the dumping of slag;
  • deskulling of the slag.
In order to determine the emission data from the slag pot deskulling, noise measurements were first made at the ME measurement point, which was located at a fixed distance of 10 m from the centerline of the railway track at the level of the slag pot that was currently being handled. The time history of the equivalent sound pressure levels of the whole process of one deskulling cycle, with a deskulling time of approximately 5 s, with the related activities is shown in Figure 5.
During the measurement at the ME measurement point, a manipulator with a hydraulic hammer deskulled the stuck slag that was being discharged from the slag pots. During this action, the manipulator operator lifted the hydraulic hammer arm and positioned it against the slag pot to use the hammer impacts to most efficiently release the slag residue from the slag pot. The number of strikes was stochastic, ranging from a few strikes to hundreds of strikes lasting several tens of seconds. The operator stops pounding as soon as the slag residue from the pot is released and dumped in the landfill.
Further noise measurements during the slag pot deskulling were made at the dump site and in the protected areas (residential areas). Their purpose was to determine the sound propagation conditions in the surrounding area. At the same time, background noise measurements were also carried out. The measurements were carried out at the following measurement points:
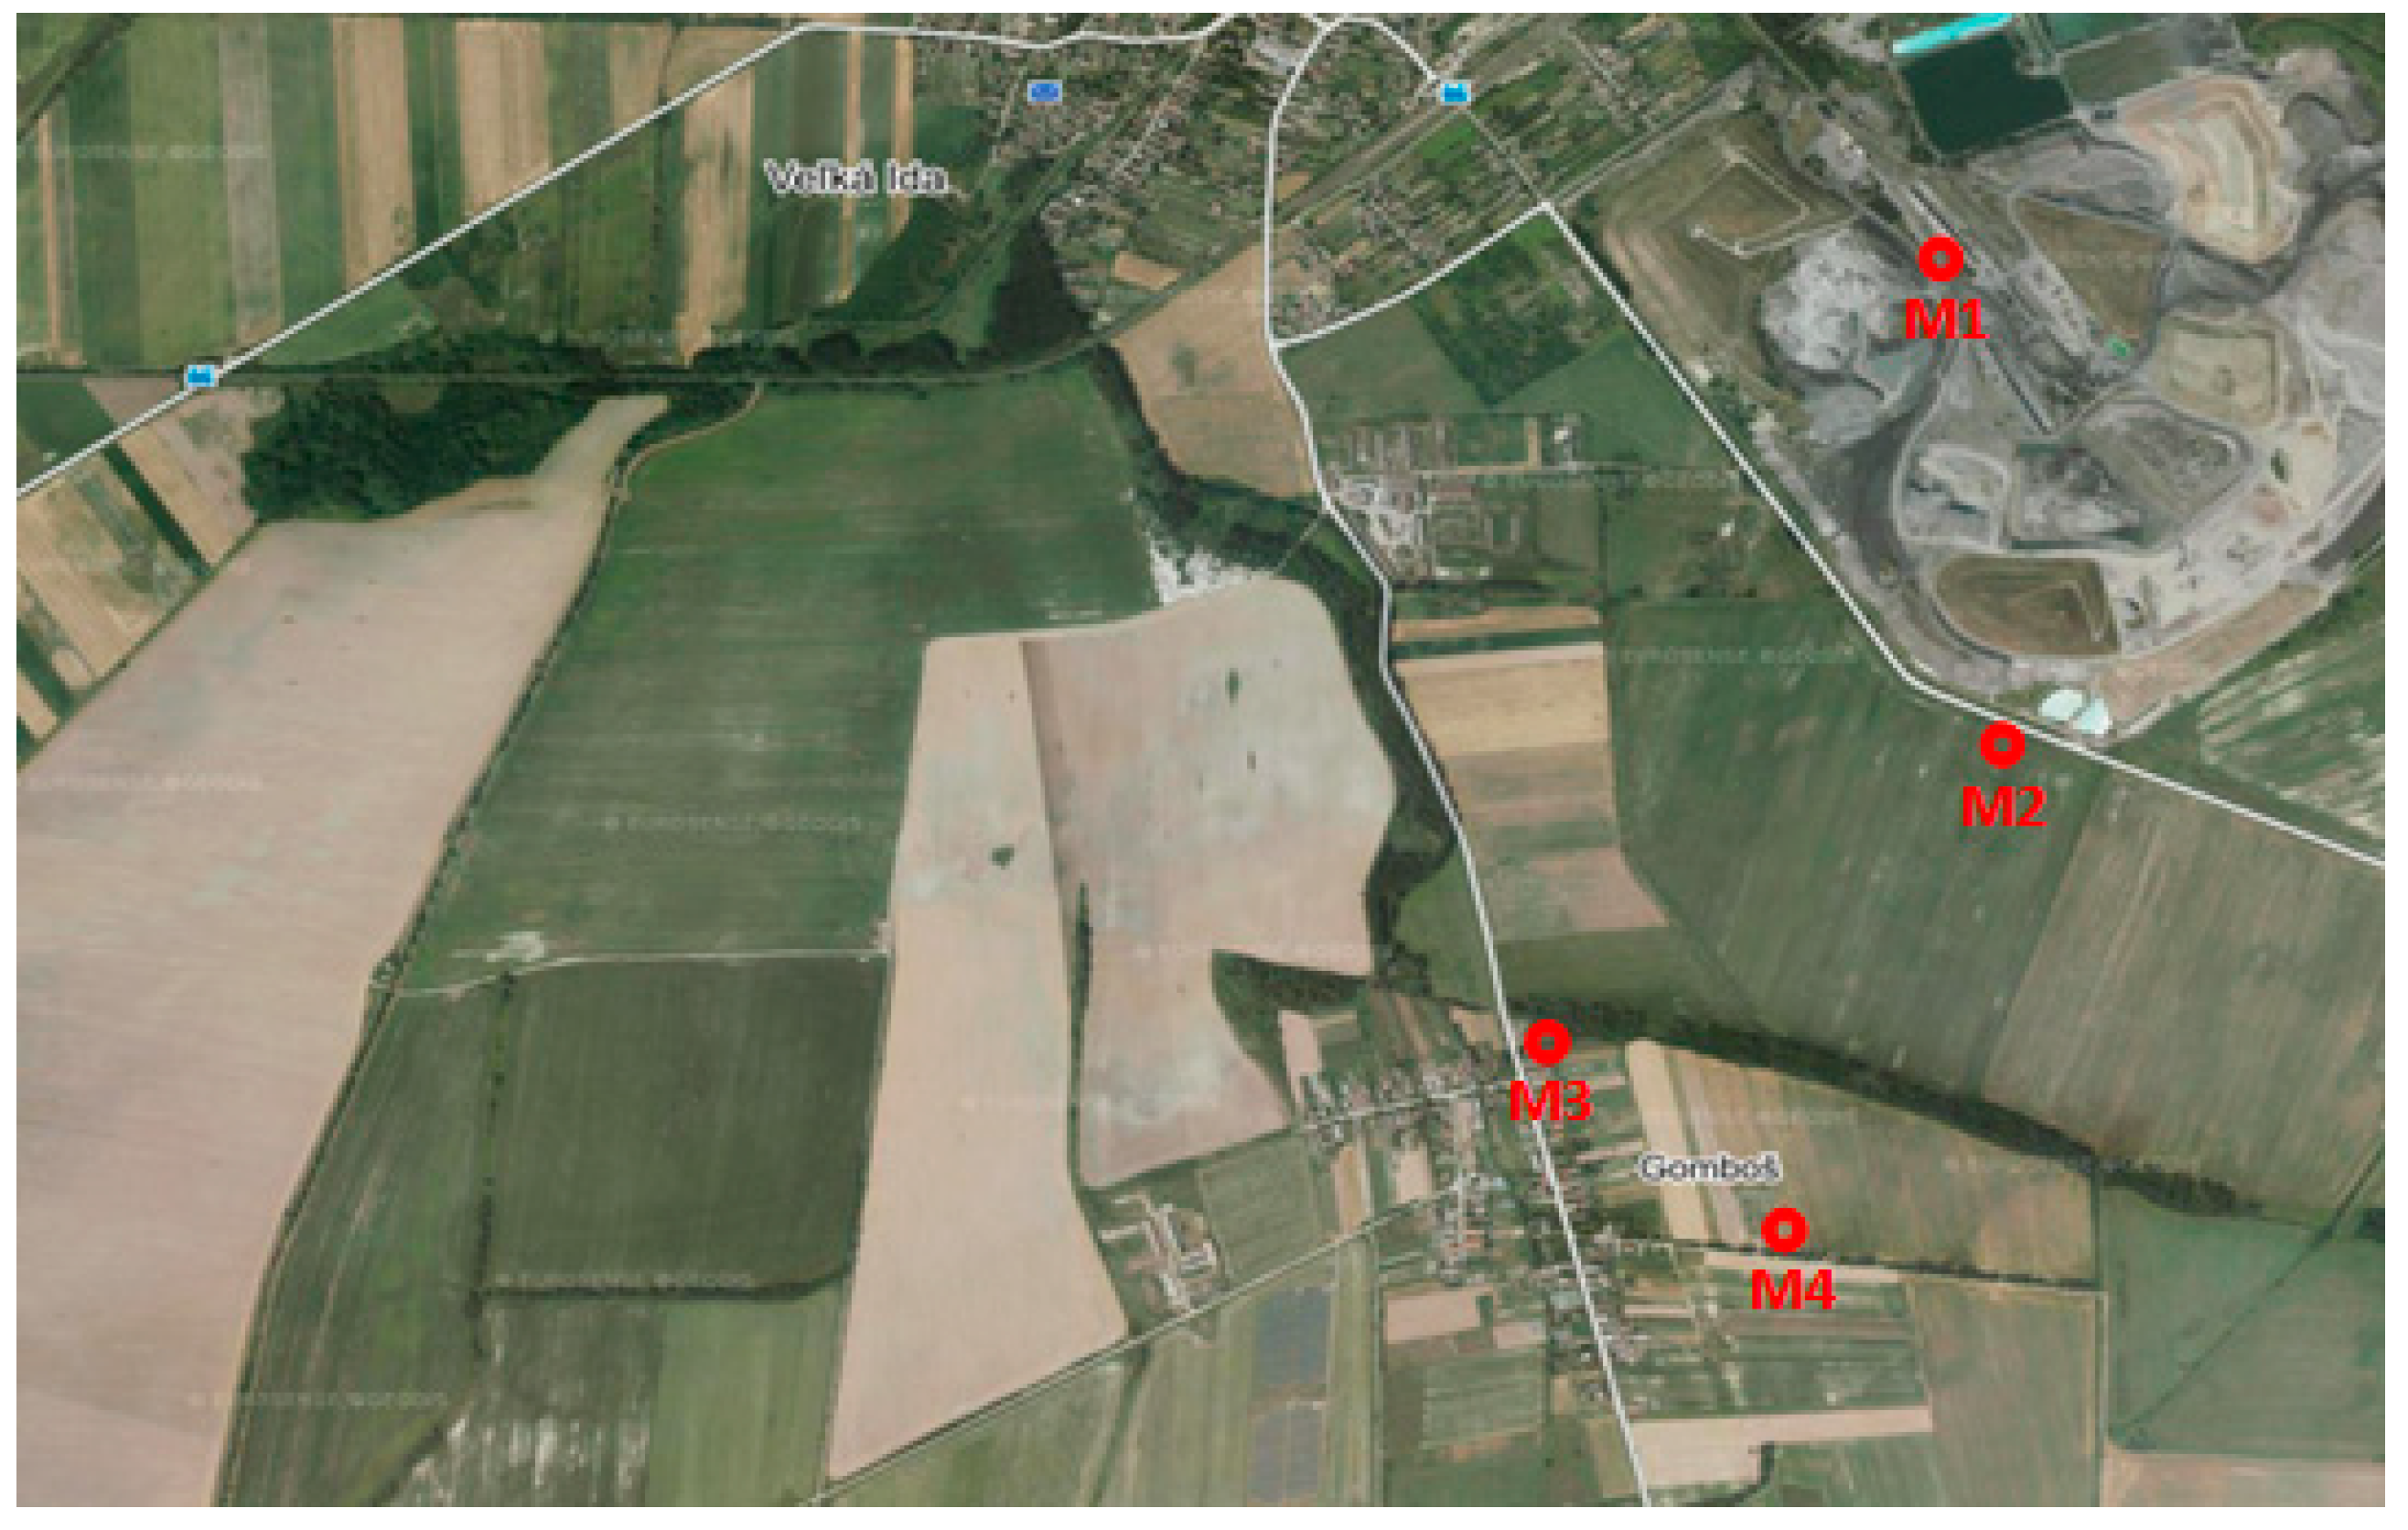
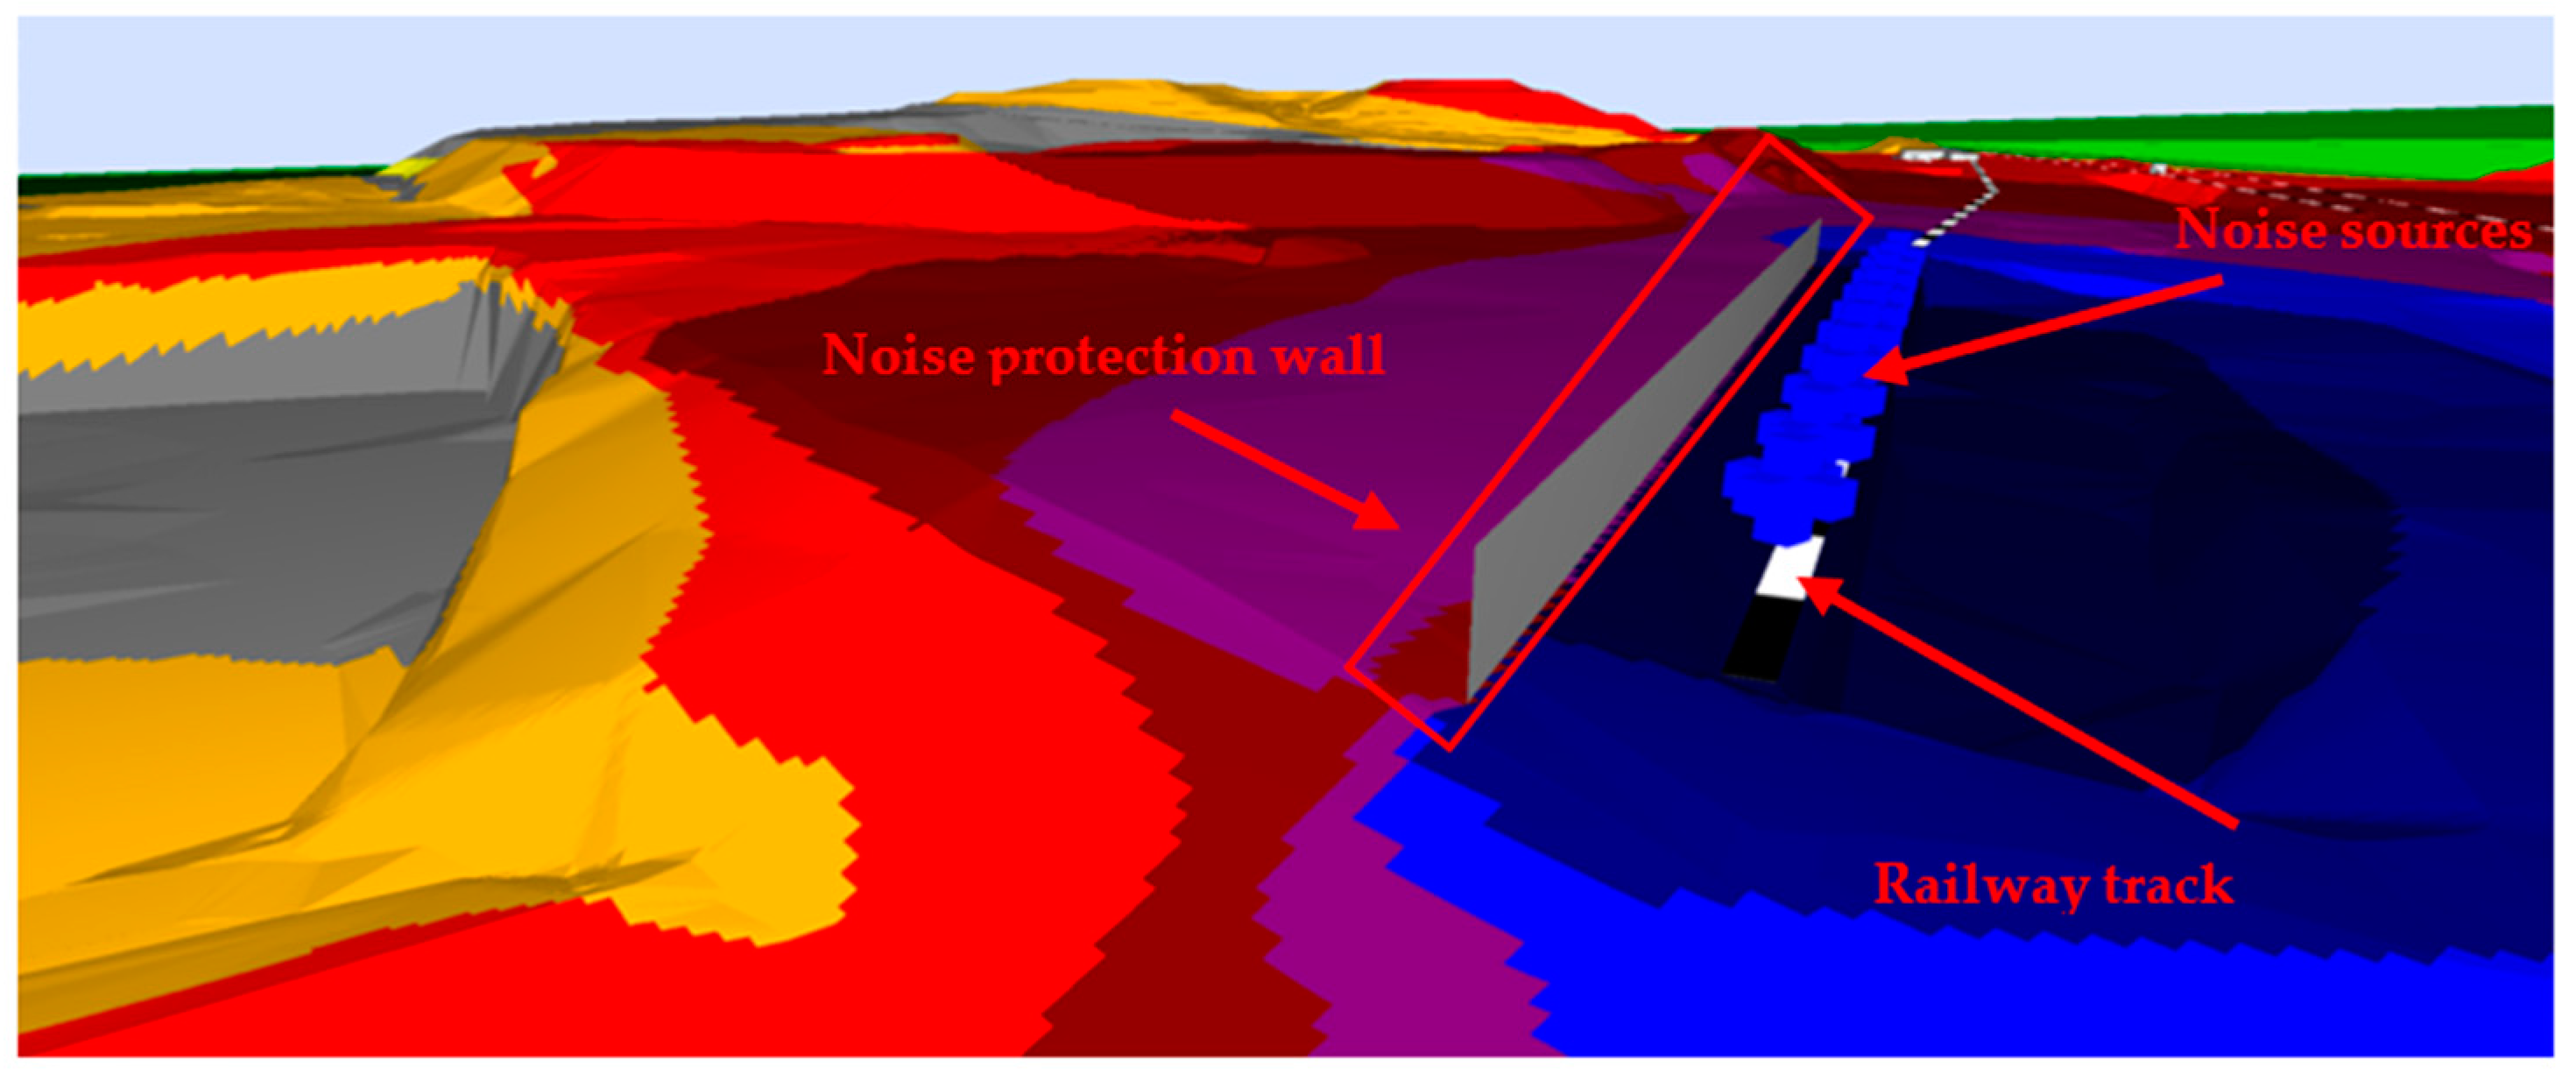
  • Measurement point M1 was located on the slag dump at a distance of 14 m from the track axis, on which a train with ten slag pots was at a height of 1.5 m above the ground level.
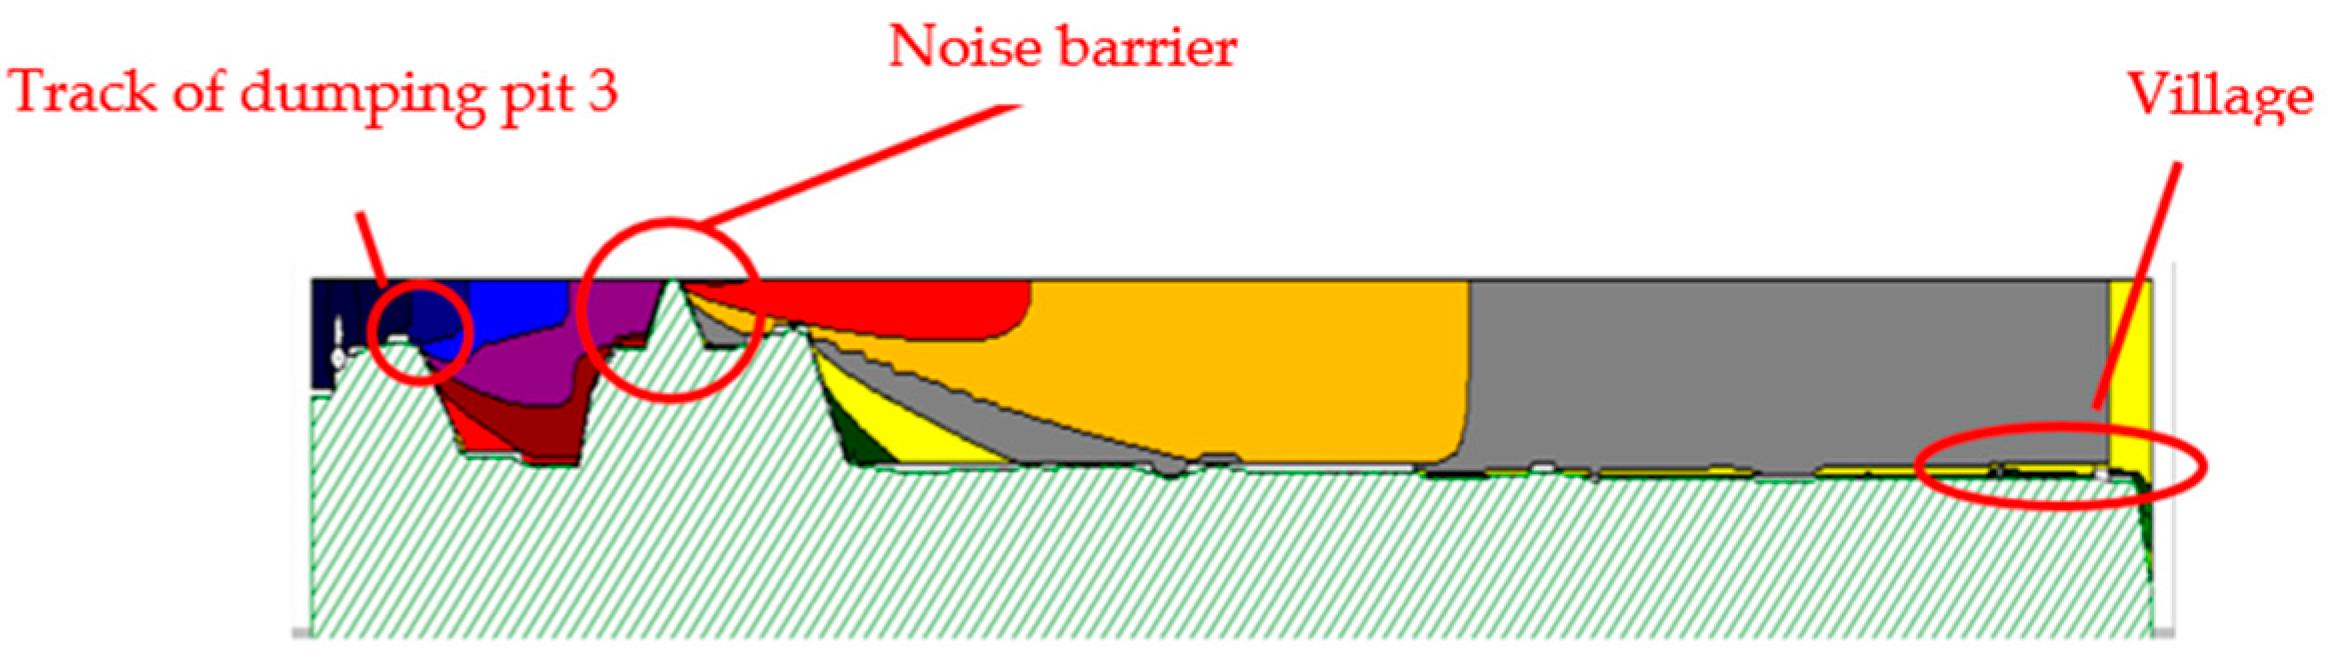
  • Measurement point M2 was located on the road next to the slag landfill 25 m from the road axis at the time of measurement without vegetation at a height of 1.5 m above ground level at a distance of 940 m from the source. The measurement point was in the acoustic shadow of the landfill.
  • Measurement point M3 was located in the village on the boundary of the land adjacent to the family house at a distance of 1710 m from the source at a height of 1.5 m above ground level.
  • Measurement point M4 was situated on the road on the boundary of the land adjacent to the family house at a distance of 1980 m from the source at a height of 1.5 m above ground level.
Measurements were performed repeatedly over a period of 3 months. Average values were taken into account during the evaluation.
Atmospheric conditions were monitored and recorded during the measurements, and their influence was taken into account during the evaluation of the measurements. In accordance with the valid Slovak Republic legislation, since the speed of wind propagation was less than 5 ms−1, the influence of atmospheric conditions was negligible.
The location of the measurement points is shown in Figure 6.
Figure 7 shows the time course of the equivalent sound pressure level at the reference measurement point M1 during one cycle of slag pot deskulling one slag pot. From the given waveform, high emission values are evident with peak values reaching almost 110 dB.
Figure 8 shows the time courses of the equivalent sound pressure level at all measurement points during one slag pot deskulling cycle. The emitted noise levels were practically unchanged between the cycles; only the duration of the discharge time was different. This time varied from five seconds to several tens of seconds.
In assessing the impact of noise on the protected areas, we considered the summation of the number of slag pots brought in for the month of September 2023.
The following tables show the results of the equivalent sound pressure level calculations for the reference time intervals day, evening, and night for
  • average values for September—the month in which the most slag pots were deskulled; the intensity of slag pot deskulling was taken from the data provided by the metallurgical plant (1655 slag pots during the reference time interval day, 661 slag pots during the reference time interval evening, and 1109 slag pots during the reference time interval night); see Table 1.
  • the day during which the most slag pots were deskulled; see Table 2:
    • reference time interval day—84 slag pots;
    • reference time interval evening—38 slag pots;
    • reference time interval night—60 slag pots.
The following calculations took into account the measurement uncertainty. For the sound level meter Nor-140/1225, we applied the expanded measurement uncertainty U = 2.1 dB.
From the results presented in Table 1, it is evident that the permissible values of the noise determinants for the reference time intervals day, evening, and night were exceeded. For this reason, we proceeded to the analysis of possible noise reduction measures and their design in the following solution.

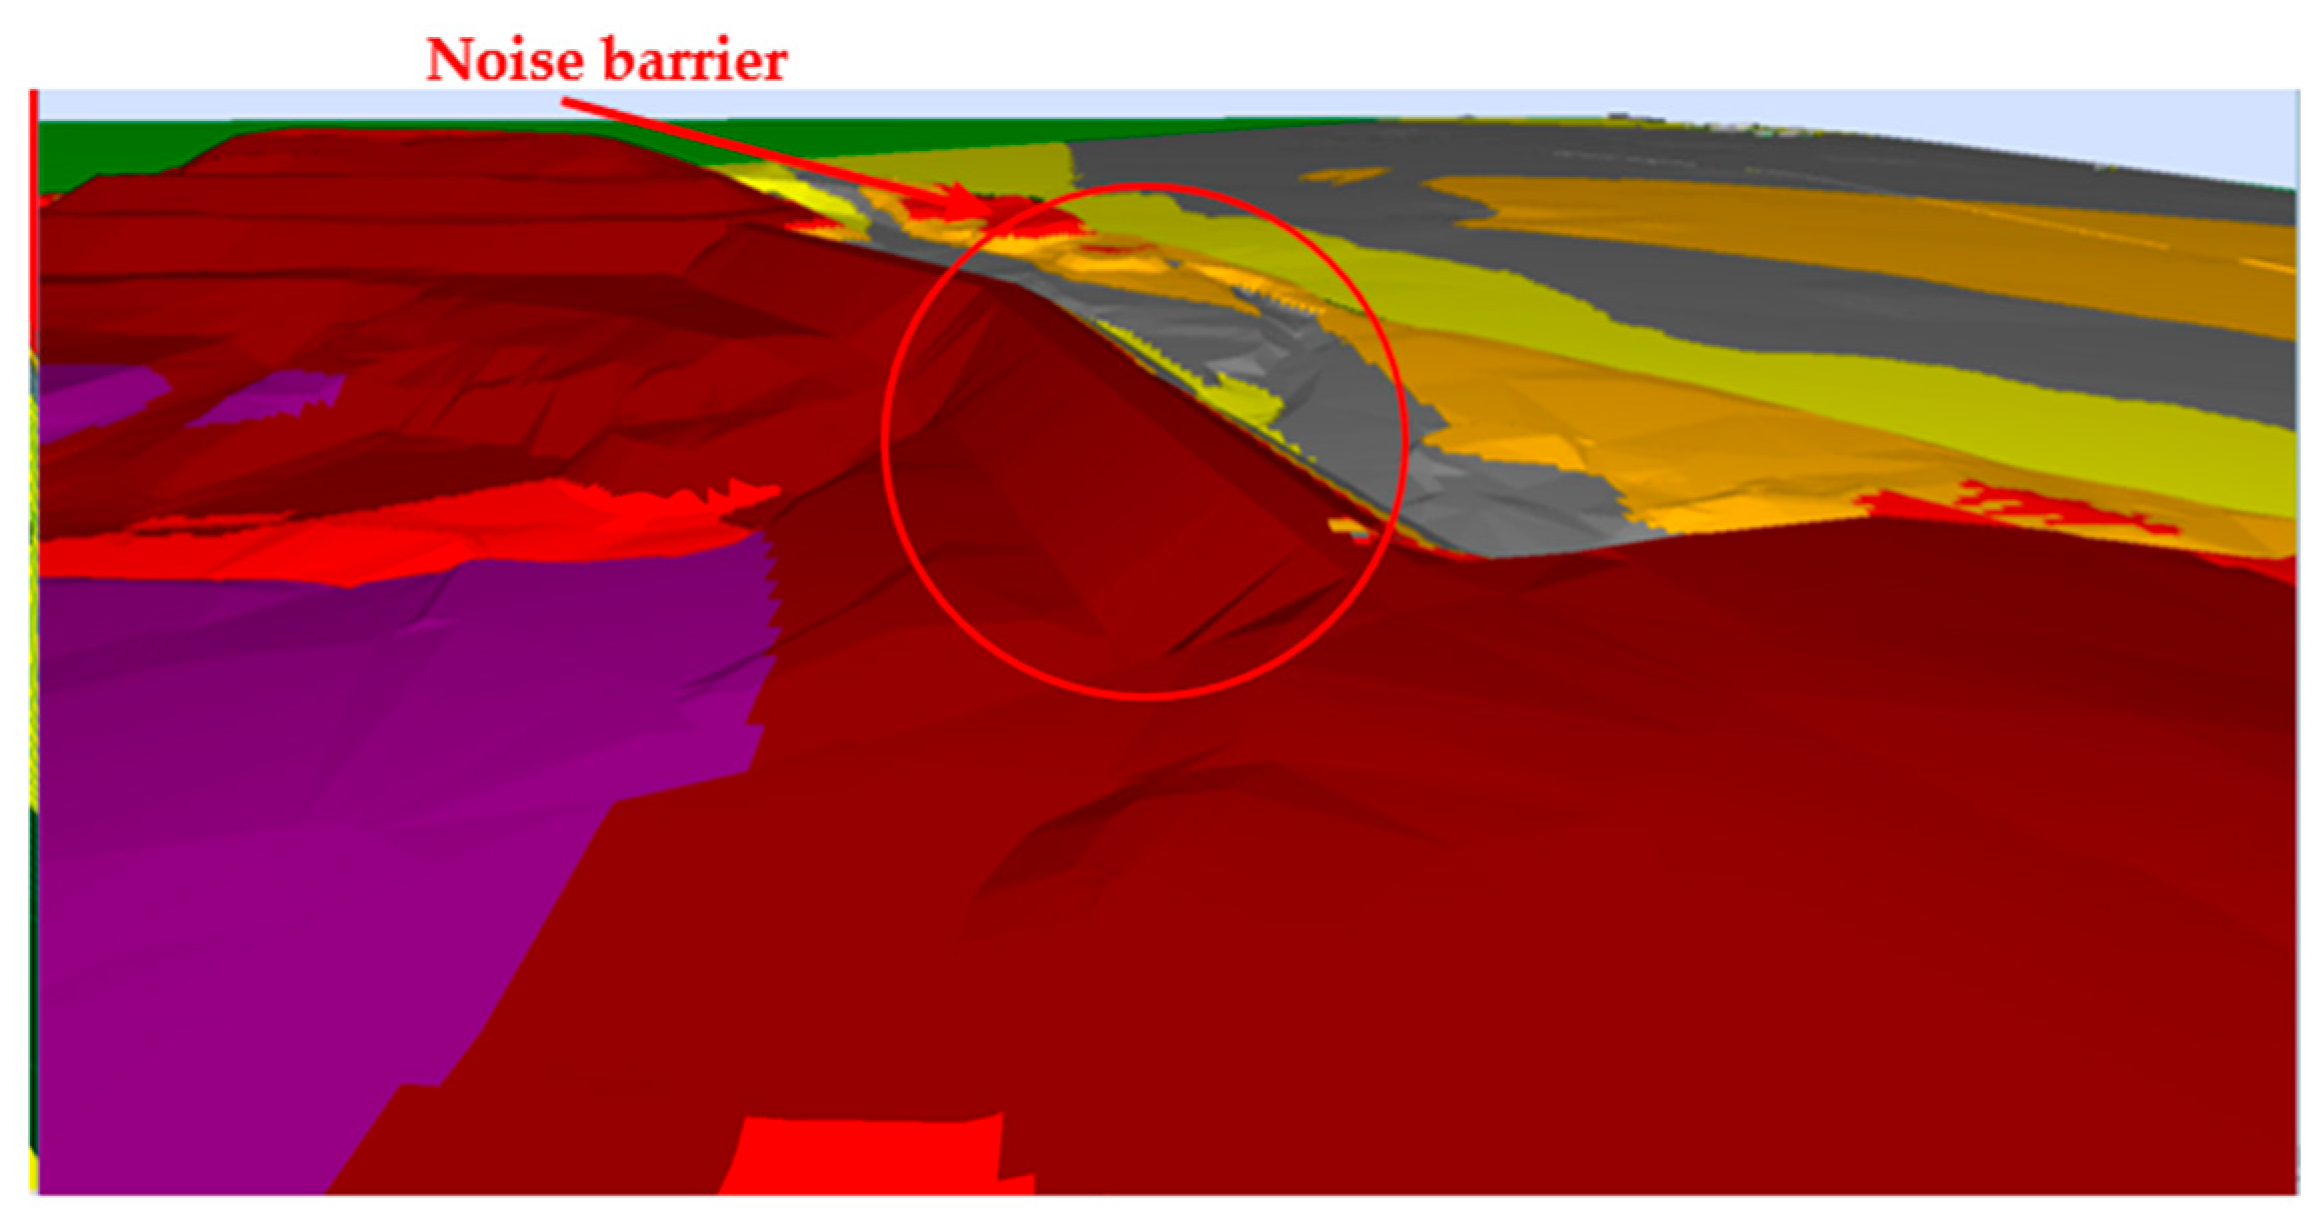
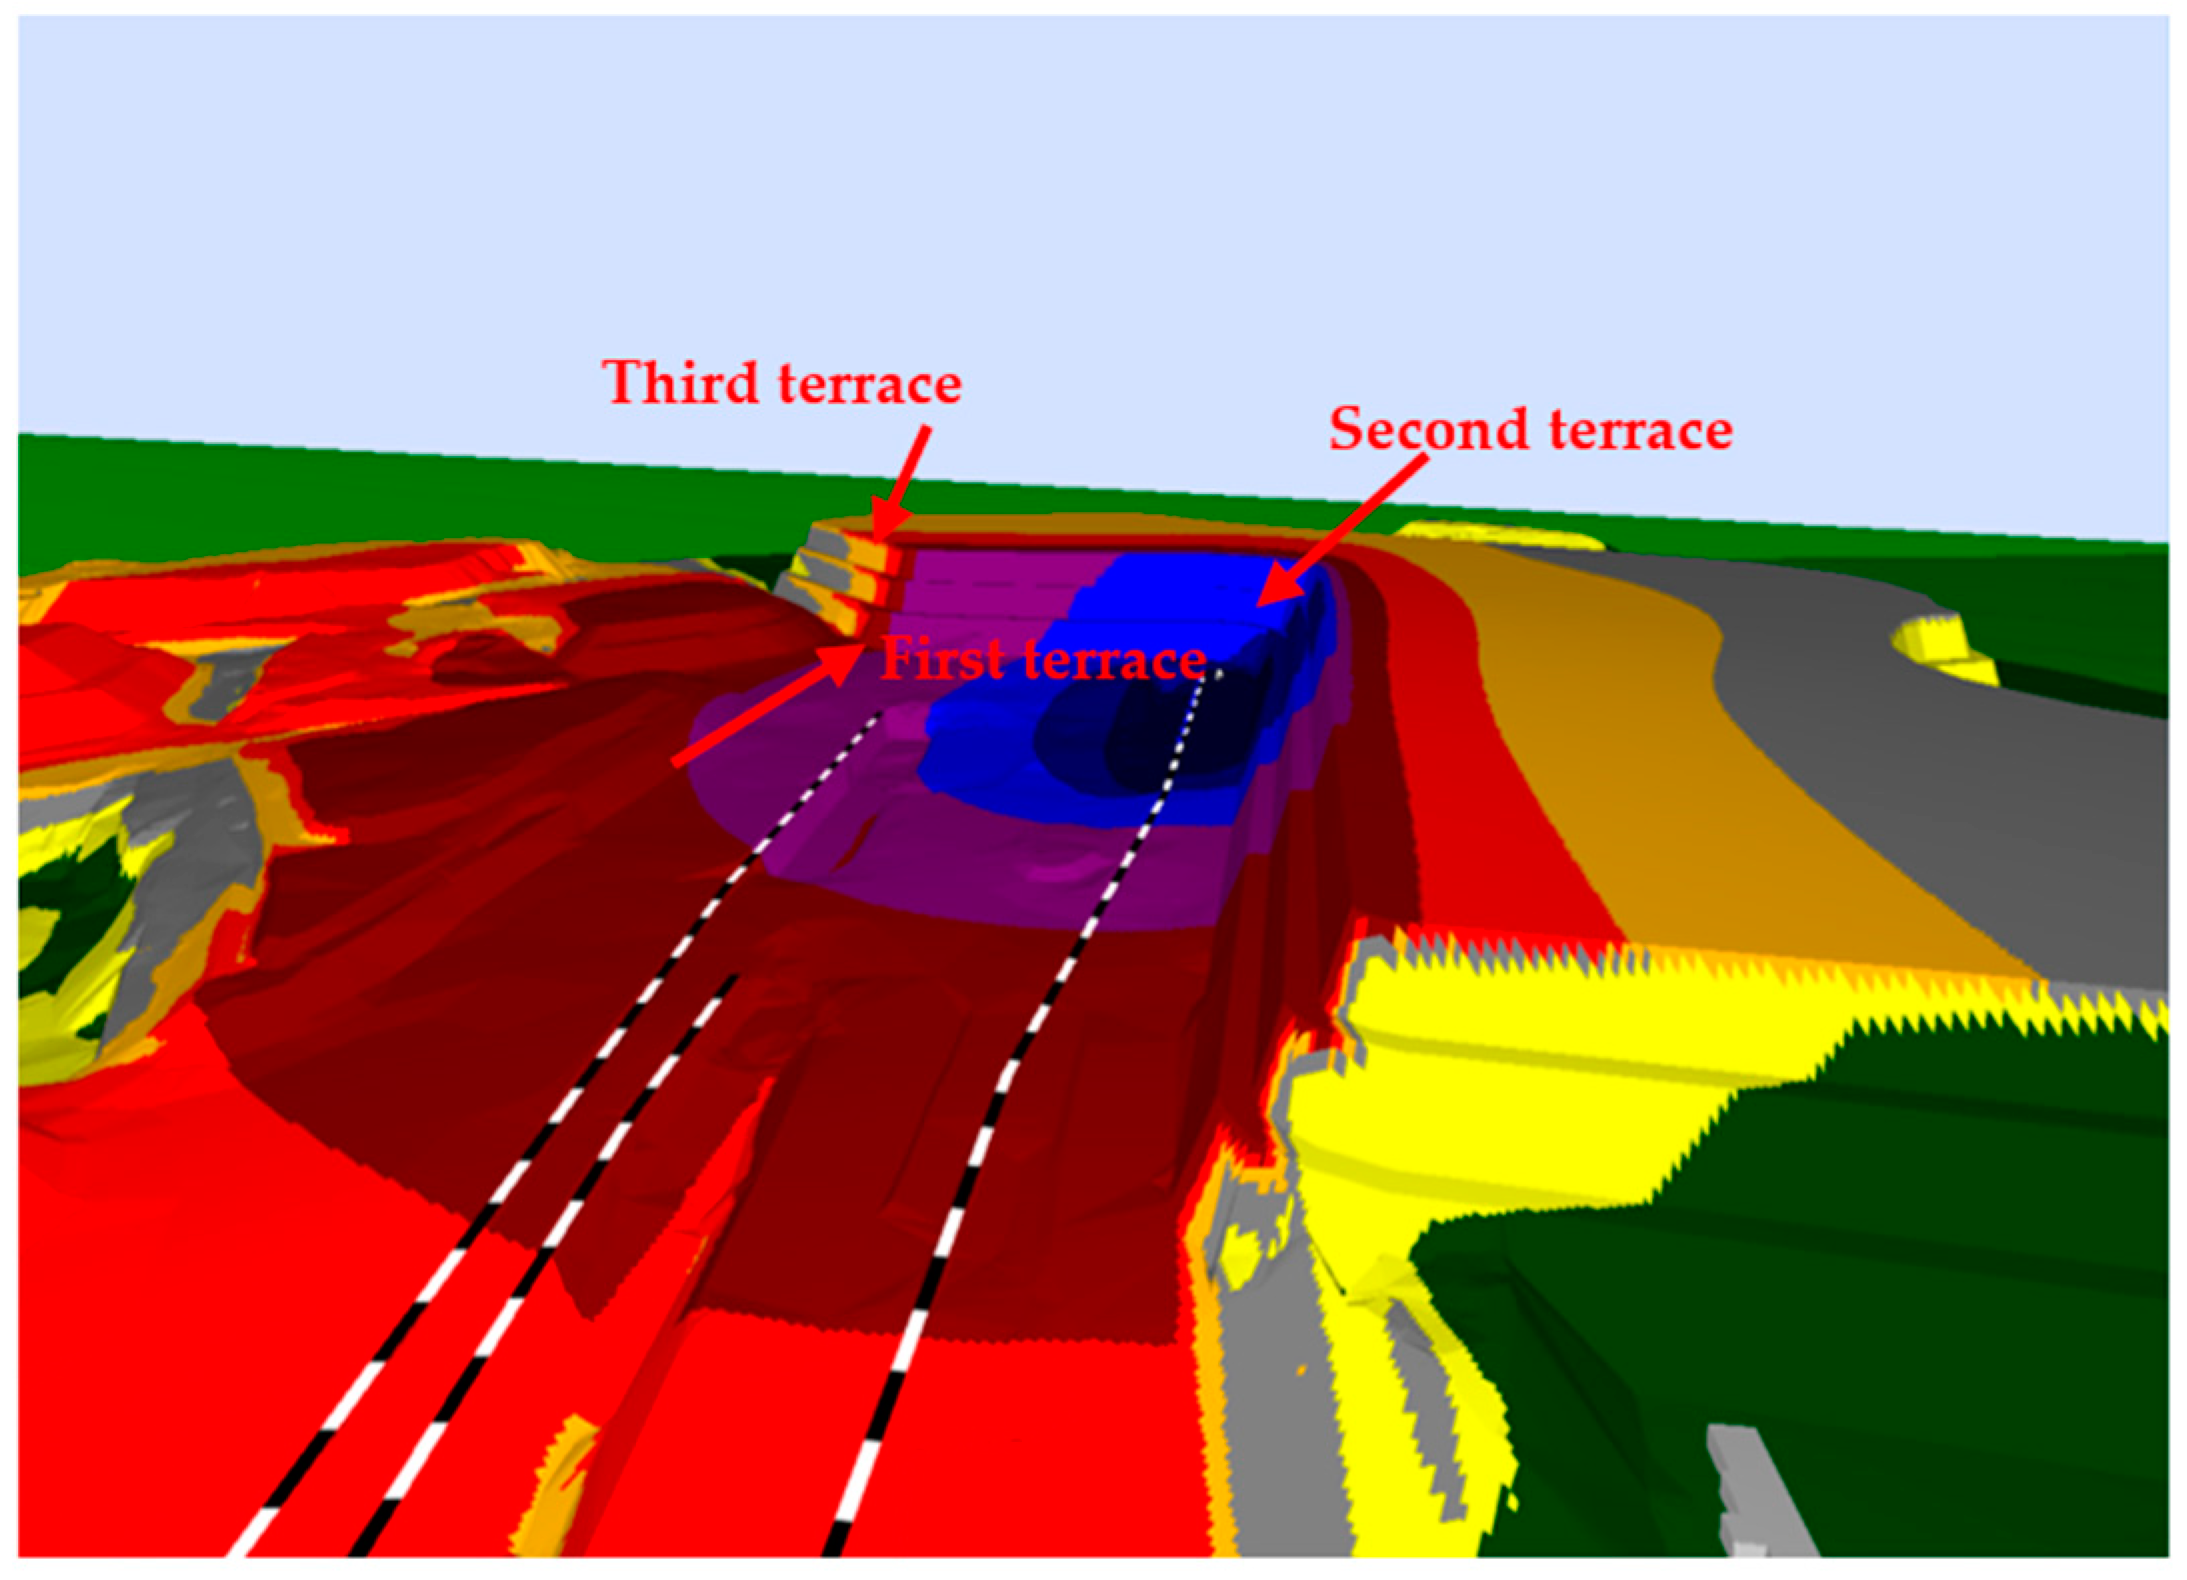
3.2. Proposal of Measures and Discussion

A noise propagation model created in the CadnaA software environment for calculating sound propagation in the exterior was used to design the noise reduction measures. This model was calibrated according to the results of measurements at measurement points M1–M4.
The acoustic power values obtained from the measurements carried out for all activities and acoustic events occurring in the process of deskulling the slag pots were entered into the model. Subsequently, a recalculation of the time during which the slag pots were discharged according to the long-term discharge schedule was carried out.
The average service time per slag ladle car is 1 min; this time includes tilting the slag pot, deskulling the slag pot (if necessary), and tilting it back. The tilting of the pot can take place simultaneously on several ladle cars. A 10-car train was selected as a representative sample.
On the basis of the measurements carried out, knowledge of the technological process, and consideration of the long-term capacity, as well as knowledge of the situation in the surrounding residential zones, the following variants of noise reduction measures were proposed.
Option 1—creation of a slag heap between two currently completed heaps in the direction of the nearest village. For this option, which had the character of a noise barrier (Figure 9 and Figure 10), different heights of the barrier (elevation 235 m, 240 m, and 250 m) were simulated in the model. In none of the variants did the considered heap significantly affect the acoustic situation in the protected areas of the village. As the heap is located at a distance of about 80–90 m from the source and about 1500 m from the village, the diffraction of sound as it propagates from the source to the protected area was fully manifested.
Option 2—construction of an 8 m high noise protection wall at dumping pit 3 at a distance of 15 m from the track axis; see Figure 11.
The noise protection wall at the railway track must be constructed to allow the passage of the mechanism carrying out the deskulling of slag pots assumed to be 10 m from the track axis. Alternatives were proposed for different heights of the noise protection wall.
This option appeared to be effective, however, only for dumping into pit 3. When using dumping pits 1 and 2 (tilting of the slag pots in the opposite direction; in which case, it is not possible to build a noise barrier at an effective distance), this variant was ineffective.
In view of the considered development of the plant and the investment costs of such a (temporary) solution, we do not recommend this solution.
Option 3—planned phased development of the dump site in the area between dumping pits 1, 2, and 3 and the village.
The following options for the phased development of the dump site were predicted in the model:
  • first terrace, height 2 m;
  • first terrace, height 5 m;
  • first terrace, height 10 m;
  • first terrace, height 13 m;
  • second terrace, height 11 m;
  • third terrace, height 11 m.
The prediction made for option 3 showed that the acoustic situation in the village would only start to improve significantly at a dump site height of 10 m (height of the first terrace). The permissible values of the noise determinants were not exceeded at nighttime only when a second terrace was built (height 13 + 11 m). The 3D models of option 3 are shown in Figure 12 and Figure 13.
After finishing the construction of the third terrace (dump site height 13 + 11 + 11 m), the values of the noise determinants were well below the permissible values (by 10 dB or more).

4. Conclusions

The authors proposed a methodology for solving the problem of slag storage technology noise. With this methodology, the problem of the acoustic quality of the territory was solved, calibration measurements were made at the source and in the assessed territory, hygiene values were recalculated, and a mathematical model was created that was calibrated according to the results of real measurements. The measures were then proposed, and these were subsequently simulated in the software. A new way of limiting the spread of noise in the environment was created, where, instead of standard mechanical elements (antinoise walls), the slag created in the production process and stored was used.
In order to address the issue of noise from the slag pots deskulling at the metallurgical plant landfill, three solution options were proposed and compared with the baseline scenario (current state). Each of the proposed options had several sub-options proposed, differing mainly in the geometry of the proposed solutions.
Based on the noise measurements carried out, the prediction made for the solution of the acoustic situation in the village (measurement point M3) for option 3 was recommended for implementation in the form of a gradual construction of the planned landfill in such a way that the stored slag would form a noise barrier.
Since the result of the proposed option will only influence the acoustic situation in the villages at a height of 10 m, it is recommended that organizational measures be applied in the meantime so that the permissible noise levels are not exceeded. We recommend that the organizational measures should be developed into a directive that recommends the operating conditions of the landfill based on measurements and calculations.
We also propose to implement an optimization of the landfill site construction in terms of sound propagation, which would result in improving the acoustic situation in the village as quickly as possible and in achieving non-exceedance of the permissible values of the noise determinants.
The scientific contribution of this manuscript lies in the fact that the authors used the slag material itself, which was only stored, for antinoise measures and used its acoustic properties. It was measured and simulated in many variants and proved to be a successful methodology. Clearly, the true performance of any barrier depends heavily on the influence of the ground, the atmosphere, and reflective surfaces in built-up areas. Therefore, further work on the on-site performance of barriers will be carried out to validate their performance under carefully monitored outdoor conditions over a wide range of distances [31,32,33].
The results achieved by this work indicate that the barriers obtained with the help of slag can be used to mitigate the noise caused by the operation of the metallurgical plant and thus prevent the spread of noise to outside spaces, so they can be a valid substitute for traditional barriers. It shows that industrial waste material can be effectively utilized as sound absorption material and can assist in mitigating noise pollution. Further developments could be the comparison of traditional barriers with such alternative metamaterial barriers.

Author Contributions

Conceptualization, A.Y. and E.L.; methodology, A.Y. and E.L.; software, A.Y.; validation, E.L.; formal analysis, E.L.; investigation, E.L.; resources, A.Y.; data curation, E.L.; writing—original draft preparation, E.L. and A.Y.; writing—review and editing, A.Y.; visualization, E.L.; supervision, E.L.; project administration, A.Y.; funding acquisition, E.L. All authors have read and agreed to the published version of the manuscript.

Funding

This article was prepared with support from the project titled KEGA 038 TUKE-4/2024 and the project titled APVV -21-0120.

Institutional Review Board Statement

Not applicable.

Informed Consent Statement

Not applicable.

Data Availability Statement

The original contributions presented in the study are included in the article, further inquiries can be directed to the corresponding author.

Conflicts of Interest

The authors declare no conflicts of interest.

References

  1. Levi, E.; Sgarbi, S.; Piana, E.A. Acoustic Characterization of Some Steel Industry Waste Materials. Appl. Sci. 2021, 11, 5924. [Google Scholar] [CrossRef]
  2. Schwietz, J.; Panic, B. Utilisation of noise level emitted by the electric arc furnace (eaf) for optimisation of the feeding process of slag foaming materials. Metalurgia 2022, 61, 753–756. [Google Scholar]
  3. Butorina, I.; Butorina, M.; Kulkin, D.; Shashurin, A. Innovative Approaches to Noise Reduction in Metallurgy. Bull. Tabbin Inst. Metall. Stud. 2022, 110, 68–80. [Google Scholar] [CrossRef]
  4. Bolteho, C.T.; Lopes Paz, A.P.M.; Goncalves, A.M.; Frota, S. Comparative study of audiometrics tests on metallurgical workers exposed to noise only as well as noise associated to the handling of chemical products. Braz. J. Otorhinolaryngol. 2009, 75, 51–57. [Google Scholar]
  5. Kim, Y.I.; Kim, W.J. Development of noise mapping system to manage the interior room noise of power plants. J. Acoust. Soc. Korea 2021, 40, 92–98. [Google Scholar]
  6. Bockstael, A.; De Bruyne, L.; Vinck, B.; Botteldooren, D. Hearing protection in industry: Companies’ policy and workers’ perception. Int. J. Ind. Ergon. 2013, 43, 512–517. [Google Scholar] [CrossRef]
  7. Meegahapola, P.A.; Prabodanie, R.A.R. Impact of environmental conditions on workers’ productivity and health. Int. J. Workplace Health Manag. 2018, 11, 74–84. [Google Scholar] [CrossRef]
  8. Mohammed, M.I.; Rabeea, M.A. Effects of Noise Pollution from Electric Backup Generators on the Operators’ Health. Pertanika J. Sci. Technol. 2021, 29, 2675–2687. [Google Scholar] [CrossRef]
  9. Manwar, V.D.; Mandal, B.B.; Pal, A.K. Environmental propagation of noise in mines and nearby villages: A study through noise mapping. Noise Health 2016, 18, 185–193. [Google Scholar]
  10. Casas, W.J.P.; Cordeiro, E.P.; Mello, T.C.; Zannin, P.H.T. Noise mapping as a tool for controlling industrial noise pollution. J. Sci. Ind. Res. 2014, 73, 262–266. [Google Scholar]
  11. Lokhande, S.; Gautam, R.; Dhawale, S.; Jain, M.; Bodhe, G. Evaluation of practical framework for industrial noise mapping: A case study. Noise Health 2019, 21, 194–199. [Google Scholar]
  12. Del Amor, M.M.D.; Caracena, A.B.; Llorens, M.; Esquembre, F. Tools for evaluation and prediction of industrial noise sources. Application to a wastewater treatment plant. J. Environ. Manag. 2022, 319, 115725. [Google Scholar] [CrossRef]
  13. Lumnitzer, E.; Andrejiova, M.; Yehorova, A. Analysis of the Dependence of the Apparent Sound Reduction Index on Excitation Noise Parameters. Appl. Sci. 2022, 10, 8557. [Google Scholar] [CrossRef]
  14. da Silva, V.A.R.; Kruchewsch, M.M.; Lavinsky, J.; Pauna, H.F.; Guimaraes, A.C.; Castilho, A.M.; Duarte, A.S.M.; Crespo, A.N. Progressive Asymmetry in Occupational Noise-Induced Hearing Loss: A Large Population-Based Cohort Study with a 15-Year Follow-Up. J. Int. Adv. Otol. 2021, 17, 520–525. [Google Scholar]
  15. Bagherian, E.R. Improvement of productivity in kuwait steel using ergonomics parameters by controlling the noise and temperature. In Proceedings of the 29th International Conference on Metallurgy and Materials (METAL 2020), Brno, Czech Republic, 20–22 May 2020; pp. 74–79. [Google Scholar]
  16. Panneerselvam, T.; Kandavel, T.K.; Sreenivas, S.A.; Karthik, S.; Andru, M.M. Effects of Working Parameters on Performance Characteristics of Cutting Tools Processed through Powder Metallurgy under Turning Operation. J. Mater. Eng. Perform. 2021, 30, 2890–2898. [Google Scholar] [CrossRef]
  17. Gökalp, I.; Emre Uz, V.; Saltan, M.; Tutumluer, E. Technical and environmental evaluation of metallurgical slags as aggregate for sustainable pavement layer applications. Transp. Geotech. 2018, 14, 61–69. [Google Scholar] [CrossRef]
  18. WHO. Environmental Noise Guidelines for the European Region; Regional Office for Europe, World Health Organization: Geneva, Switzerland, 2018; Available online: https://www.who.int/europe/health-topics/environmental-health#tab=tab_1 (accessed on 20 December 2023).
  19. Wosniacki, G.G.; Zannin, P.H.T. Framework to manage railway noise exposure in Brazil based on field measurements and strategic noise mapping at the local level. Sci. Total Environ. 2021, 757, 14372. [Google Scholar] [CrossRef] [PubMed]
  20. Yang, W.; He, J.; He, C.; Cai, M. Evaluation of urban traffic noise pollution based on noise maps. Transp. Research. Transp. Environ. 2020, 87, 102516. [Google Scholar] [CrossRef]
  21. ISO 1996-2:2007; Description, Measurement And Assessment Of Environmental Noise, Part 2: Determination Of Environmental Noise Levels. Available online: https://www.iso.org/standard/41860.html (accessed on 1 December 2023).
  22. ISO 9613 1:1993; Attenuation of Sound during Propagation Outdoors, Part 1: Calculation Of The Absorption Of Sound By The Atmosphere. Available online: https://www.iso.org/standard/17426.html (accessed on 1 December 2023).
  23. ISO 9613 2:1996; Attenuation of Sound during Propagation Outdoors, Part 2: General Method of Calculation. Available online: https://www.iso.org/standard/20649.html (accessed on 1 December 2023).
  24. Sukaj, S.; Iannace, G.; Ciaburro, G.; Iannace, F. Wind Turbines Noise: Predictions and Measurements. Rom. J. Acoust. Vib. 2021, 18, 69–75. [Google Scholar]
  25. Lan, Z.Q.; He, C.M.; Cai, M. Urban road traffic noise spatiotemporal distribution mapping using multisource data. Transp. Res. 2020, 82, 102323. [Google Scholar] [CrossRef]
  26. Smol, M. Towards Zero Waste in Steel Industry: Polish Case Study. J. Steel Struct. Constr. 2015, 1, 102. [Google Scholar] [CrossRef]
  27. Rondi, L.; Bregoli, G.; Sorlini, S.; Cominoli, L.; Collivignarelli, C.; Plizzari, G. Concrete with EAF steel slag as aggregate: A comprehensive technical and environmental characterization. Compos. Part B Eng. 2016, 90, 195–202. [Google Scholar] [CrossRef]
  28. Ilutiu-Varvara, D.A.; Aciu, C. Metallurgical Wastes as Resources for Sustainability of the Steel Industry. Sustainability 2022, 14, 5488. [Google Scholar] [CrossRef]
  29. Chamling, P.K.; Haldar, S.; Patra, S. Physico-Chemical and Mechanical Characterization of Steel Slag as Railway Ballast. Indian Geotech. J. 2020, 50, 267–275. [Google Scholar] [CrossRef]
  30. Friedrich, B. Sustainable Utilization of Metals-Processing, Recovery and Recycling. Metals 2019, 9, 769. [Google Scholar] [CrossRef]
  31. Izydorczyk, G.; Mikula, K.; Skrzypczak, D.; Moustakas, K.; Witek-Krowiak, A.; Chojnacka, K. Potential environmental pollution from copper metallurgy and methods of management. Environ. Res. 2021, 197, 111050. [Google Scholar] [CrossRef] [PubMed]
  32. Bevilacqua, A.; Iannace, G.; Lombardi, I.; Trematerra, A. 2D Sonic Acoustic Barrier Composed of Multiple-Row Cylindrical Scatterers: Analysis with 1:10 Scaled Wooden Models. Appl. Sci. 2022, 12, 6302. [Google Scholar] [CrossRef]
  33. Ekici, I.; Bougdah, H. A Review of Research on Environmental Noise Barriers. Build. Acoust. 2003, 10, 289–323. [Google Scholar] [CrossRef]
Figure 1. Location of the protected areas and the slag landfill in the vicinity of the metallurgical plant.
Applsci 14 01678 g001
Figure 2. (a) The process of discharging the slag pot. (b) Slag transport pot and hammer for deskulling the slag pots.
Applsci 14 01678 g002
Figure 3. Design of the noise assessment methodology of a metallurgical plant.
Applsci 14 01678 g003
Figure 4. The attenuation due to propagation through vegetation increases linearly with the distance of propagation through this medium d t .
Applsci 14 01678 g004
Figure 5. Time course from the ME measurement point with the recording of process activities during the slag deskulling from several slag pots.
Applsci 14 01678 g005
Figure 6. View of measurement points M1–M4.
Applsci 14 01678 g006
Figure 7. Time course of the equivalent sound pressure level averaged over 125 ms for measurement point M1 at 8 pm–10 pm.
Applsci 14 01678 g007
Figure 8. Time course of the equivalent sound pressure level averaged over 125 ms for all measurement points during 8 pm–10 pm. Legend: measurement point M1, dump site, reference measurement site; measurement point M2, road; measurement point M3, protected area; measurement point M4, protected area.
Applsci 14 01678 g008
Figure 9. Three-dimensional view of the noise barrier (heap).
Applsci 14 01678 g009
Figure 10. Three-dimensional view of the noise barrier (heap).
Applsci 14 01678 g010
Figure 11. Three-dimensional model of the area of interest; view of the noise protection wall at the dumping pit 1.
Applsci 14 01678 g011
Figure 12. Three-dimensional model of the area of interest for option 3: view of the dump site, completed second terrace, height 13 + 11 m.
Applsci 14 01678 g012
Figure 13. Three-dimensional model of the area of interest for option 3: view of the dump site, completed third terrace, height 13 + 11 + 11 m.
Applsci 14 01678 g013
Table 1. Assessed values of equivalent sound pressure level A for the month of September.
Measurement PointReference Time Interval
Tref
Assessed Value of the Equivalent Sound Pressure Level A for the Reference Time Interval
LAeq,Tref
dB
Permissible
Values
dB
Exceedance
dB
M3day49.050-
evening49.850-
night49.0454.0
M4day42.750-
evening43.550-
night42.745-
Table 2. Assessed values of equivalent sound pressure level A for the day during which the most slag pots were deskulled.
Measurement PointReference Time Interval
Tref
Assessed Value of the Equivalent Sound Pressure Level A for the Reference Time Interval
LAeq,Tref
dB
Permissible
Values
dB
Exceedance
dB
M3day51.0501.0
evening52.3502.3
night51.3456.3
M4day44.750-
evening46.050-
night45.045-
Disclaimer/Publisher’s Note: The statements, opinions and data contained in all publications are solely those of the individual author(s) and contributor(s) and not of MDPI and/or the editor(s). MDPI and/or the editor(s) disclaim responsibility for any injury to people or property resulting from any ideas, methods, instructions or products referred to in the content.

