Article

Winter Carbon Dioxide Measurement in Honeybee Hives

1
School of Science and Technology, Nottingham Trent University, Clifton Lane, Nottingham NG11 8NS, UK
2
Harry Butler Institute, Murdoch University, Perth, WA 6150, Australia
*
Author to whom correspondence should be addressed.
Appl. Sci. 2024, 14(4), 1679; https://doi.org/10.3390/app14041679
Submission received: 24 January 2024 / Revised: 8 February 2024 / Accepted: 16 February 2024 / Published: 19 February 2024
(This article belongs to the Special Issue Apiculture: Challenges and Opportunities)

Abstract

:
Sensor technologies have sufficiently advanced to provide low-cost devices that can quantify carbon dioxide levels in honeybee hives with high temporal resolution and in a small enough package for hive deployment. Recent publications have shown that summer carbon dioxide levels vary throughout the day and night over ranges that typically exceed 5000 ppm. Such dramatic changes in a measurable parameter associated with bee physiology are likely to convey information about the colony health. In this work, we present data from four UK-based hives collected through the winter of 2022/2023, with a focus on seeing if carbon dioxide can indicate when colonies are at risk of failure. These hives have been fitted with two Sensirion SCD41 photoacoustic non-dispersive infrared (NDIR) carbon dioxide sensors, one in the queen excluder, at the top of the brood box, and one in the crown board, at the top of the hive. Hive scales have been used to monitor the hive mass, and internal and external temperature sensors have been included. Embedded accelerometers in the central frame of the brood box have been used to measure vibrations. Data showed that the high daily variation in carbon dioxide continued throughout the coldest days of winter, and the vibrational data suggested that daily fanning may be responsible for restoring lower carbon dioxide levels. The process of fanning will draw in colder air to the hive at a time when the bees should be using their energy to maintain the colony temperature. Monitoring carbon dioxide may provide feedback, prompting human intervention when the colony is close to collapse, and a better understanding may contribute to discussions on future hive design.

1. Introduction

Insect pollination is important in much of the crop production around the world [1,2], and honeybees are one of the major players in this role [3,4]. Significant concern has been raised over the decline in managed colonies across Europe and North America [5,6,7,8]. Many flowering crops are grown in large-scale monocultures, in which habitat removal and the scale of planting reduce the native pollinator populations. To rectify this, managed hives of honeybees are transported to orchards to pollinate the crop for the flowering period. Pollination services, as well as the production of wax, honey, and royal jelly, are the positive benefits that managed honeybee colonies provide for humans. To assess honeybee colony health, beekeepers routinely open the hive and visually inspect for the presence of diseases [9,10,11,12,13,14] and assess the strength of the colony (presence of a queen, number of worker bees, areas of brood, and extent of food stores). These intrusive inspections will be a source of stress to the colony, worker bees can be killed during this process, and there is also a risk that the queen will be killed [15]. However, during the spring, in the run up to swarming, such inspections are a necessity for good beekeeping. The ability of the beekeeper to monitor the health of their colony has aided the understanding of these challenges and the use of electronic monitoring aids, such as hive scales and temperature sensors [16,17,18,19,20,21,22,23,24]. The mass of the hive provides important information on the size and activity of the colony. It can be used during the spring and summer months to track the production of honey and the colony population. Daytime changes in the measured mass can provide an estimate of the number of foraging bees in the colony. In the winter, the mass will decrease with the consumption of stored food resources and the colony size decrease. The internal hive temperature is also a clear indicator of colony health, as the bees will maintain a temperature of around 34 °C in brood-rearing areas of the hive. A weakening of the colony is shown when they are unable to keep this temperature stable. Widespread use of hive scales and temperature monitoring has grown, to the extent that there are now many suppliers of commercial hive monitoring products [25,26,27,28,29]. Many of these products send data directly to cloud-based data storage and provide web-based methods to track the colony health and issue warnings; for example, if the mass changes dramatically due to theft or a brood box is blown over in the wind. Beyond mass and temperature, measurements of different gasses have also been reported as part of the drive to what has been termed precision apiculture and smart hives. Humidity—water vapor in its gaseous state—is known to play a vital role in the development of the brood [30]. The measurement of humidity is readily available in low-cost, small capacitive sensors that provide an appropriate accuracy both in digital and analogue formats. Digital devices often incorporate a temperature measurement in the same package, as well as undertaking the analogue to digital conversion on the sensor chip. Easily deployable, these sensors can be purchased on breakout boards starting for as little as EUR 5, with the raw chips costing significantly less. Many of the devices incorporate i2c interfaces, each with different addresses, allowing some spatial variation over a hive to be monitored with relatively simple and inexpensive hardware. Investigations into the effect of humidity have been extensively reported, including from hives in the field made with small, embedded sensors [31,32,33,34].
Carbon dioxide has long been known as a narcotic for the honeybee and is used to immobilize them during scientific manipulation or transfer, while higher levels of exposure cause permanent damage or result in death [35,36,37]. While there have been many laboratory studies on gas levels, such as oxygen, humidity, and carbon dioxide, the availability of small, low-cost, and gas-specific sensors yielding true parts per million (ppm) has previously limited the in-hive measurements. There are a range of small and inexpensive metal oxide (MOx) sensors that respond to yield an estimate for CO2, which are derived from hydrogen measurements and termed eCO2 or CO2eq. One of the problems with these sensors is that the calibration of a non-aged sensor will change significantly during the first hours of operation, and it can take several hours to reach a stable value in stable environmental conditions. In practice, these do not satisfy the requirements for calibrated CO2 measurements. Recent advances in non-dispersive infrared (NDIR) sensor technology mean that such devices for carbon dioxide are now available in small and relatively affordable commercial implementations, such as the Telaire T6713 (Amphenol Thermometrics, Inc., St. Marys, PA, USA) [38], the SCD41 from Sensirion (AG, Stäfa, Switzerland) [39], and the Figaro (Rolling Meadows, IL, USA) CDM7162 [40]. NDIR-type sensors typically consist of an infrared source, a wavelength filter, a sample gas chamber, and an infrared detector. The infrared beam passes through a sample cell containing CO2, and the amount of infrared absorbed by the sample is measured by an infrared detector. The sensitivity of NDIR sensors is directly proportional to the optical beam path. This means that most of the commercial NDIR sensors are in packages that typically measure 5 or 6 cm. While some measurements using these sensors have been reported [41,42], this has been a limitation for hive use, as it is a significant package size. A reduction in the path usually compromises the performance, so a variation using photoacoustic technology has been developed in which the sensor sensitivity is independent of the size of the optical cavity. In the photoacoustic method, a modulated infrared radiation at 4.26 µm, corresponding to the absorption bands of CO2 molecules, is emitted into a small enclosure. The CO2 molecules in the measuring cell absorb part of this radiation, as it mainly excites molecular vibrations, causing a measurable periodic change in pressure in the measuring cell at the modulation frequency. This is at an acoustic frequency that can be measured with a MEMS microphone, with the amplitude of the sound being proportional to the CO2 concentration. This is the principle used in the Sensirion SCD4x range of sensors, allowing a footprint of around 1 cm by 1 cm to be achieved. The devices include a built-in processor algorithm to calculate the CO2 concentration and an i2c digital interface for outputting the data. These types of devices can provide multiple carbon dioxide measurements per minute over a wide range of concentrations. Many of the Sensirion range, such as the SCD41 used in this work, also provide temperature and relative humidity measurements within the same package. This device will measure CO2 from the ambient value in air of 400 ppm up to 40,000 ppm, with different errors for different ranges. An example of this from the data sheet for the range of 2001 ppm to 5000 ppm is provided as: ±(40 ppm + 5% of reading), with a quoted repeatability of ±10 ppm. The SCD41 relative humidity is quoted as ±9% and the temperature as ±1.5 °C.
For external temperatures below 10 °C, honeybees will not leave their hive, and this means that in climates where this is common during the winter months, beekeepers do not open their hives to inspect their colonies, as this will be damaging to the bee health. This is where the sensors can have a significant impact, as they can provide in-hive data when the hive must remain closed. In this work, four hives were fitted with two carbon dioxide sensors, one in the queen excluder and one in the crown board. A hive scale was used to monitor the hive mass and an accelerometer in the central frame of the brood box to measure vibrations. Data from these sensors were compared to the internal and external temperatures of the hives to look for data trends that may suggest a struggling colony.

2. Materials and Methods
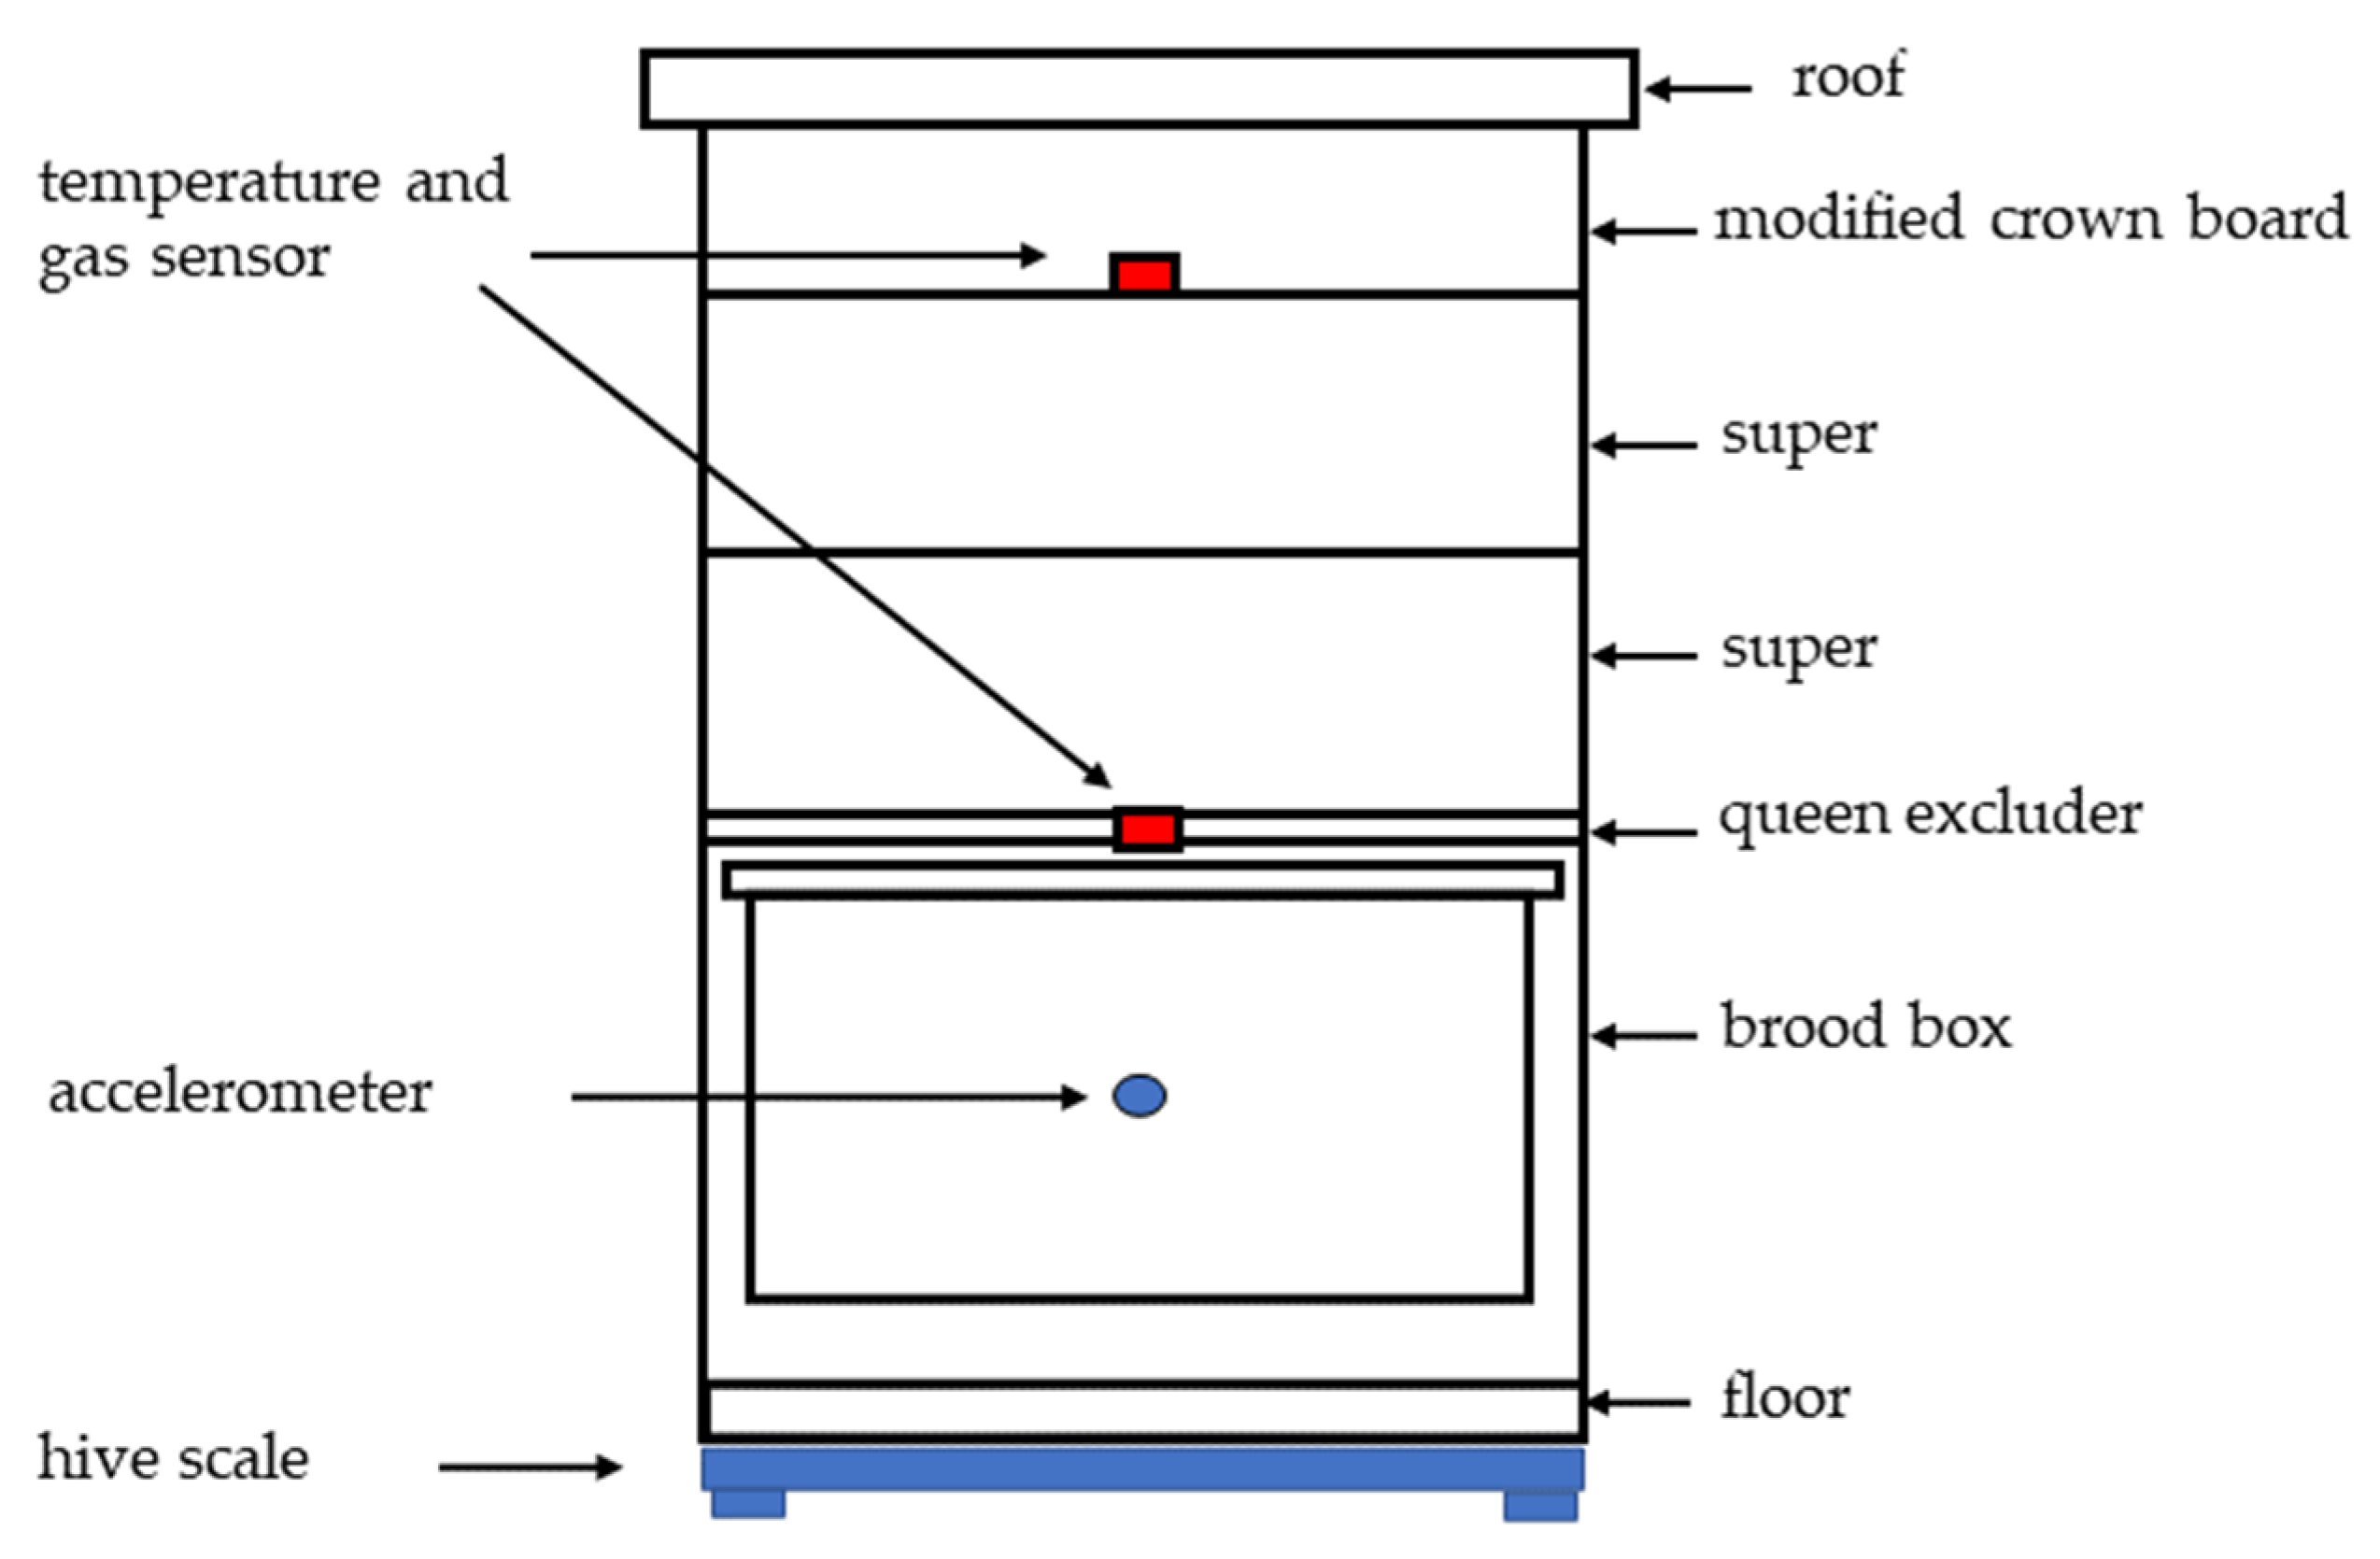
2.1. The Hives

The honeybee colonies used in this work were based in the UK at Holme Pierrepont Hall in Nottingham. All data presented here are from hives 5, 6, 7, and 8, labeled HPP5, HPP6, HPP7, and HPP8, which were the four of the eight colonies in the apiary with gas sensor hardware installed. Measurements were conducted throughout 2022, but the data presented here correspond to the period from 6 December 2022 to 27 April 2023. Colony HPP8 died prior to this period, reported as Figure 7 in [42], and the other three colonies were healthy. The basic structure of the honeybee hive used is shown in Figure 1 and consists of the brood box, in our case the British National hive brood box (https://en.wikipedia.org/wiki/BS_National_Beehive, accessed on 22 January 2024), in which the queen lays eggs and the young are reared. The honeybee hive is one of the most demanding places to site sensors as it is subject to a wide range of temperature and humidity and under constant threat of coating with propolis by the bees. In the middle of the central frame of each brood box was an accelerometer to monitor vibration. A queen excluder was placed on top of the brood box to prevent the queen from moving to the ‘super’ boxes above it but allowing workers to pass through, and a gas and temperature sensor was attached to the queen excluder. The supers are predominantly where the honey is produced and stored. Additional supers can be added throughout the season as the honey stores build. Two supers were used on these hives during the measurement period. We added a modified crown board, which held the electronics for the gas sensors in a weatherproof environment, as well as one of the gas and temperature sensors. The crown board sensor was placed approximately 30 cm above the queen excluder sensor. The hive sits on a hive scale from BEEP [29] that measures the mass of the hive every 15 min. The scale under colony HPP6 failed, so data from this colony were not available.

2.2. Carbon Dioxide Sensor Electronics

The Teensy 3.5 microcontroller (PJRC, Sherwood, OR, USA) was chosen as the data logger for this application, as it provided both a real-time clock and a microSD card reader onboard for storing data. This system has previously been reported in detail [42]. The gas sensors were the Sensirion SCD41 connected to the Teensy via the i2c bus. As the cable lengths to the sensors were at the upper end of that permitted in the i2c standard, the pull-up resistor values were dropped from the usual 4.7 kΩ down to 2.2 kΩ. The SCD41 gas sensor was fixed to the Grove breakout boards from Seeed Studio (https://wiki.seeedstudio.com/Grove-CO2_&_Temperature_&_Humidity_Sensor-SCD41, accessed on 22 January 2024), as these provided a more robust mechanism for soldering the wire connections compared to just the SCD41 element. For our application, the socket was removed from the rear of the Grove circuit board to save space, as the same connections were also provided as through hole solder terminals. Data consisting of EPOCH time, CO2, temperature, and humidity were saved with around three measurements per minute to approximately one file per day on the memory card. The EPOCH (or Unix timestamp) is the number of seconds that have elapsed since 1 January 1970, and using this format allows data from the SCD41, the hive scales, and the accelerometers to easily be directly compared with each other.

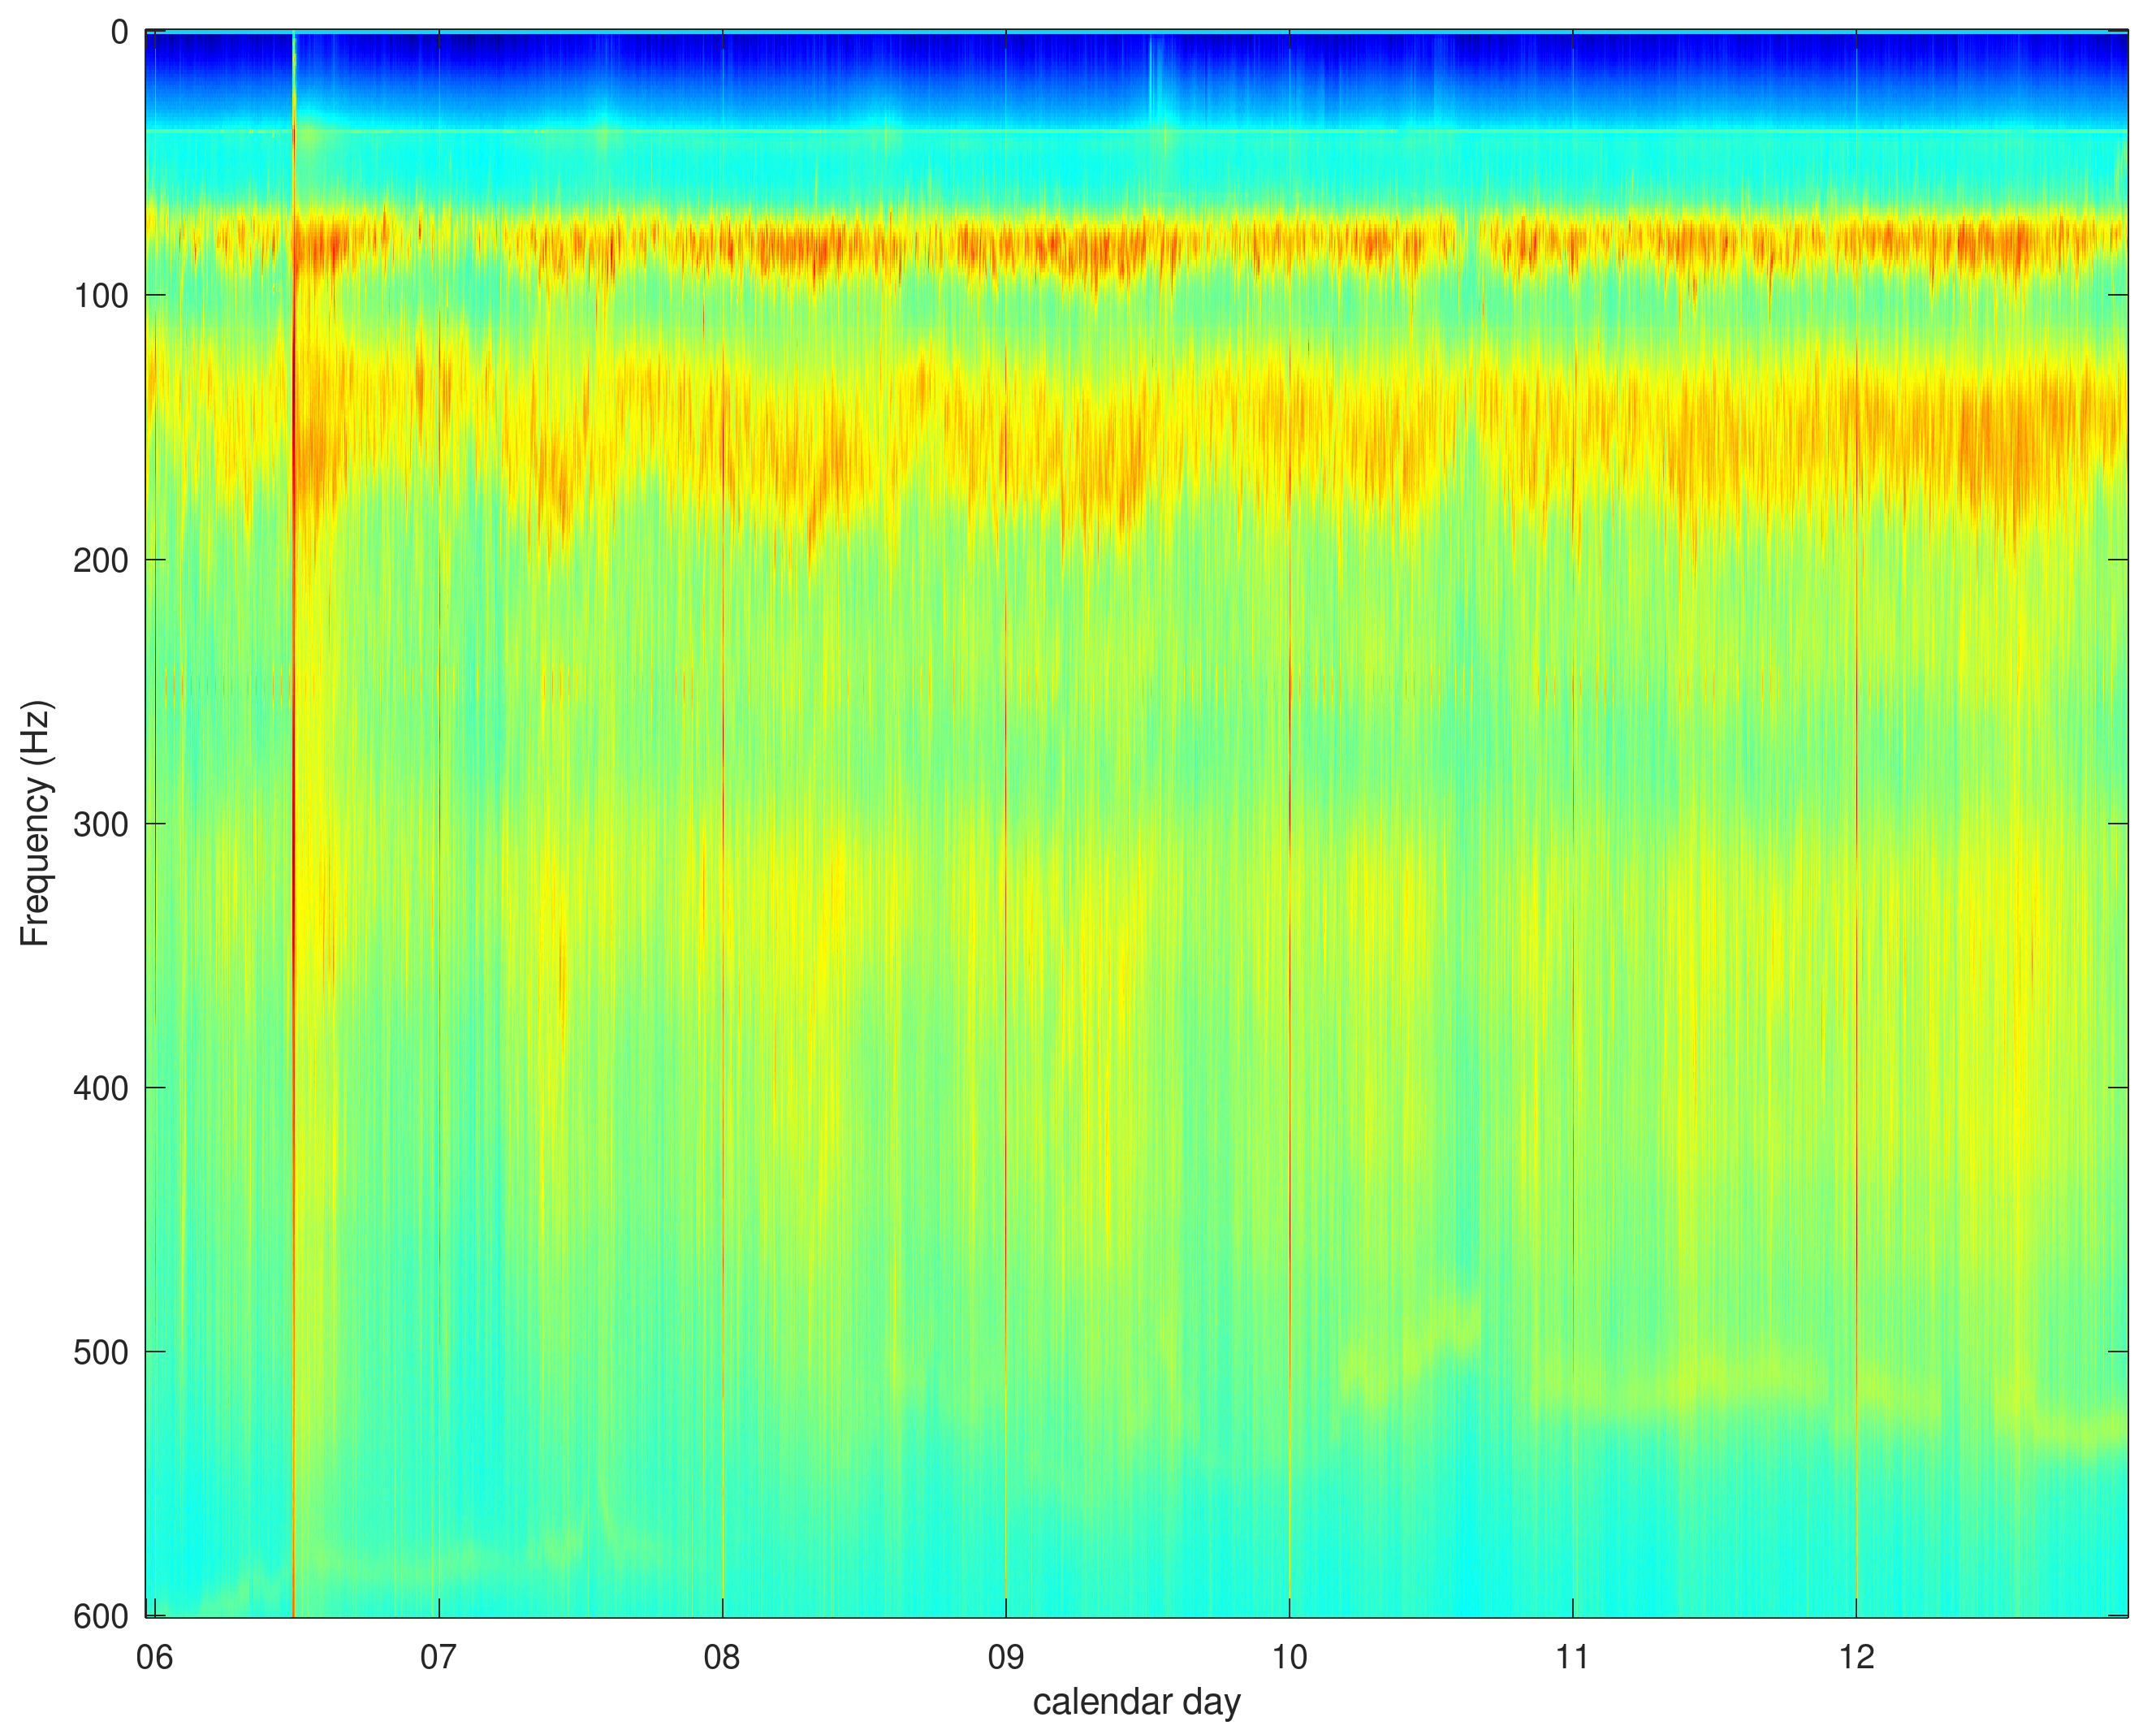
2.3. Vibration Measurements
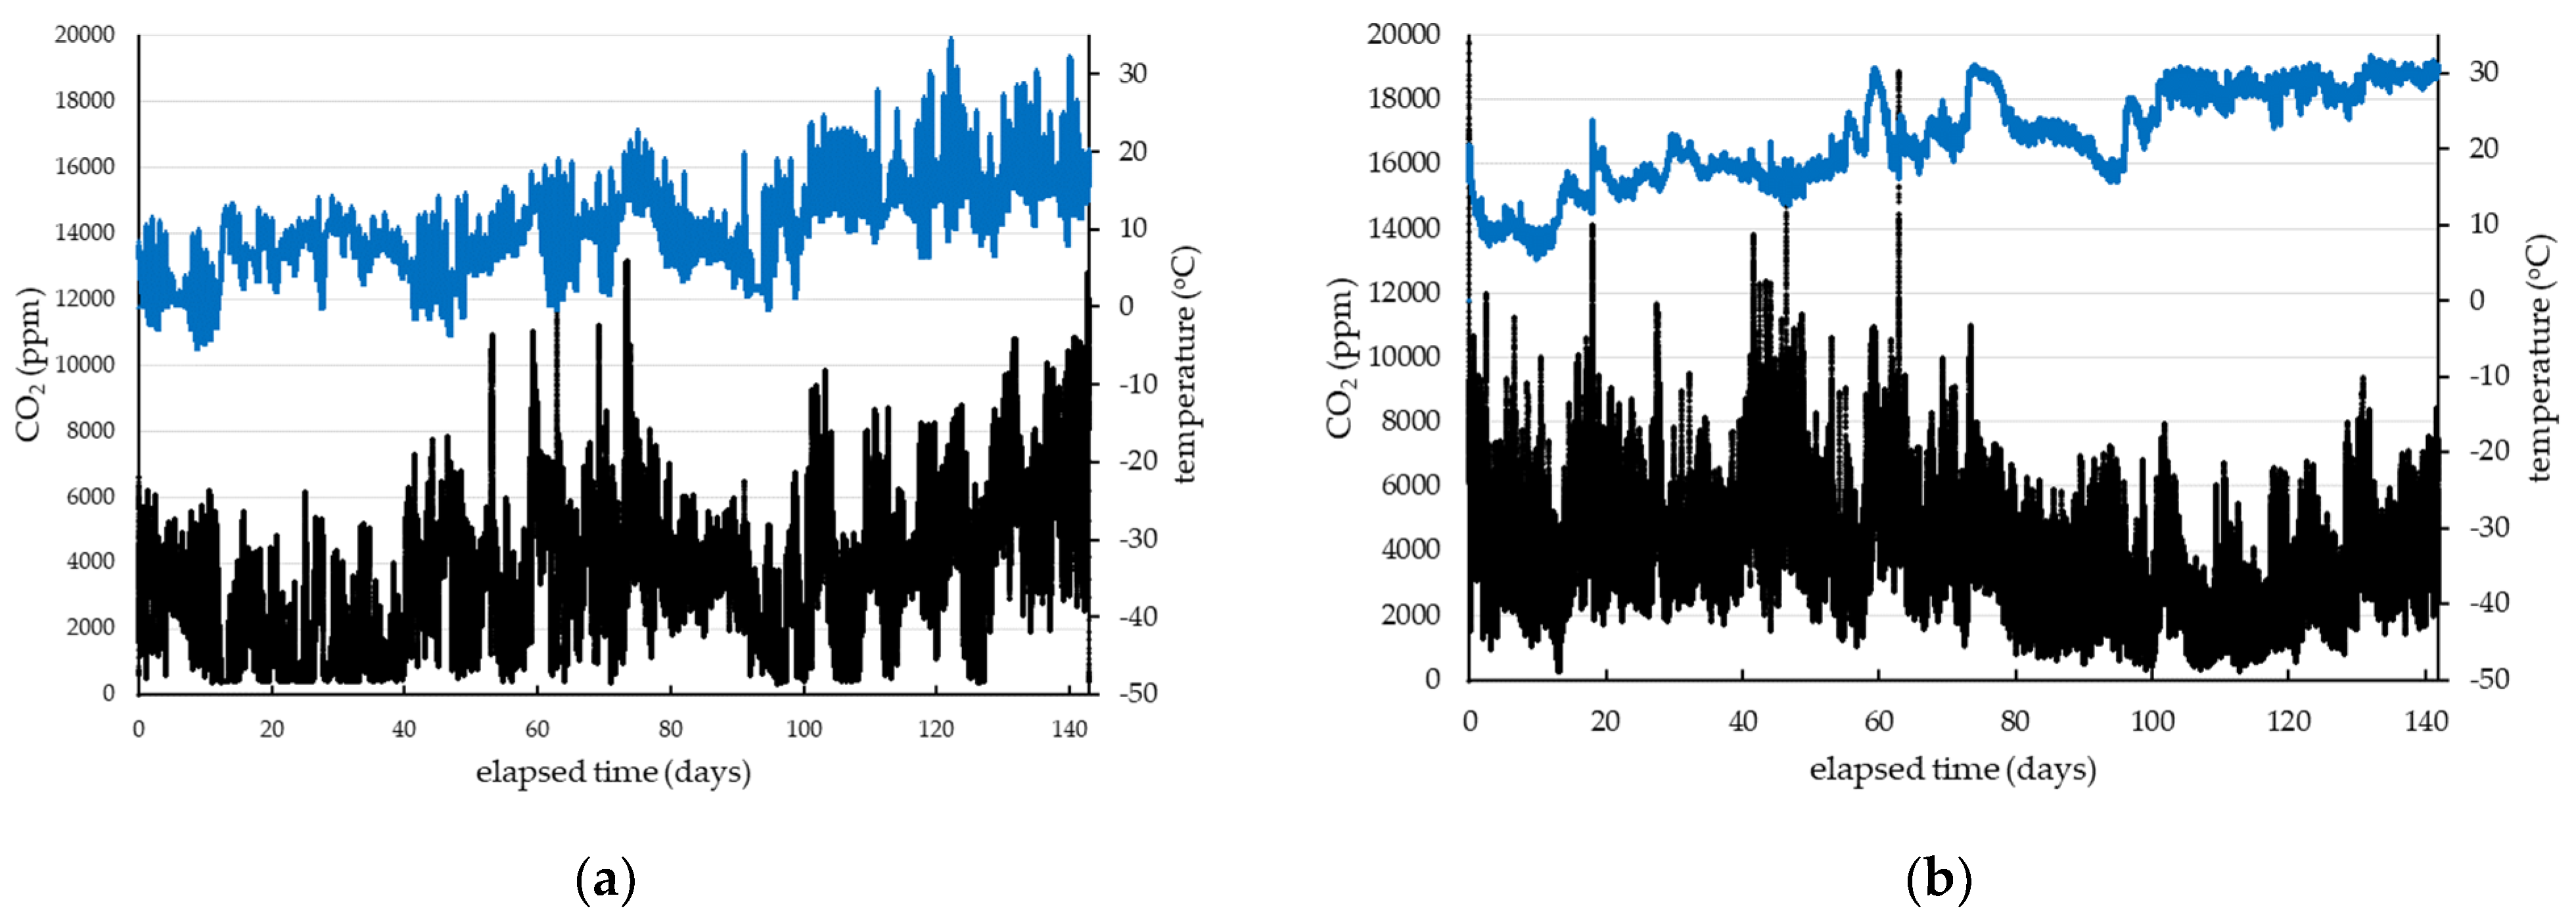
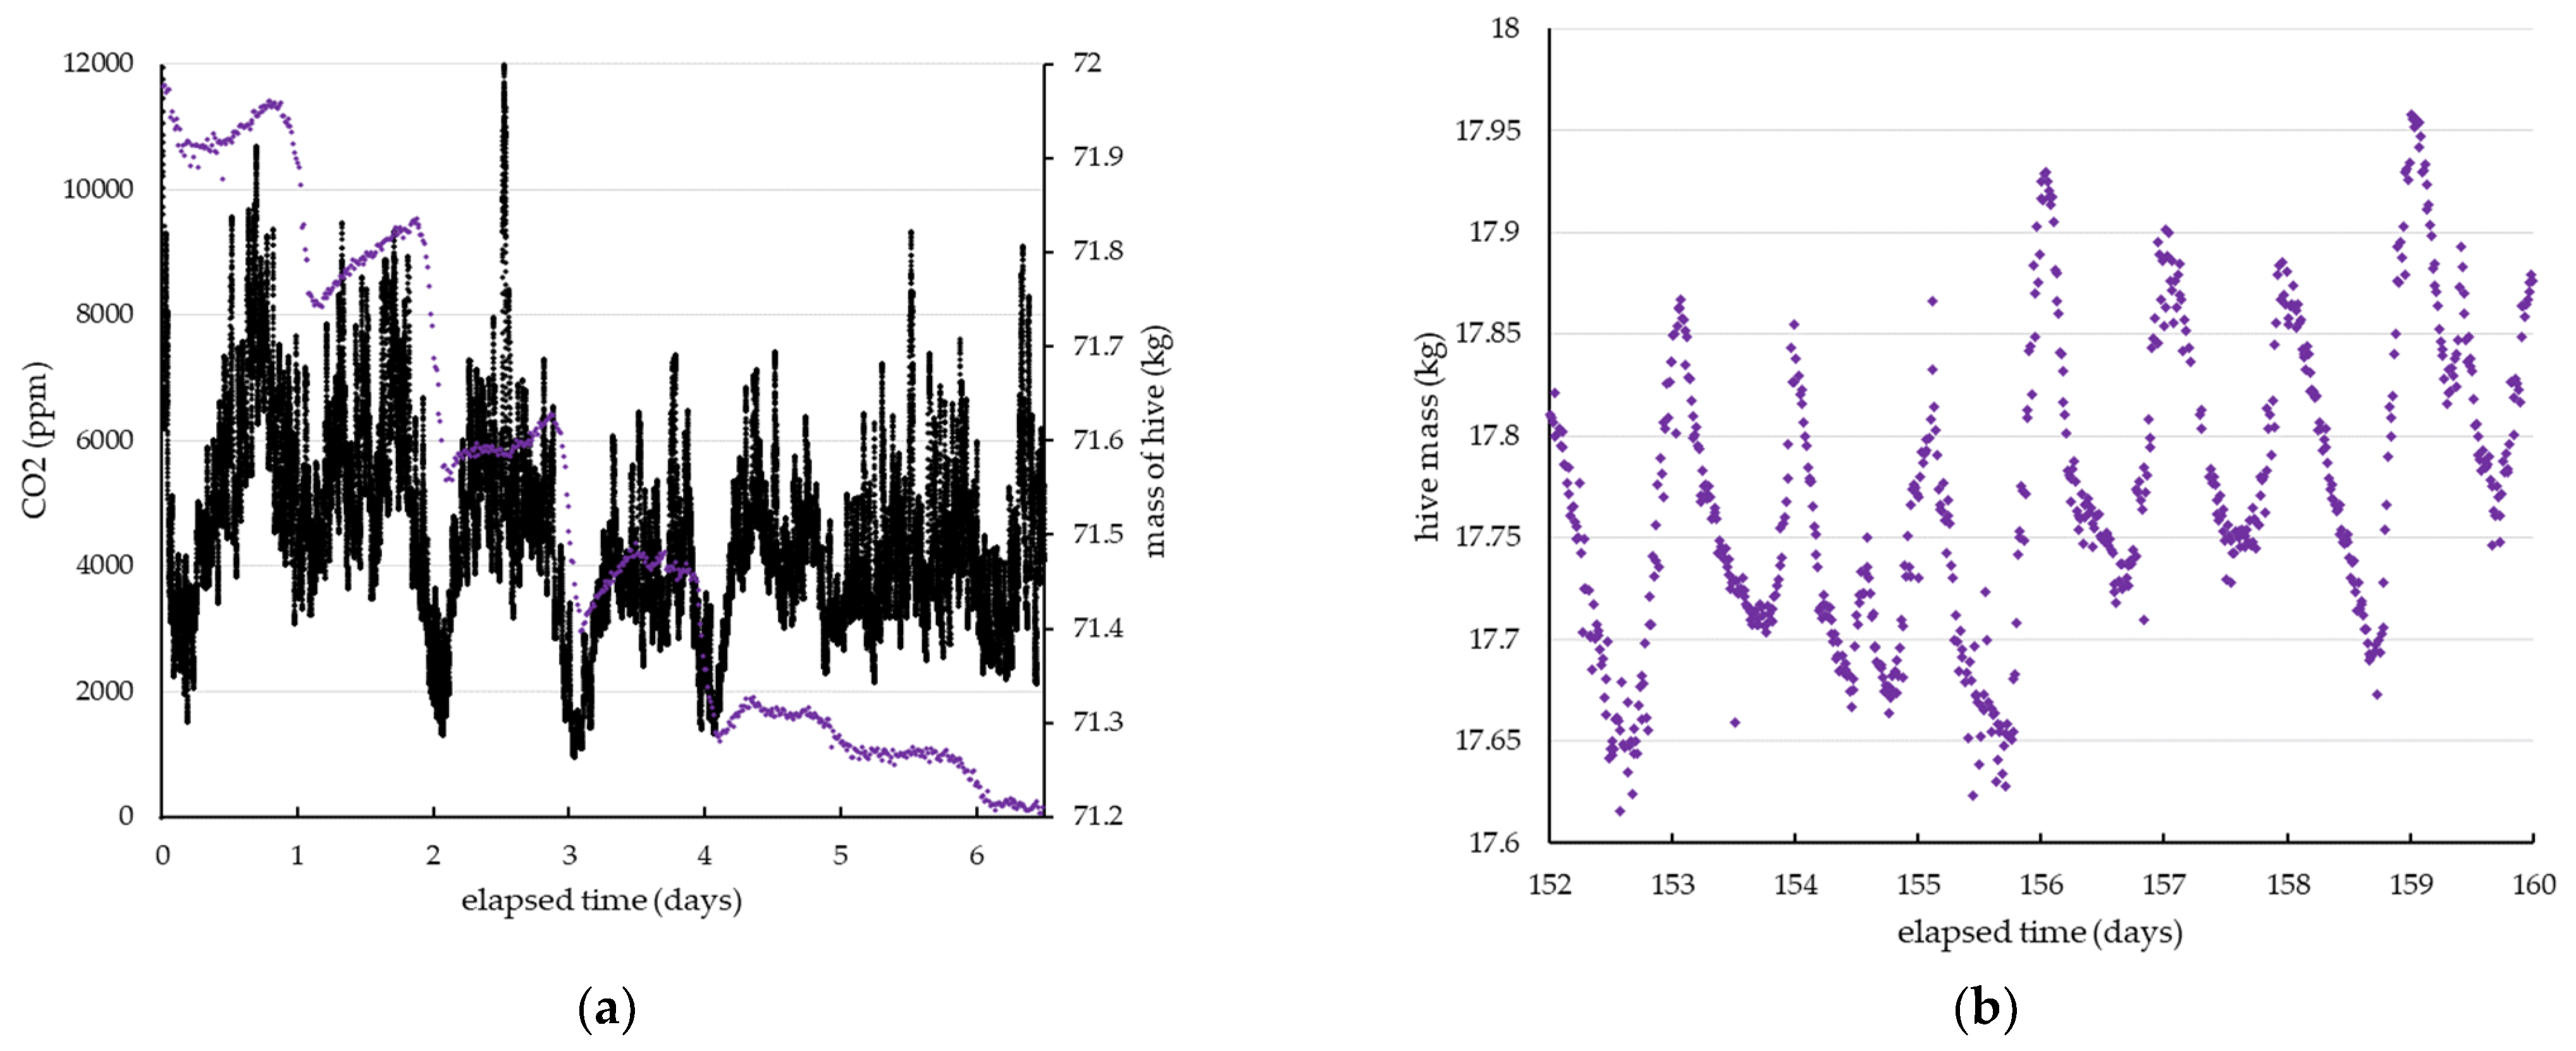
Sounds, which are vibrations that travel through the air, are thought to be used by the bees to communicate within the hive. It is claimed that their analysis can reveal useful information to understand the colony health status, and this has recently been reviewed [43]. Measuring sound with a microphone can have its challenges in a hive, as the bees tend to cover them with propolis and they can also be sensitive to detecting external sounds. An alternative to measuring sound with a microphone is to measure the transmission of the bee-generated vibration through the solid material of the comb using an accelerometer. An embedded accelerometer is not affected by a coating of propolis and, indeed, they are often covered with some melted wax to help their acceptance in the colony. Some specific vibrational signals have been identified that are thought to hold specific communication roles for the bees. These include the dorso-ventral abdominal (DVA) vibration signals [44] and the tooting and quacking of queens during the swarming season [45]. In this work, we were not interested in the individual vibrational signals but rather the background spectrum due to the bee activity. These vibrations were measured using the 805M1 (TE Connectivity, Schaffhausen, Switzerland), a single-axis analogue output accelerometer that incorporates a piezo-ceramic crystal with low-power electronics in a shielded housing that is suitable for embedded applications [46].
A simple three-wire connection was all that was required, with a ground wire, an excitation voltage supply of between 3 V and 5.5 V, and an analogue audio frequency data wire. The frequency range of the accelerometer was 1 to 8000 Hz and a full-scale output voltage range of ±2 V. The recording of the accelerometer signals was carried out using an M-Track 8 (M-Audio, Cumberland, RI, USA) sound card using home-written software that has been described elsewhere [44,45].

3. Results

Figure 2 shows the CO2, in ppm (black), and temperature (blue) for colony HPP5 for the queen excluder (right) and crown board (left) starting on Tuesday 6 December 2022 at 11:48. This had the profile of a strong colony, with the temperature near the brood-rearing range at the queen excluder by day 100. There were few negative temperatures recorded in the hive even though external temperatures did fall below zero, and this was observed in other colonies during the same time and in close proximity.
As previously reported [42], ambient air values of CO2 (typically around 400 ppm to 450 ppm) were observed in the crown board during many of the first forty days, but not in the queen excluder. There were many days where the CO2 exceeded 10,000 ppm in the brood box and on some days in the crown board, which is above the two supers, and thus more than 30 cm above the queen excluder sensor.
Figure 3a shows the first week of the CO2 data (black) shown in Figure 2 for the queen excluder. The hive mass on the same graph is the purple line. There was an interesting daily drop in mass that coincided with the fall in CO2, which then rose again but not quite to the same level, as would be expected as provisions are expended by the colony in December/January. Typically, this change was between 50 g to 100 g, approximately corresponding to the mass of typically 500 to 1000 bees. While the change in mass for colony HPP5 could have been due to bees leaving the colony, the outside temperature was mainly below 10 °C, when the bees would not usually fly.
To investigate if this fall and rise was connected to the CO2, the mass changes were inspected for a colony that died at the start of the winter, colony HPP8. The mass changes for this hive are shown in the right-hand panel of Figure 3, and this exhibits the same sort of daily change but without the overall drop. It is, therefore, likely that the level of change was associated with changes in the wooden structure as the temperature fell at night and rose during the day, affecting the wood and its moisture content.
Figure 4 shows that the crown board temperature tracked the external temperature, including going negative, but with a slightly higher value. The brood box maintained a much higher temperature, but even the queen excluder fell below 10 °C, below which bees are thought to cluster.
Figure 5 shows the vibrational amplitude from colony HPP5, a strong colony, and colony HPP6, which was a weaker colony, as seen from the lower CO2 levels in the hives and previous inspection data. For colony HPP5, the vibration amplitude did not clearly track the CO2 levels, but for colony HPP6, this was more the case, suggesting that the vibrational measurements picked up the increased activity, probably fanning, perhaps required to reduce the CO2 in the hive. This difference could be because the cluster was closer to the accelerometer in colony HPP6 than colony HPP5. Figure 6 shows the vibrational spectrogram for colony HPP6 using the same data as seen from days 0 to 7 in the left-hand panel of Figure 5. A spectrogram is a visual representation of the spectrum of frequencies of a signal as it varies with time, which has the frequency on the vertical axis and time on the horizontal axis. The color then shows the strength of the signal, where the darker the color, the stronger the signal, in our representation increasing from yellow to red. The wing beat frequencies can clearly be seen for frequencies starting around 125 Hz, and this frequency can be seen to increase as the amplitude (increasing depth of red color) increased to closer to the reported [47] fanning frequency of 173.9 ± 20.4 Hz, but much lower than the frequency for hovering flight (226.8 ± 12.8 Hz), for which a very faint line can be observed.
Figure 7 shows colony HPP7 over 142 days (Figure 7a) and a zoom on the first 35 days (Figure 7b). The data suggested that in the second week of December we were close to losing the colony as the top of the brood box was averaging around 5 °C a week. Interestingly, a corresponding reduction in CO2 was seen a week later. The orange data in Figure 4 are the exterior temperature, which showed a significant increase around day 12 that was reflected in the brood box temperature.

4. Discussion

Honeybee colonies act as a superorganism [48,49], and one aspect of this is associated with thermal regulation, which maintains the brood area between 30 °C and 35 °C. Each individual bee responds to the local temperature environment by either isometric contractions of her flight muscles to generate heat or fanning her wings to draw in cooler air [50,51]. Temperatures below 15 °C can induce clustering centered on the brood areas. It was reported by Seeley [15] that a response to extreme levels of carbon dioxide is fanning. One aspect of fanning is to help evaporate the water off the nectar stores to safely store it as honey. However, we know that fanning is thought to be used to regulate the temperature inside the colony by circulating air through the hive. In the winter, this will result in cooling, particularly where the air being drawn in is very cold. While the data showed that the temperature fell as the carbon dioxide level was reduced, this also tracked the outside temperature so cannot be directly or fully attributed to the fanning behavior. However, this does suggest that there are at least two competing mechanisms at play in the hive at low temperatures, with outer bees in the cluster expending energy to reduce the CO2 while the inner bees try to generate sufficient heat to maintain the brood temperature against this increased cooling. This raises the question of whether the design of hives can be made to reduce this expenditure of energy and improve survival rates. The use of wooden boxes as beehives became mainstream after the 1850s, when Lorenzo Langstroth discovered the “bee space” and revolutionized modern beekeeping [52]. He found that bees would not build a comb in a space tighter than 1 cm. His brood box used hanging-bar removable frames spaced exactly 1 cm apart and 1 cm from the box walls. This is still the main design used today, with Langstroth hives remaining popular, but alternative options with different sizes include the British National hive and the Dadant. Lightweight polystyrene versions of the basic brood box are also available, which improve insulation and reduce the effort of the colony in temperature control. These are still basic boxes with the use of supers on top and do not provide any further sophistication in ventilation. We know that the temperature in the upper supers gets close to the outside temperatures, so the incorporation of trickle vents to improve the air flow may not affect the overall hive temperature profile but may improve ventilation. An alternative would be to provide warmed air drawn through the hive when the CO2 levels rise above a certain level and the outside temperature is low. It is usually the case that the bees ‘know best’ how to look after their own environment, but in extreme cold, human intervention may well save colonies.

5. Conclusions

During the winter months when the beekeeper is unable to open their hives for inspection, the advances in smart hive technology offer an insight into the colony status. The latest generation of NDIR sensors provides a small package that will operate over the extensive carbon dioxide range that is found in the hive. In this work, we showed that the daily variation in carbon dioxide reported in previous studies for the spring and summer months continued throughout the coldest days of winter, although not to such high values as when there are more bees in the colony. Vibrational data measured using accelerometers suggested that daily fanning may be responsible for restoring lower carbon dioxide levels. This was due to drawing colder air into the hive at a time when the bees should be using their energy to maintain the colony temperature. Monitoring carbon dioxide levels may provide sufficiently detailed feedback, prompting human intervention when the colony is close to collapse. It may also help in future hive design, where the use of trickle vents could improve the air flow while not affecting the overall hive temperature profile.

Author Contributions

Conceptualization, M.I.N. and M.B.; investigation, M.I.N., L.C., A.M. and M.B.; writing—original draft preparation, M.I.N.; writing—review and editing, M.B., L.C. and A.M. All authors have read and agreed to the published version of the manuscript.

Funding

This project received funding from the European Union’s Horizon 2020 research and innovation program as part of the Giving Beekeeping Guidance by cOmputatiOnal-assisted Decision-making (B-GOOD) Consortium, under grant agreement No. 817622.

Data Availability Statement

The data presented in this study are openly available from FigShare at: https://doi.org/10.6084/m9.figshare.24411595.

Acknowledgments

The authors acknowledge Robert and Charlotte Brackenbury of Holme Pierrepont Hall, Nottingham, UK, for hosting the UK B-GOOD apiary.

Conflicts of Interest

The authors declare no conflicts of interest.

References

  1. Klein, A.-M.; Vaissière, B.E.; Cane, J.H.; Steffan-Dewenter, I.; Cunningham, S.A.; Kremen, C.; Tscharntke, T. Importance of pollinators in changing landscapes for world crops. Proc. R. Soc. Lond. B Biol. Sci. 2007, 274, 303–313. [Google Scholar] [CrossRef] [PubMed]
  2. Gallai, N.; Salles, J.M.; Settele, J.; Vaissiere, B.E. Economic valuation of the vulnerability of world agriculture confronted with pollinator decline. Ecol. Econ. 2009, 68, 810–821. [Google Scholar] [CrossRef]
  3. Delaplane, K.S.; Mayer, D.F. Crop Pollination by Bees; CABI Publishing: Wallingford, UK, 2010; Available online: https://www.cabidigitallibrary.org/doi/book/10.1079/9780851994482.0000 (accessed on 22 January 2024).
  4. Kaplan, J.K. Colony Collapse Disorder: A Complex Buzz. Agric. Res. 2008, 56, 8–11. Available online: https://agresearchmag.ars.usda.gov/ar/archive/2008/may/colony0508.pdf (accessed on 22 January 2024).
  5. Potts, S.G.; Roberts, S.P.M.; Dean, R.; Marris, G.; A Brown, M.; Jones, R.; Neumann, P.; Settele, J. Declines of managed honeybees and beekeepers in Europe. J. Apic. Res. 2010, 49, 15–22. [Google Scholar] [CrossRef]
  6. Ellis, J.D.; Evans, J.D.; Pettis, J.S. Colony losses, managed colony population decline and Colony Collapse Disorder in the United States. J. Apic. Res. 2010, 49, 134–136. [Google Scholar] [CrossRef]
  7. Leonhardt, S.D.; Gallai, N.; Garibaldi, L.A.; Kuhlmann, M.; Klein, A.M. Economic gain, stability of pollination and bee diversity decrease from southern to northern Europe. Basic Appl. Ecol. 2013, 14, 461–471. [Google Scholar] [CrossRef]
  8. Pettis, J.S.; Delaplane, K.S. Coordinated responses to honey bee decline in the USA. Apidologie 2010, 41, 256–263. [Google Scholar] [CrossRef]
  9. Grzeda, U.; Gajda, A.; Topolska, G. Chronic bee paralysis and sacbrood: Virus infections not associated with other bee diseases. Vet. Med.-Sci. Pract. 2014, 70, 729–734. [Google Scholar]
  10. Genersch, E. American Foulbrood in honeybees and its causative agent, Paenibacillus larvae. J. Invertebr. Pathol. 2010, 103, S10–S19. [Google Scholar] [CrossRef]
  11. Forsgren, E. European Foulbrood in honeybees. J. Invertebr. Pathol. 2010, 103, S5–S9. [Google Scholar] [CrossRef]
  12. Aronstein, K.A.; Murray, K.D. Chalkbrood disease in honeybees. J. Invertebr. Pathol. 2010, 103, S20–S29. [Google Scholar] [CrossRef] [PubMed]
  13. Rosenkranz, P.; Aumeier, P.; Ziegelmann, B. Biology and control of Varroa destructor. J. Invertebr. Pathol. 2010, 103, S96–S119. [Google Scholar] [CrossRef] [PubMed]
  14. Sammataro, D.; Gerson, U.; Needham, G. Parasitic mites of honeybees: Life History, Implications, and Impact. Annu. Rev. Entomol. 2000, 45, 519–548. [Google Scholar] [CrossRef] [PubMed]
  15. Imdorf, A.; Gerig, L. Course in Determination of Colony Strength; Swiss Bee Research Centre, Swiss Federal Dairy Research Institute: Liebefeld, Switzerland, 2001; CH-3003 Bern. [Google Scholar]
  16. Meikle, W.G.; Rector, B.G.; Mercadier, G.; Holst, N. Within-day variation in continuous hive weight data as a measure of honey bee colony activity. Apidologie 2008, 39, 694–707. [Google Scholar] [CrossRef]
  17. Meikle, W.G.; Weiss, M.; Stilwell, A.R. Monitoring colony phenology using within-day variability in continuous weight and temperature of honey bee hives. Apidologie 2016, 47, 1–14. [Google Scholar] [CrossRef]
  18. Cook, D.; Tarlinton, B.; McGree, J.M.; Blackler, A.; Hauxwell, C. Temperature Sensing and Honey Bee Colony Strength. J. Econ. Entomol. 2022, 115, 715–723. [Google Scholar] [CrossRef]
  19. Czekońska, K.; Łopuch, S.; Miścicki, S.; Bańkowski, J.; Szabla, K. Monitoring of hive weight changes in various landscapes. Apidologie 2023, 54, 30. [Google Scholar] [CrossRef]
  20. Arias-Calluari, K.; Colin, T.; Latty, T.; Myerscough, M.; Altmann, E.G. Modelling daily weight variation in honey bee hives. PLoS Comput. Biol. 2023, 19, e1010880. [Google Scholar] [CrossRef]
  21. Zacepins, A.; Brusbardis, V.; Meitalovs, J.; Stalidzans, E. Challenges in the development of Precision Beekeeping. Biosyst. Eng. 2015, 130, 60–71. [Google Scholar] [CrossRef]
  22. Zaman, A.; Dorin, A. A framework for better sensor-based beehive health monitoring. Comput. Electron. Agric. 2023, 210, 107906. [Google Scholar] [CrossRef]
  23. Cecchi, S.; Terenzi, A.; Orcioni, S.; Spinsante, S.; Primiani, V.M.; Moglie, F.; Ruschioni, S.; Mattei, C.; Riolo, P.; Isidoro, N. Multi-sensor platform for real time measurements of honey bee hive parameters. IOP Conf. Ser. Earth Environ. Sci. 2019, 275, 012016. [Google Scholar] [CrossRef]
  24. Cecchi, S.; Spinsante, S.; Terenzi, A.; Orcioni, S. A Smart Sensor-Based Measurement System for Advanced Bee Hive Monitoring. Sensors 2020, 20, 2726. [Google Scholar] [CrossRef]
  25. Available online: https://beehivemonitoring.com/en/ (accessed on 16 January 2024).
  26. Available online: https://beemate.buzz/ (accessed on 16 January 2024).
  27. Available online: https://solutionbee.com/ (accessed on 16 January 2024).
  28. Available online: https://apisprotect.com/technology/ (accessed on 16 January 2024).
  29. Available online: https://beep.nl/index.php/home-english (accessed on 16 January 2024).
  30. Kraus, B.; Velthuis, H.H.W. High humidity in the honey bee (Apis mellifera L.) brood nest limits reproduction of the parasitic mite Varroa jacobsoni Oud. Naturwissenschaften 1997, 84, 217–218. [Google Scholar] [CrossRef]
  31. Ellis, M.B. Homeostasis: Humidity and Water Relations in Honeybee Colonies (Apis mellifera); Magister Scientiae University of Pretoria: Pretoria, South Africa, 2008; Available online: https://repository.up.ac.za/bitstream/handle/2263/28357/dissertation.pdf (accessed on 22 January 2024).
  32. LiI, X.; Ma, W.; Shen, J.; Long, D.; Feng, Y.; Su, W.; Xu, K.; Du, Y.; Jiang, Y. Tolerance and response of two honeybee species Apis cerana and Apis mellifera to high temperature and relative humidity. PLoS ONE 2019, 14, e0217921. [Google Scholar] [CrossRef] [PubMed]
  33. Ma, W.; Li, X.; Shen, J.; Du, Y.; Xu, K.; Jiang, Y. Transcriptomic analysis reveals Apis mellifera adaptations to high temperature and high humidity. Ecotoxicol. Environ. Saf. 2019, 184, 109599. [Google Scholar] [CrossRef] [PubMed]
  34. Meikle, W.G.; Weiss, M.; Maes, P.W.; Fitz, W.; Snyder, L.A.; Sheehan, T.; Mott, B.M.; Anderson, K.E. Internal hive temperature as a means of monitoring honey bee colony health in a migratory beekeeping operation before and during winter. Apidologie 2017, 48, 666–680. [Google Scholar] [CrossRef]
  35. Seeley, T.D. Atmospheric carbon dioxide regulation in honey-bee (Apis mellifera) colonies. J. Insect Physiol. 1974, 20, 2301–2305. [Google Scholar] [CrossRef] [PubMed]
  36. Stec, D.; Kuszewska, K. CO2 narcosis influences the memory of honey bees. J. Apic. Res. 2020, 59, 663–668. [Google Scholar] [CrossRef]
  37. Meikle, W.G.; Adamczyk, J.J.; Weiss, M.; Ross, J.; Werle, C.; Beren, E. Sublethal concentrations of clothianidin affect honey bee colony growth and hive CO2 concentration. Sci. Rep. 2021, 11, 4364. [Google Scholar] [CrossRef]
  38. Available online: https://www.amphenol-sensors.com/en/telaire/co2 (accessed on 16 January 2024).
  39. Available online: https://sensirion.com/products/catalog/?category=CO%E2%82%82 (accessed on 16 January 2024).
  40. Available online: https://www.figarosensor.com/ (accessed on 16 January 2024).
  41. Meikle, W.G.; Barg, A.; Weiss, M. Honey bee colonies maintain CO2 and temperature regimes in spite of change in hive ventilation characteristics. Apidologie 2022, 53, 51. [Google Scholar] [CrossRef]
  42. Bencsik, M.; McVeigh, A.; Tsakonas, C.; Kumar, T.; Chamberlain, L.; Newton, M.I. A Monitoring System for Carbon Dioxide in Honeybee Hives: An Indicator of Colony Health. Sensors 2023, 23, 3588. [Google Scholar] [CrossRef] [PubMed]
  43. Terenzi, A.; Cecchi, S.; Spinsante, S. On the Importance of the Sound Emitted by Honey Bee Hives. Vet. Sci. 2020, 7, 168. [Google Scholar] [CrossRef] [PubMed]
  44. Ramsey, M.; Bencsik, M.; Newton, M.I. Extensive vibrational characterisation and long-term monitoring of honeybee dorso-ventral abdominal vibration signals. Sci. Rep. 2018, 8, 14571. [Google Scholar] [CrossRef] [PubMed]
  45. Ramsey, M.-T.; Bencsik, M.; Newton, M.I.; Reyes, M.; Pioz, M.; Crauser, D.; Delso, N.S.; Le Conte, Y. The prediction of swarming in honeybee colonies using vibrational spectra. Sci. Rep. 2020, 10, 9798. [Google Scholar] [CrossRef] [PubMed]
  46. Bencsik, M.; Newton, M.I. Honey Bee Vibration Monitoring Using the 805M1 Accelerometer. Proceedings 2019, 4, 42. [Google Scholar] [CrossRef]
  47. Peters, J.M.; Gravish, N.; Combes, S.A. Wings as impellers: Honey bees co-opt flight system to induce nest ventilation and disperse pheromones. J. Exp. Biol. 2017, 220, 2203–2209. [Google Scholar] [CrossRef] [PubMed]
  48. Seeley, T.D. The Honey Bee Colony as a Superorganism. Am. Sci. 1989, 77, 546–555. [Google Scholar]
  49. Southwick, E.E. The honey bee cluster as a homeothermic superorganism. Camp. Biochem. Physiol. 1983, 75, 641–645. [Google Scholar] [CrossRef]
  50. Heinrich, B. How the honey bee regulates its body temperature. Bee World 1996, 77, 130–137. [Google Scholar] [CrossRef]
  51. Harrison, J.M. Roles of individual honeybee workers and drones in colonial thermogenesis. J. Exp. Biol. 1987, 129, 53–61. [Google Scholar] [CrossRef]
  52. Langstroth, L.L. Bee Hive. U.S. Patent US9300A, 5 October 1852. Available online: https://patentimages.storage.googleapis.com/71/b8/4e/0122ed14d4ec59/US9300.pdf (accessed on 22 January 2024).
Figure 1. The positions of the different sensors in the hives. Sensirion SCD41 sensors in the queen excluder and crown board measure temperature, relative humidity, and carbon dioxide. An accelerometer in the central frame measures acceleration, and the whole hive sits on a scale to measure the mass.
Applsci 14 01679 g001
Figure 2. The CO2 (black) and temperature (blue) data for colony HPP5 for (a) the crown board and (b) the queen excluder starting on Tuesday 6 December 2022 at 11:48.
Applsci 14 01679 g002
Figure 3. (a) The CO2 (black) and hive mass (purple) data for colony HPP5 for the queen excluder starting on Tuesday 6 December 2022 at 11:48. (b) The mass for colony HPP8 after the colony had died, showing the remaining daily mass variation in an empty hive.
Applsci 14 01679 g003
Figure 4. The temperature in the brood box (blue), the crown board (red), and the external temperature (orange) for colony HPP5 starting on Tuesday 6 December 2022 at 11:48.
Applsci 14 01679 g004
Figure 5. The CO2 in ppm (black) and vibration amplitude (orange) for the queen excluder in colony HPP6 (a) and colony HPP5 (b) starting on Tuesday 6 December 2022 at 11:48.
Applsci 14 01679 g005
Figure 6. The spectrogram for colony HPP6 starting on Tuesday 6 December 2022. The accelerometer output was Fourier-transformed to yield the frequencies present in the signal, and the depth of color shows the strength of each (red = strongest).
Applsci 14 01679 g006
Figure 7. The CO2 in ppm (black) and temperature (blue) for the queen excluder in colony HPP7 starting on Tuesday 6 December 2022 at 11:48. (a) The data shown for over 140 days and (b) a close-up of the same data for the first 35 days.
Applsci 14 01679 g007
Disclaimer/Publisher’s Note: The statements, opinions and data contained in all publications are solely those of the individual author(s) and contributor(s) and not of MDPI and/or the editor(s). MDPI and/or the editor(s) disclaim responsibility for any injury to people or property resulting from any ideas, methods, instructions or products referred to in the content.

