Abstract
The modification method of aluminosilicate clays and the modifier content have a decisive influence on the structure and properties of the obtained nanocomposites. Therefore, the development and research of new techniques of nanoclays modification are of great importance for polymer nano-chemistry. The work studied the modification of montmorillonite (MMT) using polyvinylpyrrolidone (PVP) in an aqueous colloidal solution with the subsequent separation of three separate fractions of the solution according to the previously developed method. The influence of the initial mass ratio of components (MMT/PVP) on the structure and thermal properties of the modified MMT in each solution layer was determined. Scanning electron microscopy (SEM), X-ray diffraction (XRD), thermal gravimetry (TG), differential scanning calorimetry (DSC), and Fourier-transform infrared (FTIR) spectroscopy were used for research. It was established that the mass ratio of components in the initial solution has almost no effect on the structure of MMT in the top and middle solution layers, but significantly affects the yield of final products. Different structures can be obtained in the bottom layer of the solution. Still, intercalated MMT was obtained exclusively at the mass ratio of MMT/PVP = 1:2. In addition, the work investigated the structure and thermal properties of modified montmorillonites with the same PVP content, and it has been proven that such composites have dissimilar structures and properties when obtained by different methods.
1. Introduction
The polymer industry has undergone significant changes in the past few years and is trying to become more environmentally friendly. Therefore, manufacturers of polymer products, in particular polymer packaging and disposable goods, increasingly use biodegradable or biopolymers instead of traditional synthetic polymers. However, biodegradable polymers have several significant disadvantages that limit their fields of application. Among them are low mechanical strength, thermal resistance, resistance to solvents, insufficient barrier properties, etc. To eliminate these shortcomings and at the same time meet the requirements of biodegradability and cost of materials, it is necessary to use appropriate environmentally friendly fillers or modifiers. One of the most modern and advantageous methods of improving the performance characteristics of biodegradable polymers is the introduction of nanostructured fillers to obtain hybrid polymer nanocomposites [1,2,3,4,5,6]. The most common nanofillers are carbon nanotubes, graphene, chitosan and silica nanoparticles, starch nanocrystals, cellulose nanofibers, and layered silicates [4,7,8,9,10].
Mapossa et al. [11] analyzed the structure and properties of various composites based on biodegradable polymers and bentonite clays and showed their potential for multifunctional applications. Including bentonite clay in biodegradable polymers can lead to increased crystallinity and thermal stability due to the creation of a thermal barrier and significantly increase the tensile strength, impact strength, and stiffness of composites. Such bio(nano)composites are versatile and promising in various industrial applications such as packaging, energy storage, electromagnetic shielding, and electronics, including flexible electronics.
Layered clay minerals were first used in the 1980s to produce nylon–clay nanocomposite using MMT [12,13]. Due to the successful development of nylon–MMT nanocomposite, clay minerals of various structural types have been widely used as fillers for the development of functional materials based on thermoplastic [2,10,11] and thermoset polymers [14,15]. Anisotropic shapes of crystalline structures, such as lamellar nanoparticles with different aspect ratios, are believed to lead to diverse/controllable functions of the resulting hybrid materials [1,16,17]. The degree of dispersion of such nanoparticles in the polymer matrix is a crucial parameter that determines the properties of the obtained nanocomposites [18]. In turn, the degree of dispersion depends on the affinity between the polymer and the clay mineral. This affinity is increased by modification of the outer and inner (interlayer space of layered silicates) surfaces of clay mineral particles [18,19,20,21,22,23].
Natural and synthetic water-soluble polymers are widely used for “eco-modification” of layered silicates, namely polysaccharides, alginates, cellulose, gelatin [24,25,26,27], as well as PVP, polyvinyl alcohol (PVA), polyacrylamide (PAA), polyethylene glycol. (PEG) [1,21,28]. These polymers are applied to stabilize nanoparticles (prevent aggregation), improve their dispersion in solvents, and, as a protective layer for growing nanoparticles of the required morphology [29,30,31]. Koczkur et al. [29] showed that PVP is a surface stabilizer, growth modifier, nanoparticle dispersant, and reducing agent during the colloidal synthesis of nanostructures. The growth and morphology of nanoparticles depend primarily on the molecular weight of PVP and its amphiphilic nature. In this way, it is possible to regulate the solubility of the obtained nanostructures in various solvents, provide selective stabilization of their surface [32,33,34], and even gain access to kinetically controlled growth conditions.
Levy and Francis [35], using the methods of X-ray diffraction and desorption of 109Cd and 85Sr, showed that PVP is adsorbed on the surface of MMT and attaches to tetrahedral sheets. Moreover, with a decrease in the number of solvent layers in the interlayer space of MMT, the amount of adsorbed PVP decreases. Sequaris et al. [36,37] also studied the adsorption of PVP on the MMT surface. The formation of intercalated montmorillonite tactoids and the growth of basal spacing (d001) with an increase in the adsorbed PVP amount were confirmed. The formed polymer layer on the surface of MMT significantly affects its adsorption capacity, especially the degree of binding of anionic and neutral organic chemicals. Szczerba et al. [38] showed that PVP is adsorbed on the 001 surfaces of layered silicate (smectite) with the formation of a layer 5–6 Å thick, and the PVP chains that are directly connected to the silicate surface are more rigid and ordered than the outer chains. In addition, the charge in tetrahedral or octahedral positions of smectite practically does not affect the PVP structure.
In most works, exfoliated nanocomposites based on MMT are obtained at a low nanoclay content, mainly from 1 to 7 wt% [39,40,41,42], rarely with 20 wt% [43]. Villaça et al. [44] presented a method for obtaining exfoliated nanocomposites based on MMT and PVP in an aqueous solution with a high content of MMT from 50 to 67 wt%. They showed that the yield of the exfoliated nanocomposite significantly depends on the duration of mechanical stirring of the suspension, and optimal characteristics are achieved after 18 h of stirring. The nanocomposite with an MMT content of 67 wt% has significantly higher heat resistance than the original PVP.
Dornelas et al. [45] presented a method of obtaining montmorillonite intercalated with PVP (PVP K-30) in CHCl2 solution at room temperature and mechanical stirring. It is shown that the yield of intercalated MMT depends on the initial mass ratio of the components in the solution and is 27%, 20%, and 15% for the PVP/MMT mass ratio of 2:1, 1:1, and 1:2, respectively. The resulting intercalated nanocomposites are recommended for use as a matrix for the sustained release of drugs and as dissolution enhancers.
Therefore, the mass ratio of the components during the obtaining of MMT/PVP nanocomposites significantly affects the yield and structure of the final products. In a previous work [46], we presented a new method of MMT modification using PVP. The modification process is carried out in an aqueous solution with a mass ratio of MMT/PVP = 1:2 and subsequent solution separation into three fractions (nanocomposites of different structures). Simultaneously intercalated, flocculated, and exfoliated MMT is obtained from one prepared solution. Considering the above, this work aims to investigate the influence of the initial MMT/PVP mass ratio on the yield, structure, and thermal properties of montmorillonites obtained by this method. The work task is also to compare the structure and properties of these MMT-s with the nanocomposite of the composition MMT/PVP = 1:12, obtained similarly but without solution fractionation. This ratio of MMT/PVP is chosen because it has been established in previous work [46] that exfoliated MMT contains about 93 wt% PVP.
2. Materials and Methods
2.1. Materials
MMT K10 (281522, Sigma-Aldrich, St. Louis, MO, USA) with a surface area of 220–270 m2/g, charge-balancing cation K+, cation exchange capacity of 58–60 meq/100 g, and PVP 10 (P1368, Duchefa Biochemie, Haarlem, The Netherlands) with an average molecular weight average of 10,000 are used.
2.2. Preparation of Modified MMT Samples
MMT samples are prepared using a previously developed MMT modification method using PVP in an aqueous colloidal solution with the subsequent selection of three separate solution fractions [46]. Colloidal solutions of MMT and PVP are prepared as described in the previous work [46]. However, this work, unlike the previous one, studied nanocomposites obtained with different ratios of MMT/PVP in the initial solution. Therefore, aqueous colloidal solutions of MMT and PVP were mixed under the influence of ultrasound in such proportions that the mass ratio of MMT and PVP in the suspension was 4:1, 3:1, 2:1, 1:1, and 1:2, respectively. After mixing, each resulting suspension is separated into three layers (fractions). As a result, after appropriate treatment of these fractions, three modified montmorillonites are obtained from each suspension: the bottom layer (MMT/PVP-bottom)—finely dispersed light gray powder, the middle layer (MMT/PVP-middle)—finely dispersed white powder, and the top layer (MMT/PVP-top)—light-yellow film, which was ground using a laboratory mill.
The yield of each type of modified MMT is presented in Table 1. As the content of MMT in the initial mixture increases, the yield of the bottom and middle layers increases. This indicates that most of the original MMT is contained in the bottom and middle layers, and the top layer consists mainly of PVP. The XRD, TGA, and FTIR analysis results also confirm these conclusions.

Table 1.
Fractions yield of modified MMT depending on the component ratio.
A nanocomposite with a mass ratio of MMT/PVP = 1:12 is also obtained for comparative studies. Colloidal solutions of MMT and PVP are prepared similarly. They are mixed under the influence of ultrasonic waves with a frequency of 40 kHz (in the Sonic-0.5 apparatus (Polsonic, Warsaw, Poland) for 25 min in quantities so that the mass ratio of MMT/PVP is 1:12, respectively. This colloidal solution is homogeneous and does not separate into any layers. The resulting mixture is dried at 70–80 °C in an air dryer, and then under vacuum to completely remove water. Next, the target product is ground in a laboratory mill.
2.3. Methods
The crystal structure of the nanocomposite samples was investigated via X-ray Diffraction. Diffraction patterns were measured on a PANalytical Empyrean diffractometer (Malvern Panalytical, Malvern, UK) within angles from 4° to 60° with a step of 0.017° and the exposure time of each point of 15 s. Illuminating lamps with CuKα radiation (λ = 154,056 Å, 45 kV, 40 mA) were used.
A Cary 630 type attenuated total reflection Fourier transform infrared (ATR-FTIR) spectrometer (Agilent Technologies, Santa Clara, CA, USA) was used to investigate the chemical structure of the samples. The spectra were taken in the absorption mode after 8 scans, at a resolution of 4 cm−1, for the range 3700–400 cm−1.
The thermal stability of the samples was investigated in a nitrogen atmosphere (flow rate of 60 mL/min) using a Q500 thermogravimetric analyzer (TA Instruments, New Castle, DE, USA). Samples weighing approximately 18 mg were heated to 1000 °C at a heating rate of 10 °C/min. The sample weight loss during heating was recorded (TG curves).
A differential scanning calorimeter type DSC 1 STARe System (Mettler Toledo, Columbus, OH, USA) was used to study the thermal behavior of the nanocomposites. DSC measurements were performed on samples weighing approximately 5 mg in a nitrogen atmosphere (flow rate of 50 mL/min). The studied samples were first heated from −40 to 300 °C, annealed at 300 °C for 3 min, then cooled to −40 °C and reheated to 300 °C. The sample heating-cooling rate was 10 °C/min. The second heating cycle was used to determine the glass transition temperature of the samples.
The surface microstructure of nanocomposite samples was studied using a Hitachi SU8010 scanning electron microscope (SEM) (Hitachi, Tokyo, Japan) using a secondary electron (SE) detector at an accelerating voltage of 15 kV. The samples were pre-sputtered with gold (5 nm) to improve image quality. Elemental microanalysis of nanocomposites was carried out using energy-dispersive X-ray radiation (EDX) at an accelerating voltage of 15 kV.
3. Results and Discussion
3.1. Crystal Structure of the Modified MMT
The X-ray diffraction patterns for the studied samples are shown in Figure 1, Figure 2 and Figure 3. The original MMT (Figure 1, curve a) has a typical MMT crystal structure. All main characteristic reflections are present, including montmorillonite reflections: M(001) at 2Θ = 8.79, M(002) at 2Θ = 17.71, M(110) at 2Θ = 19.77, M(220) at 2Θ = 34.91 and quartz reflections: Q(101) at 2Θ = 26.59, Q(112) at 2Θ = 45.44. Identical reflections are present in the diffractograms of all MMT/PVP-bottom samples (Figure 1) regardless of the MMT/PVP ratio in the original mixture, however, their position and intensity differ significantly. For example, the MMT/PVP-bottom sample at the MMT:PVP ratio 1:2 (Figure 1, curve f) is characterized by a shift of all characteristic reflections towards smaller 2Θ angles and a decrease in their intensity. This indicates the entry of PVP macromolecules into the interlayer space of MMT, that is, its intercalation. The formation of an intercalated structure in the sample was confirmed in a previous work [46]. At other ratios of MMT and PVP, all the characteristic reflections in the MMT/PVP-bottom samples are shifted towards larger 2Θ angles compared to the pure MMT (Figure 1, curves b–e). This may indicate the adsorption of PVP on the MMT surface and the absence of its intercalation. Therefore, it can be concluded that for the intercalation of MMT with PVP according to the developed method, it is necessary to have an excess of PVP in the initial solution.
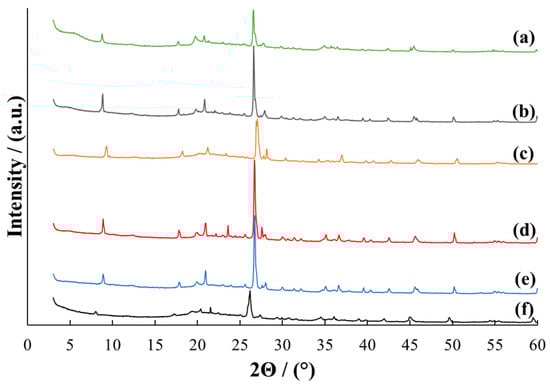
Figure 1.
X-ray diffraction patterns for MMT (a) and MMT/PVP-bottom at the MMT:PVP ratio 4:1 (b); 3:1 (c); 2:1 (d), 1:1 (e), 1:2 (f).
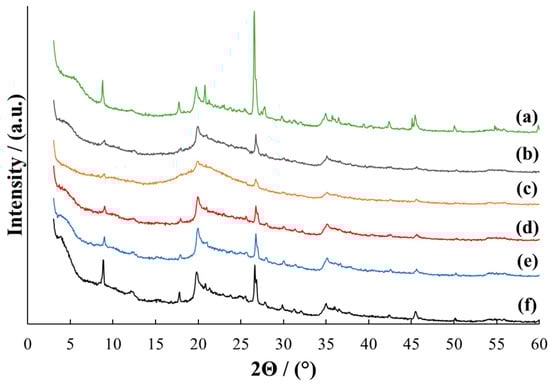
Figure 2.
X-ray diffraction patterns for MMT (a) and MMT/PVP-middle at the MMT:PVP ratio 4:1 (b); 3:1 (c); 2:1 (d), 1:1 (e), 1:2 (f).
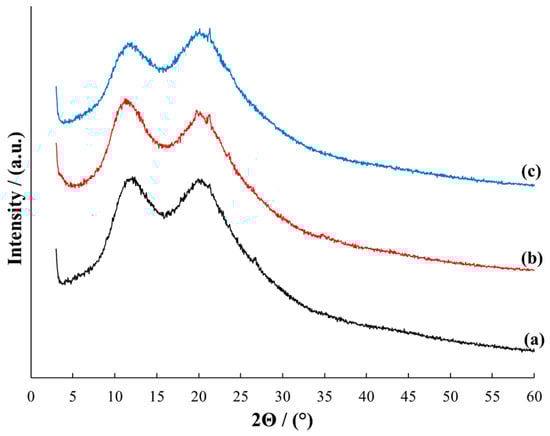
Figure 3.
X-ray diffraction patterns for MMT/PVP = 1:12 (a), MMT/PVP-top at the MMT:PVP ratio 1:2 (b) and PVP (c).
In the MMT/PVP-middle samples, all characteristic MMT reflections are slightly shifted towards larger 2Θ angles, regardless of the ratio of components (Figure 2, curves b–f). The appearance of these diffraction patterns differs from the pure MMT. Individual MMT reflections disappear, and PVP reflections appear. The intensity of M(001), M(002), and Q(101) reflections of these samples depends on the MMT/PVP ratio and is the highest for samples of pure MMT and MMT/PVP = 1:2. It can be argued that all MMT/PVP-middle samples have a flocculated structure (partially intercalated and exfoliated structure) [46] regardless of the initial ratio of components. It can be assumed that the MMT/PVP-middle = 3:1 contains the least amount of intercalated MMT. This is confirmed by the very low intensity of the M(001) reflection (Figure 2, curve c).
The diffractograms of samples MMT/PVP = 1:12 (Figure 3, curve a), MMT/PVP-top (Figure 3, curve b), and pure PVP (Figure 3, curve c) are almost identical. It is worth noting that the initial MMT/PVP ratio almost does not affect the appearance of the MMT/PVP-top diffractogram therefore Figure 3 shows only the diffractogram of the MMT/PVP-top at the MMT:PVP ratio 1:2. The M(001) reflection at 2Θ = 8.79°, which characterizes the interlayer space in MMT, is absent in the MMT/PVP-top and MMT/PVP = 1:12. This indicates almost complete exfoliation of MMT in these samples. However, it is possible to highlight some differences in the diffractograms of these samples. The diffraction pattern of the MMT/PVP-top sample (Figure 3, curve b) shows reflections M(110) at 2Θ = 19.72° and M(220) at 2Θ = 34.81°, which are characteristic of MMT at 2Θ = 19.77° and 2Θ = 34.91°, respectively (Figure 1, curve a). These reflections are absent in the PVP and MMT/PVP = 1:12, and in the MMT/PVP-top sample, they are shifted to the area of smaller 2Θ angles compared to pure MMT. In the MMT/PVP = 1:12 sample, there is a Q(101) reflection at 2Θ = 26.79° (Figure 3, curve a), which is characteristic of MMT at 2Θ = 26.59° (Figure 1, curve a). This reflection is absent in PVP and MMT/PVP-top. The reflection at 2Θ = 21.32° is present in the diffractograms of all three samples. Its intensity is highest in PVP and lowest in MMT/PVP = 1:12. Other analyses confirm these differences in the structure of the MMT/PVP-top and MMT/PVP = 1:12 samples. It can be assumed that this is due to different physical interactions between PVP macromolecules and MMT sheets in the samples.
3.2. FTIR Spectra of the Modified MMT
A detailed description of the FTIR spectra of pure PVP and MMT is presented in previous work [43]. The spectra of the MMT/PVP-bottom samples (Figure 4) are almost identical to the MMT/PVP-middle samples (Figure 5) regardless of the initial MMT/PVP ratio in the solution. In the spectra of these samples, in contrast to the sample of pure MMT (Figure 4 and Figure 5, curve a), new absorption bands appear in the range of 1652 cm−1 (C=O group), 747 cm−1 (CH2 group), and 1271 cm−1 (C–H group), which are characteristic of original PVP (Figure 6, curve b). These absorption bands’ position and relative intensity may vary slightly for different samples. In particular, in the spectra of MMT/PVP-middle samples, the relative intensity of these three absorption bands is higher than for MMT/PVP-bottom samples, which may indicate a higher content of PVP in MMT/PVP-middle samples. The change in the initial ratio of the components (MMT/PVP) practically does not affect the spectra of these samples, so it can be assumed that the content of MMT in the bottom and middle layers of the suspension does not depend on the initial ratio of MMT/PVP, but only affects the yield of products.
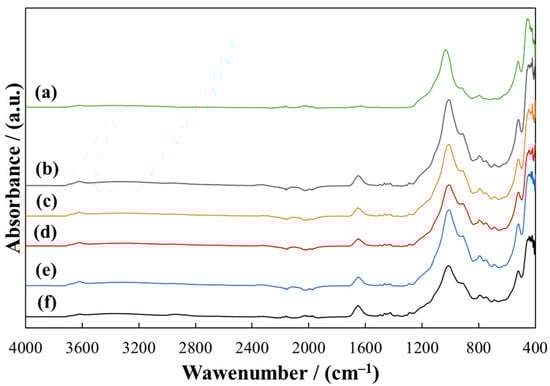
Figure 4.
ATR-FTIR spectra of MMT (a) and MMT/PVP-bottom at the MMT:PVP ratio 4:1 (b); 3:1 (c); 2:1 (d), 1:1 (e), 1:2 (f).
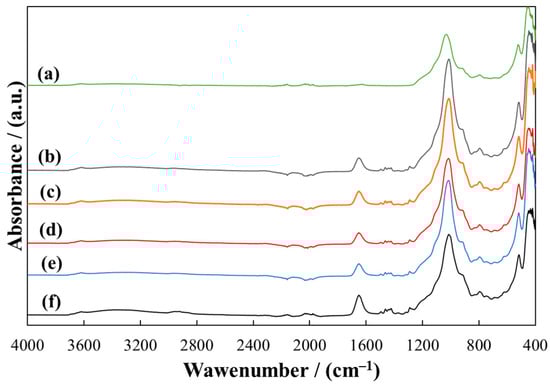
Figure 5.
ATR-FTIR spectra of MMT (a) and MMT/PVP-middle at the MMT:PVP ratio 4:1 (b); 3:1 (c); 2:1 (d), 1:1 (e), 1:2 (f).
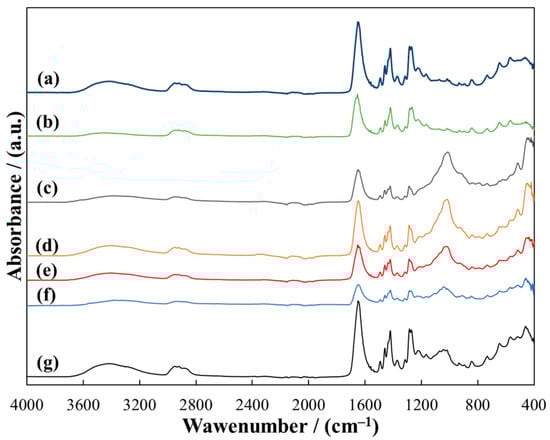
Figure 6.
ATR-FTIR spectra of MMT/PVP = 1:12 (a), PVP (b) and MMT/PVP-top at the MMT:PVP ratio 4:1 (c); 3:1 (d); 2:1 (e), 1:1 (f), 1:2 (g).
The spectra of the MMT/PVP-top samples are similar to the spectrum of MMT/PVP = 1:12 and pure PVP (Figure 6). However, the spectra of the MMT/PVP-top samples with different MMT/PVP ratios differ significantly (Figure 6). As the MMT content in the original mixture increases, the relative intensity of the absorption bands of stretching (1032 cm−1) and deformation (451 cm−1) vibrations of the Si–O–Si bond in the structure of MMT increases significantly. At the same time, the relative intensity of the bands characteristic of PVP decreases. That is, the amount of MMT in the MMT/PVP-top samples increases with the increase in the amount of MMT in the original mixture. The spectrum of MMT/PVP = 1:12 is very similar to the PVP spectrum (Figure 6, curves a and b). However, there are significant shifts in the characteristic absorption bands, and their relative intensity differs significantly (in the sample of MMT/PVP = 1:12 it is higher). In particular, as the modification result, there were bathochromic shifts of the absorption bands at 1653 cm−1 and 647 cm−1 to 1646 cm−1 and 645 cm−1, respectively. The rest of the absorption bands characteristic of PVP have hypsochromic shifts in the sample MMT/PVP = 1:12. This confirms the presence of a physical interaction between PVP macromolecules and exfoliated MMT sheets in this sample. The spectrum of the MMT/PVP = 1:12 sample, unlike the spectra of the MMT/PVP-top samples, does not contain absorption bands characteristic for MMT at 1032 and 451 cm−1. This further confirms the assumptions about some differences in the structure of these samples made in the XRD analysis.
3.3. Thermal Degradation of the Modified MMT Samples
So, the structure of the MMT/PVP = 1:12 is similar to the MMT/PVP-top, which is logical since their quantitative composition is the same. TGA (Figure 7) confirmed this conclusion. TG curves of MMT (curve a), MMT/PVP-bottom (curve b), and MMT/PVP-middle (curve c) significantly differ from curves of MMT/PVP-top (curve d), MMT/PVP = 1:12 (curve e), and PVP (curve f). Thermal phenomena in the MMT, PVP, MMT/PVP-bottom, MMT/PVP-middle, and MMT/PVP-top are described in detail in the previous work [43]. Thermal destruction of MMT, MMT/PVP-bottom, and MMT/PVP-middle samples occur during three stages, and PVP, MMT/PVP-top, and MMT/PVP = 1:12 during four stages (Table 2). The mass loss of the MMT/PVP = 1:12 (about 9.5%) is lower in the first two stages of thermolysis (up to temperatures of 345 °C) compared to the PVP (about 10.8%), MMT/PVP-top (about 11%), and MMT (about 10%) (Figure 7, Table 2). This mass loss is mainly associated with the evaporation of absorbed water and the beginning of oxidation-reduction processes in PVP macromolecules (at the second stage of thermolysis). At the third stage of thermolysis in the range of 345–486 °C, the MMT/PVP = 1:12 degrades faster than the MMT/PVP-top but slower than the original PVP (mass loss of MMT/PVP = 1:12 is 86.2%, MMT/PVP-top—80.8%, PVP—86.9%). This mass loss is associated with the destruction of PVP macrochains. The mass residue of the samples at 486 °C is also significantly different: For MMT/PVP = 1:12, it is almost two times smaller (4.3%) than for MMT/PVP-top (8.2%) and two times larger than the original PVP (2.3%). PVP completely burns at 800 °C. The masses residues of MMT/PVP = 1:12 and MMT/PVP-top samples are about 2 and 4%, respectively, at 980 °C. Thus, the destruction and dehydration of the MMT crystal lattice at temperatures above 600 °C occur more intensively in the MMT/PVP = 1:12 than in the MMT/PVP-top. Similar results of accelerated thermal destruction of organically modified MMT are found in many works [47,48]. The samples MMT/PVP = 1:12 and MMT/PVP-top have different structures and heat resistance, although their quantitative composition is the same. That is, the modified MMT structure and thermal properties significantly depend on the preparation method.
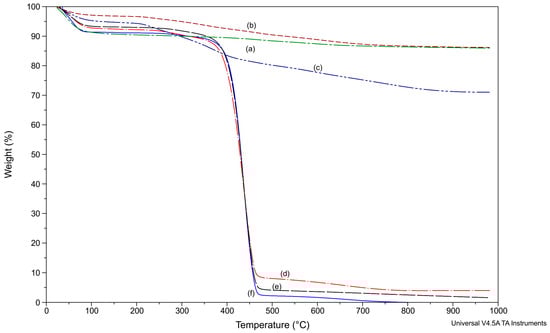
Figure 7.
TGA of MMT (a); MMT/PVP-bottom (b), MMT/PVP-middle (c), MMT/PVP-top (d) at the MMT:PVP ratio 1:2; MMT/PVP = 1:12 (e) and PVP (f).
Table 2.
Results of TG analysis for modified MMT samples.
3.4. Differential Scanning Calorimetry
The DSC analysis is used to study the thermal behavior of the MMT/PVP = 1:12 and MMT/PVP-top samples. The DSC curves of PVP and the MMT/PVP = 1:12 are very similar (Figure 8 and Figure 9). However, the glass transition temperature of pure PVP is almost 3 °C higher than that of the MMT/PVP = 1:12 sample (141.7 and 138.9 °C, respectively). During the first heating of these samples, only one endopeak (in the 34–118 °C) is observed on the DSC curves, which is associated with the evaporation of moisture. The enthalpy values of these processes in the samples are almost identical (for PVP ΔH = 359.1 J/g, for MMT/PVP = 1:12 ΔH = 355.7 J/g). During the first heating of the MMT/PVP-top sample (Figure 10), two endopeaks (in the ranges of 38–126 °C and 218–286 °C) are observed on the DSC curve. Suppose the first endopeak can be explained by the moisture evaporation (ΔH = 281.2 J/g). In that case, the second endopeak is most likely explained by the partial destruction of weak physical bonds formed between MMT and PVP (ΔH = 16.9 J/g). These endopeaks are absent during the second scan of the sample, which indicates the completion of the above processes. During the cooling of the studied samples (crystallization curve), no thermal processes occur (Figure 8, Figure 9 and Figure 10), which confirms their amorphous structure. The glass transition temperature of the MMT/PVP-top sample is 144.2 °C. Therefore, it notes significant differences in the thermal behavior of the studied samples of modified MMT. In particular, the glass transition temperature of the MMT/PVP-top sample increased by 2.5 °C compared to the original PVP, and the MMT/PVP = 1:12 sample decreased by 2.8 °C. Also, the MMT/PVP-top sample has a significantly lower value of the enthalpy of evaporation of absorbed water than the MMT/PVP = 1:12 and PVP samples, which indicates a different amount and type of evaporated water and correlates with TGA data. Such differences are explained by other physical interactions between PVP macromolecules and exfoliated MMT sheets in these samples and their different structure. Preliminary analyses and SEM confirm such assumptions.
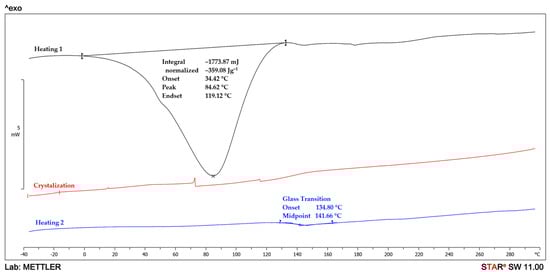
Figure 8.
DSC curves of PVP.
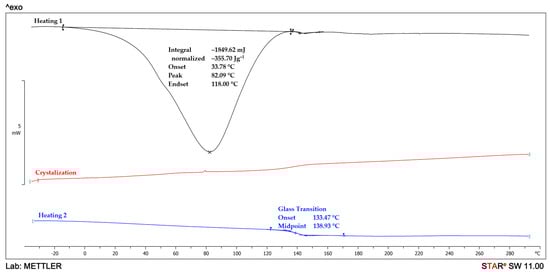
Figure 9.
DSC curves of MMT/PVP = 1:12.
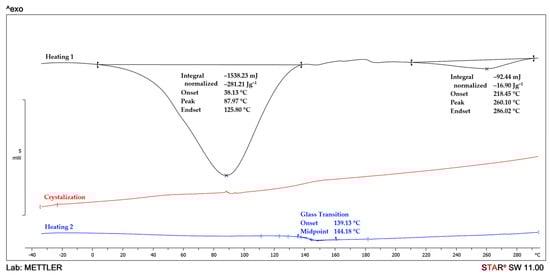
Figure 10.
DSC curves of MMT/PVP-top at the MMT:PVP ratio 1:2.
3.5. Surface Morphology and Composition
Since the sample MMT/PVP = 1:12 in all characteristics and structure is the closest to MMT/PVP-top, SEM images of these samples are shown in Figure 11. SEM images of the original substances are also presented. The original MMT is in the form of agglomerates 3–20 μm in size, consisting of polydisperse particles 150–300 nm in size with a layered structure (Figure 11a). The particles of the original PVP have sizes from 10 to 50 μm and different shapes (Figure 11b). The sample MMT/PVP = 1:12 (Figure 11c) has a completely exfoliated structure, in which individual sheets of MMT covered with PVP are evenly distributed. The MMT/PVP-top sample (Figure 11d) has a similar structure to the MMT/PVP = 1:12 sample. However, there are single non-exfoliated MMT packets. This may indicate the incomplete exfoliation of MMT in this sample and the presence of a small amount of intercalated MMT packets that positively affect the heat resistance of this sample compared to the completely exfoliated MMT/PVP = 1:12.
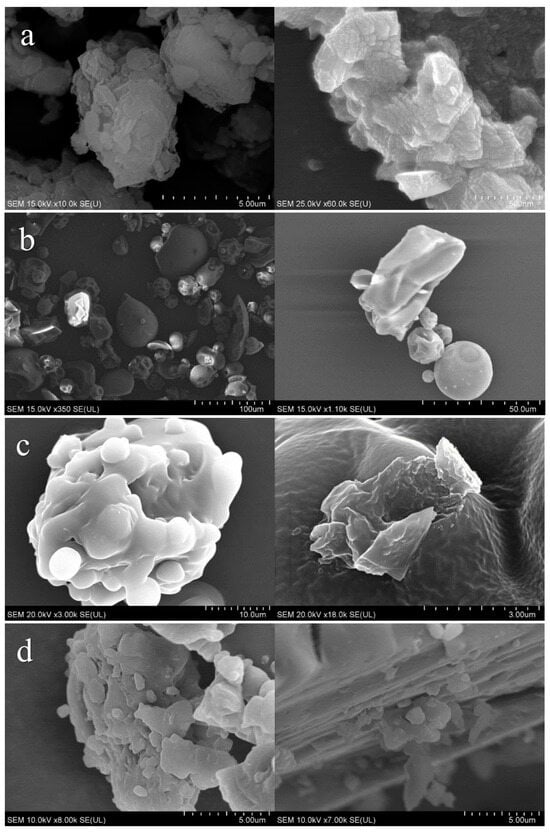
Figure 11.
SEM images of MMT (a); PVP (b); MMT/PVP = 1:12 (c); MMT/PVP-top at the MMT:PVP ratio 1:2 (d).
EDX analysis (Table 3) confirms approximately the same amount of MMT in the samples MMT/PVP-top and MMT/PVP = 1:12. The samples contain almost equal amounts of elements Si and Al, which are absent in the original PVP.
Table 3.
EDX elemental compositions of modified MMT.
4. Conclusions
The paper examines the influence of the ratio of components on the MMT modification process, which consists of mixing, under the ultrasound, aqueous colloidal solutions of MMT and PVP and selecting individual fractions formed during the settling of the resulting solution. Different structures and yields of target products can be obtained depending on the ratio of the initial components. In particular, intercalated MMT can be obtained only in the bottom layer of the solution at the MMT:PVP ratio 1:2. At other ratios of components (MMT:PVP = 4:1, 3:1, 2:1, 1:1), MMT with PVP molecules adsorbed on the surface is formed in the bottom layer of the solution. In the middle and top layers of the solution, flocculated and exfoliated MMT are formed, respectively, regardless of the ratio of components in the original mixture. The most optimal MMT:PVP ratio can be considered 1:2 because only with this ratio can you obtain three types of modified MMT (intercalated, flocculated, and exfoliated) from one prepared solution.
A comparative analysis of two exfoliated MMT/PVP nanocomposites (MMT/PVP = 1:12 and MMT/PVP-top at the MMT:PVP ratio 1:2) with the same PVP content (about 93 wt%), obtained by different methods, showed differences in their structure and thermal behavior. In particular, the formation of mostly exfoliated MMT structures in these samples was confirmed by SEM, TGA, FTIR, DSC, and XRD. However, in the MMT/PVP-top sample, in contrast to MMT/PVP = 1:12, a small number of intercalated MMT structures were detected. It had a positive effect on the heat resistance of this sample and increased its glass transition temperature. In the MMT/PVP = 1:12 nanocomposite, MMT is completely exfoliated with a uniform distribution of MMT sheets between PVP macromolecules as, a result, its heat resistance is lower than that of the MMT/PVP-top, and its glass transition temperature is even 2.8 °C lower than that of the original PVP.
Each type of modified MMT can be further used to modify polymers, including biodegradable ones, to obtain nanocomposites for various purposes. Preliminary studies of the influence of exfoliated MMT (MMT/PVP-top) on the polyethylene (PE) stretch film properties were conducted. It was established that adding a small amount of MMT/PVP-top to PE increases the adhesive properties of the stretch film and allows the use of a much smaller amount of special glue during extrusion. Intercalated and flocculated MMT, for example, significantly changes the MFR of the biopolymer polybutylene succinate (PBS) and improves the optical and mechanical properties of PBS-based films. The following works will be devoted to a detailed study of the influence of the obtained modified montmorillonites on the properties of various polymers.
Author Contributions
Conceptualization, V.K.; methodology, V.K., R.M. and O.K.; validation, K.B., R.M. and L.D.; formal analysis, V.K. and O.K.; investigation, V.K., L.D. and O.K.; resources, L.D. and K.B.; writing—original draft preparation, V.K.; writing—review and editing, V.K., L.D., R.M. and K.B.; visualization, V.K. and O.K.; supervision, K.B.; project administration, V.K. and L.D. All authors have read and agreed to the published version of the manuscript.
Funding
This research was funded by the European Union’s programme for research and innovation Horizon Europe under the Marie Skłodowska-Curie Action grant agreement No 101129698–PROMATAI–Horizon–MSCA–2022–SE–01. Views and opinions expressed are however those of the author(s) only and do not necessarily reflect those of the European Union or European Research Executive Agency. Neither the European Union nor the granting authority can be held responsible for them.
Institutional Review Board Statement
Not applicable.
Informed Consent Statement
Not applicable.
Data Availability Statement
The data presented in this study are available on request from the corresponding author. The data are not publicly available due to privacy.
Acknowledgments
The work was also carried out within the framework of the National Scholarship Program of the Slovak Republic.
Conflicts of Interest
The authors declare no conflicts of interest.
References
- Teepakakorn, A.; Ogawa, M. Interactions of layered clay minerals with water-soluble polymers; structural design and functions. Appl. Clay Sci. 2022, 222, 106487. [Google Scholar] [CrossRef]
- Bailey, E.J.; Winey, K.I. Dynamics of polymer segments, polymer chains, and nanoparticles in polymer nanocomposite melts: A Review. Prog. Polym. Sci. 2020, 105, 101242. [Google Scholar] [CrossRef]
- Fu, S.; Sun, Z.; Huang, P.; Li, Y.; Hu, N. Some basic aspects of polymer nanocomposites: A critical review. Nano Mater. Sci. 2019, 1, 2–30. [Google Scholar] [CrossRef]
- Sarfraz, J.; Gulin-Sarfraz, T.; Nilsen-Nygaard, J.; Pettersen, M.K. Nanocomposites for food packaging applications: An overview. Nanomaterials 2020, 11, 10. [Google Scholar] [CrossRef]
- Miao, C.; Hamad, W.Y. Critical insights into the reinforcement potential of cellulose nanocrystals in polymer nanocomposites. Curr. Opin. Solid State Mater. Sci. 2019, 23, 100761. [Google Scholar] [CrossRef]
- Kargarzadeh, H.; Mariano, M.; Huang, J.; Lin, N.; Ahmad, I.; Dufresne, A.; Thomas, S. Recent developments on nanocellulose reinforced polymer nanocomposites: A Review. Polymer 2017, 132, 368–393. [Google Scholar] [CrossRef]
- Borriello, C.; De Maria, A.; Jovic, N.; Montone, A.; Schwarz, M.; Antisari, M.V. Mechanochemical exfoliation of graphite and its polyvinyl alcohol nanocomposites with enhanced barrier properties. Mater. Manuf. Process. 2009, 24, 1053–1057. [Google Scholar] [CrossRef]
- Li, Y.-C.; Schulz, J.; Grunlan, J.C. Polyelectrolyte/nanosilicate thin-film assemblies: Influence of ph on growth, mechanical behavior, and flammability. ACS Appl. Mater. Interfaces 2009, 1, 2338–2347. [Google Scholar] [CrossRef]
- Bilbao-Sáinz, C.; Avena-Bustillos, R.J.; Wood, D.F.; Williams, T.G.; McHugh, T.H. Composite edible films based on hydroxypropyl methylcellulose reinforced with microcrystalline cellulose nanoparticles. J. Agric. Food Chem. 2010, 58, 3753–3760. [Google Scholar] [CrossRef]
- Krasinskyi, V.; Gajdos, I.; Suberlyak, O.; Antoniuk, V.; Jachowicz, T. Study of the structure and thermal characteristics of nanocomposites based on polyvinyl alcohol and Intercalated Montmorillonite. J. Thermoplast. Compos. Mater. 2019, 34, 1680–1691. [Google Scholar] [CrossRef]
- Mapossa, A.; da Silva Júnior, A.; de Oliveira, C.; Mhike, W. Thermal, morphological and mechanical properties of multifunctional composites based on biodegradable polymers/bentonite clay: A Review. Polymers 2023, 15, 3443. [Google Scholar] [CrossRef] [PubMed]
- Fukushima, Y.; Inagaki, S. Synthesis of an intercalated compound of montmorillonite and 6-polyamide. J. Incl. Phenom. 1987, 5, 473–482. [Google Scholar] [CrossRef]
- Usuki, A.; Kojima, Y.; Kawasumi, M.; Okada, A.; Fukushima, Y.; Kurauchi, T.; Kamigaito, O. Synthesis of nylon 6-clay hybrid. J. Mater. Res. 1993, 8, 1179–1184. [Google Scholar] [CrossRef]
- Nanda, T.; Sharma, G.; Mehta, R.; Shelly, D.; Singh, K. Mechanisms for enhanced impact strength of epoxy based nanocomposites reinforced with silicate platelets. Mater. Res. Express 2019, 6, 065061. [Google Scholar] [CrossRef]
- Shelly, D.; Nanda, T.; Mehta, R. Addition of compatibilized nanoclay to gfrcs for improved Izod impact strength and tensile properties. Proc. Inst. Mech. Eng. Part L J. Mater. Des. Appl. 2021, 235, 2022–2035. [Google Scholar] [CrossRef]
- Huang, J.; Tang, Z.H.; Zhang, X.H.; Guo, B.C. Halloysite polymer nanocomposites. Dev. Clay Sci. 2016, 7, 509–553. [Google Scholar] [CrossRef]
- Chen, B.; Evans, J.R.; Greenwell, H.C.; Boulet, P.; Coveney, P.V.; Bowden, A.A.; Whiting, A. A critical appraisal of polymer–clay nanocomposites. Chem. Soc. Rev. 2008, 37, 568–594. [Google Scholar] [CrossRef] [PubMed]
- Tirayaphanitchkul, C.; Imwiset, K.; Ogawa, M. Nanoarchitectonics through organic modification of oxide based layered materials; concepts, methods and functions. Bull. Chem. Soc. Jpn. 2021, 94, 678–693. [Google Scholar] [CrossRef]
- Phuekphong, A.; Imwiset, K.; Ogawa, M. Designing nanoarchitecture for environmental remediation based on the clay minerals as building block. J. Hazard. Mater. 2020, 399, 122888. [Google Scholar] [CrossRef]
- Okada, T.; Ide, Y.; Ogawa, M. Organic–inorganic hybrids based on ultrathin oxide layers: Designed nanostructures for molecular recognition. Chem. Asian J. 2012, 7, 1980–1992. [Google Scholar] [CrossRef]
- Krasinskyi, V.; Suberlyak, O.; Dulebová, Ľ.; Antoniuk, V. Nanocomposites on the basis of thermoplastics and montmorillonite modified by polyvinylpyrrolidone. Key Eng. Mater. 2017, 756, 3–10. [Google Scholar] [CrossRef]
- Krasinskyi, V.; Suberlyak, O.; Sikora, J.; Zemke, V. Nanocomposites based on polyamide-6 and montmorillonite intercalated with polyvinylpyrrolidone. Polym.-Plast. Technol. Mater. 2021, 60, 1641–1655. [Google Scholar] [CrossRef]
- Dulebová, Ľ.; Greškovič, F.; Sikora, J.W.; Krasinskyi, V. Analysis of the mechanical properties change of PA6/MMT nanocomposite system after ageing. Key Eng. Mater. 2017, 756, 52–59. [Google Scholar] [CrossRef]
- Bera, H.; Ueda, M.; Ito, Y. Functionalized biopolymer–clay-based composites as drug-cargos. In Woodhead Publishing Series in Biomaterials, Tailor-Made and Functionalized Biopolymer Systems; Bera, H., Layek, B., Singh, J., Eds.; Woodhead Publishing: Sawston, UK, 2021; pp. 285–311. [Google Scholar] [CrossRef]
- Biswas, S.; Fatema, J.; Debnath, T.; Rashid, T.U. Chitosan–Clay Composites for wastewater treatment: A state-of-the-art review. ACS EST Water 2021, 1, 1055–1085. [Google Scholar] [CrossRef]
- Sangeetha, K.; Angelin Vinodhini, P.; Sudha, P.N. Clay Based Biopolymer Nanocomposites and Their Applications in Environmental and Biomedical Fields. In Sustainable Polymer Composites and Nanocomposites; Inamuddin, T., Kumar, M., Asiri, A., Eds.; Springer: Cham, Switzerland, 2019; pp. 1159–1183. [Google Scholar] [CrossRef]
- del Mar Orta, M.; Martín, J.; Santos, J.L.; Aparicio, I.; Medina-Carrasco, S.; Alonso, E. Biopolymer-clay nanocomposites as novel and ecofriendly adsorbents for environmental remediation. Appl. Clay Sci. 2020, 198, 105838. [Google Scholar] [CrossRef]
- Krasinskyi, V.; Kochubei, V.; Klym, Y.; Suberlyak, O. Thermogravimetric research into composites based on the mixtures of polypropylene and modified polyamide. East.-Eur. J. Enterp. 2017, 4, 44–50. [Google Scholar] [CrossRef]
- Koczkur, K.M.; Mourdikoudis, S.; Polavarapu, L.; Skrabalak, S.E. Polyvinylpyrrolidone (PVP) in Nanoparticle Synthesis. Dalton Trans. 2015, 44, 17883–17905. [Google Scholar] [CrossRef] [PubMed]
- Kyrychenko, A.; Pasko, D.A.; Kalugin, O.N. Poly(vinyl alcohol) as a water protecting agent for silver nanoparticles: The role of polymer size and structure. Phys. Chem. Chem. Phys. 2017, 19, 8742–8756. [Google Scholar] [CrossRef]
- Song, Y.; Gerringer, J.; Qin, S.; Grunlan, J.C. High oxygen barrier thin film from aqueous polymer/Clay Slurry. Ind. Eng. Chem. Res. 2018, 57, 6904–6909. [Google Scholar] [CrossRef]
- Carrado, K.A.; Xu, L. Materials with controlled mesoporosity derived from synthetic polyvinylpyrrolidone–clay composites. Microporous Mesoporous Mater. 1999, 27, 87–94. [Google Scholar] [CrossRef]
- Teepakakorn, A.; Hayakawa, T.; Ogawa, M. Remarkable stability of dye in polymer-clay nanocomposite film. Appl. Clay Sci. 2022, 218, 106405. [Google Scholar] [CrossRef]
- Santos, A.J.; Pina, L.T.S.; Galvão, J.G.; Trindade, G.G.G.; Nunes, R.K.V.; Santos, J.S.; Santos, C.P.; Gonsalves, J.K.; Lira, A.A.; Cavalcanti, S.C.H.; et al. Clay/PVP nanocomposites enriched with syzygium aromaticum essential oil as a safe formulation against Aedes aegypti larvae. Appl. Clay Sci. 2020, 185, 105394. [Google Scholar] [CrossRef]
- Levy, R.; Francis, C.W. Interlayer adsorption of polyvinylpyrrolidone on montmorillonite. J. Colloid Interface Sci. 1975, 50, 442–450. [Google Scholar] [CrossRef]
- Séquaris, J.-M.; Hild, A.; Narres, H.D.; Schwuger, M.J. Polyvinylpyrrolidone adsorption on Na-Montmorillonite. effect of the polymer interfacial conformation on the colloidal behavior and binding of chemicals. J. Colloid Interface Sci. 2000, 230, 73–83. [Google Scholar] [CrossRef] [PubMed]
- Séquaris, J. Characterization of polyvinylpyrrolidone adsorption at inorganic soil components by a microelectrophoretic method. Colloids Surf. A Physicochem. Eng. Asp. 1999, 159, 503–512. [Google Scholar] [CrossRef]
- Szczerba, M.; Środoń, J.; Skiba, M.; Derkowski, A. One-dimensional structure of exfoliated polymer-layered silicate nanocomposites: A polyvinylpyrrolidone (PVP) case study. Appl. Clay Sci. 2010, 47, 235–241. [Google Scholar] [CrossRef]
- Sinha Ray, S.; Okamoto, M. Polymer/layered silicate nanocomposites: A review from preparation to processing. Prog. Polym. Sci. 2003, 28, 1539–1641. [Google Scholar] [CrossRef]
- Chivrac, F.; Pollet, E.; Dole, P.; Avérous, L. Starch-based nano-biocomposites: Plasticizer impact on the montmorillonite exfoliation process. Carbohydr. Polym. 2010, 79, 941–947. [Google Scholar] [CrossRef]
- Pearnchob, N.; Bodmeier, R. Coating of pellets with micronized ethylcellulose particles by a dry powder coating technique. Int. J. Pharm. 2003, 268, 1–11. [Google Scholar] [CrossRef]
- Tsai, T.-Y.; Lin, M.-J.; Chuang, Y.-C.; Chou, P.-C. Effects of modified clay on the morphology and thermal stability of PMMA/clay nanocomposites. Mater. Chem. Phys. 2013, 138, 230–237. [Google Scholar] [CrossRef]
- Zabska, M.; Jaskiewicz, K.; Kiersnowski, A.; Szustakiewicz, K.; Rathgeber, S.; Piglowski, J. Spontaneous exfoliation and self-assembly phenomena in polyvinylpyrrolidone/synthetic layered silicate nanocomposites. Radiat. Phys. Chem. 2011, 80, 1125–1128. [Google Scholar] [CrossRef]
- Villaça, J.C.; da Silva, L.C.; Barbosa, L.H.; Rodrigues, C.R.; Lira, L.M.; do Carmo, F.A.; de Sousa, V.P.; Tavares, M.I.; Cabral, E.L. Preparation and characterization of polymer/layered silicate pharmaceutical nanobiomaterials using high clay load exfoliation processes. J. Ind. Eng. Chem. 2014, 20, 4094–4101. [Google Scholar] [CrossRef]
- Dornelas, C.B.; Silva, A.M.; Dantas, C.B.; Rodrigues, C.R.; Coutinho, S.S.; Sathler, P.C.; Castro, H.C.; Dias, L.R.; Sousa, V.P.; Cabral, L.M. Preparation and evaluation of a new nano pharmaceutical excipients and drug delivery system based in polyvinylpyrrolidone and silicates. J. Pharm. Pharm. Sci. 2011, 14, 17. [Google Scholar] [CrossRef] [PubMed][Green Version]
- Krasinskyi, V.; Malinowski, R.; Bajer, K.; Rytlewski, P.; Miklaszewski, A. Study of Montmorillonite Modification Technology using polyvinylpyrrolidone. Arab. J. Chem. 2023, 16, 105296. [Google Scholar] [CrossRef]
- Ahmad, M.B.; Gharayebi, Y.; Salit, M.S.; Hussein, M.Z.; Shameli, K. Comparison of in situ polymerization and solution-dispersion techniques in the preparation of polyimide/montmorillonite (MMT) nanocomposites. Int. J. Mol. Sci. 2011, 12, 6040–6050. [Google Scholar] [CrossRef]
- Amin, A.; Kandil, H.; Ramadan, A.; Ismail, M.N. Tethering of homo and block glycopolymer chains onto montmorillonite surface by atom transfer radical polymerization. Open J. Org. Polym. Mater. 2012, 2, 80–88. [Google Scholar] [CrossRef]
Disclaimer/Publisher’s Note: The statements, opinions and data contained in all publications are solely those of the individual author(s) and contributor(s) and not of MDPI and/or the editor(s). MDPI and/or the editor(s) disclaim responsibility for any injury to people or property resulting from any ideas, methods, instructions or products referred to in the content. |
© 2024 by the authors. Licensee MDPI, Basel, Switzerland. This article is an open access article distributed under the terms and conditions of the Creative Commons Attribution (CC BY) license (https://creativecommons.org/licenses/by/4.0/).