Abstract
The paper presents a technique of motion planning for autonomous vehicles (AV) based on simultaneous trajectory and speed optimization. The method includes representing the trajectory by a finite element (FE), determining trajectory parameters in Frenet coordinates, composing a model of vehicle kinematics, defining optimization criteria and a cost function, forming a set of constraints, and adapting the Gaussian N-point scheme for quadrature numerical integration. The study also defines a set of minimum optimization parameters sufficient for making motion predictions with smooth functions of the trajectory and speed. For this, piecewise functions with three degrees of freedom (DOF) in FE’s nodes are implemented. Therefore, the high differentiability of the trajectory and speed functions is ensured to obtain motion criteria such as linear and angular speeds, acceleration, and jerks used in the cost function and constraints. To form the AV roadway position, the Frenet coordinate system and two variable parameters are used: the reference path length and the lateral displacement perpendicular to reference line’s tangent. The trajectory shape, then, depends only on the final position of the AV’s mass center and the final reference’s curvature. The method uses geometric, kinematic, dynamic, and physical constraints, some of which are related to hard restrictions and some to soft restrictions. The planning technique involves parallel forecasting for several variants of the AV maneuver followed by selecting the one corresponding to a specified criterion. The sequential quadratic programming (SQP) technique is used to find the optimal solution. Graphs of trajectories, speeds, accelerations, jerks, and other parameters are presented based on the simulation results. Finally, the efficiency, rapidity, and prognosis quality are evaluated.
1. Introduction
Modern developments in the domain of autonomous vehicle (AV) motion planning are distinguished by a wide range of proposed techniques and methods having advantages and drawbacks depending on the forecasting goals under current conditions. The main planning challenge concerns the need for simultaneously satisfying multiple requirements that guarantee both the motion feasibility and its safety, including the controllability and stability within the subsequent tracking process.
The basic planning task consists of generating a forecast of trajectory and speed mode. On the one hand, it must conform to the principles of simplicity, smoothness, and unambiguity. For these purposes, analytical functions of polynomial and trigonometric types are often used [1], which change shape depending on parameters. The advantage of this approach implies that, with known parameters, any trajectory’s point may be directly computed. However, there are also problems associated with the fact that trajectories represented by polynomials of small degrees do not provide high differentiability. For large degrees, the polynomials may be unstable, and the sensitivity of DOFs corresponding to higher derivatives increases. This complicates the optimization procedure since the determined parameters, in this case, may differ by an order of magnitude.
On the other hand, the trajectory curve must meet the requirements of continuity and differentiability. Since the forecast optimality criteria themselves depend on the trajectory curvature’s derivatives, it is also necessary to ensure the equality of these derivatives at the point of changing planning cycles. In this case, most often it is impossible to ensure the continuity of higher speed derivatives, as well as kinematic parameters based on them such as yaw rate, angular acceleration, and jerks. In most of the existing techniques, these aspects are neglected, which affects the irregular and intermittent nature [2] of the listed parameters at transient points. However, these parameters are associated with vehicle control systems and actuators. Therefore, it is desirable to ensure the continuity of their functions and derivatives for transient processes.
To guide the AV on a roadway, two approaches may be used. The first one involves the formation of roadway boundaries and motion zones in the Cartesian coordinate system [3]. In this case, a space available for predicting the AV movement may be obtained by limiting motion zones for other traffic participants in such a way that a minimum safe distance is guaranteed. However, most often in this case, there is a need for separating the planning stage into sequential phases of determining the trajectory and distributing the speed mode. Another approach allows for the consideration of the formation of AV motion in Frenet coordinates [4,5]. In this case, usually, the midline of a road lane is in some way expressed as a reference path function. Thus, instead of Cartesian coordinates, two Frenet coordinates arise, such as the lane reference curve’s length and the lateral displacement perpendicular to the reference curve’s tangent. In this case, it is much easier to work with spatial constraints by imposing them on the lateral displacement within the boundaries of a road lane. However, we still need to make the transition to the AV’s local Cartesian system to decompose the components of kinematic parameters into longitudinal and transversal ones. Due to curvature, the full representation of the motion model in curvilinear coordinates becomes more complicated. Therefore, in this work, we will use a mixed approach in which there is a reference path curve in the Frenet coordinates, and the trajectory is predicted in the Cartesian coordinates.
Forecasting the speed mode [6] involves obtaining several kinematic parameters (linear and angular speeds, linear and angular accelerations, linear jerks) characterizing the AV dynamics and providing direct ties with vehicle sensors’ data (accelerometers, gyroscopes, radars), which allows for the monitoring and correcting of the AV control at the tracking stage. These same parameters may be used as criteria for optimizing the AV motion. The main task of speed planning aims at compromising the vehicle’s maximum performance, safety, and motion smoothness.
To implement the above, two different approaches may be used. The first one is represented by discrete modeling [7], where a system of equations based on vehicle dynamics (or kinematics) allows simultaneous optimization [8] of the trajectory and speed related differentially to each other. However, to ensure good convergence of the numerical solution, it is necessary to reduce the integration step, which increases iteration time. Another approach proceeds from representing the trajectory and speed by piecewise analytical functions [9], forms of which are known in advance and only the parameters that determine the nature of these functions are optimized. In this case, there are no problems with step control, but the motion can only be represented by a vehicle kinematic model.
Constraints are a separate issue. There are quite a number of restrictions stipulated by both the parameter nature and the possibility of its assessment. Thus, geometric restrictions [10] imply a non-violation of the roadway boundaries (permissible zone) and keep safe positions relative to other traffic participants. Kinematic constraints concern parameters based on speed [11] and its derivatives. Dynamic restrictions are determined by limits imposed on the vehicle’s powertrain system to realize its traction potential. The vehicle acceleration naturally decreases with speed, which must be reflected in the driving mode being planned. Physical limitations are based on the tire’s maximum adhesion property and the potential for motion stability. All these restrictions may be represented as hard and/or soft constraints. In the first case, satisfying limiting conditions is mandatory and formed by additional linear or nonlinear equalities and inequalities. In the second case, the restrictions themselves are included in the objective function [12], which determines the influence of the criteria but allows for violations of the limits for exceptional reasons. For example, this approach is appropriate in cases when a safe distance between vehicles in the same lane is not ensured.
Obstacles: In real conditions, the AV must maneuver among moving and stationary obstacles [13]. One of the main tasks on AV’s motion-planning strategy is to prevent collisions and maintain safe distances [14]. The issue is complicated by the fact that it is difficult to accurately estimate the motion directions and speeds of other participants for a relatively long time. In this regard, it may be assumed that during AV’s maneuvering, other vehicles barely change the nature of their movement. Thus, the task is to maximize the distances between vehicles while maneuvering, considering vehicles’ safety contours.
This study continues a series of our research on developing algorithms for AV motion planning. Initially, in paper [15], we outlined the main approaches to modeling trajectory and speed modes based on the vehicle kinematics model. At the same time, the sequential approach to optimizing the trajectory and speed was used. In the next research [16], we stipulated an advantage of using integral forms of the equality constraints instead of point ones. In articles [17], we tested various numerical integration schemes in optimization problems of motion planning.
Based on the above, we shall consider a motion-planning technique that involves the simultaneous prediction of trajectory and speed mode within a single finite element (FE) of the variable reference length. At the same time, depending on the number of lanes and presence of obstacles, trajectory variants are to be analyzed and estimated followed by possible selection of an optimal strategy in specific initial conditions. The general strategy of the technique is shown in Figure 1.
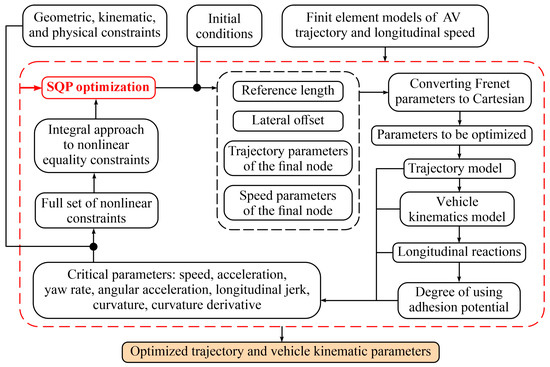
Figure 1.
Scheme of the study’s structure.
2. Motion-Planning Concept
Let us assume that AV forms a motion trajectory relative to the midline of a lane on which it is currently located [18,19] (Figure 2). Such a line may be obtained, for example, by the cubic spline interpolation providing sufficient smoothness and representing the curvature of a road section. If functional dependencies x = x(sr), y = y(sr) are built for a section, then, varying the parameter sr relative to the initial path length sr0, it is possible to determine the values xsr, ysr corresponding to the zero point of the lateral displacement L along the road width. Thus, the coordinates xf, yf of the AV mass center’s final position can be calculated as
where αf = the midline curve’s tangent slope at the point xsr, and Lf = AV mass center’s lateral displacement at the final point.
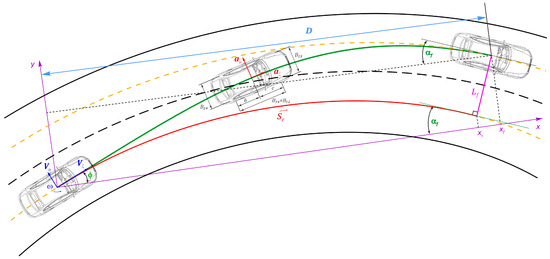
Figure 2.
Scheme of forming AV trajectory based on Frenet coordinates.
Since the transverse coordinate L is always perpendicular to the curve sr, the AV’s final angular position on any lane has ideally the same value αf. However, the angle α actual value may for various reasons deviate from the ideal value, which is associated with the desired angle αd. In the transverse direction, AV may be located in any lane by introducing such a parameter as the desired lateral displacement (position) Ld. Thus, the trajectory can be represented as a piecewise polynomial function with the basis D = xf − x0.
Trajectory. Let us apply the Hermitian interpretation of Lagrange polynomials [20] using basis functions and nodal degrees of freedom (DOFs). To model the trajectory as a function y(x), the fifth-degree polynomial (p = 5) may be considered, which requires three DOFs in a node. Then, y(x) may be expressed in the vector form
where cj = polynomial coefficient, j ∈ [0, p].
If define k = ((p + 1)/2 − 1) first derivatives of the vector X (where p is odd) and substitute the x-coordinates of the initial (0) and final (D) nodes, the matrix B is composed as
where Qtr = set of trajectory nodal parameters.
As a result, expressions of Equations (2) and (3) are linked in the form
Considering one final element (FE) of the length D, the function y(x) may be represented by the sets of shape functions and DOF values. Then
where fj = shape function and qj = weight coefficient or DOF, j ∈ [1, p+1].
If we assume x = ξD, where parameter ξ ∈ [0, 1], then the shape functions may be derived through basis functions for an element of unit length. Thus, the basis functions Fξ of the argument ξ ∈ [0, 1] are universal for the variable length D of a roadway segment. Defining the vector D and matrix Dd
where k = ((p + 1)/2 – 1).
Thus, the functions F of Equation (3) may be replaced by the basis functions of the parameter ξ
Then, for the k-th derivative,
Speed Model can be organized in the same way as the trajectory. We assume that the AV longitudinal speed Vζ is distributed along the trajectory projection on the x-coordinate. According to Equations (3)–(8), the longitudinal component and its k-th derivative may be expressed as follows
where Qsp = set of speed nodal parameters.
Full set of parameters. Since we consider one segment with initial (0) and final (f) points, each of them containing three DOFs, we need six variable parameters for each Qtr and Qsp to simultaneously search the trajectory y(x) and speed distribution Vζ(x). Then, introducing nodal vectors
The vectors Qtr and Qsp completely determine the configuration of the trajectory and speed distributions within the segment D. Nevertheless, not all of their members are variable parameters. Note that at the initial node the vectors qtr0, qsp0 are usually known from the previous solution. In turn, strict constraints may be imposed on the values of vectors qtr0, qsp0, which reduces the number of parameters to be optimized.
Note that the nodal parameter yf is not independent in its pure form but is calculated from Equation (1), where the parameters sr and L are involved. Their variation determines a combination of yf and D. Thus, it is possible to form a set of variable parameters that best reflect both the trajectory shape and the speed distribution.
In the case of the strict finite transverse displacement Lf and the corresponding angle αf, these parameters depend only on the variable sr, and the set of Equation (11) is shortened
Numerical Integration Technique. To simultaneously satisfy the rapidity and quality of calculations, we shall use the numerical integration based on the N-point Gaussian quadrature scheme. Assume that some integrand z(x) is considered within a segment [xi−1, xi], then, expressing x = ξD
where wk = integration weight in the k-th point, ϑk—k-th point in the master–element coordinate system, J = Jacobian, k ∈ [1, N], and N = number of integration points.
For one-dimensional FE
Denoting the vectors,
The short expression for calculating the integral becomes
where D = section length and z = vector of integrands of 1 × N size.
In most cases, we will need not only final integral values but also intermediate ones corresponding to the points xi (or ξi). That is, the integration must also be conducted on the sections [xi−1, xi].
If we combine all increments Δξi in a row vector Δξ, then the sum of Equation (13) can be obtained as follows
Planning Strategy in the Presence of Obstacles. Let us consider the AV motion in the presence of other vehicles (Figure 3). We assume, for instance, that AV is moving along the middle (2) lane and may perform three maneuver variants [21]: lane changes to the first (1) and third (3) lanes and following the second lane. In terms of geometric sense, such a rearrangement may be considered the best, which ensures keeping the greatest distance from an obstacle. At the moment of starting the motion planning (1)–(4), AV fixes the midline points of the current lane in such a way to form smooth conjugations (splines) reflecting the road curvature. Then, considering the number of lanes, the longitudinal sr and transverse L coordinates, it is possible to build a curvilinear grid of the road segment space relative to which the motion is planned.
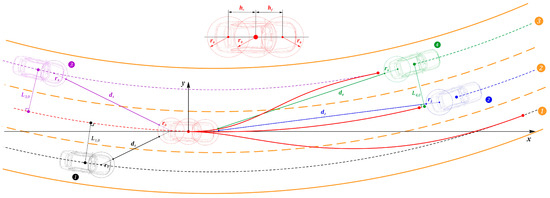
Figure 3.
Trajectory variants and distances to moving obstacles.
By using radars, AV can obtain distances to objects and angles of measuring beams. Then, the coordinates of vehicles’ initial positions may be calculated relative to the AV’s xy coordinate system. To do this, we use the vehicle safety zones (contours) represented by conditional circles. Thus, for a passenger vehicle, three round areas of radius r relative to the front, middle, and rear vehicle parts are enough to form the safety contour. The positions of the front and back parts’ centers are calculated as follows
where xc, yc = coordinates of the vehicle’s mass center, hf, hr = distances to the conditional centers of the vehicle’s front and rear parts, respectively, ϕ = yaw angle.
Thus, considering the radar measurements, the positions of other vehicles’ centers can be estimated, and based on them and the predetermined road segment curvilinear grid, the lateral displacements Li,0 can be found. This helps to determine the corresponding traffic lane for each moving obstacle. If the lane’s midline as the vehicle’s current trajectory is considered, then, similarly to AV, we can compose interpolation dependencies xi = xi(si), yi = yi(si), i ∈ [1, Nv], where Nv is the number of fixed vehicles.
Therefore, we may estimate the vehicle motion parameters in discrete points over time intervals Δt and the total AV’s motion time tf. If vehicles’ speeds Vi are accepted to be constants, then, the paths for the intervals Δt are Δsi = ViΔt and for the total time si = Vitf. Knowing the paths, it is possible to determine coordinates xi, yi by the predefined interpolation. Then, considering the radius of safety zones ri, the distance between the AV (0) and an i-th obstacle vehicle can be evaluated as
Note that, strictly speaking, to determine the vehicle mass center’s position, it is necessary to identify a vehicle and estimate its overall dimensions and wheelbase, which somewhat complicates the calculations. In this regard, we assume that moving obstacles behind AV may be conditionally defined by circles centered at the vehicles’ fronts, and obstacles ahead of AV may be represented by circles centered at the vehicles’ rears. The corresponding centers can be easily found by estimating the overall width of a moving obstacle. Then, the parameters Li,0 can be replaced by Li,f and Li,r, respectively. Thus, the trajectories of moving obstacles can be considered as the trajectories of the safety contour circles’ centers.
Time. The time interval Δti between AV’s positions i − 1 and i can be calculated by the integration, considering the trajectory s and speed V
Each segment [xi−1, xi], in turn, may also be represented by a finite element corresponding to a range [ξi−1, ξi] and again considered in the segment ϑ ∈ [0, 1]. Then
Passing to numerical integration according to Equation (17), we obtain
Thus, it is possible to form a vector of time increments
where n = number of intervals.
The vector of time points can be obtained by the accumulative addition:
Provided that the segment ξ ∈ [0, 1] is represented by the vector of increments Δξ, the final time can also be obtained as follows
Spatial Constraints. The requirement of non-violating the roadway boundaries is the main limiting factor. It can be used as a hard or soft constraint. In the first case, it is assumed that there must be no safety contour exceeding the roadway boundaries. In the second case, it is possible to allow the crossing of the solid marking line subject to a critical approach to an obstacle. In this case, we shall use strict conditions. If the maximum lateral coordinate relative to an AV’s initial position as LU (upper limit) is denoted for moving leftward and as LL (lower limit) for the right bias, then the conditions for each point p ∈ [0, f, r] of the central, front, and rear vehicle’s parts have the form
In the case of riding on the same lane, the safety conditions can be enhanced by the values LU and LL equal to half the lane width with the corresponding sign. As a result, by setting the upper (left) and lower (right) boundaries, it is possible to limit the lateral displacement for each trajectory variant. Note that the values of L0,p can be obtained directly by interpolating the known coordinates from Equation (13).
3. Motion-Modeling Technique
3.1. Basics of Trajectory Geometry
Let us briefly describe the main components of the vehicle trajectory geometry with the ideal controllability based on the kinematic model.
The elementary arc length of the trajectory represented by function y(x) is
Then, the arc’s first derivative along the x-coordinate is
The second derivative concerning the x-coordinate is
The third derivative concerning the x-coordinate is
The derivative at any trajectory point is tied to the slope angle’s tangent
The expressions of Equation (29), considering Equation (32), may be rewritten as follows:
The first derivative of the slope angle concerning the x-coordinate is
The change of the tangent slope angle along the arc s length is the curvature K
The second derivative concerning x is
The curvature’s change along the arc s is
In turn, the curvature’s change of along the x-coordinate is
The second derivative concerning the x-coordinate is
The instantaneous radius is defined as the reciprocal of the curvature
The central slip angle β characterizes the ratio between the lateral and longitudinal components of the mass center speed and is evaluated as follows
The first derivative of β along the x-coordinate is
where the coefficient
Its derivative is given by
Then, the second derivative of β concerning x is
The vehicle’s yaw angle ϕ is obtained through the tangent slope angle and the central slip angle as follows
3.2. Basics of Vehicle Kinematics Model
The vehicle’s mass center trajectory is geometrically related to the longitudinal Vζ and transverse Vμ speeds (Figure 2) based on the assumption that there is no tire’s sideslip. The mass center’s absolute speed may be decomposed as follows
where , = natural coordinate system’s unit vectors, , = unit vectors of the vehicle local coordinate system ζμ, and , , Vx, Vy = unit vectors and speed components of the fixed (global) coordinate system xy.
The longitudinal speed Vζ and its k-th derivatives, according to Equation (9), is expressed in the forms
To obtain the kinematic parameters related to the AV dynamics, the following derivatives concerning the time t are needed
The projection Vx and longitudinal speed Vζ are tied through the tangent angle α and central slip angle β. Then,
The first derivative concerning the coordinate x is
The lateral speed Vμ is defined by the longitudinal component Vζ and the central slip angle β
The derivatives concerning time and x-coordinate obtain
The yaw rate is the derivation of yaw angle ϕ = α – β. Thus, its view and derivative component concerning the x-coordinate are
The angular acceleration ε is the derivative of the yaw rate ω concerning the time t
The longitudinal and lateral accelerations in the vehicle’s local coordinates ζμ
The longitudinal and lateral jerks in the vehicle’s local coordinates ζμ
4. Optimization and Constraints
4.1. Optimization Criteria
Note that the criteria for finding an optimal solution can be conditionally divided into dynamic and static. The first ones are generally time (speed) functions. Their common impact is aimed at ensuring trajectory smoothness and maneuver rapidity. The static criteria, in turn, are tied to parameters of the vehicle’s final position, being responsible for the AV’s disposition on the lane and the course direction. Let us consider the criteria in more detail.
The longitudinal speed deviation relative to a preset upper-level VζU may be the main “moving” factor of the AV model. The integral of the squared velocity deviation has the form
The integrand zV(ξ) is expressed through the speed nodal parameters Qsp
Then,
The longitudinal and lateral jerk criteria [22] include all the kinematic parameters containing curvature and its derivatives. Thus, these criteria reflect the transient dynamics in two directions. The longitudinal direction is to a greater extent associated with the vehicle traction process, and the lateral direction is generally related to the steering control. The common approach is as follows
The integrand zjp(ξ) is determined according to Equations (14)–(16) and depends on both trajectory Qtr and speed Qsp parameters, then, obtain
Then,
Motion time T reflects final time costs and may be calculated as follows
According to Equations (10) and (12), the integrand zT(ξ) and T value
The final lateral position Lf should best match the desired lateral displacement Ld to satisfy the safe completion of maneuver and to control distances to the lane boundaries. Then,
The final tangent angle αf characterizes the vehicle control stability at the end of the maneuver, directly affecting the safety of subsequent motion. The desired value αd must be defined by the road curve’s tangent at the vehicle’s final position. Then
The position Ld and angle αf depend on the lane to which a maneuver is planned.
Distances to moving obstacles. Let us assume that the distance between AV and a moving obstacle changes continuously. Then, the integral of the distance square between AV and i-th vehicle has the form
Using the schemes described above, it can be written
Since each new motion variant is planned separately, only those n vehicles detected by the AV sensory system on the destination lane are considered. Thus, the influence of criterion is inversely proportional to the sum of integrals
Cost Function Cf is formed as the sum of the weighted criteria indicated above. The condition of minimizing the objective function has the view
where q = vector of the search-for parameters; I = vector of the integral criteria; W = vector of weight factors. Thus,
where WV, Wjζ, Wjμ, Wt, WL, Wα, Wd, Ws = weight coefficients for quadratic deviations of the speed, longitudinal and lateral jerks, final time, final lateral offset, final angular position, distances to obstacles, and final distance between vehicles at the end of maneuver, respectively.
4.2. Constraints
General approach. Kinematic, dynamic, and physical parameters of vehicle motion may be restricted. Usually, parameters’ values are constrained in the control points. Nevertheless, this does not guarantee the non-violation of limits between these points by a considered function. If it is supposed that all the parameters are represented by smooth functions, the integral approach to constraints may be implemented based on the same Gaussian scheme applied for the cost function calculation. Let us consider the general technique for some parameter ψ, which must not exceed the upper ψU and lower ψL bounds. Then, the sum of the areas between the upper limit and the ψ-function and between the lower limit and the ψ-function must be strictly equal to the area within limits. That is, if the ψ-function is determined relative to the time
Each integral can be considered concerning the spatial coordinate by replacing the time differential. Integral between upper and lower bounds (ul):
Similar to Equations (16)–(18),
Integral between the upper bound and ψ-function (uf):
Thus,
Integral between the ψ-function and lower bound (fl):
Thus,
The requirement of nonlinear equality constraint within the segment D is expressed as follows
Kinematic constraints. Using the scheme above, we may compose a vector ck of nonlinear integral constraints for a set of kinematic parameters ψk, considering vectors of upper ψkU and lower ψkL limits.
Physical constraints. Subject to a relatively equal distribution of longitudinal and transverse forces between the AV wheels, the critical speed Vζs criterion may be used stipulated by limiting the stable motion depending on the trajectory’s curvature [21] and tire-road adhesion. It can be derived as follows
where g = gravity acceleration constant, φμ = lateral adhesion coefficient.
If maximum tire-road adhesion is φmax and the adhesion in the longitudinal direction requires a potential φζ, the remaining lateral adhesion potential is
The longitudinal φζ may be found through the equation of longitudinal dynamics in the dimensionless form
where fr = coefficient of total rolling resistance, and fd = specific drag force.
The longitudinal speed Vζ must not exceed a threshold according to the condition Vζ < Vζs. Vζs may change in a range [Vζsmin, ∞). Thus, a rapidly saturating function may be applied, for instance, χ(·) = tanh(·). Then, the condition similar to Equation (73) is
Using Equations (74)–(80), it is possible to impose physical restrictions on the AV speed. Then
A special case concerns the vehicle’s traction potential. The vehicle’s maximum acceleration strictly depends on design features and decreases with growing speed. Thus, if the vehicle’s speed–acceleration characteristic is predefined, the following condition must be satisfied
where aζU, aζL = upper and lower limit values of acceleration achievable by the vehicle.
The general scheme for obtaining integrals is the same as Equations (74)–(80). Then, the dynamic constraint has the form
Boundary constraints. Another type of constraint determines boundary conditions of kinematic parameters. Since the initial (0) values defined in Equation (10) are known or may be evaluated directly, one can require (but not necessarily), for example, that the predicted final (f) values of acceleration and jerk would correspond to desirable values Aζf and Jζf. That is,
Complete Set of Constraints. Combining all the parameters defined in the kinematic, physical, dynamic, and boundary constraints, the vectors of parameters, limits, and nonlinear constraints are as follows
Initial conditions. If the sought-for parameters from the previous cycle are known, they are automatically accepted as the initial ones for the next planning. To determine the initial parameters qtr0 and qsp0, the expressions of Equations (32)–(40) and (49)–(57) are to be used.
In Equation (10), the initial parameters for the first cycle are not set. To form geometric nodal parameters, first, the nearest point [xr0, yr0] corresponding to the zero-path length sr0 is determined on the reference curve. This allows for the estimation of the initial distance L0 to the reference provided that the center of the Cartesian coordinate system is tied to the vehicle’s mass center. Then, x0 = 0, y0 = 0. Assuming that at the initial time moment, AV follows parallel to the reference,
We determine the next initial parameter from the curvatures of the trajectory and reference. By analogy with Equations (34) and (35)
where r, t = reference and trajectory, correspondingly.
Then,
Therefore, due to Equations (29) and (91), for the points [xr0, yr0] и [x0, y0]
To work with speed derivatives, we need the trajectory’s third derivative, which can be obtained from Equation (93)
Or after considering Equation (91)
If the reference is mathematically predefined, the first three derivatives are easy to obtain.
To define the initial speed parameters, the values Vζ0, aζ0, jζ0, and the expressions Equations (47)–(57) are used.
5. Simulation
We use the data of the Audi A4 3.2 FSI [23] to represent the AV. All the calculations are accomplished by using MATLAB tools [24]. The basic function to realize the optimization procedure is fmincon. The five-point Gauss quadrature scheme is accepted for the numerical integration, and the relative path step is Δξ = 0.1.
Let us define constraints and initial values. Speed
Acceleration
where aζlim = function of the vehicle throttle response characteristic.
Jerk
Yaw rate
Angular acceleration
First, let us set the values of the weight coefficients W in Equation (72).
Considering the order of variable parameters, the coefficient values were selected based on the condition of the influence proportionality but with an emphasis on safety and maneuver precision.
Let us define constraints and initial values. Speed
Acceleration
where aζlim = function of the vehicle throttle response characteristic.
Jerk
Yaw rate
Angular acceleration
Experiment 1. Let us consider variants for the AV motion planning along a curved road section with three lanes (Figure 4) under the condition of perfect adhesion with φmax = 0.85. Note that many variants are possible regarding the lateral vehicle displacement L. However, for the sake of compactness, we built three prediction variants related to the lane change along the lanes’ midlines. The AV is surrounded by four moving obstacles denoted as vi, i ∈ [1, 2, …, 4]. Further, Index 0 denotes the initial position, and f—is the final position. The initial vehicles’ speeds were, respectively, Vi0 = (45, 50, 50, 60) km/h.

Figure 4.
Prediction of lane-change trajectories under the condition φmax = 0.85.
As can be seen, moving to Lane 1 requires the greatest change in curvature and, accordingly, a larger basis than for passing to Lane 3. At the same time, the smallest change in curvature on Lane 2 and the distant position of the impeding vehicle allows for the maximum acceleration and length of the prediction basis. Note that while driving along Lane 2, the trajectory forecast does not tend to coincide with the centerline but is formed in such a way as to ensure the least curvature.
Figure 5 depicts the results of forecasts for speeds and accelerations along with restrictions. The speed limits under the sideslip condition are shifted to the maneuver’s beginning movement to Lane 1 and are shifted to the final phase for passing to Lane 3. The restrictions for following Lane 2 are significantly higher than the speed limit Vζmax and are not reflected in the figure’s boundaries. However, the speed in Lane 2 does not increase as the acceleration reaches the limit of the powertrain’s potential, and the final state of AV requires zero longitudinal acceleration. Note that the curvatures in the maneuvers’ final phases are approximately the same, which is reflected in the final values of lateral accelerations that are close in modules (Figure 5c). As seen in Figure 5d, not a single total acceleration curve exceeds the limit amax by the adhesion properties.
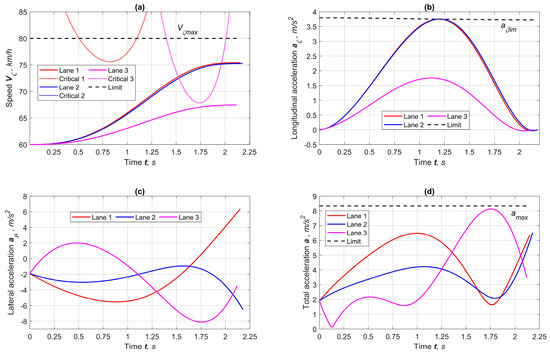
Figure 5.
Results of speed and dynamic indicators of forecasts for the lane maneuvers at φmax = 0.85: (a) longitudinal speeds and critical restrictions on adhesion conditions, (b) longitudinal accelerations, (c) lateral accelerations, (d) total accelerations.
Figure 6 presents the kinematic and geometric parameters used to impose restrictions. As seen in Figure 6a, all the longitudinal jerk curves are well below the upper limit and do not exceed the lower limit. An important indicator is the smoothness and unambiguity of the yaw rate and acceleration curves (Figure 6b,c). This characterizes the strict stability of the yaw angle and the absence of uncontrolled dynamic phenomena. Figure 6d shows that AV increases the distance from vehicles located behind and reduces gaps with the vehicles ahead while keeping safe spaces.
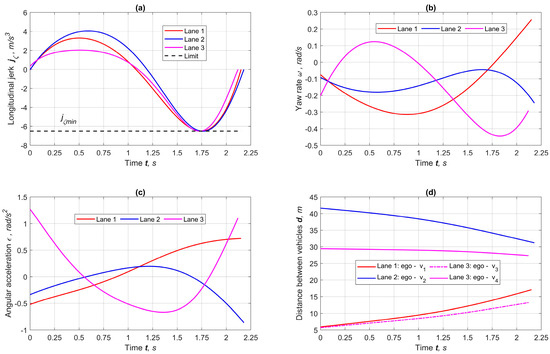
Figure 6.
Results of forecasting kinematic parameters of maneuvers at φmax = 0.85. (a) Longitudinal jerk, (b) yaw rate, (c) angular acceleration, (d) distance to obstacles.
Figure 7 reflects the geometric parameters characterizing the maneuvers’ trajectories. As seen in Figure 7a, all curvature curves are extremely smooth and concordant with the polynomial used for the trajectory model. The steering angle (Figure 7d) scales the curvature due to the ideal kinematic model. The curvature derivatives (Figure 7b,c) are also smooth without intense oscillations and sharp spikes, characterizing a consistent speed distribution along the trajectory’s curvature.
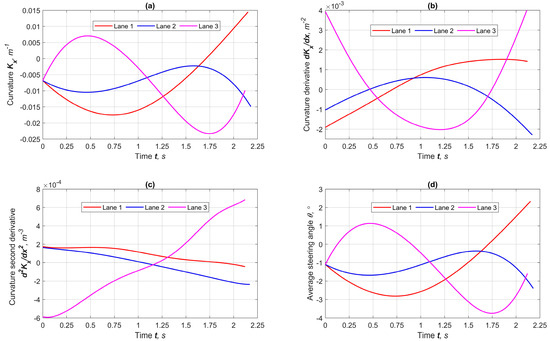
Figure 7.
Results of geometric indicators for forecasting lane maneuvers at φmax = 0.85: (a) curvature, (b) curvature’s first derivative, (c) curvature’s second derivative, (d) steering angle.
Experiment 2. Now, we consider the motion-planning variants (Figure 8) under the same conditions as for Experiment 1 but with worse adhesion φmax = 0.5. In this case, more time and distance are needed to complete the maneuver since the traction potential is limited by an external factor. Therefore, the length of the required path s is closer to the upper limit of the reference sr length.

Figure 8.
Prediction of lane-change trajectories under the condition φmax = 0.5.
As seen, the nature of the maneuvers differs in phase. Thus, on Lane 2, there is no significant change in curvature, and AV may be quickly accelerated. For the maneuver to Lane 1, the intensity is shifted to the initial phase, and for the maneuver to Lane 2, it is shifted to the final phase.
Figure 9 depicts the results of forecasting speeds and accelerations under the condition of reduced tire-road adhesion. Accordingly, the critical speed values, caused by the locally increased curvature, also decrease and limit the increase in AV speed for maneuvers to Lanes 1 and 3 (Figure 9a). At the same time, the curvature of the trajectory for driving on Lane 2 changes little, which allows the speed to rise since the critical one, in this case, is greater than the preset maximum. The same is noted for longitudinal accelerations with a difference that the vehicle, naturally, cannot realize its full traction potential. As seen in Figure 9d, the maximum acceleration of the maneuver to Lane 1 is formed at the beginning of the lane change, and for Maneuver 3 at the end. With that, accelerations do not exceed the limit achievable under the conditions of full adhesion.
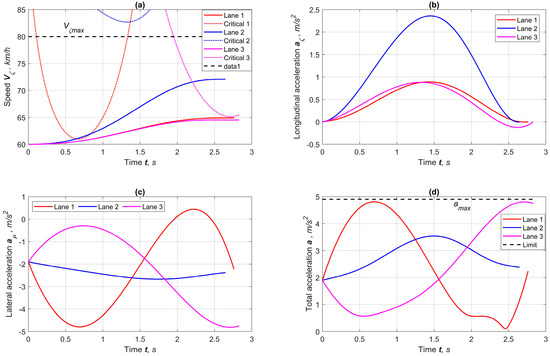
Figure 9.
Results of speed and dynamic indicators of forecasts for the lane maneuvers at φmax = 0.5: (a) longitudinal speeds and critical restrictions on adhesion conditions, (b) longitudinal accelerations, (c) lateral accelerations, (d) total accelerations.
Figure 10 presents the kinematic parameters used as constraint criteria. As seen, all curves meet the requirements of smoothness and uniqueness, and their extremum values are significantly less than the preset limit ones. The yaw rate and angular acceleration for maneuvering along Lane 2 are noticeably lower than others due to the stability of the trajectory curvature. This also allows using a wider range of the jerk than for passing to Lanes 1 and 3.
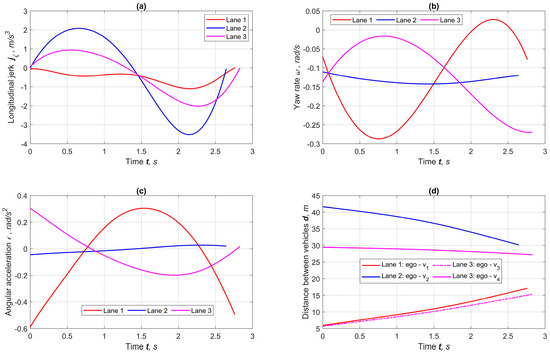
Figure 10.
Results of forecasting kinematic parameters of maneuvers at φmax = 0.5. (a) Longitudinal jerk, (b) yaw rate, (c) angular acceleration, (d) distance to obstacles.
Figure 11 shows the trajectory geometric parameters relative to the time. The greatest work on vehicle control occurs during the maneuver to Lane 1. However, the adhesion is reduced, the curves are stable, situated within the established limits, and the vehicle control is completely consistent with the kinematic characteristics in Figure 10.
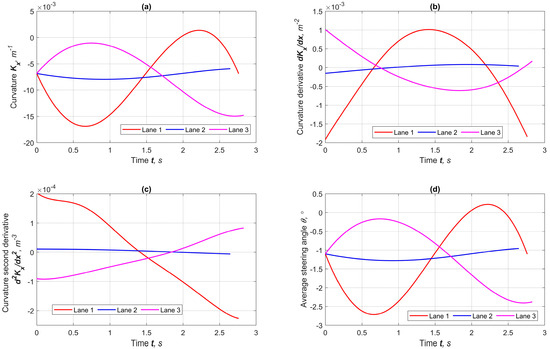
Figure 11.
Results of geometric indicators for forecasting lane maneuvers at φmax = 0.5: (a) curvature, (b) curvature’s first derivative, (c) curvature’s second derivative, (d) steering angle.
6. Conclusions
The study has developed a technique for planning the AV motion ensuring simultaneous optimization of the trajectory and speed mode. The proposed technique is fully workable and provides results that are adequate to the initial conditions and preset restrictions. Note that the obtained results are characterized for the AV with a drive type in which traction is redistributed by all wheels, since the critical speed criterion is related to the entire vehicle and not to a single drive axle. Also, in the calculations, it was assumed that the minimum length of the maneuver trajectory should be greater than the AV’s stopping distance from the initial speed.
Regarding the results of testing the technique, the following conclusions can be drawn.
- A clear advantage is the use of a 5th-degree polynomial as a trajectory basis possessing sufficient flexibility and good stability (i.e., predetermined trajectory shape), which reduces the time required to optimize the trajectory model. All curves formed with the participation of the trajectory model are characterized by smoothness, unambiguity, and simplicity of form, providing a positive effect for the control stability at the tracking stage.
- The proposed technique is based on the minimum number of variable parameters (5–7) necessary for high-quality prediction of the maneuver and its speed mode. Note that despite the multiple optimization criteria, it is recommended to shift priorities to control the maneuver’s accuracy (lateral displacement L) and safety (distance between objects during lane changes and the final distance between vehicles within the same lane).
- The variation of the lateral displacement L within the lane boundaries allows for the obtainment of several trajectory variants. However, in this study, we relied on minor deviations from the lane’s centerline. In this regard, for simulation examples, only three forecasting options were used. The priorities for decision-making on choosing the best trajectory [25] can be the minimum travel time, maximum speed at the end of the maneuver, the longest trajectory, minimum control costs, or a combination of these. In this study, we do not focus on the problem of selecting a criterion since the goal was to verify the technique itself in general.
- For simulations, a device equipped with an Intel(R) Core(TM) i7-7500U CPU @ 2.7 GHz, two cores, and 8 GB RAM on the 64-bit Windows 10 was used. The software environment was MATLAB R2022b with the basic optimization function fmincon. The average time to calculate one forecast is about 0.35–1.4 s depending on the settings, declared accuracy, and initial conditions. The performance can be significantly enhanced by optimizing the MATLAB code, using parallel computing, compiling to the C/C++ language, and applying more efficient multi-core processors.
- The accuracy of the constraints plays a key role in the solution convergence and needed number of iterations. Due to the integral approach to equality constraints, the sensitivity to the residual order increases. Thus, for the guaranteed convergence of equality constraints on the criteria of critical speed, acceleration, and jerks, the recommended accuracy should correspond to the order of 10−12.
- The choice of a number of integration points for the Gaussian quadrature scheme and some sections into which the finite element interval is divided significantly affects the forecast performance. Multiple virtual simulations have revealed that the optimal interval step is Δξ = 0.2... 0.25, and the number of integration points is N = 3... 5.
- The following may be noted as disadvantages. When forecasts are subsequent, the conjunction smoothness at transition nodes is ensured only for parameters that require no more than the second derivative of the trajectory and speed. At the same time, for some parameters, such as curvature derivative, angular acceleration, and jerk, discontinuities of functions at nodes may appear. To eliminate these shortcomings, it is necessary to shift the modeling emphasis from trajectory and velocity to the level of the curvature’s and speed’s derivatives. This approach will be studied further.
Author Contributions
Conceptualization, M.D. and S.M.E.; methodology, M.D.; software, M.D.; validation, M.D. and S.M.E.; formal analysis, S.M.E.; investigation, M.D.; resources, S.M.E.; data curation, M.D.; writing-original draft preparation, M.D.; writing-review and editing, S.M.E.; visualization, M.D.; supervision, S.M.E.; project administration, S.M.E.; funding acquisition, S.M.E. All authors have read and agreed to the published version of the manuscript.
Funding
This research is financially supported by the Natural Sciences and Engineering Research Council of Canada (grant No. RGPIN-2020-04667).
Institutional Review Board Statement
No institutional review is required.
Informed Consent Statement
Not applicable.
Data Availability Statement
Some or all data, models, or codes that support the findings of this study are available from the corresponding author upon reasonable request.
Acknowledgments
The authors are grateful to four anonymous reviewers for their thorough and most helpful comments.
Conflicts of Interest
The authors declare no conflict of interest.
References
- Deolasee, S.; Lin, Q.; Li, J.; Dolan, J.M. Spatio-temporal Motion Planning for Autonomous Vehicles with Trapezoidal Prism Corridors and Bezier Curves. In Proceedings of the 2023 American Control Conference (ACC), San Diego, CA, USA, 31 May–2 June 2023. [Google Scholar]
- Wang, Y.; Lin, Z. Research on path planning for autonomous vehicle based on Frenet system. J. Eng. Res. 2023, 11, 100080. [Google Scholar] [CrossRef]
- Li, B.; Zhang, Y. Fast Trajectory Planning in Cartesian rather than Frenet Frame: A Precise Solution for Autonomous Driving in Complex Urban Scenarios. IFAC Pap. 2020, 53, 17065–17070. [Google Scholar] [CrossRef]
- Peng, B.; Yu, D.; Zhou, H.; Xiao, X.; Xie, C. A Motion Planning Method for Automated Vehicles in Dynamic Traffic Scenarios. Symmetry 2022, 14, 208. [Google Scholar] [CrossRef]
- Huang, J.; He, Z.; Arakawa, Y.; Dawton, B. Trajectory Planning in Frenet Frame via Multi-Objective Optimization. IEEE Access 2023, 11, 70764–70777. [Google Scholar] [CrossRef]
- Gu, T.; Dolan, J.M. On-Road Motion Planning for Autonomous Vehicles. In Proceedings of the International Conference on Intelligent Robotics and Applications, Montreal, QC, Canada, 3–5 October 2012. [Google Scholar] [CrossRef]
- Zhang, Y.; Gao, F.; Zhao, F. Research on Path Planning and Tracking Control of Autonomous Vehicles Based on Improved RRT* and PSO-LQR. Processes 2023, 11, 1841. [Google Scholar] [CrossRef]
- Reiter, R.; Diehl, M. Parameterization Approach of the Frenet Transformation for Model Predictive Control of Autonomous Vehicles. In Proceedings of the European Control Conference (ECC), Delft, The Netherlands, 29 June–2 July 2021; pp. 2414–2419. [Google Scholar] [CrossRef]
- Wu, X.; Hirota, K.; Tang, B.; Dai, Y.; Jia, Z. Ameliorated Frenet Trajectory Optimization Method Based on Artificial Emotion and Equilibrium Optimizer. J. Adv. Comput. Intell. Intell. Inform. 2021, 25, 110–120. [Google Scholar] [CrossRef]
- Zhang, Y.; Chen, H.; Waslander, S.; Gong, J.; Xiong, G.; Yang, T.; Liu, K. Hybrid Trajectory Planning for Autonomous Driving in Highly Constrained Environments. IEEE Access 2018, 6, 32800–32819. [Google Scholar] [CrossRef]
- Zhang, Y.; Wang, J.; Lv, J.; Gao, B.; Chu, H.; Na, X. Computational Efficient Motion Planning Method for Automated Vehicles Considering Dynamic Obstacle Avoidance and Traffic Interaction. Sensors 2022, 22, 7397. [Google Scholar] [CrossRef] [PubMed]
- Li, C.; Li, X.; Li, J.; Zhu, Q.; Dai, B. Trajectory Planning for Autonomous Ground Vehicles Driving in Structured Environments. In Proceedings of the 9th International Conference on Intelligent Human-Machine Systems and Cybernetics (IHMSC), Hangzhou, China, 26–27 August 2017; pp. 41–46. [Google Scholar] [CrossRef][Green Version]
- Ajanovic, Z.; Lacevic, B.; Shyrokau, B.; Stolz, M.; Horn, M. Search-Based Optimal Motion Planning for Automated Driving. In Proceedings of the IEEE/RSJ International Conference on Intelligent Robots and Systems (IROS), Madrid, Spain, 1–5 October 2018; pp. 4523–4530. [Google Scholar] [CrossRef]
- Yoneda, K.; Iida, T.; Kim, T.; Yanase, R.; Aldibaja, M.; Suganuma, N. Trajectory optimization and state selection for urban automated driving. Artif. Life Robot. 2018, 23, 474–480. [Google Scholar] [CrossRef]
- Diachuk, M.; Easa, S.M. Motion Planning for Autonomous Vehicles Based on Sequential Optimization. Vehicles 2022, 4, 344–374. [Google Scholar] [CrossRef]
- Diachuk, M.; Easa, S.M. Improved Technique for Autonomous Vehicle Motion Planning Based on Integral Constraints and Sequential Optimization. Vehicles 2022, 4, 1122–1157. [Google Scholar] [CrossRef]
- Diachuk, M.; Easa, S.M. Using Inverse Dynamics Technique in Planning Autonomous Vehicle Speed Mode Considering Physical Constraints. Highlights Veh. 2023, 1, 29–53. [Google Scholar] [CrossRef]
- Buckman, N.; Pierson, A.; Karaman, S.; Rus, D. Generating Visibility-Aware Trajectories for Cooperative and Proactive Motion Planning. In Proceedings of the IEEE International Conference on Robotics and Automation (ICRA), Paris, France, 31 May–31 August 2020; pp. 3220–3226. [Google Scholar] [CrossRef]
- Zhou, Y. Research on local trajectory planning of autonomous mobile robots. In Proceedings of the 2nd International Conference on Computer, Communication, Control, Automation and Robotics (CCCAR2022), Shanghai, China, 29–30 March 2022; Volume 47. [Google Scholar] [CrossRef]
- Varvak, P.M. Finite Element Method: Textbook for High Schools; Kyiv-Higher School, Head Publishing House: Kyiv, Ukraine, 1981; 176p. [Google Scholar]
- Fickenscher, J.; Schmidt, S.; Hannig, F.; Bouzouraa, M.E.; Teich, J. Path Planning for Highly Automated Driving on Embedded GPUs. J. Low Power Electron. Appl. 2018, 8, 35. [Google Scholar] [CrossRef]
- Dinh, N.; Sualeh, M.; Kim, D.; Kim, G.-W. A Hierarchical Control System for Autonomous Driving towards Urban Challenges. Appl. Sci. 2020, 10, 3543. [Google Scholar] [CrossRef]
- Audi A4 Quatro Characteristics. 2023. Available online: http://www.automobile-catalog.com/car/2011/1187660/audi_a4_3_2_fsi_quattro_attraction_tiptronic.html (accessed on 6 October 2023).
- MATLAB R2022b. Available online: https://www.mathworks.com/ (accessed on 23 October 2023).
- Werling, M.; Ziegler, J.; Kammel, S.; Thrun, S. Optimal trajectory generation for dynamic street scenarios in a Frenét Frame. In Proceedings of the 2010 IEEE International Conference on Robotics and Automation, Anchorage, AK, USA, 3–7 May 2010; pp. 987–993. [Google Scholar] [CrossRef]
Disclaimer/Publisher’s Note: The statements, opinions and data contained in all publications are solely those of the individual author(s) and contributor(s) and not of MDPI and/or the editor(s). MDPI and/or the editor(s) disclaim responsibility for any injury to people or property resulting from any ideas, methods, instructions or products referred to in the content. |
© 2024 by the authors. Licensee MDPI, Basel, Switzerland. This article is an open access article distributed under the terms and conditions of the Creative Commons Attribution (CC BY) license (https://creativecommons.org/licenses/by/4.0/).