1. Introduction
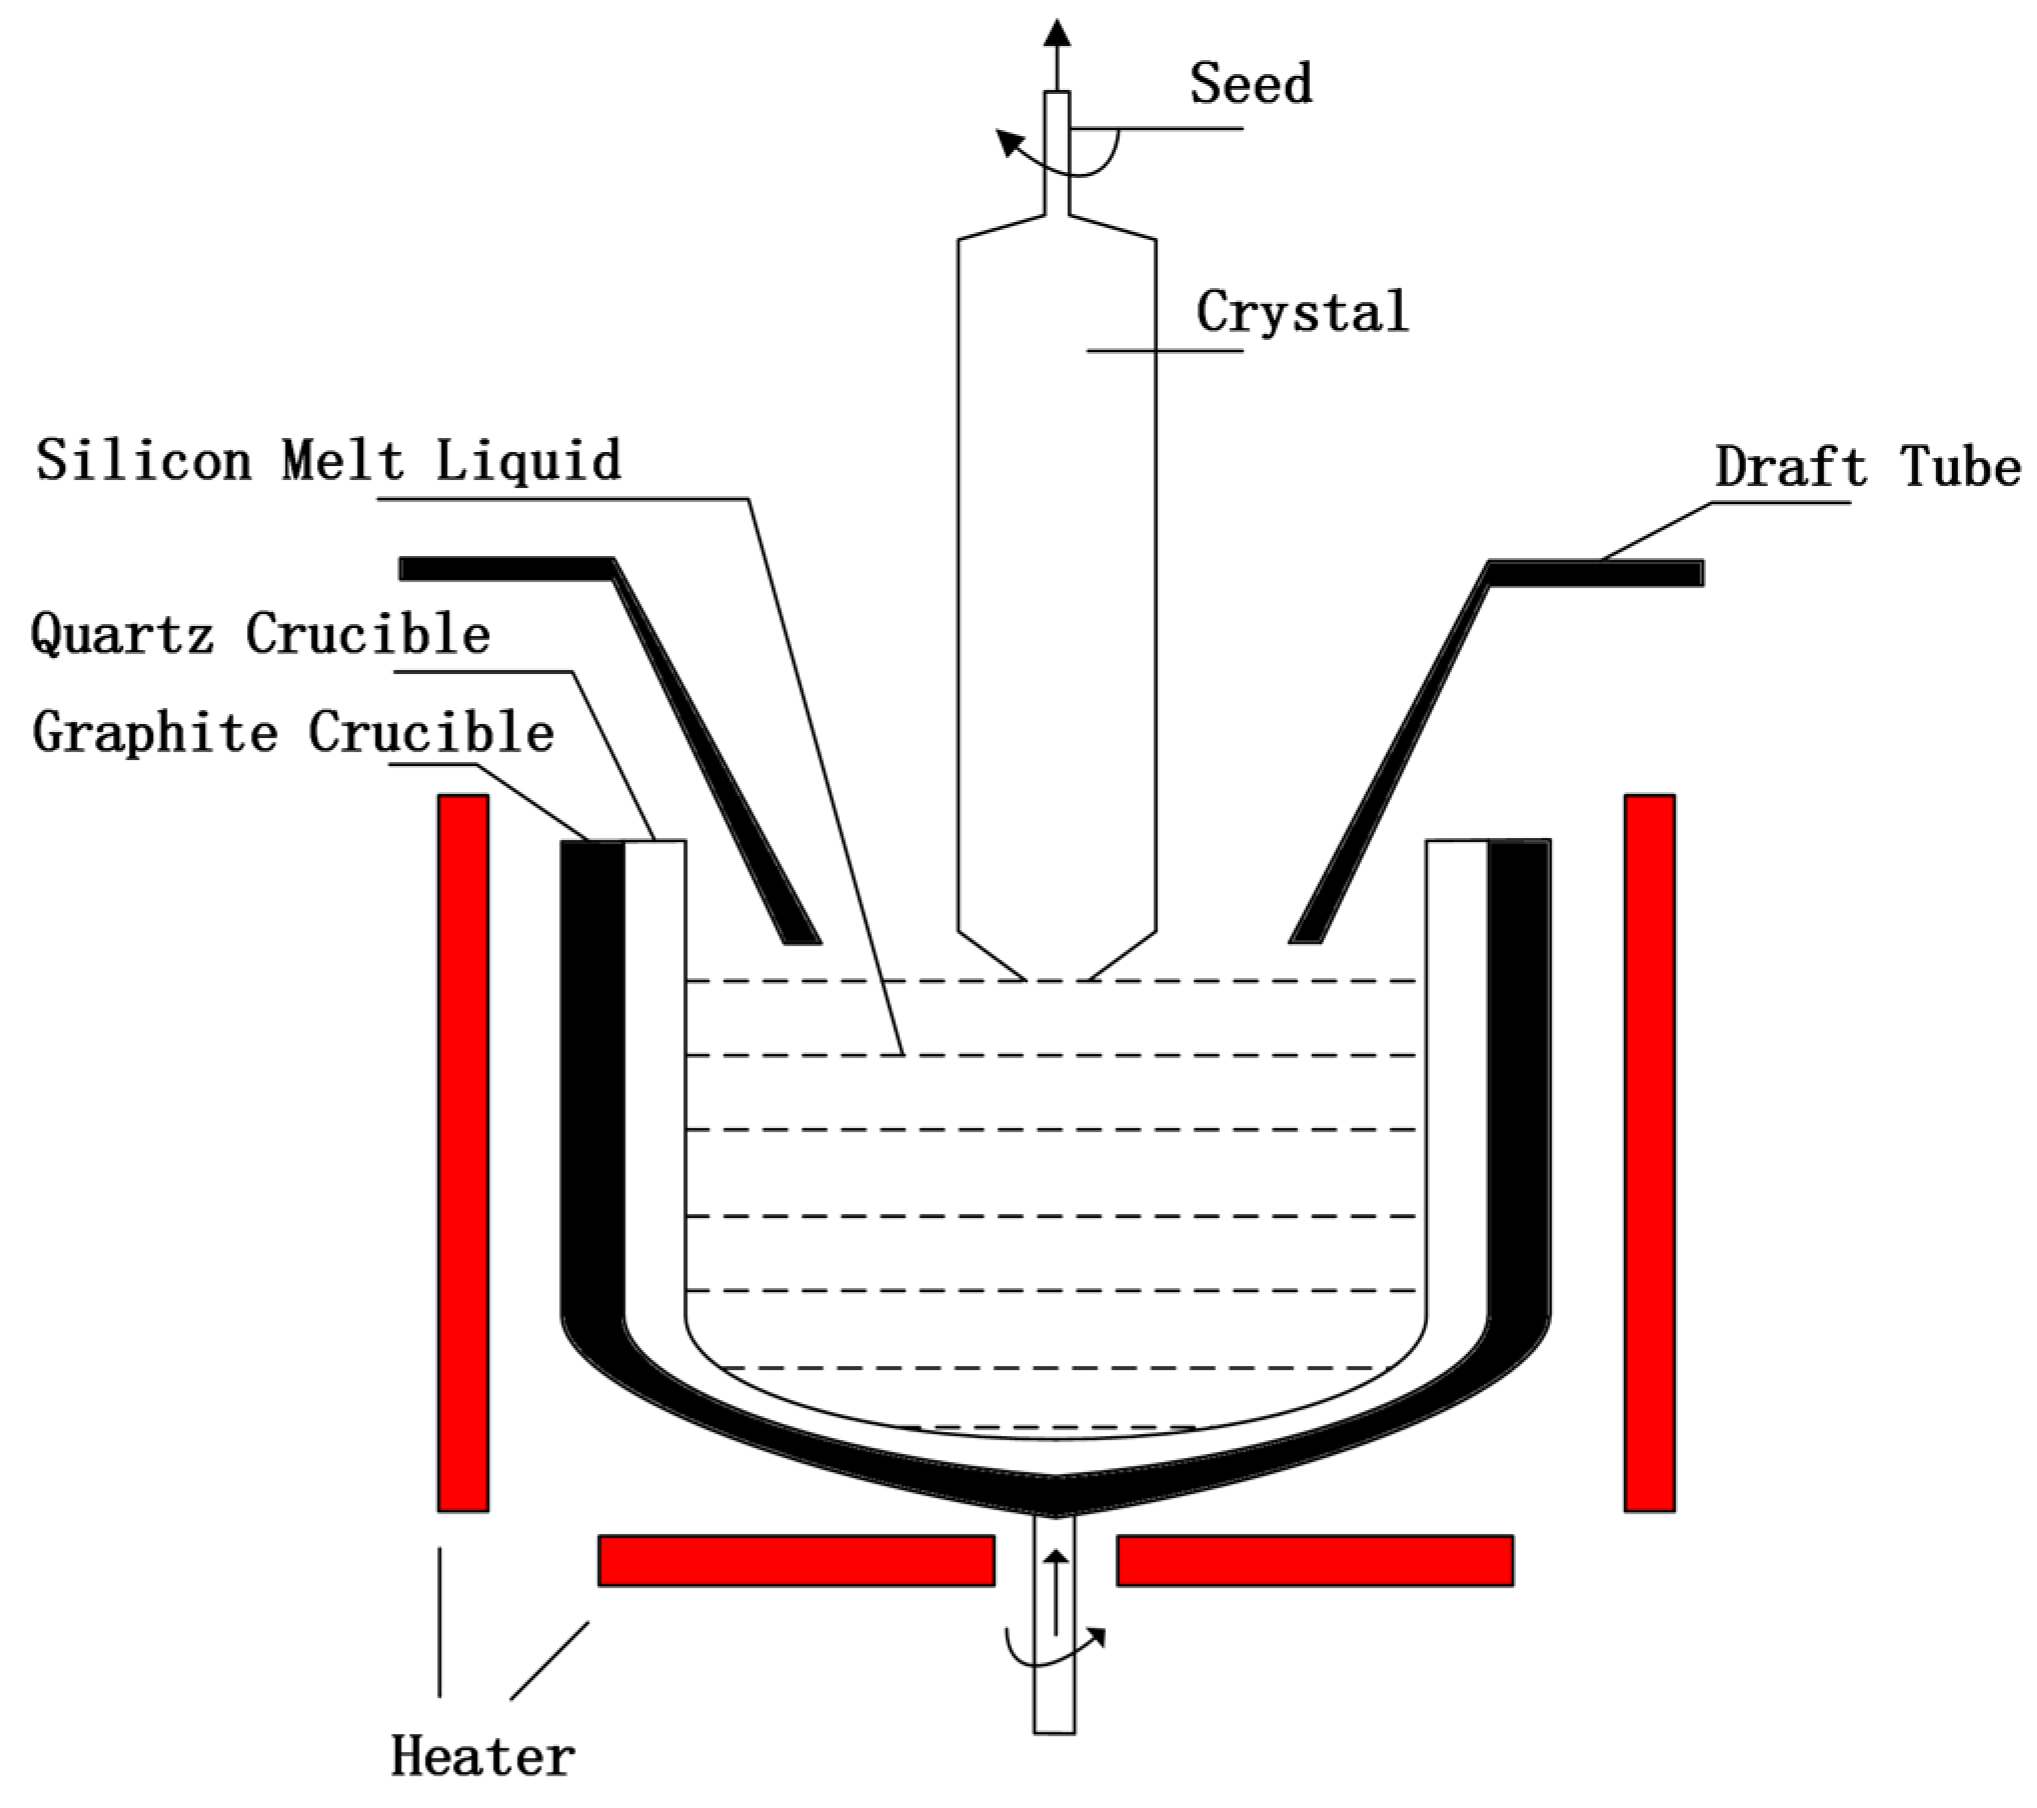
In the ever-evolving landscape of semiconductor and solar photovoltaic technology, monocrystalline silicon stands as a material of paramount importance. Its production predominantly relies on the Czochralski process, a sophisticated and multi-staged method encompassing seeding, shoulder formation, body growth, and tailing. The basic principle is to use the molten silicon material to contact a small monocrystalline silicon seed crystal, and slowly pull the seed crystal at a specific temperature, so that the molten silicon solidifies on the surface of the seed crystal to form monocrystalline silicon. During the whole process, the temperature of the molten silicon is kept slightly higher than the melting point of silicon, and the uniformity and crystallization quality in the crystal growth process are promoted by rotating the seed crystal and/or furnace. The tail process reduces the crystal diameter to a certain extent by slowly increasing the temperature and crystal pulling speed, and finally leaves the silicon melt level. In the tail process, if the crystal diameter is not properly controlled, it will lead to crystal dislocation and crystal growth failure [
1,
2,
3]. A schematic diagram of the Czochralski growth of monocrystalline silicon is shown in
Figure 1.
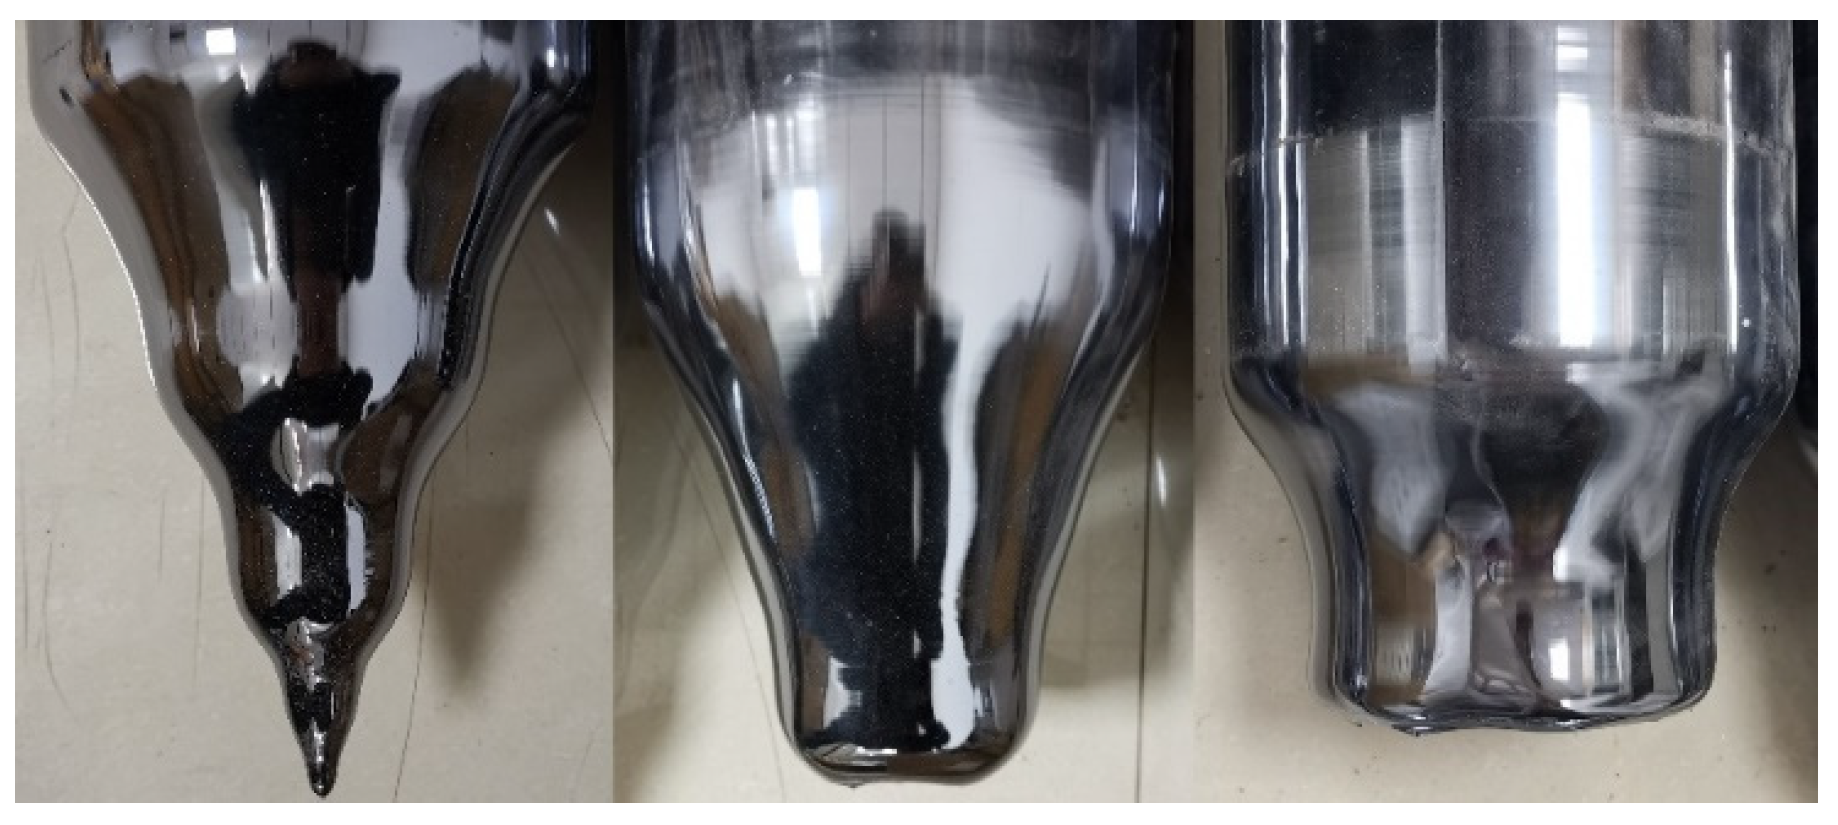
For crystal growth, it is necessary to ensure the integrity of crystal growth. Integrity means that in the tail of crystal growth, the tail diameter is continuously reduced until it is separated from the silicon melt. The integrity of the crystal tail can effectively prevent the reverse extension of crystal dislocations, thus damaging the quality of the wafer at the body stage. The different tail shapes are shown in
Figure 2. Therefore, the tail diameter must be effectively controlled, and the premise of control is to measure the tail diameter in real time. Generally, we want the tail length to be as short as possible to save silicon. However, in the tail process, the crystal diameter obtained by image measurement [
4] needs to ensure a longer tail length so that the crystal meniscus is visible. However, a longer tail length not only wastes silicon but also takes a large amount of time. Similarly, the method of using high-temperature infrared pyrometers to obtain the crystal diameter has the same disadvantages. Also, taking the crystal mass variation to estimate the crystal diameter of the tail growth still has many shortcomings. On the one hand, due to the detection accuracy and observation noise of the sensor, and on the other hand, due to the time-varying shape of the solid–liquid interface in the tail process [
5], the estimation results are inaccurate. Therefore, we need to study the indirect measurement technology of the crystal diameter.
The realm of soft measurement has witnessed significant advancements in recent years. In various studies, innovative approaches have been adopted, such as introducing dropout regularization into deep convolution networks for enhanced accuracy in health status identification [
6], employing mutual information-based methods for effective biochemical oxygen demand prediction [
7], and utilizing fuzzy least squares support vector machines optimized by adaptive genetic algorithms for torque measurement in AC dynamometers [
8]. In addition, in references [
9,
10], the forecast models and wavelet neural network models have been applied to the field of soft measurement. However, these existing techniques, while groundbreaking, fall short in addressing the specific challenges posed by the Czochralski process, particularly in accurately measuring the tail diameter amid fluctuating process conditions. This highlights a significant gap in the existing methodologies, which need a more precise, non-intrusive, and efficient approach to measure the tail diameter.
To address these challenges, this paper introduces a novel soft measurement method, DBN-ACO-SVR, leveraging the synergistic potential of a deep belief network (DBN) and a support vector regression (SVR) network, enriched by system identification techniques so as to precisely predict the crystal diameter. We begin by addressing the delay effect of the temperature and crystal pulling speed on the tail diameter growth, utilizing a backpropagation (BP) neural network based on the mean impact value (MIV) method to determine the optimal delay time. This critical step ensures the synchronization of the process variables with the actual growth dynamics of the crystal tail. At the heart of our method is the DBN network, which leverages the temperature and crystal pulling speed as inputs to capture intricate relationships between process variables and the tail diameter, and offers a sophisticated predictive model. To refine this model, we augment the DBN network with an SVR network, enhancing its linear regression capabilities and infusing robustness against non-linear variations in the data. The ant colony optimization (ACO) algorithm is employed for fine-tuning the SVR network’s parameters, ensuring accuracy and adaptability under varying data conditions. Extensive computational experiments benchmark our DBN-ACO-SVR network against traditional models, demonstrating a superior capability in addressing the delay problem and achieving precise tail diameter predictions.
The contributions of this study are manifold and significant. Primarily, it pioneers a soft measurement technique for the tail diameter in the Czochralski process, a task previously marred by technical and practical challenges. This technique not only enhances the accuracy, but also negates the need for direct measurement methods that are often cumbersome and inefficient. The study further elucidates the relationship between process variables (temperature and pulling speed) and the tail diameter by quantifying their impact through the MIV method. This contributes to a deeper understanding of the crystal growth process. Moreover, the integration of DBN and SVR networks, optimized by ACO, marks an innovative approach in the realm of predictive modeling, offering a novel solution to a longstanding problem in semiconductor manufacturing. This research, therefore, holds substantial promise for advancing the precision and efficiency of monocrystalline silicon production, with potential ramifications in the semiconductor and solar photovoltaic industries.
2. Data Collection
Generally, the tail-growing process in the Czochralski silicon single-crystal growing process includes basic processing parameters and control processing parameters. Basic processing parameters include the crystal rotation, crucible rotation, argon flow, magnetic field strength, furnace pressure, liquid level position, and other process parameters. The control processing parameters include the temperature and pulling speed, which are used to adjust the crystal diameter in the tail-growing process.
Due to the lack of technology to measure the tail diameter at present, we have selected four measurable and directly related variables—temperature, pulling speed, tail length, and mass increment—as data sources for predicting the crystal tail diameter.
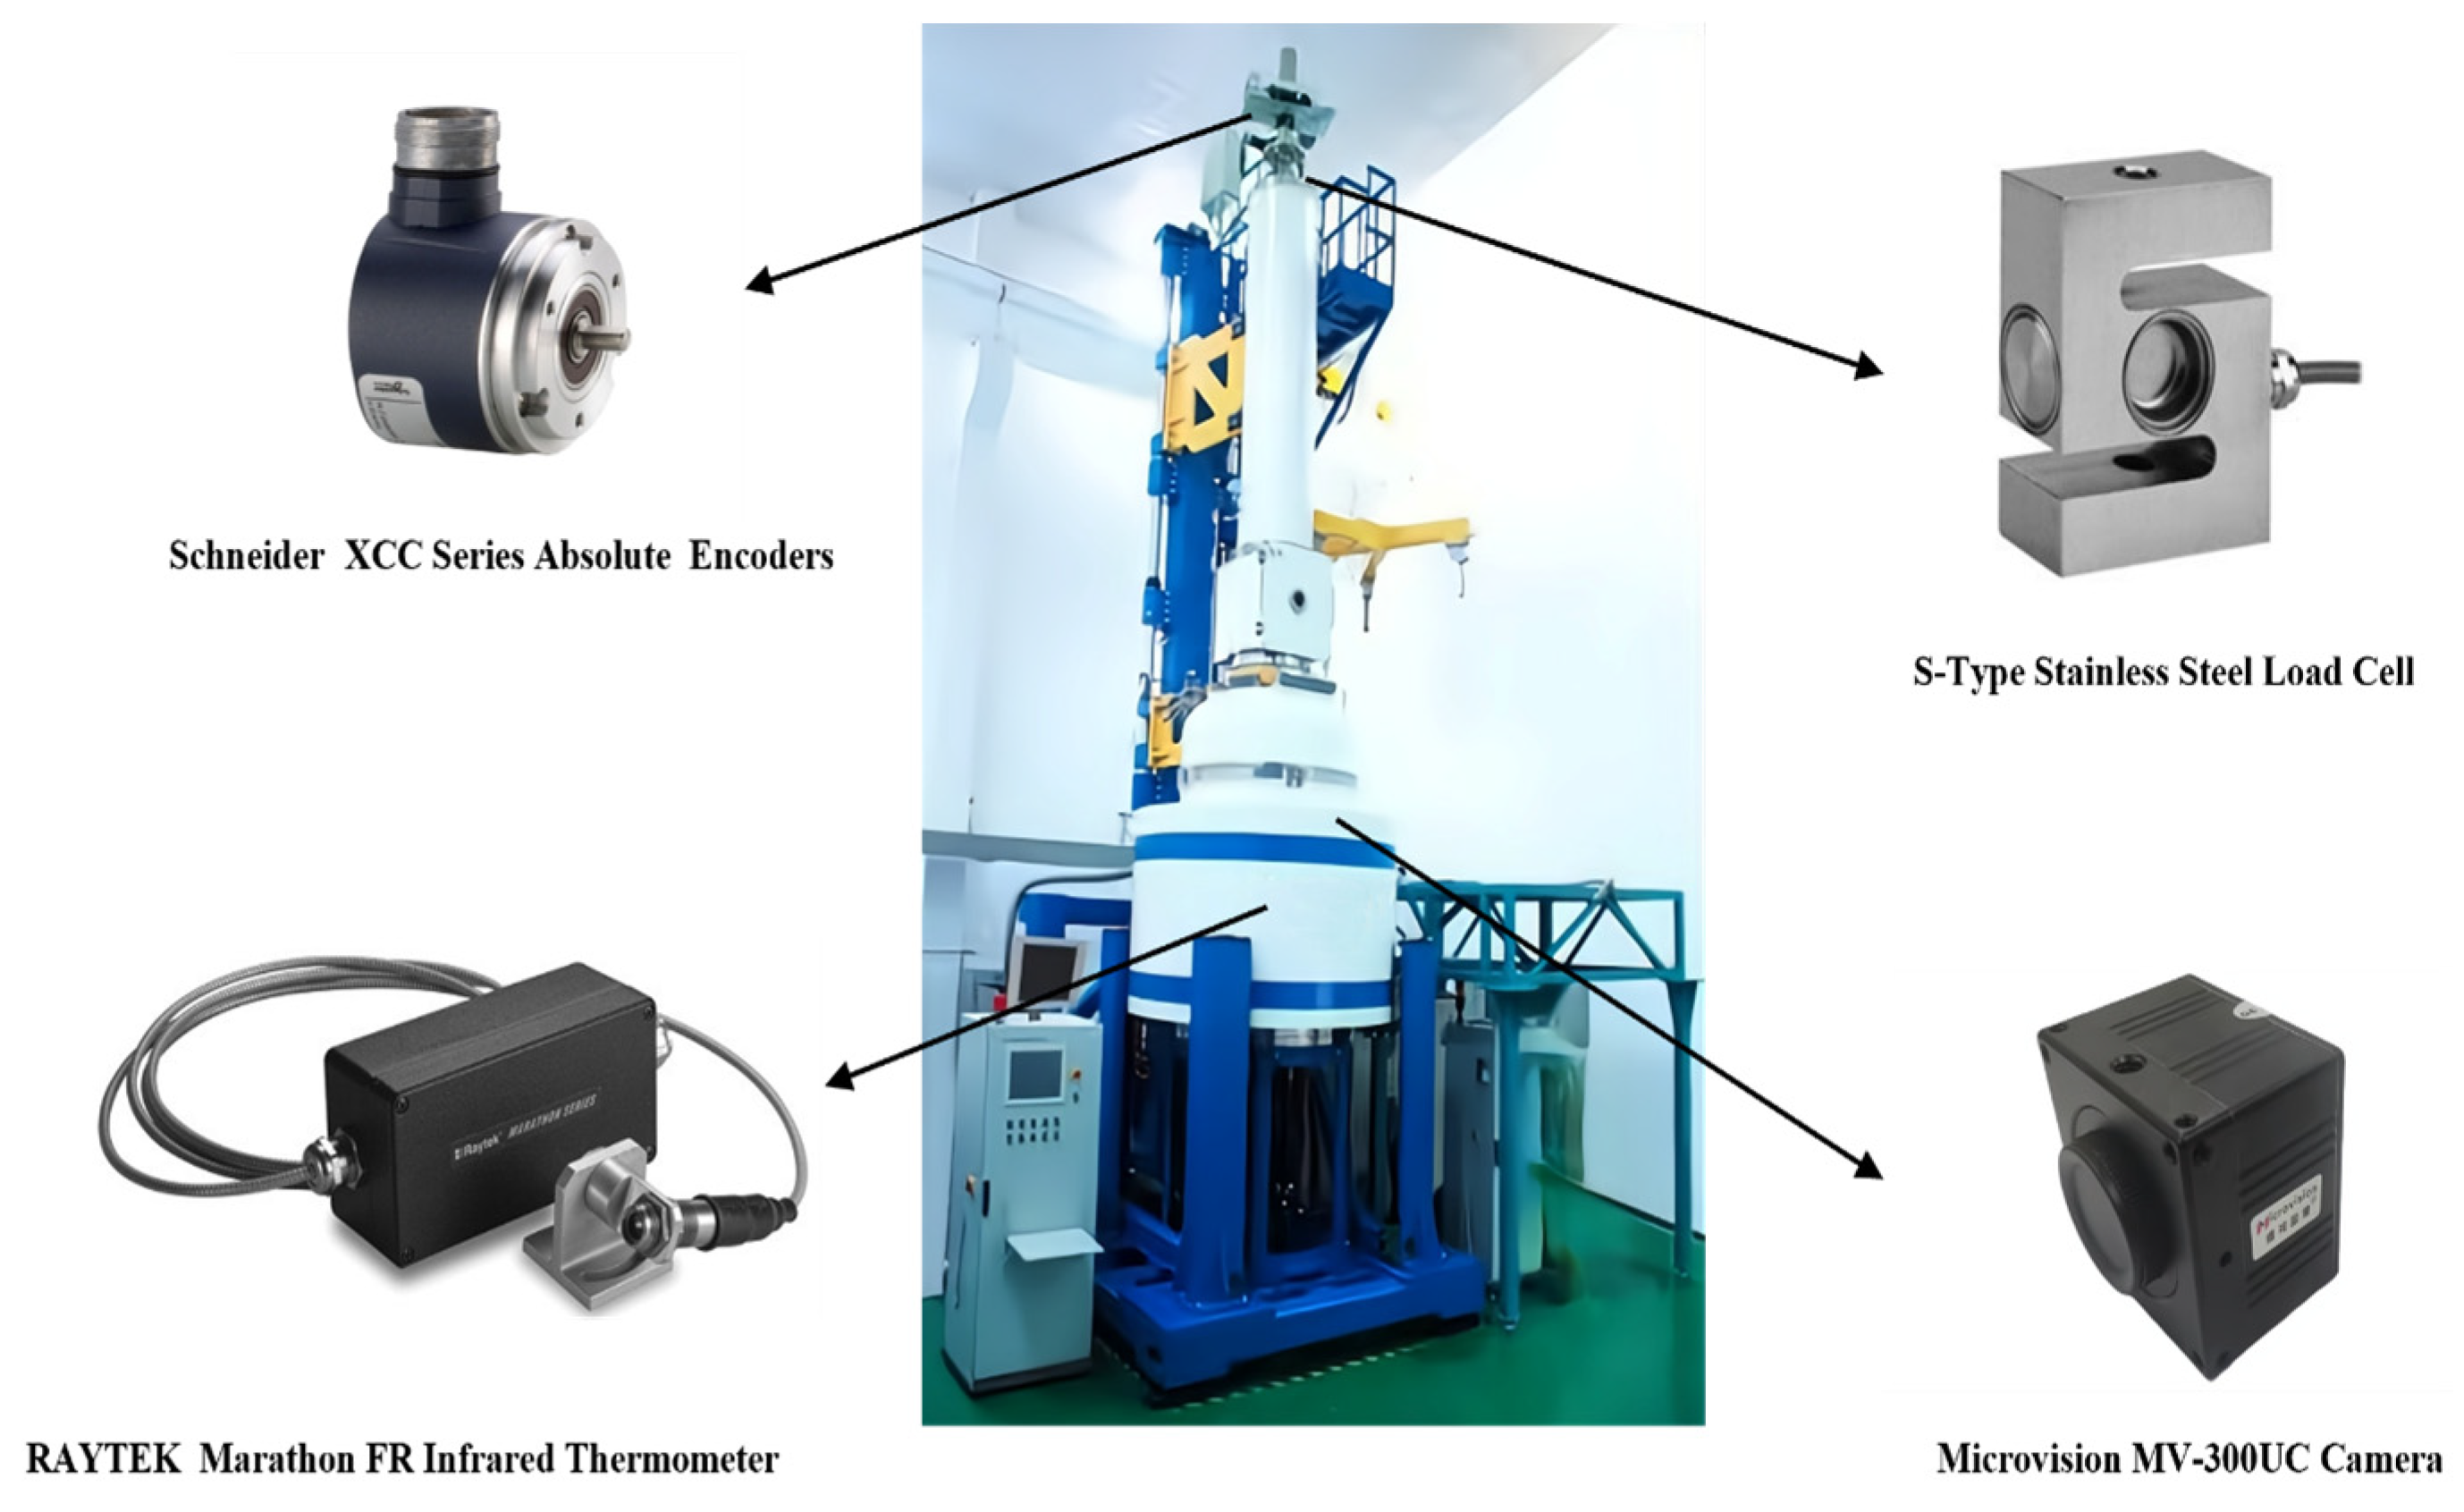
The data in this article were collected from crystal-growing equipment on-site. The model of the single-crystal furnace was TDR-120CZ, as shown in
Figure 3. This equipment can produce CZ silicon single crystals of 100–310 mm diameter. The diameter measurement range is 4–350 mm. The equipment has a maximum power of 180 kW. The crucible rotation speed can be adjusted within the range of 0–15 rpm, while the crystal rotation speed can be adjusted within the range of 0–20 rpm. The crucible lifting speed can be adjusted within the range of 0–0.5 mm/min, and the crystal lifting speed is within the range of 0–6 mm/min. The ultimate vacuum degree is 0.4 Pa, and the inlet air flow can be adjusted within the range of 0–150 L/min, with a liquid level adjustment range of 0–100 mm. The crystal lifting stroke is 2.8 m, and the crucible lifting stroke is 600 mm. In terms of on-site process parameters, the target set value for the diameter is 308 mm, and the casting speed can be adjusted within the range of 0.2–1.1 mm/min. The temperature adjustment is determined based on the input of the silicon material quantity. The general rule is to first cool and then raise the temperature, with the adjustment range typically being 2100–2500 (dimensionless).
The crystal diameter signal used for the data fusion was acquired using a Microvision MV-300UC Camera. The temperature signal in the growing process of the crystal was obtained through a RAYTEK Marathon FR Infrared Thermometer sensor. The pulling speed and tail length of the crystal were acquired using Schneider XCC Series Absolute Encoders. The mass increment of the crystal was obtained using an S-Type Stainless Steel Load Cell. The data of the temperature, pulling speed, tail length, and mass increment were sampled every 2 s. All signal-acquisition devices are shown in
Figure 3.
3. Overall Architecture of the Proposed Method
The proposed prediction method development process is shown in
Figure 4. It includes some stages. The first stage is the processing of input data. For the field data measured by crystal-growing equipment on site, the grey correlation analysis (GRA) method [
11] is used to perform correlation analysis on data with a significant impact on the tail diameter. For the temperature and pulling speed, the MIV algorithm [
12] is used to select delaying orders that have a significant impact on the tail diameter, and then the data are randomly divided into training and testing datasets. The second stage is the establishment of a prediction model. The deep belief network is employed to extract the feature information in the data. Then, the extracted feature information is used as an input of the SVR. The ant colony optimization (ACO) algorithm [
13] is employed to automatically select the optimal parameter of the SVR, and apply it to the soft measurement model. The final stage is to predict the tail diameter based on the DBN-ACO-SVR model, compare the predicted results with those of other methods, and validate the data of different lots based on this model.
In the tail process of Czochralski crystal growth, the variables affecting the crystal diameter include temperature, pulling speed, etc. Other parameters such as the crystal rotation speed and crucible rotation speed are mostly kept constant at this stage. Therefore, in order to ensure that the data used in modeling reflect the actual growth status of the tail diameter as much as possible, it is necessary to adopt a method to determine the signals associated with the tail diameter. This article adopts the grey correlation analysis method, which refers to the geometric comparison of data sequences that reflect the changing characteristics of various factors. In the gray correlation analysis method, the reference series and the comparison sequence are respectively
and
. The calculation formula for the correlation degree of each series is Formula (1):
where
is the resolution coefficient, the value range is 0–1, and the general value is 0.5.
When predicting the tail crystal diameter, due to the delaying time of the temperature and pulling speed, the current crystal diameter cannot be directly trained and predicted by using the temperature and pulling speed at the current moment. It is necessary to determine the delaying order of the temperature and pulling speed on the diameter.
In this paper, the MIV algorithm [
14] is used to choose the significant input items from the temperature and pulling speed. Input variables that significantly affect the output are retained, and those that do not play a significant role are excluded. Finally, the above temperature and pulling speed input items are used to become the DBN-ACO-SVR network inputs. The delaying of temperature and pulling speed needs to be analyzed independently. Taking the temperature delaying time as an example, we establish a three-layer multi-input and single-output temperature-diameter dynamic neural network model [
14]. The model is shown in
Figure 5, and can be expressed as Formula (2):
where
is the crystal diameter at moment
,
is the temperature at moment
,
is the maximum delaying order of the temperature input, and
is a nonlinear function.
First, the neural network shown in
Figure 5 is trained by using the dataset. When the accuracy of the training results is satisfied, the network training parameters are saved. Second, the original input values of
are increased to
by 10% and decreased by 10% one by one, and the original values of the other input items are kept unchanged at the same time. This results in new
datasets. The new dataset is substituted into the trained network to obtain network outputs
and
. Finally, we use
and
to make a difference, and the result is the impact value (IV). The MIV of this input is obtained by calculating the average of IV. The
corresponding to the
-th input item is as follows:
All from to are calculated. The larger is, the greater the impact of this input on the output of the network. is the temperature threshold. Finally, we select all inputs that satisfy , where is the delaying order. Similarly, the delaying order of the pulling speed is also obtained by this method.
After determining the delaying order of the influence of the temperature and pulling speed on the crystal tail diameter, a neural network model is established to predict the diameter. The model also needs to introduce the crystal length and the crystal mass as input variables. The tail length is introduced considering that the thermal radiation will change as the crystal length increases [
3], and the introduction of a mass increment indirectly reflects the change in diameter. The model can be expressed using Formula (4):
where
are satisfied temperature inputs that meet
,
are satisfied pulling speed inputs that meet
,
is the pulling speed threshold,
is the crystal tail length at the time of
,
is the mass increment from the time
to
, and
is a nonlinear function.
To improve the accuracy of the tail diameter prediction, it is necessary to fully extract the characteristic information in the data. Although several soft measurement models based on deep learning can achieve this goal, those models still have limitations. For example, in the case of a large amount of data, complex physical structures, and increased dimensions, the SVR modeling method is generally inefficient [
15,
16]. Also, this method only uses a shallow network for training rather than repeatedly training through a multi-layer network, so it cannot extract the characteristic information in the data, which will affect the model’s prediction accuracy. In addition, the BP neural network has a higher efficiency in a single hidden layer. When there are multiple hidden layers, the efficiency of back propagation will be greatly reduced. Therefore, this paper uses a DBN with multiple hidden layers for soft measurement modeling [
17,
18]. A DBN can learn complex data features by combining multi-layer networks to realize multi-level representation learning and represent the implicit information of data, thus making the prediction more accurate.
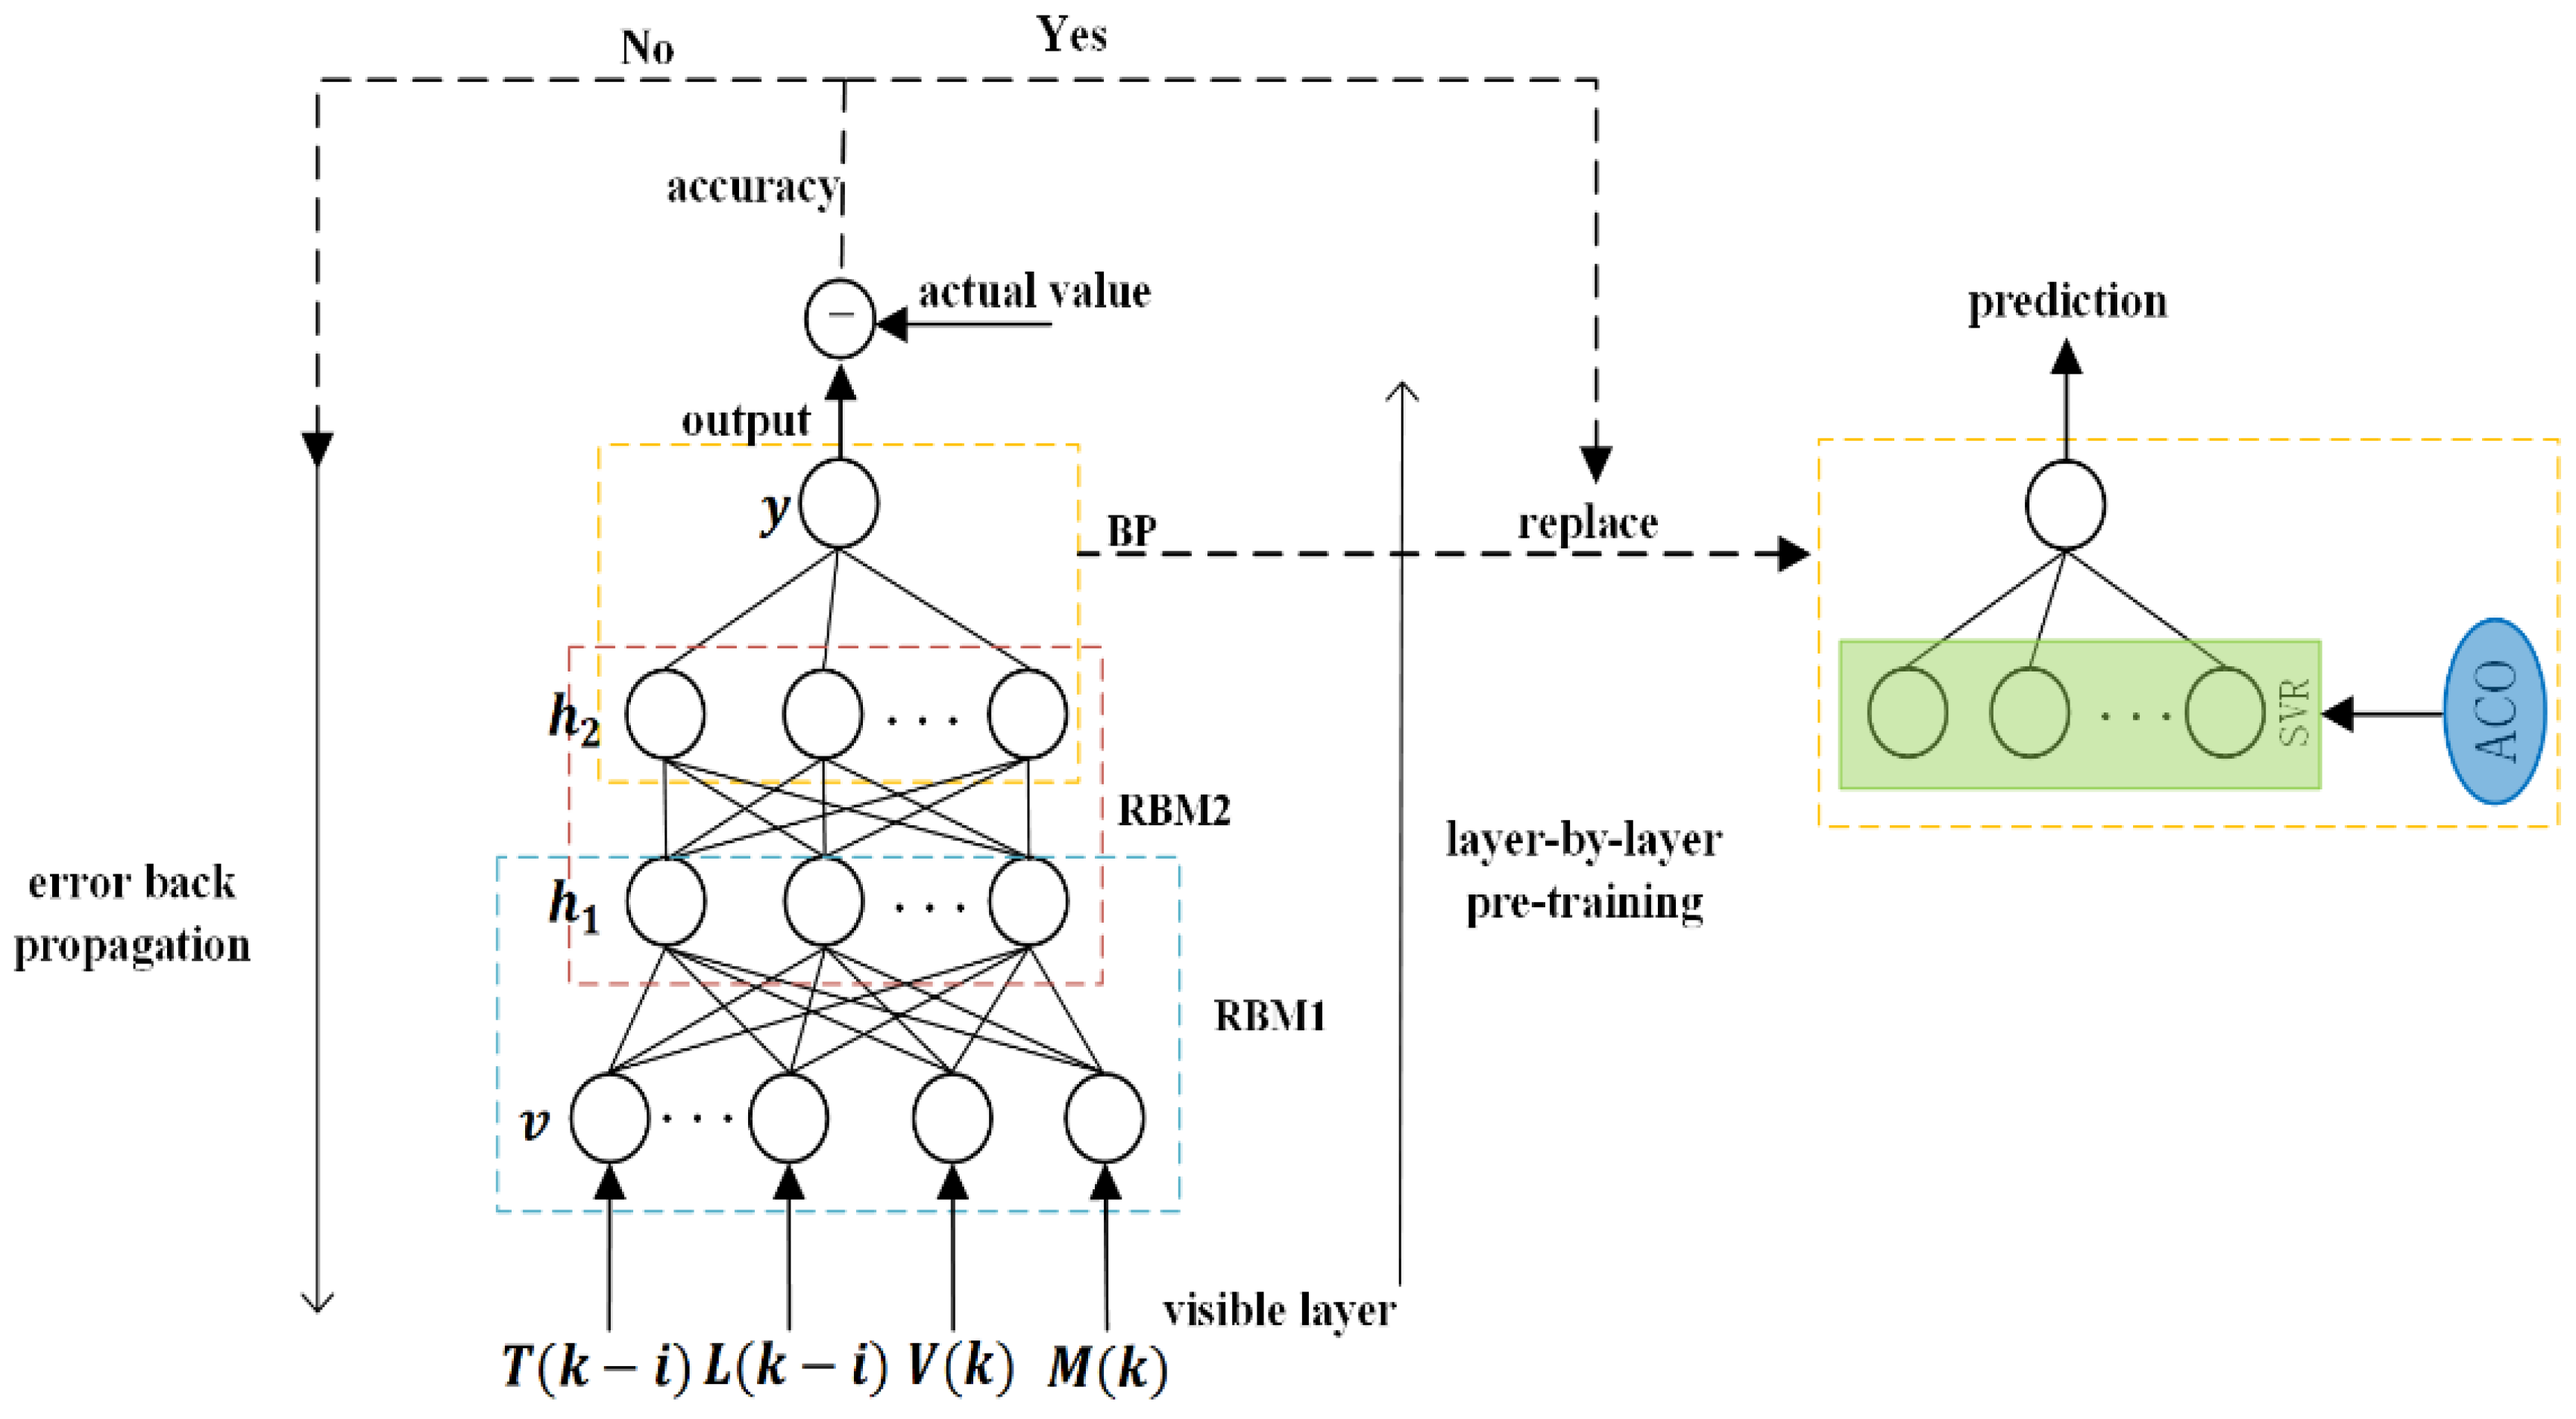
The DBN is composed of multiple restricted Boltzmann machines (RBM) [
19]. The structure of the DBN model is shown in
Figure 6. An RBM visible layer is used to describe the features of the input data, and the hidden layer can be regarded as a feature-extraction layer.
The visible layer unit is
, the hidden layer unit is
, and the internal parameter set is
, and then the probability distribution based on the energy probability model is as follows:
where
is the regularization factor and
. Therefore, the energy function of RBM is as follows:
where
and
are visible layer offsets and hidden layer offsets, respectively, and
are the connection weights between the visible layer
and hidden layer
.
The joint probability distribution of visible layer
is as follows:
When the input signal of the visible layer is given, the activation conditions of each node of the hidden layer are independent; conversely, when the hidden layer condition is determined, the activation conditions of each node of the visible layer are also independent. Therefore, according to the above formula, when the input condition and visible layer
are known, the access probability of hidden layer
is as follows:
Similarly, when the output data of the hidden layer and the output unit vector
are known, the output probability of the visible layer
is as follows:
Taking the activation function Sigmoid function as an example, the activation probability of
and
is obtained as follows:
The DBN network is obtained by stacking multiple RBMs and a BP layer. Then, the achieved network is pre-trained and adjusted accurately layer by layer. The unsupervised greedy learning algorithm and the contrast divergence algorithm are used to complete the pre-training layer by layer. Afterwards, the gradient descent algorithm is used to complete the accurate adjustment of the network. Considering the weak nonlinear regression ability of the DBN, this paper replaces the top structure of the DBN with SVR to strengthen the nonlinear regression ability and uses the data features extracted by the DBN as the prediction input of the SVR model. Additionally, the ACO is used to select the appropriate parameters for SVR, and the SVR algorithm is used to fine-tune the entire network. The structure of the proposed soft measurement model named DBN-ACO-SVR is shown in
Figure 7.
For the training set sample
of the SVR model, we hope to obtain a regression model to make
and
as close as possible.
and
are the regression parameters to be determined. Assuming that the deviation between
and
can be tolerated up to
, the SVR problem is finally converted as shown in Equation (12):
where
is the regularization parameter and
is the insensitive loss function, as shown in Equation (13):
The final SVR solution is obtained as follows:
Then, the kernel function is introduced:
In this manner, the SVR solution can be rewritten as follows:
4. Experimental Results and Analysis
Grey correlation analysis was conducted using data obtained from industrial sites. The correlation analysis method was used to analyze the temperature and casting speed variables that are closely related to the tail diameter. The correlation between the two comparison sequences and the tail diameter is shown in
Figure 8.
As shown in
Figure 8, the temperature, pulling speed, tail length, and mass increment have a high correlation with the tail diameter in the tail process. The mean correlation coefficients of the temperature, pulling speed, tail length, and mass increment are 0.4896, 0.3606, 0.3588, and 0.3452, respectively.
The growth process data of 300 mm monocrystalline silicon were obtained for the Czochralski furnace of the Crystal Growth Equipment and System Integration National & Local Joint Engineering Research Center. These data were used to validate the soft measurement method. According to experience, the delay time of the temperature is about 10~13 min, and the delay time of the pulling speed is less than 1 min. The preset values of the temperature delaying order
, the pulling speed delaying order
, and the maximum delaying time all need to be satisfied. The data-sampling frequency is 0.2 Hz, so let
. Taking the delaying order identification of temperature as an example, the inputs of the neural network in the MIV algorithm are
, and the number of neurons in the hidden layer is
, where
is the number of inputs and
is the number of outputs.
is between 1 and 10, so let
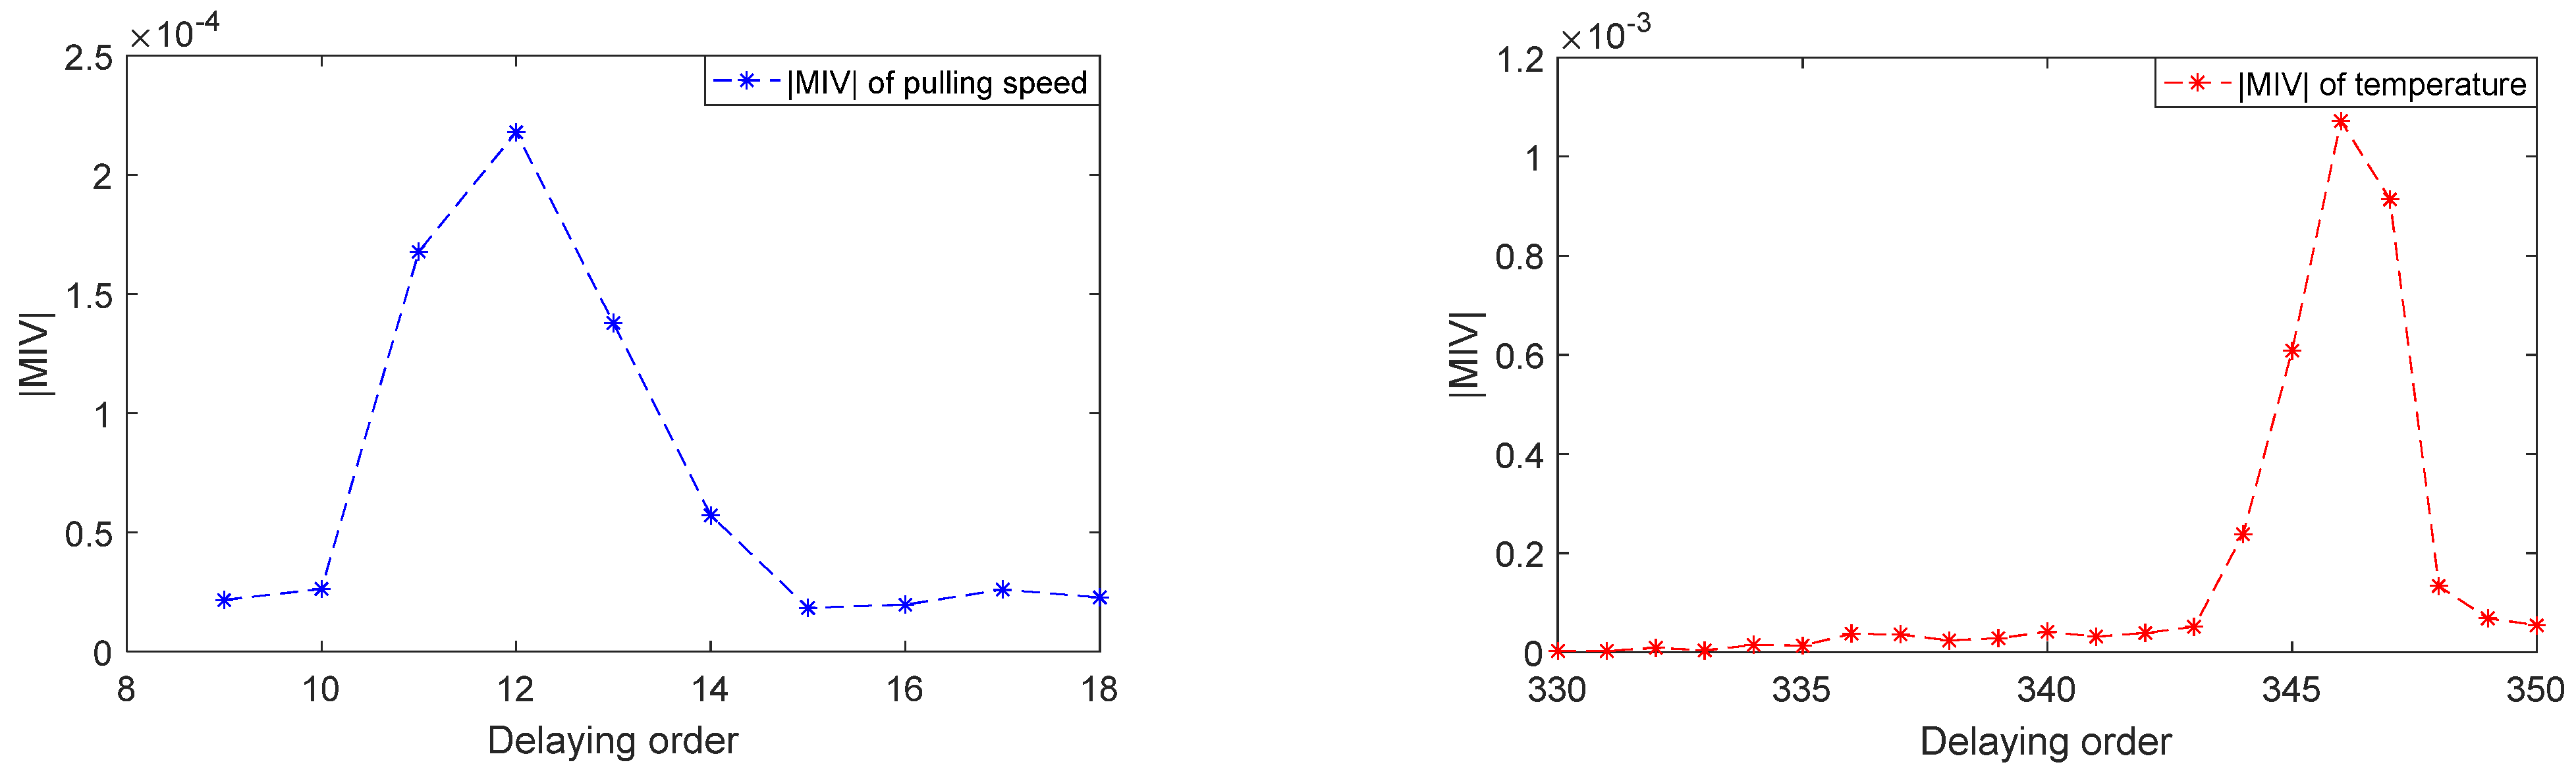
. The Levenberg–Marquardt algorithm is used to obtain the relationship between the delaying order of the temperature and pulling speed and the absolute value of the MIV after 1000 iterations. The relationship diagram is shown in
Figure 9.
The delaying order maximum MIV counterparts of the effect of the temperature and pulling speed on the crystal diameter were and . In order to prevent the omission of other input items, the final selection of the temperature input item was and the pulling speed input item was .
After the delaying order of the temperature was obtained, the DBN-ACO-SVR network was constructed. The network model can be expressed by Formula (17):
From the above formula, the number of input nodes in the network was 8, and the number of output nodes was 1.
We determined the number of layers and nodes of the DBN through continuous experimental verification. The number of network layers of the DBN was set as four layers, and the number of RBMs was two. The number of nodes in each layer was selected as 8-20-6-1. The learning rate was set as 0.02, and the activation function was selected as Sigmoid. The error results of each RBM iteration and prediction error results of the DBN iteration are shown in
Figure 10.
ACO is used to select the optimal parameter of SVR and apply it to soft sensing models. The results of the iterative optimization after processing 200 iterations are shown in
Figure 11. We substituted the optimal parameter of the SVR algorithm obtained from the ACO algorithm into the DBN model to obtain a new soft measurement model, DBN-ACO-SVR, and predict the crystal tail diameter using this model.
This paper proposes a soft measurement method for the tail diameter of the DBN-ACO-SVR model. The training dataset of the verification conclusion in this paper includes two kinds of datasets. In the first dataset, the basic processing parameters are the same, and the control processing parameters are different. Different temperatures and pulling speeds produce different tail diameters and mass increments. In the second dataset, some basic processing parameters and control processing parameters are different.
For the results in
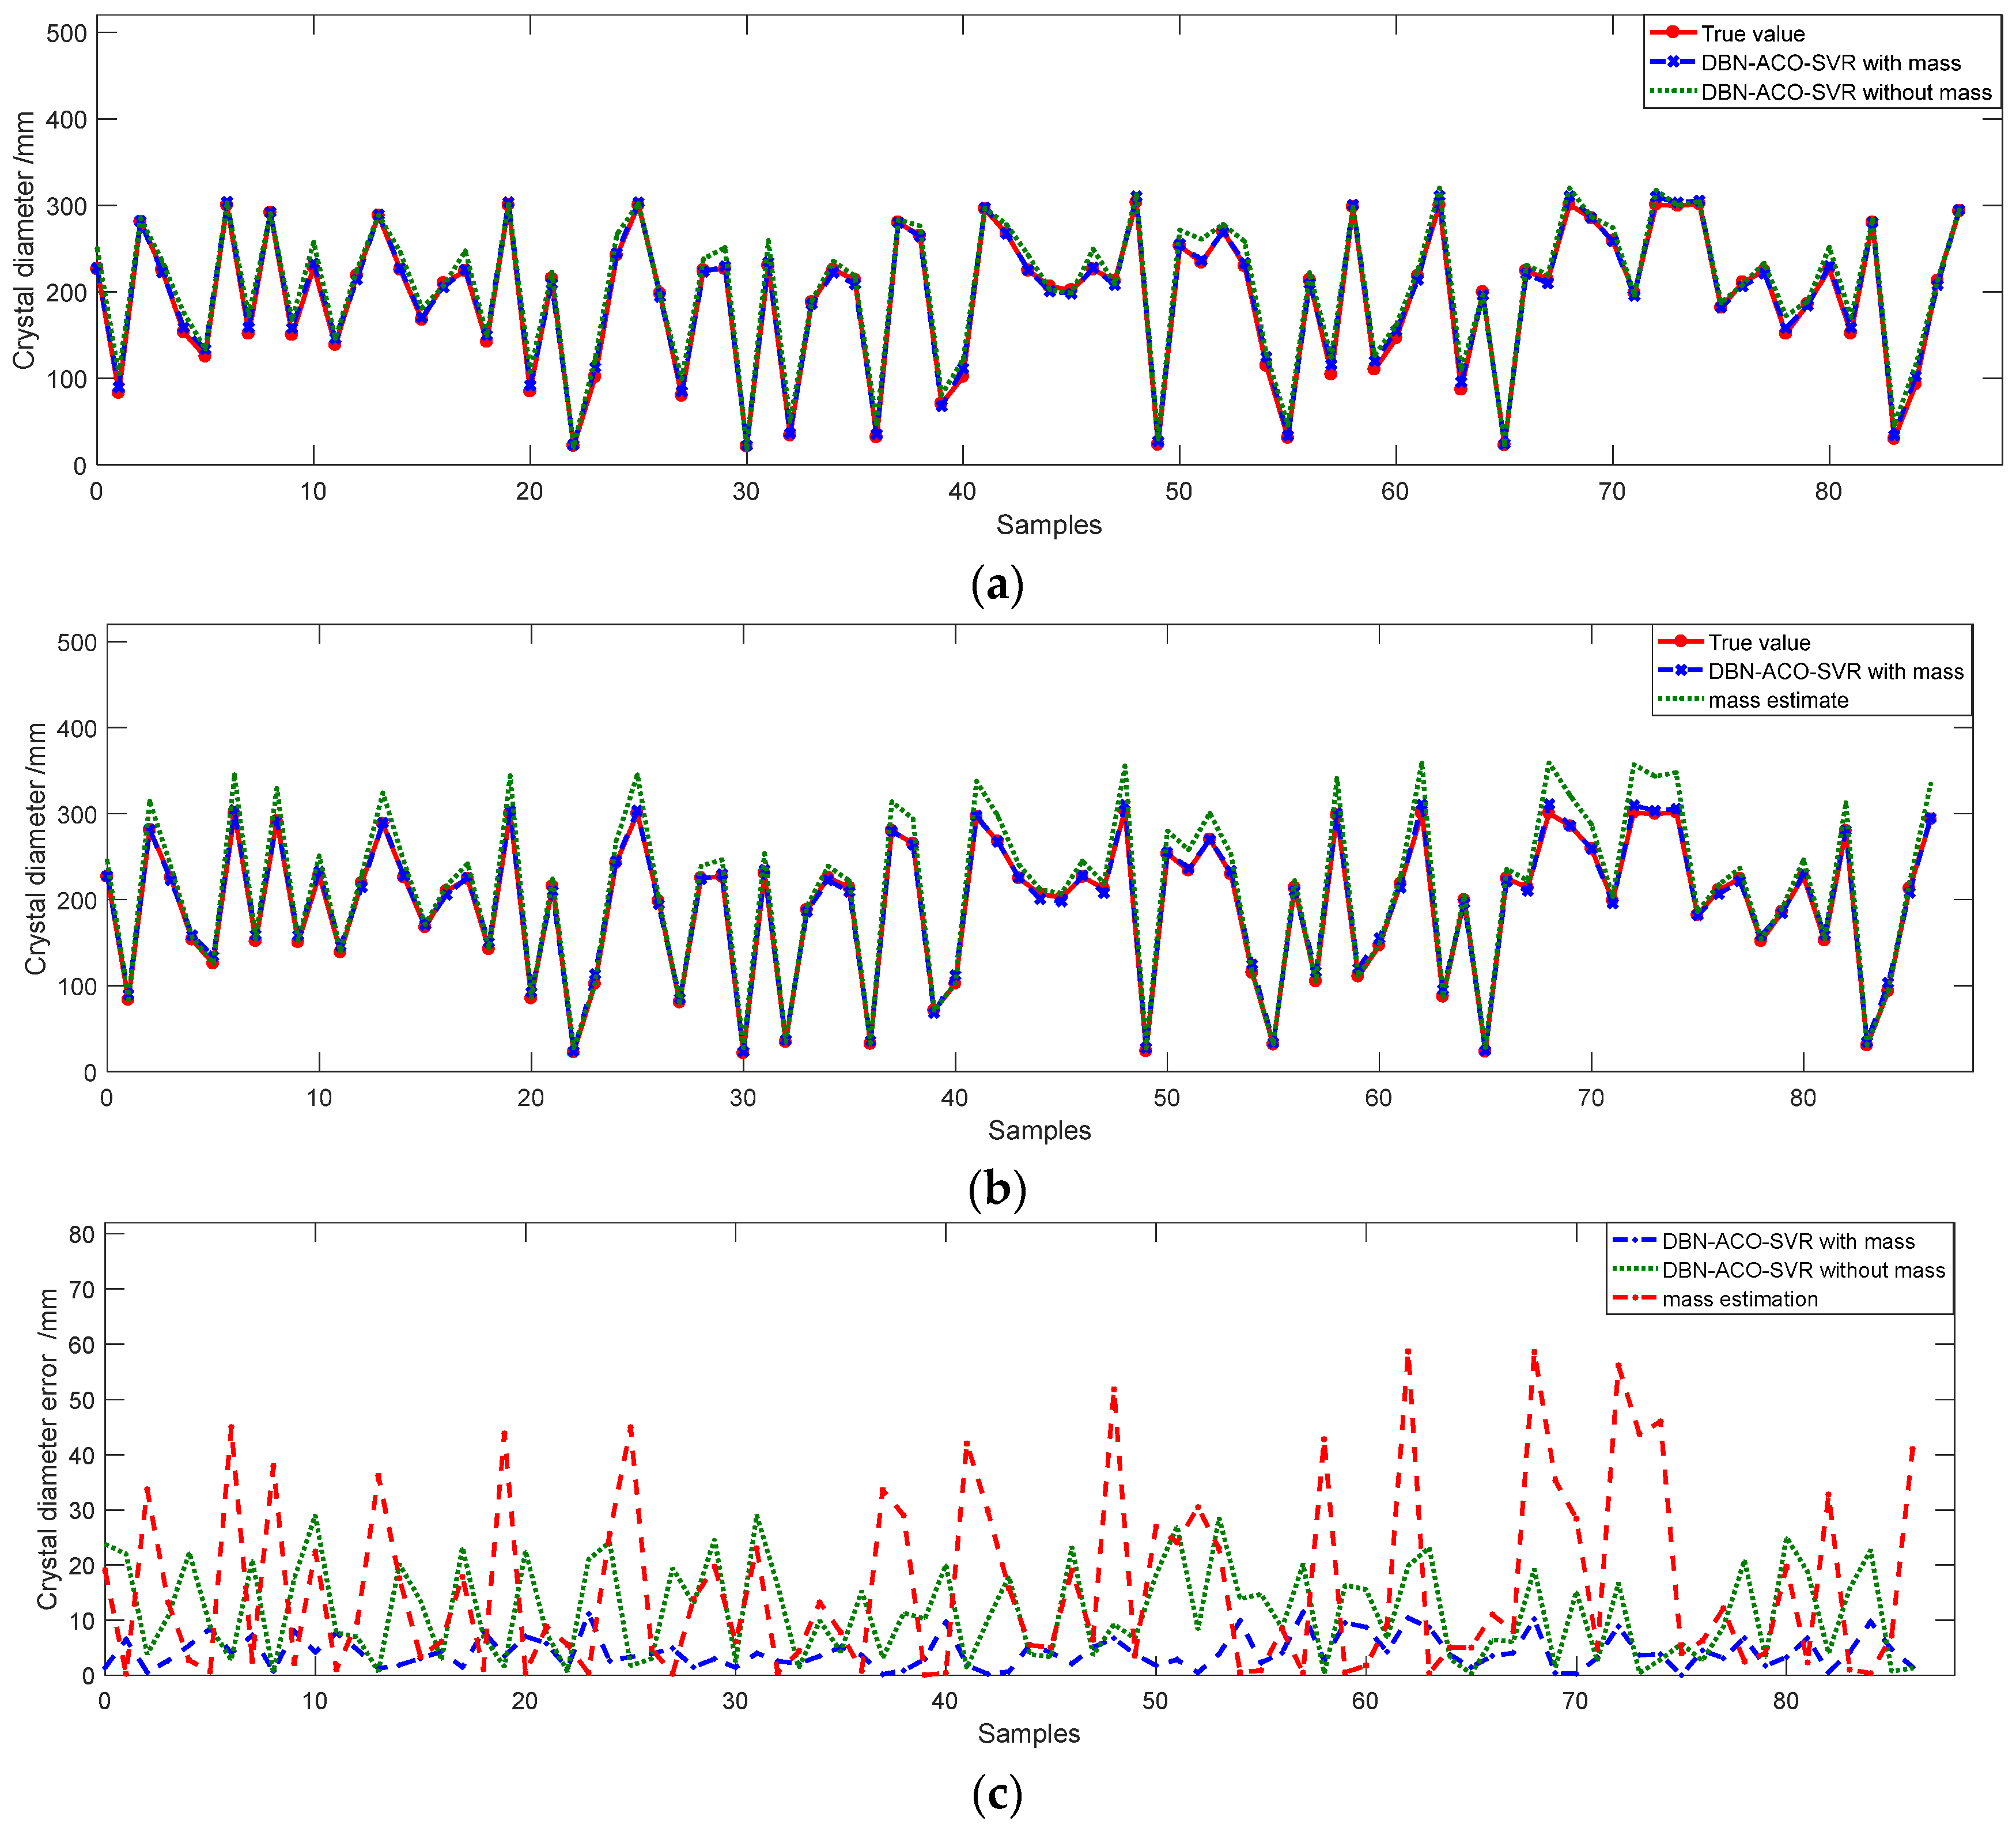
Figure 12, this paper uses the dataset with the same basic processing parameters for prediction. For the results of mass estimation, the predicted results deviate significantly from the actual results. The maximum error is tens of millimeters. One reason is that mass data are affected by changes in motor torque while reflecting changes in crystal mass. Another reason is that the accuracy of the weighing signal is also restricted by the accuracy and sensitivity of the weighing sensor itself.
In
Figure 12, we establish a prediction model with mass input and a prediction model without mass input. The same dataset is used for network training at the same time. Then, we use the trained network model to predict the crystal tail diameter. The effect diagram and error diagram between the two prediction results and the real value are shown in
Figure 12. By comparing the results of two prediction models, the method DBN-ACO-SVR considers the weighing signal, which can significantly reduce the prediction error, which is less than 10 mm. It can be used for the prediction and control of the tail process.
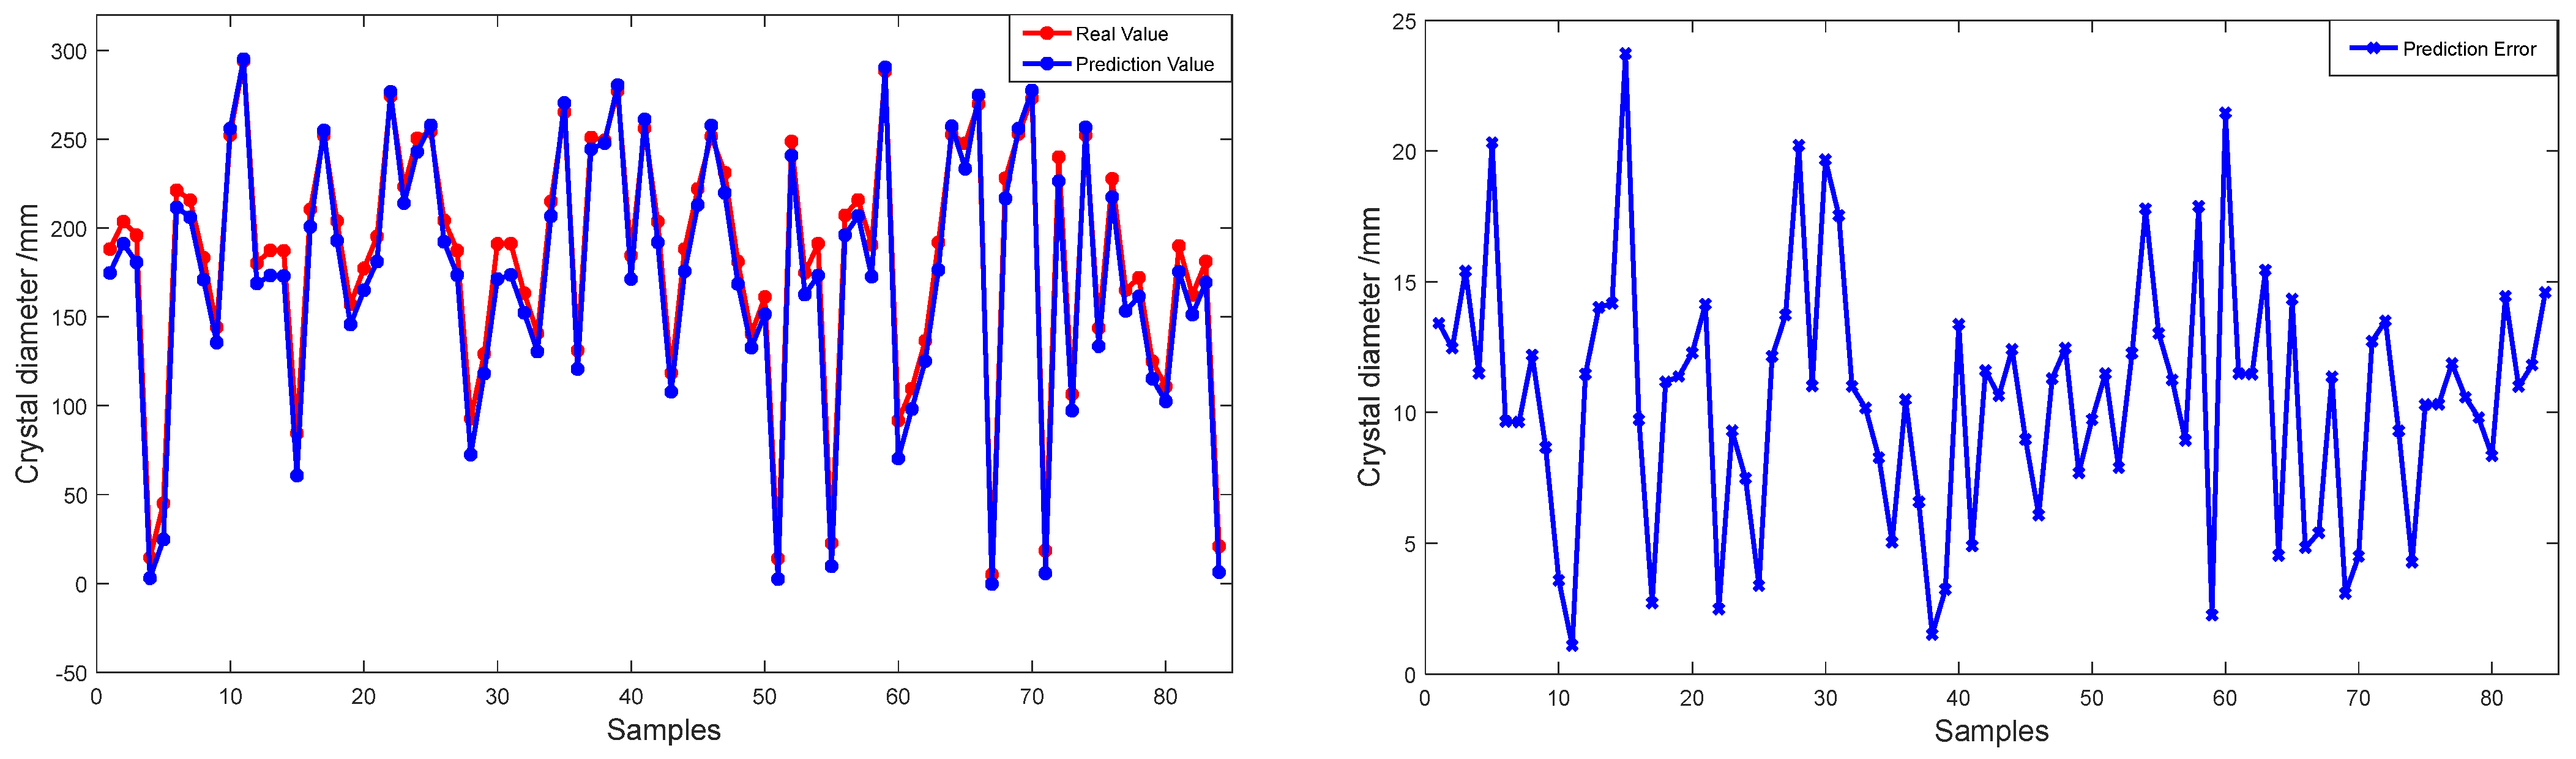
For the results in
Figure 13, the training set and test set used in this paper are not only different in control processing parameters, but also different in some basic processing parameters. Because the difference of basic processing parameters is not reflected in the prediction model, the prediction results become worse, which is still smaller than the error of directly using the mass signal to predict the tail diameter. The results show that the DBN-ACO-SVR prediction model with parameter identification has a low error and better prediction capability.
To better visualize the superior performance of the soft measurement model based on DBN-ACO-SVR in predicting the crystal tail diameter, we compared a soft measurement model combined with DBN and SVR with a DBN-ACO-SVR synthetic model. The test set, according to the changing trend of crystal length, was selected for prediction. The final experimental results based on different models are shown in
Figure 14.
The root mean square error (RMSE) is a common index used to measure the difference between the predicted value and the actual observation value of the model. It calculates the mean value of the square of the difference between the predicted value and the actual value, and then takes its square root to obtain a measure of the overall error. A smaller RMSE value usually indicates that the model has better prediction accuracy, while a larger RMSE value indicates that the prediction performance of the model is poor [
20]. DBN-ACO-SVR, DBN, and SVR were used to predict the tail diameters of crystals in different lots. The RMSE of the predicted results is shown in
Table 1.
The simulation results show that the accuracy of the DBN-ACO-SVR prediction model is better than that of other prediction models, and the model’s prediction accuracy is higher.


