Article

Optimization of Deposition Parameters of SnO2 Particles on Tubular Alumina Substrate for H2 Gas Sensing

1
Department of Materials Science and Engineering, Inha University, Incheon 22212, Republic of Korea
2
Department of Materials Science and Engineering, Shiraz University of Technology, Shiraz 71557-13876, Iran
3
Division of Materials Science and Engineering, Hanyang University, Seoul 04763, Republic of Korea
*
Author to whom correspondence should be addressed.
Appl. Sci. 2024, 14(4), 1567; https://doi.org/10.3390/app14041567
Submission received: 3 January 2024 / Revised: 4 February 2024 / Accepted: 13 February 2024 / Published: 16 February 2024
(This article belongs to the Section Nanotechnology and Applied Nanosciences)

Abstract

:
Resistive gas sensors, which are widely used for the detection of various toxic gases and vapors, can be fabricated in planar and tubular configurations by the deposition of a semiconducting sensing layer over an insulating substrate. However, their deposition parameters are not often optimized to obtain the highest sensing results. Here, we have investigated the effect of deposition variables on the H2 gas sensing performance of commercially available SnO2 particles on tubular alumina substrate. Utilizing a tubular alumina substrate equipped with gold electrodes, we varied the number of deposited layers, rotational speed of the substrate, and number of rotations of the substrate on the output of the deposited sensor in terms of response to H2 gas. Additionally, the effect of annealing temperatures (400, 500, 600, and 700 °C for 1 h) was investigated. According to our findings, the optimal conditions for sensor fabrication to achieve the best performance were the application of one layer of the sensing material on the sensor with ten rotations and a rotation speed of 7 rpm. In addition, annealing at a lower temperature (400 °C) resulted in better sensor performance. The optimized sensor displayed a high response of ~12 to 500 ppm at 300 °C. This study demonstrates the importance of optimization of deposition parameters on tubular substrates to achieve the best gas sensing performance, which should be considered when preparing gas sensors.

1. Introduction

Gases are linked to our lives, and without them, life is impossible. Some gases, like oxygen, are directly related to our lives, while some others are very important to our lives as they are fuel and provide energy for our industrial societies. Hydrogen (H2) is a colorless and odorless gas that serves as a green energy source with unique features such as cleanliness, abundance, and recyclability [1,2]. Nevertheless, it has a high flame-propagation nature, an explosive nature in the range of 5–75%, low ignition energy, and high combustion energy heat [3,4,5,6]. Furthermore, it has a small kinetic diameter and can easily diffuse into different environments. Therefore, during its storage and transportation, leakage may occur which can lead to explosions and disasters owing to its high explosive nature. Apart from its explosive nature, H2 is considered a biomarker for the early diagnosis of some diseases. In fact, the human exhaled breath contains some vapors and gases whose presence or change in concentration indicate the existence of a disease. Thus, by analyzing human exhaled breath using sensitive devices, it is possible to predict the presence of some diseases [7]. Accordingly, the analysis of H2 gas in exhaled breath could provide valuable information on the movement of intestinal food residues or the presence of malabsorption after meals. Also, it can be useful for evaluating the intestinal circumstances, especially in patients with small bowel pseudo-obstruction and malabsorption [8]. Hence, the reliable detection of H2 is important from both safety and health perspectives.
Gas sensors are sensitive electronic devices which can detect the presence of a gas by generating an electrical signal. There are different gas sensors which work based on different principles. In particular, there are different gas sensors for the detection of H2 gas, including electrochemical [9], surface acoustic wave [10], optical [11], gasochromic [12], and resistive [13]. Each sensor type has its own unique advantages and disadvantages. Among them, resistive gas sensors are highly popular owing to their unique advantages, such as high sensitivity, high stability, fast dynamics, simple design, simple operation, and low cost [14]. Even though they can be fabricated from different types of semiconducting materials, they are generally fabricated from semiconducting metal oxides, in which their resistances change upon exposure to target gases. Depending on the nature of the target gas and sensing material, the resistance can increase or decrease upon exposure to gas. Generally, n-type metal oxides are preferred to p-type ones, owing to their higher mobility of charge carriers [15]. N-type stannic oxide (SnO2) with a band gap of 3.6 eV is widely utilized in gas-sensing applications, because of the high mobility of charge carriers, ease of synthesis, excellent stability, high availability, and low cost [16,17]. Accordingly, SnO2-based gas sensors have been extensively used for the detection of H2 gas in the literature [18,19,20,21,22].
There are two general types of sensor configurations for realizing resistive gas sensors. In the planar configuration, the sensing layer is coated on a flat substrate equipped with interdigitated electrodes [23]. In addition, a microheater is generally applied to the back side of the substrate [23]. In tubular gas sensors, the sensing material is coated onto a tubular substrate which is generally alumina equipped with electrodes [24]. In addition, in this configuration, the sensor is heated by applying voltage to a highly resistive nichrome wire which is inserted into an alumina tube [25]. Tubular substrates have advantages such as ease of installation on support, ease of heating by applying voltage on nichrome wires inside them and a simple coating of the sensing layer over them.
Generally, in the tubular configuration of gas sensors, alumina [26], and in the planar configuration, alumina or SiO2-deposited Si substrates [27], are utilized as substrates. In particular, alumina, with its low price and good electrical insulation, has unique features like good thermal conductivity, low thermal expansion coefficient, high melting point, and high mechanical strength, which are needed to achieve uniform temperature distribution in the sensing area and to prevent mechanical failure by thermal shock, and therefore, it is widely used for the realization of tubular gas sensors [28]. Electrodes in both configurations are often fabricated from Au [29], Pt [30], or Pd-Ag [31] noble metals. Recently, flexible/wearable gas sensors have captured a lot of attention due to their high mechanical flexibility in terms of bending, twisting, stretching, and so on, for new applications such as internet of things [32,33]. In flexible/wearable gas sensors, generally a planar configuration is used and flexible substrates such as polyethylene terephthalate (PET), polydimethylsiloxane (PDMS), Polyimide (PI), and paper are used as substrates for this purpose [34,35].
Generally, the effect of deposition parameters on tubular gas sensors is not mentioned in the literature. However, these parameters can significantly affect the sensor output and need to be optimized to have the best sensing performance. Herein, we have attempted to investigate the effect of various parameters, such as the number of deposition layers, rotation speed of the substrate during deposition, and number of rotations of the substrate, on the H2 sensing of commercial SnO2 particles on a tubular substrate. Furthermore, the effect of annealing temperature (400–700 °C for 1 h in air) on the performance of the fabricated sensor was investigated.

2. Materials and Methods

2.1. Material Characterizations

Microstructural and morphological studies were performed utilizing a scanning electron microscope (SEM; Carl Zeiss LIBRA 200 MC, USA, accelerating voltage = 15 kV). X-ray diffraction (XRD, Philips X′ Pert, the Netherlands) was conducted via Cu-Kα1 radiation (λ = 1.5406 Å) in the range of 2θ = 10–90° to study the crystallinity and phase formation of powders. The chemical and valence states of commercial SnO2 particles were investigated with an Al-Kα source (1253.6 eV) via X-ray photoelectron spectroscopy (XPS; Thermo Fisher Scientific, Waltham, MA, USA). The binding energies were corrected by referencing the C 1s line at 284.5 eV.

2.2. Gas Sensor Fabrication and Sensing Measurement

Here, commercial SnO2 powders (sizes ≤ 100 nm, Sigma Aldrich, St. Louis, MO, USA) were employed to realize H2 gas sensors. First, a clean tubular alumina substrate with gold electrodes was fixed on a support (Figure 1a), and by the rotation of the substrate utilizing a small motor, the sensing material was applied to it with the help of a small brush (Figure 1b). The fabricated sensor was placed on a support (Figure 1c), and by applying an external voltage to the heater inside the tubular sensor, it was possible to increase the temperature to the desired values via the Joule heating effect. Synthetic dry air was mixed with the target gases utilizing mass flow controllers (MFCs) at the expected concentrations, and then it was introduced into the gas chamber. To prepare H2 gas with different concentrations of 10, 50, 100, 500, and 1000 ppm, the amounts of dry air and H2 gas were set to 495/5, 475/25, 450/50, 250/250, and 0/500, sccm, respectively, by MFCs. It should be noted that the total gas flow rate was fixed to 500 sccm in all experiments.
Since in resistive gas sensors, variations of the resistance are an important parameter, the resistances of the gas sensors were continuously measured in air (Ra) and in the presence of target gas (Rg) using a Keithley (2400) source meter, and the obtained data were saved to a PC connected to source meter. The sensor response was calculated as R = Ra/Rg. The response time was calculated as the time required for the resistance to achieve a 90% change in the presence of H2 gas, when it was introduced into the gas chamber.

3. Results and Discussion

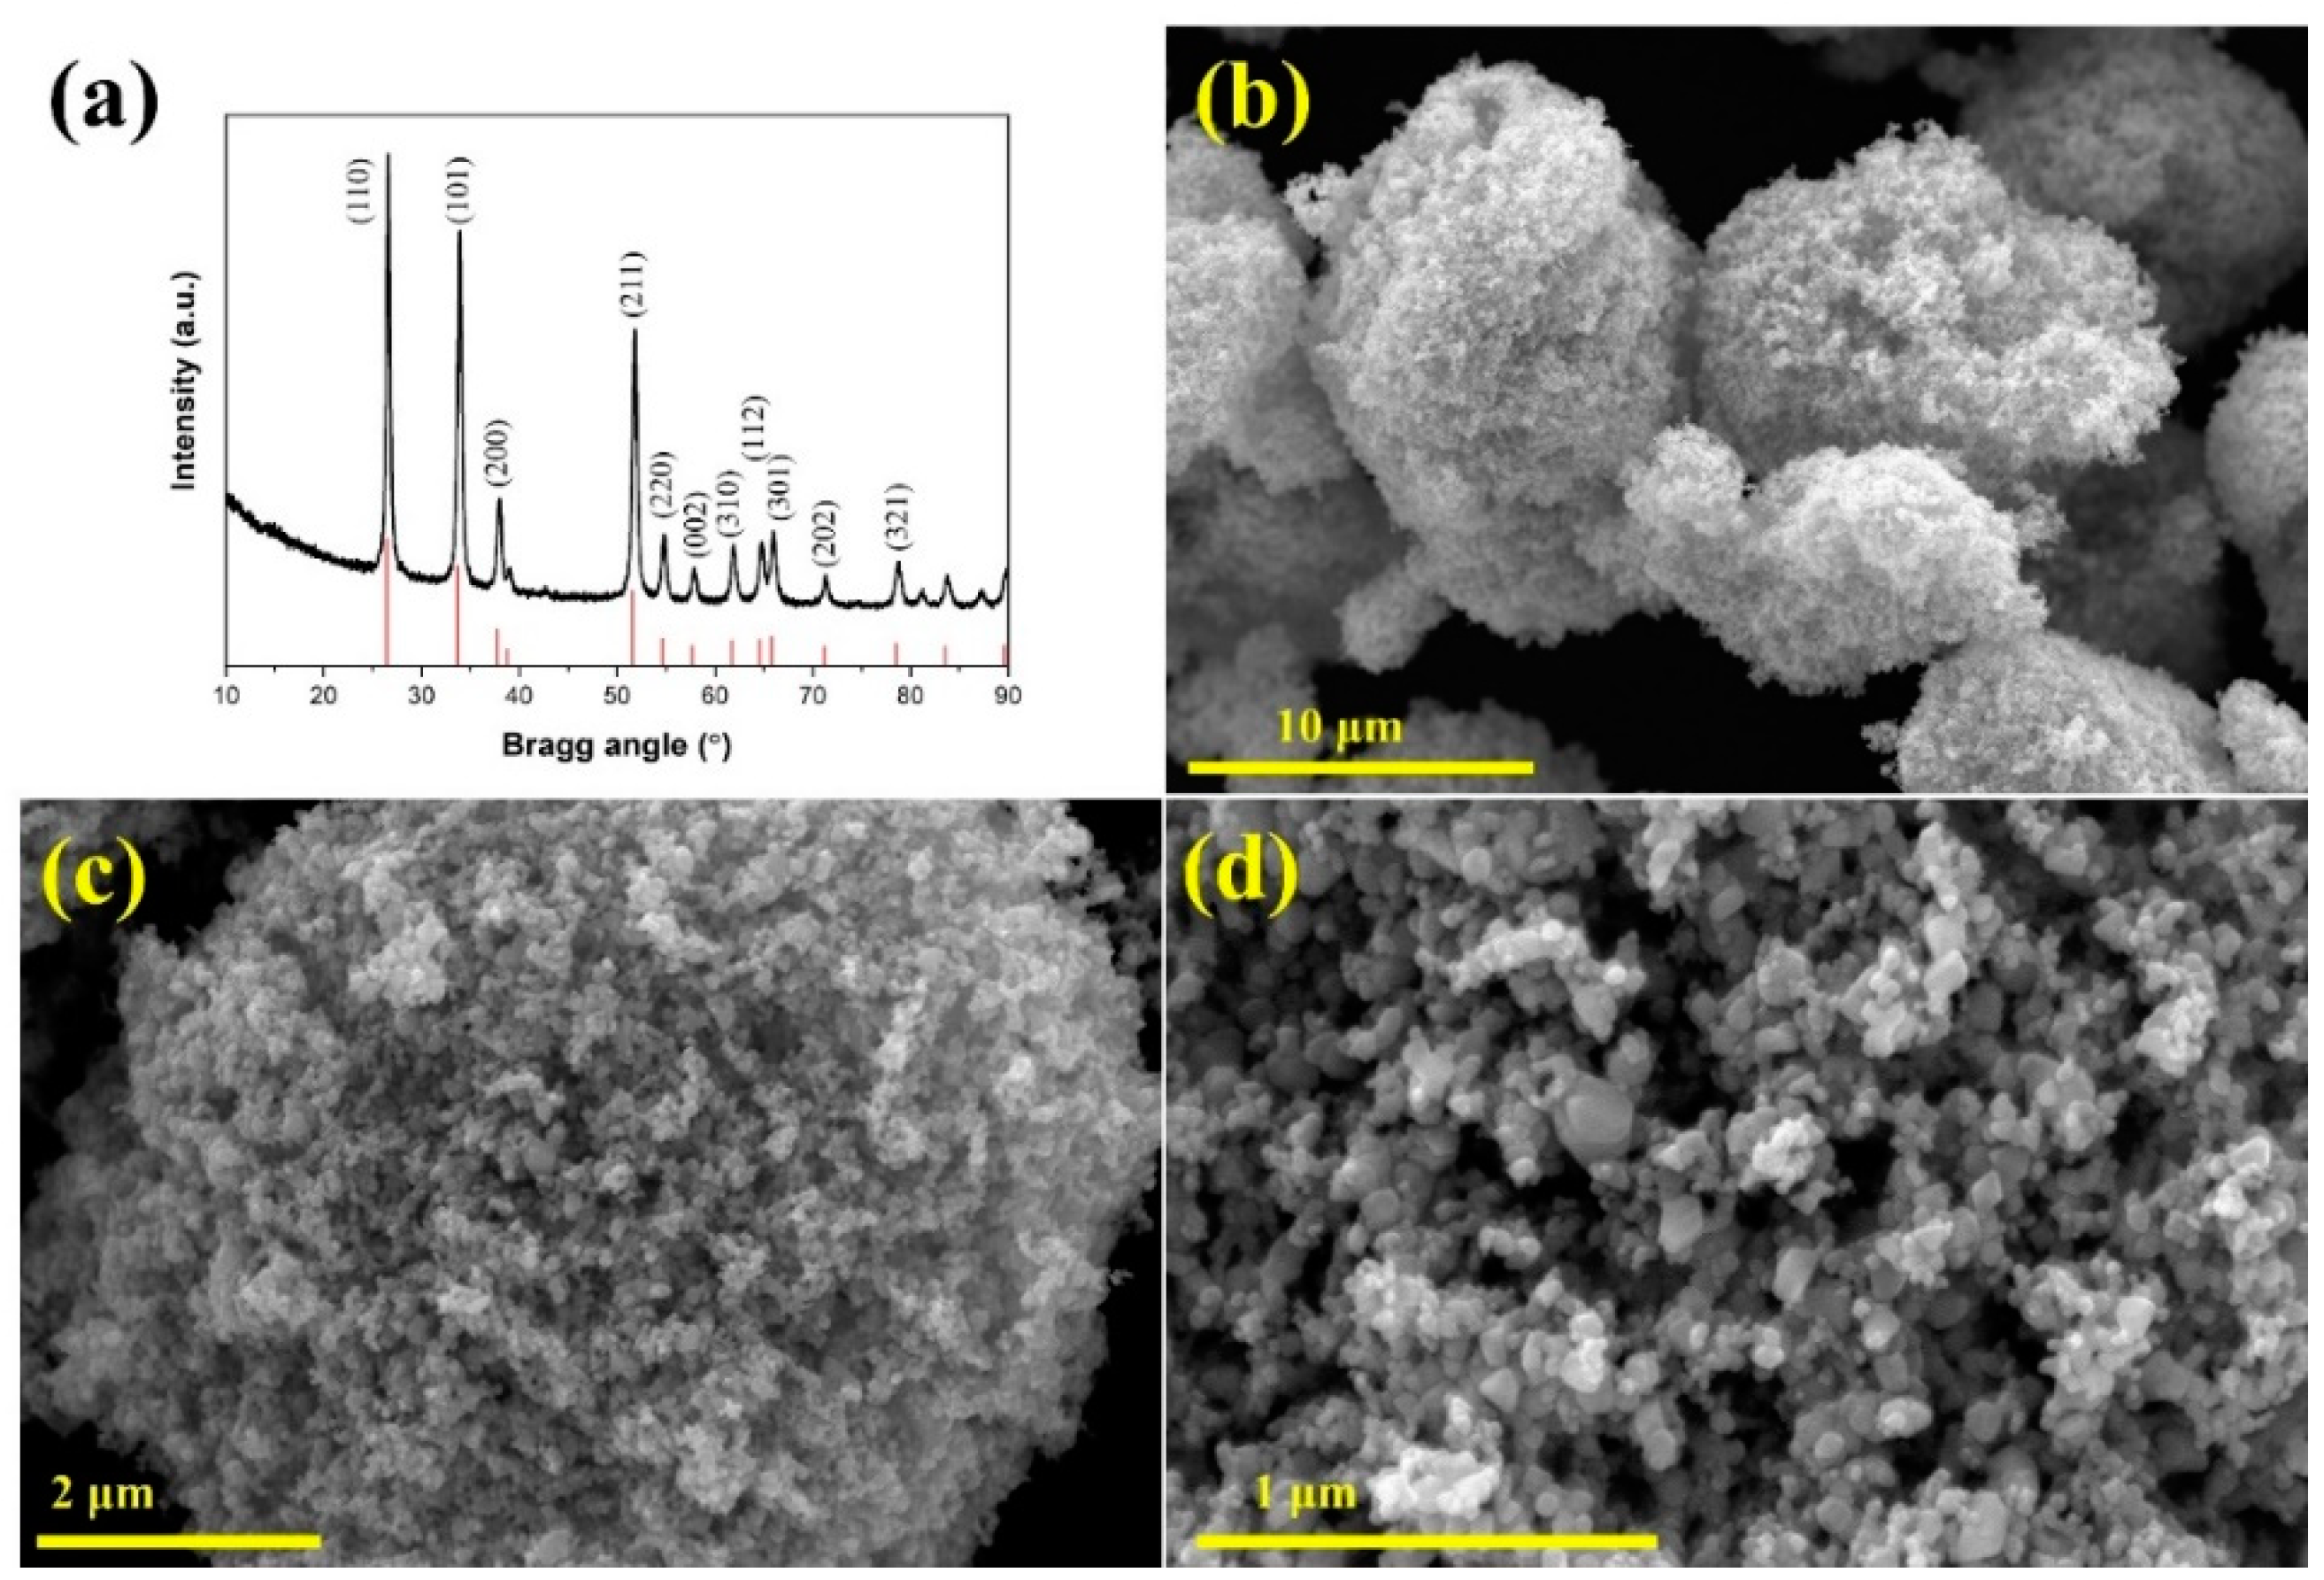
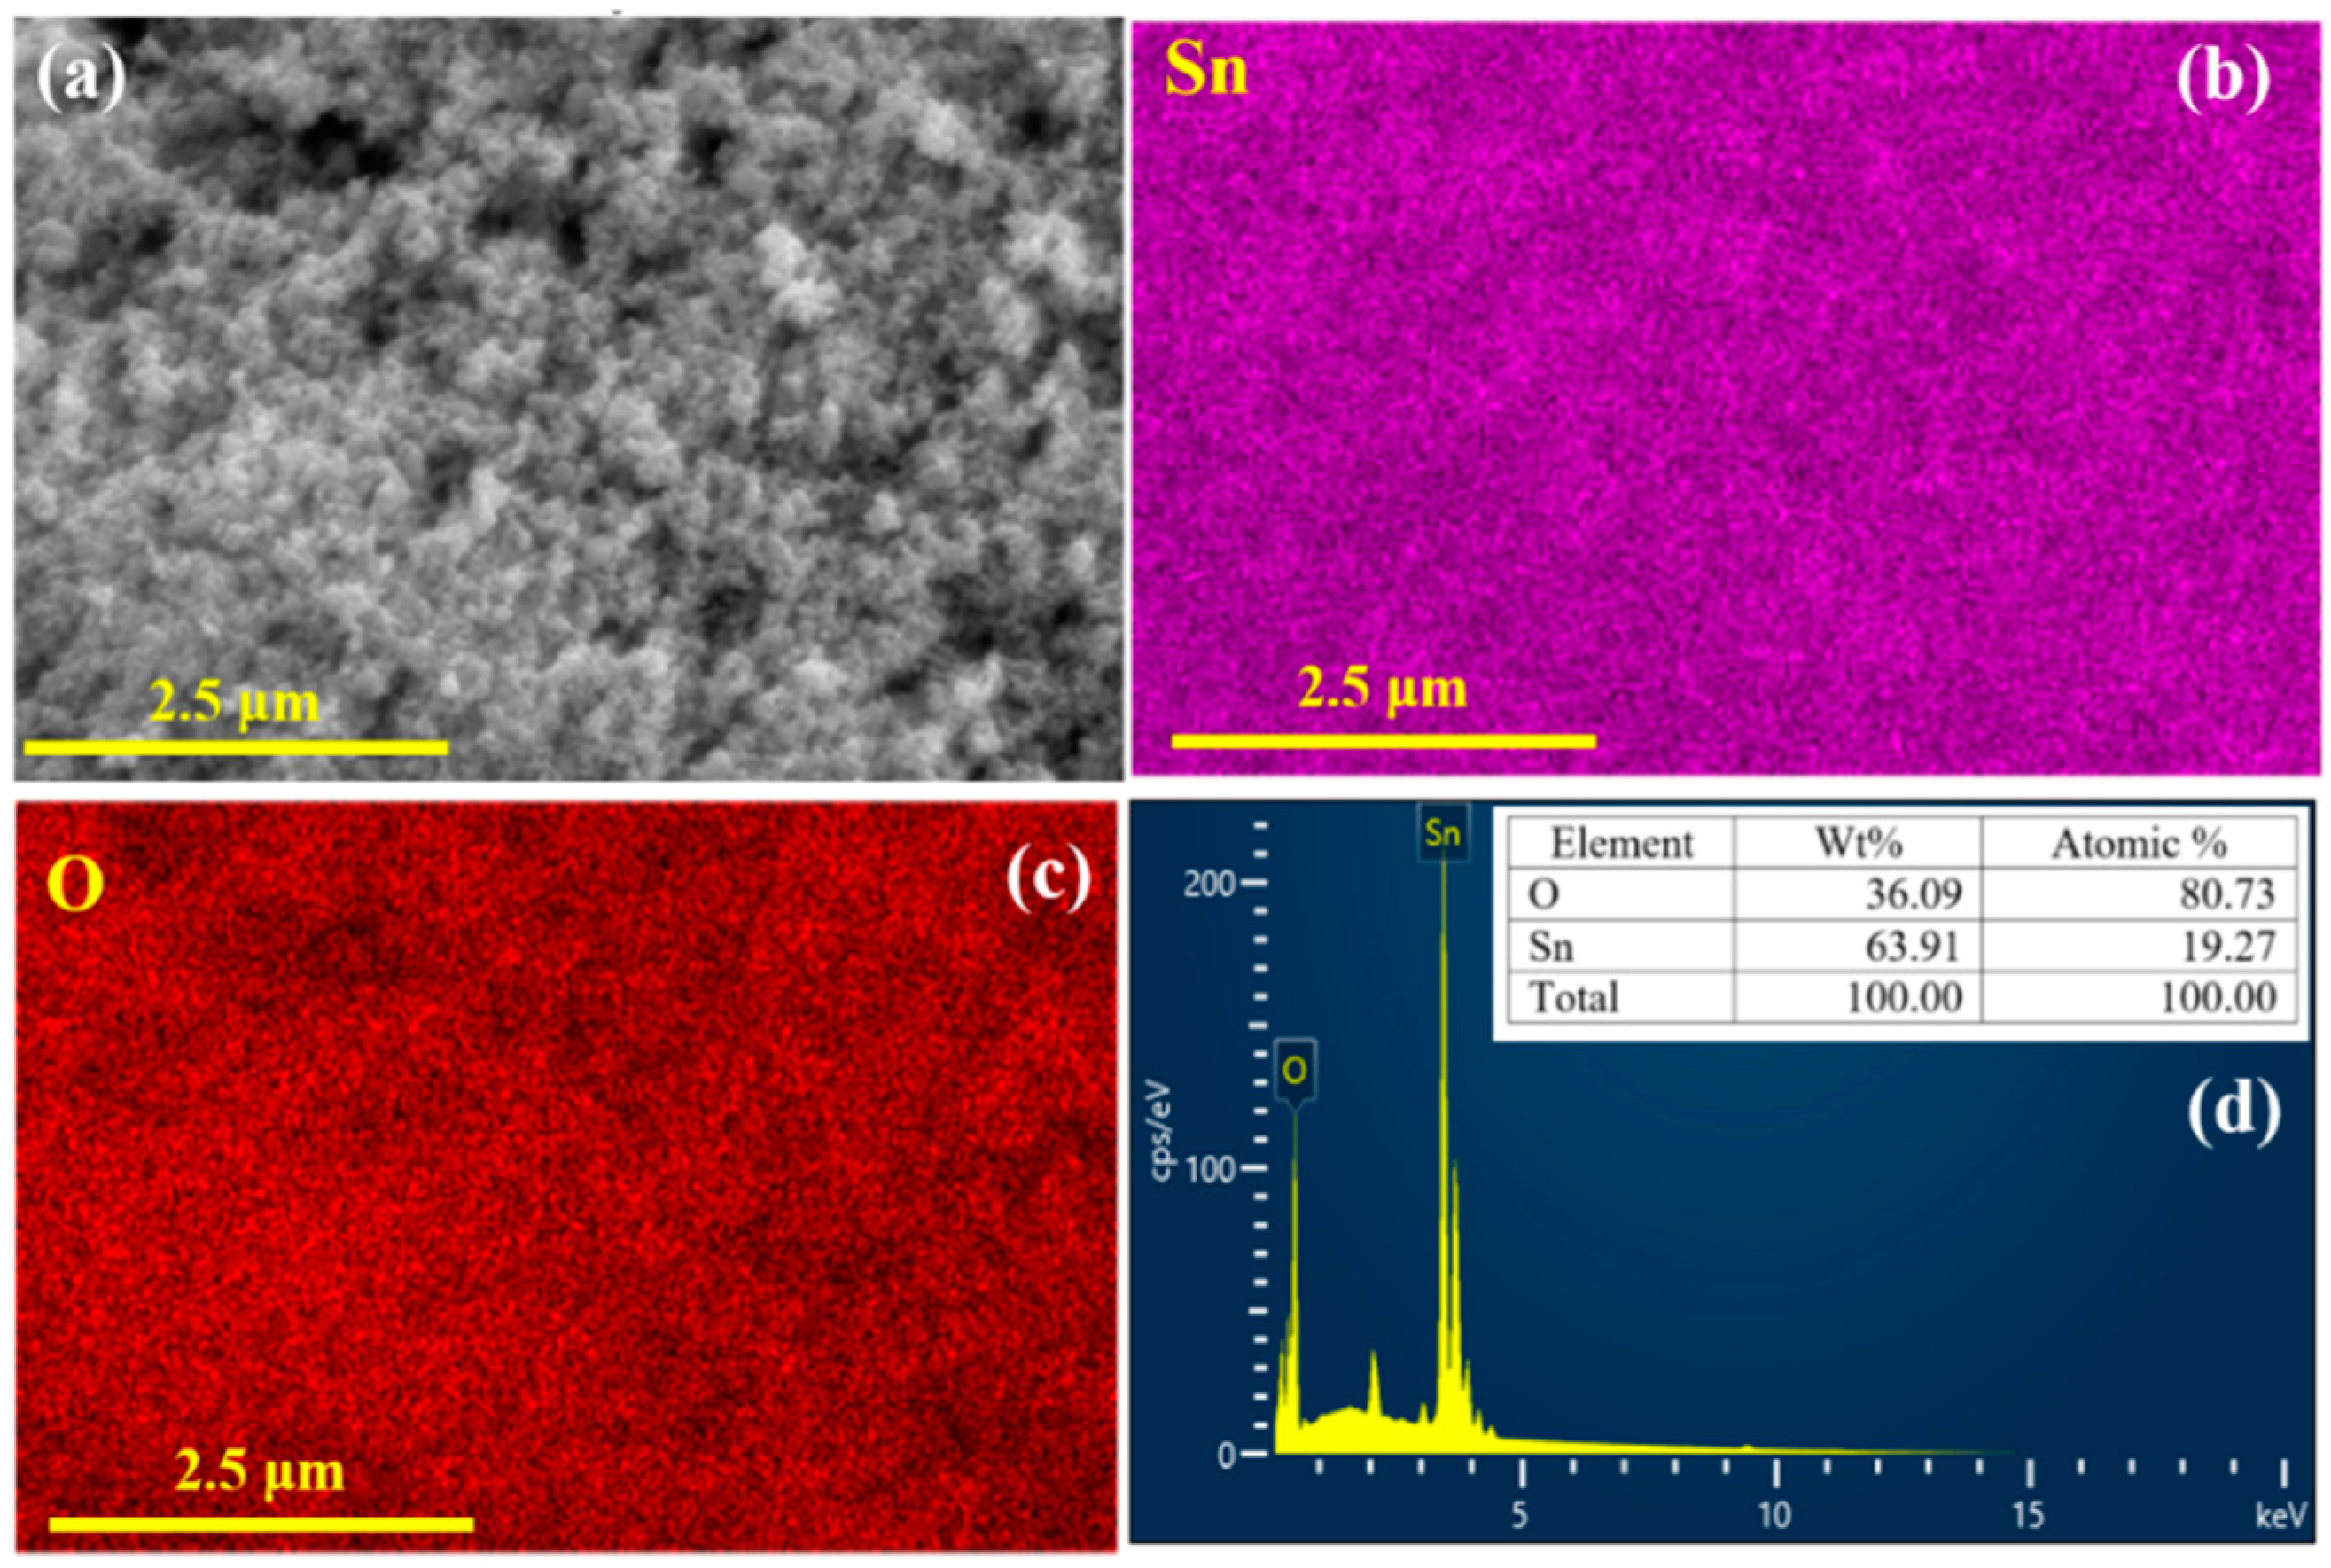
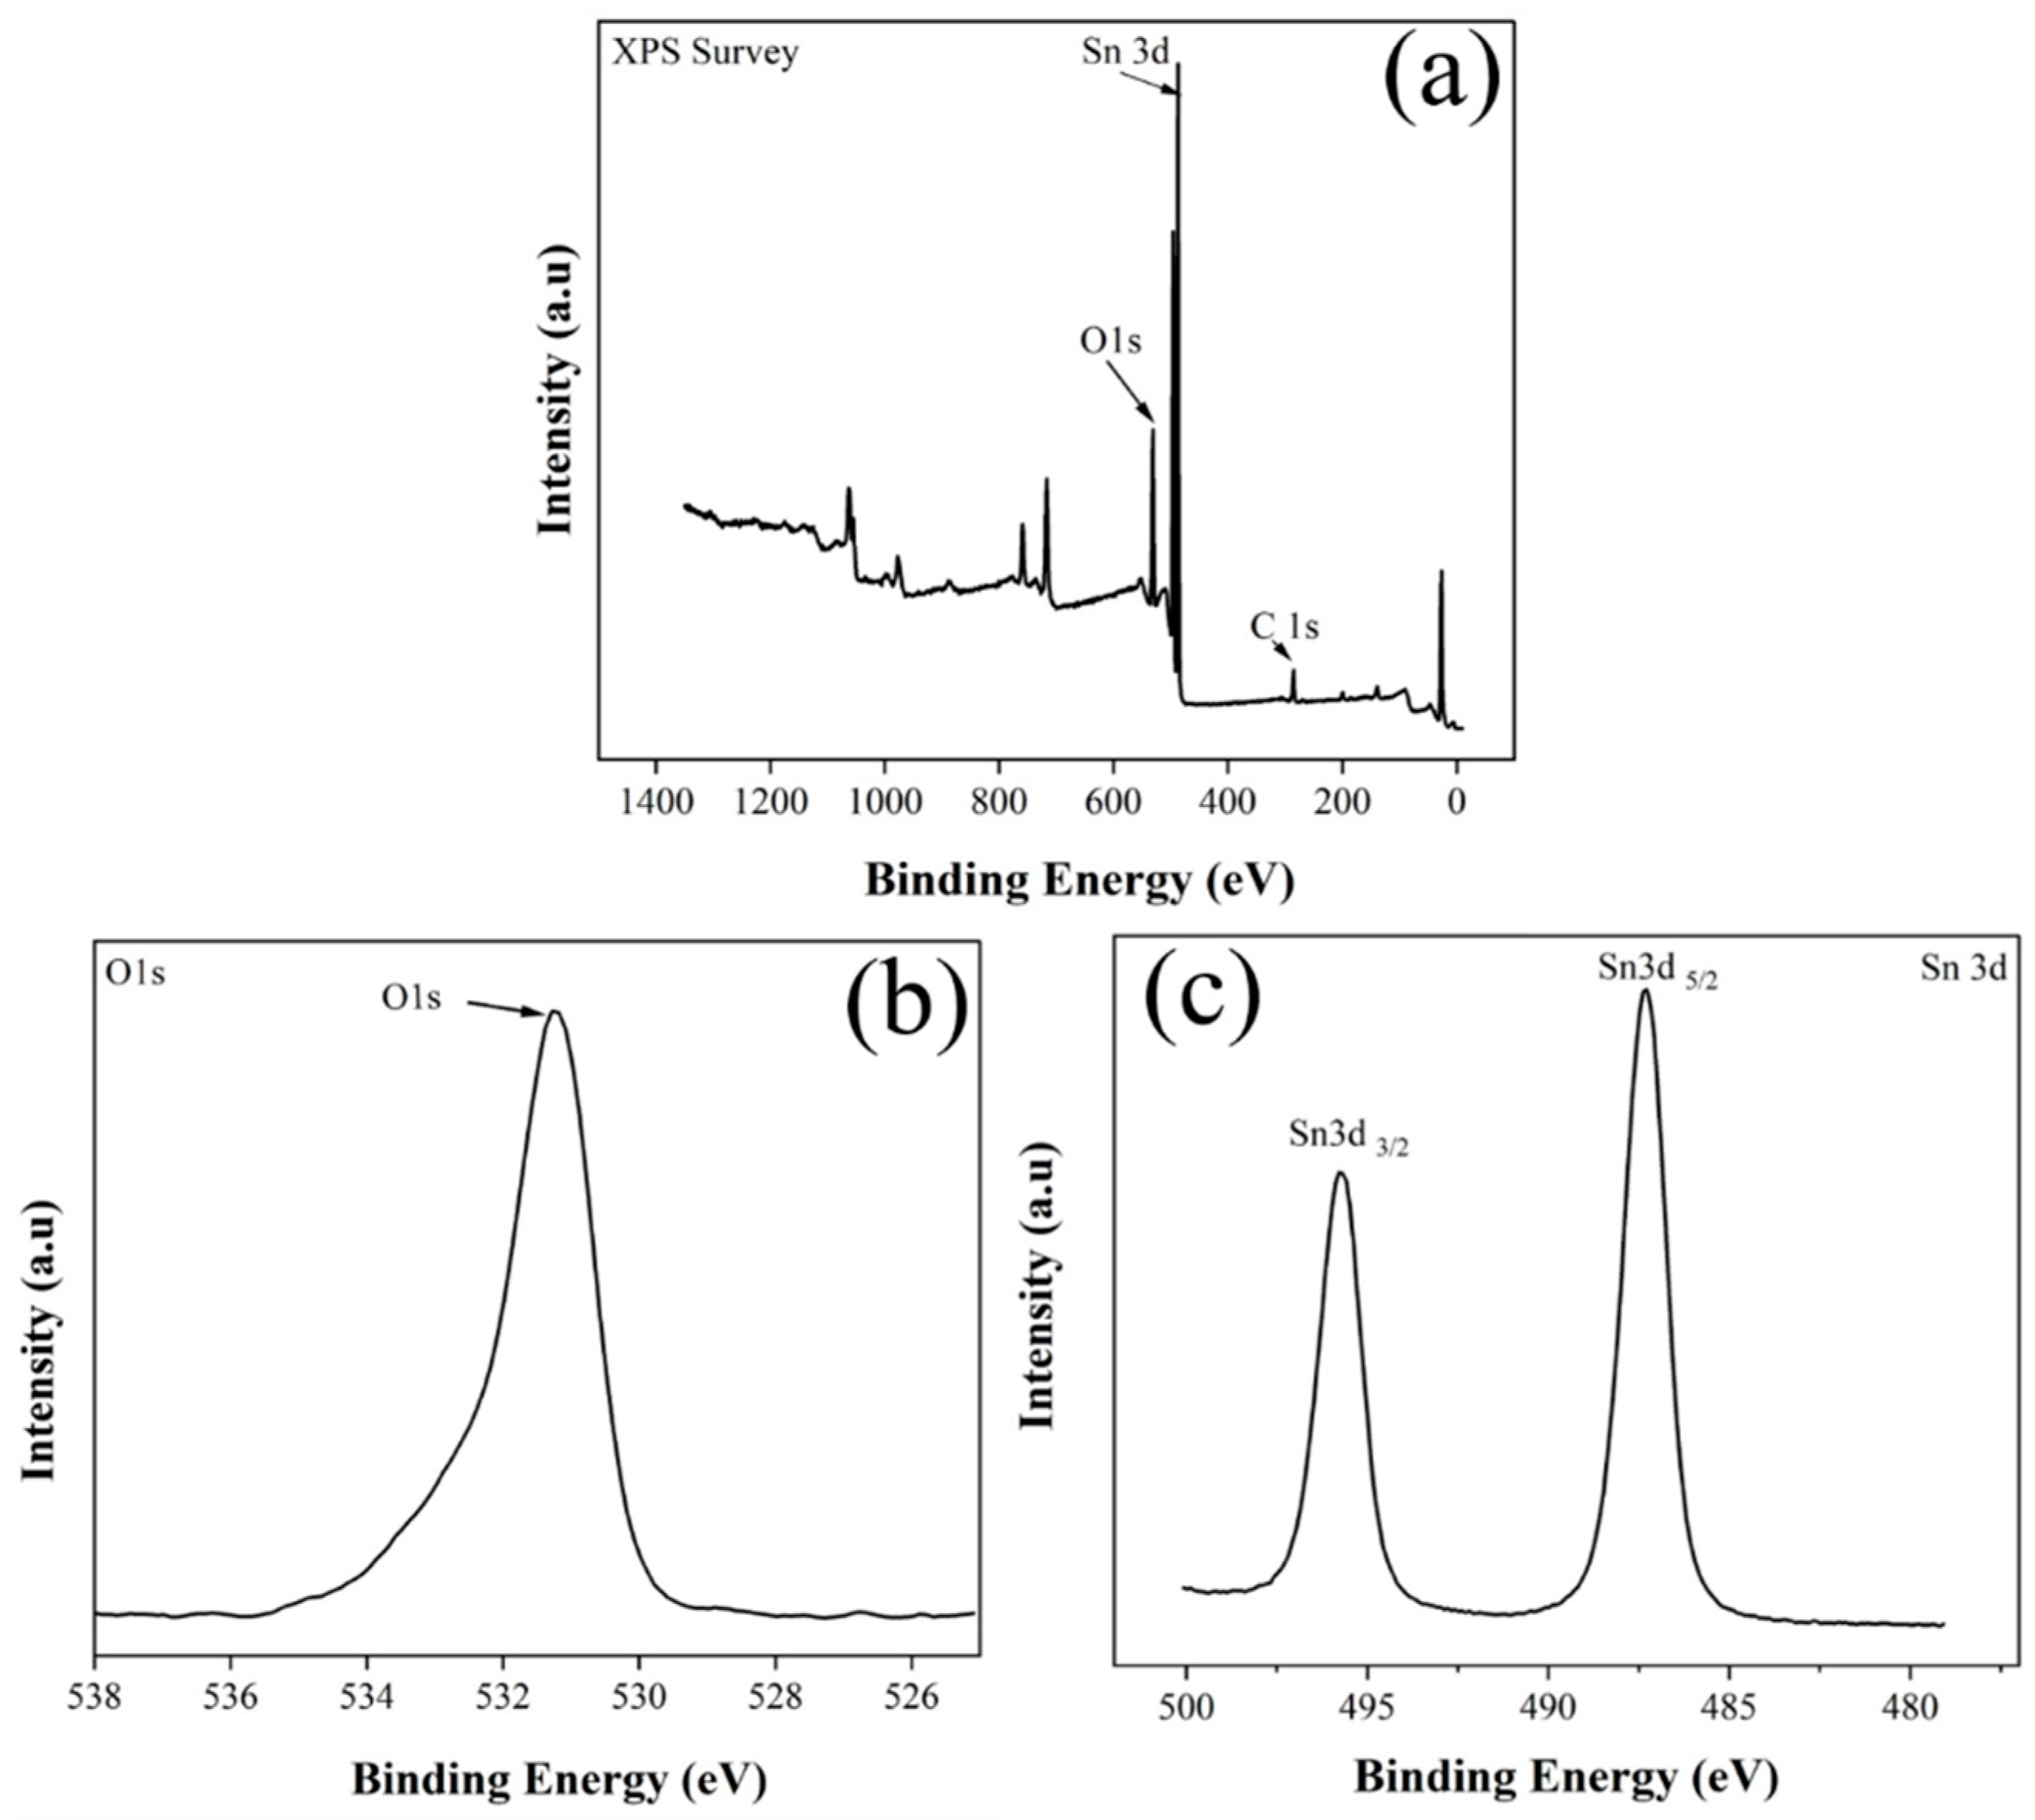
3.1. Characterization Studies

Figure 2 illustrates the XRD pattern of the commercial SnO2 particles. It depicts the peaks related to the crystalline planes of tetragonal SnO2, matching JCPDS Card No. 41-1445 [36]. No peaks related to other phases or impurities were detected, indicating the high purity of the SnO2 particles. Figure 2a–c present SEM images of the SnO2 particles at various magnifications. Overall, they had an almost spherical shape, and the size of the individual particles was approximately 100 nm. However, they were agglomerated into larger particles. The agglomerates were not fully dense, and there were some pores, channels, and voids among the SnO2 particles. Therefore, the target gas can easily diffuse into deep parts of the sensing material, expecting a relatively high response to H2 gas.
Next, the chemical composition of the particles was studied. Figure 3a presents a typical SEM image of the SnO2 particles, and the corresponding SEM-EDS elemental mapping of Sn and O elements is presented in Figure 3b,c, respectively. The mentioned elements were uniformly distributed on whole parts of the SnO2 particles. Furthermore, in Figure 3d, the corresponding SEM-EDS spectrum is presented. The weight percentages of O and Sn elements were 36.09 and 63.91%, respectively. Also, the atomic percentages of the mentioned elements were 80.73 and 19.27%, respectively.
XPS measurements were performed to study the surface composition of the materials and the valence states of the elements up to a depth of 10 nm from the surface. Figure 4a presents the XPS survey of commercial SnO2 particles. The peaks related to Sn and O elements were recorded. In addition, a peak related to carbon (from the environment) was observed. To have a better insight, we also studied the XPS core-level regions of O1s and Sn 3d. Figure 4b presents the O1s XPS core-level region, which exhibits a peak centered at 531 eV related to the presence of lattice oxygen (O2−) in SnO2 [37]. Figure 4c indicates the Sn 3d XPS core level, in which two peaks of Sn 3d5/2 and Sn 3d3/2 are located at 487.5 and 497.5 eV, demonstrating that Sn is in the (IV) valence state [38]. Therefore, based on characterization results, commercial SnO2 particles had almost a spherical morphology and desired crystallinity, without undesired phases and impurities.

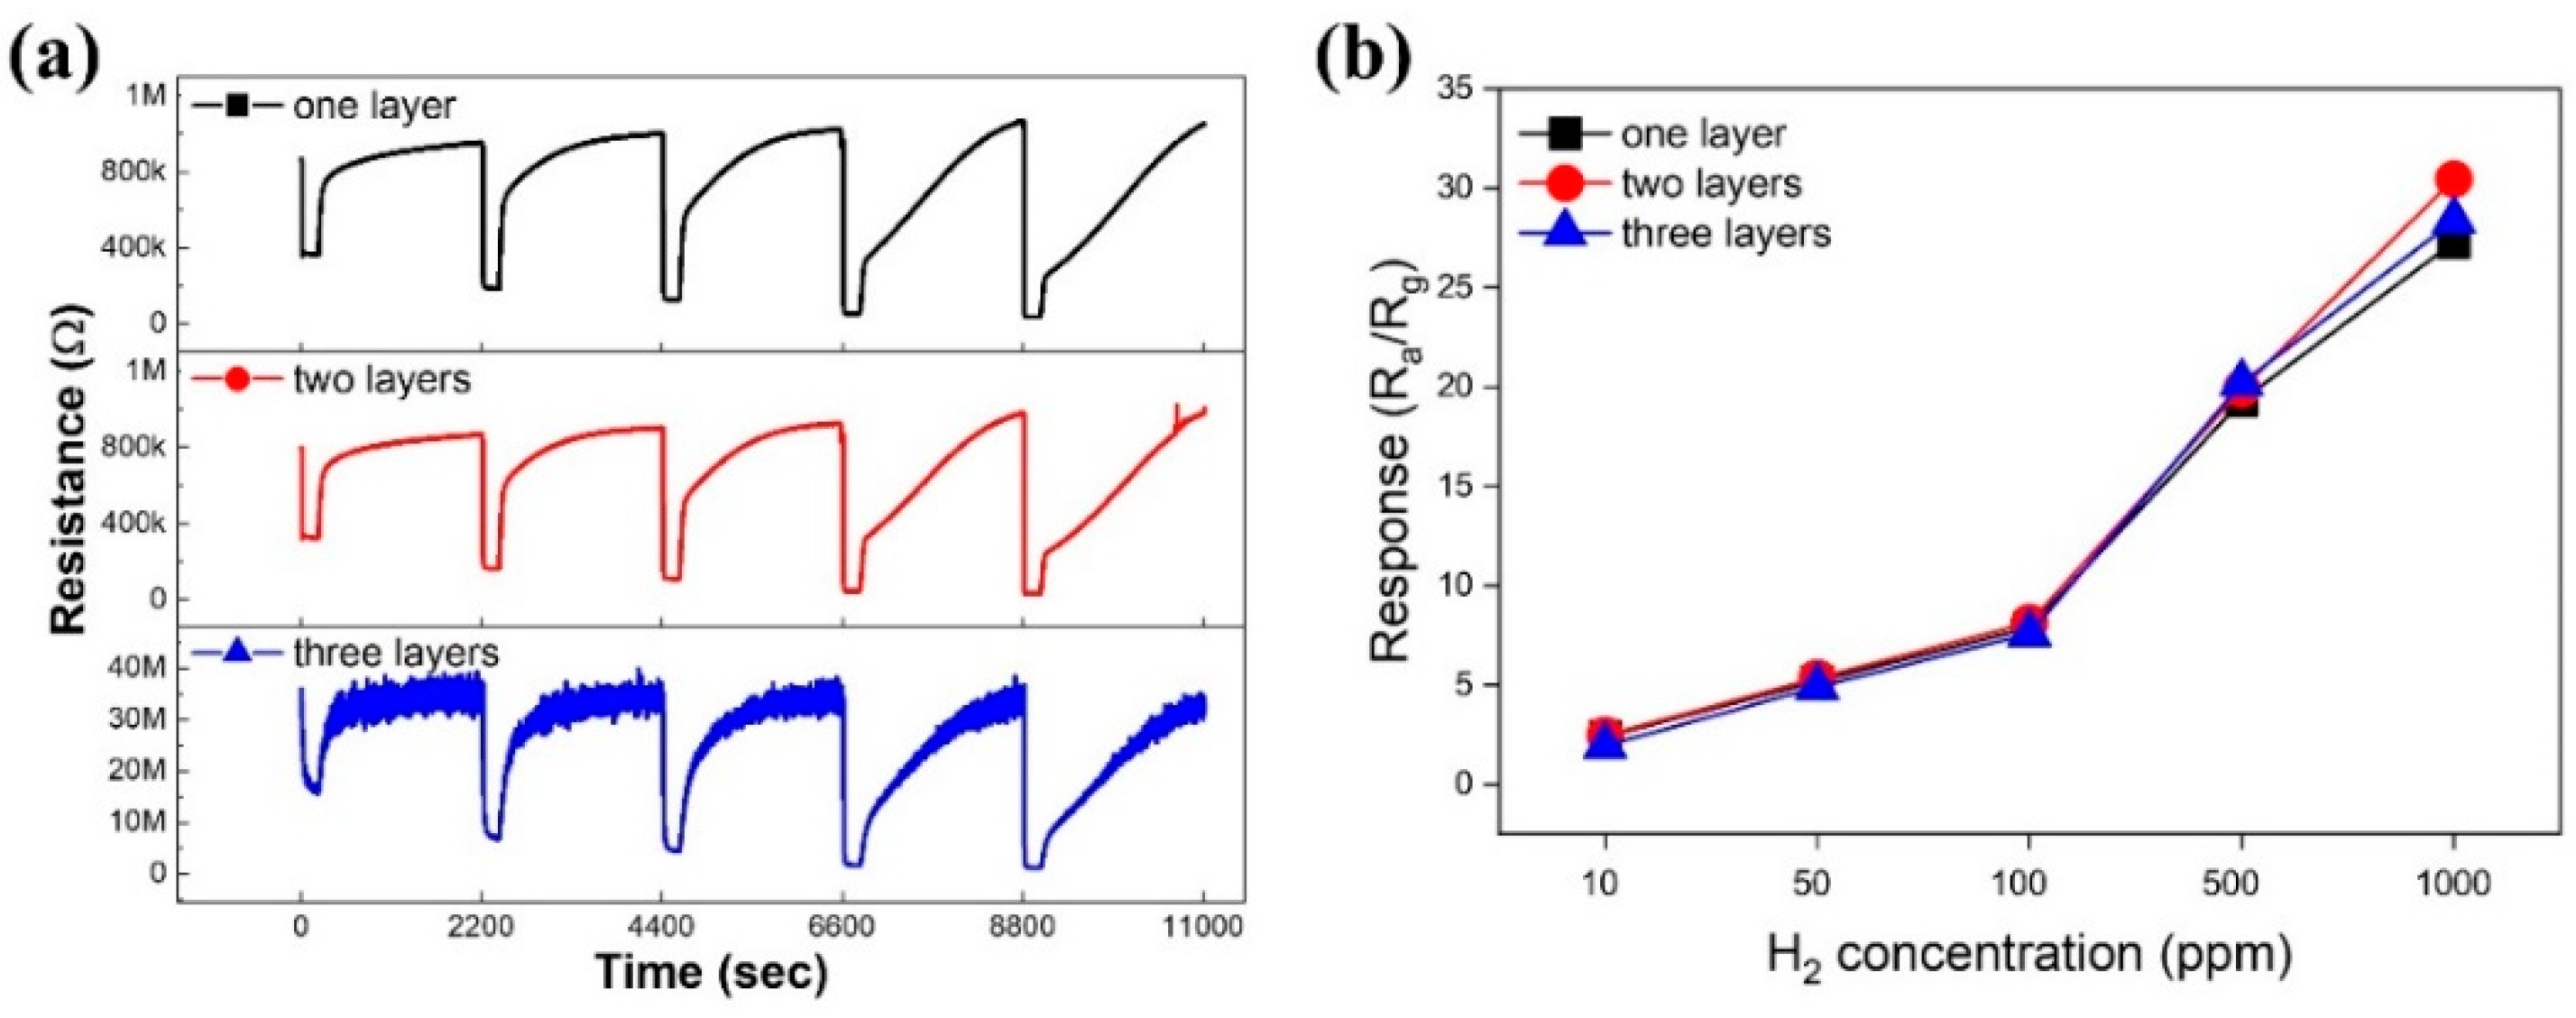
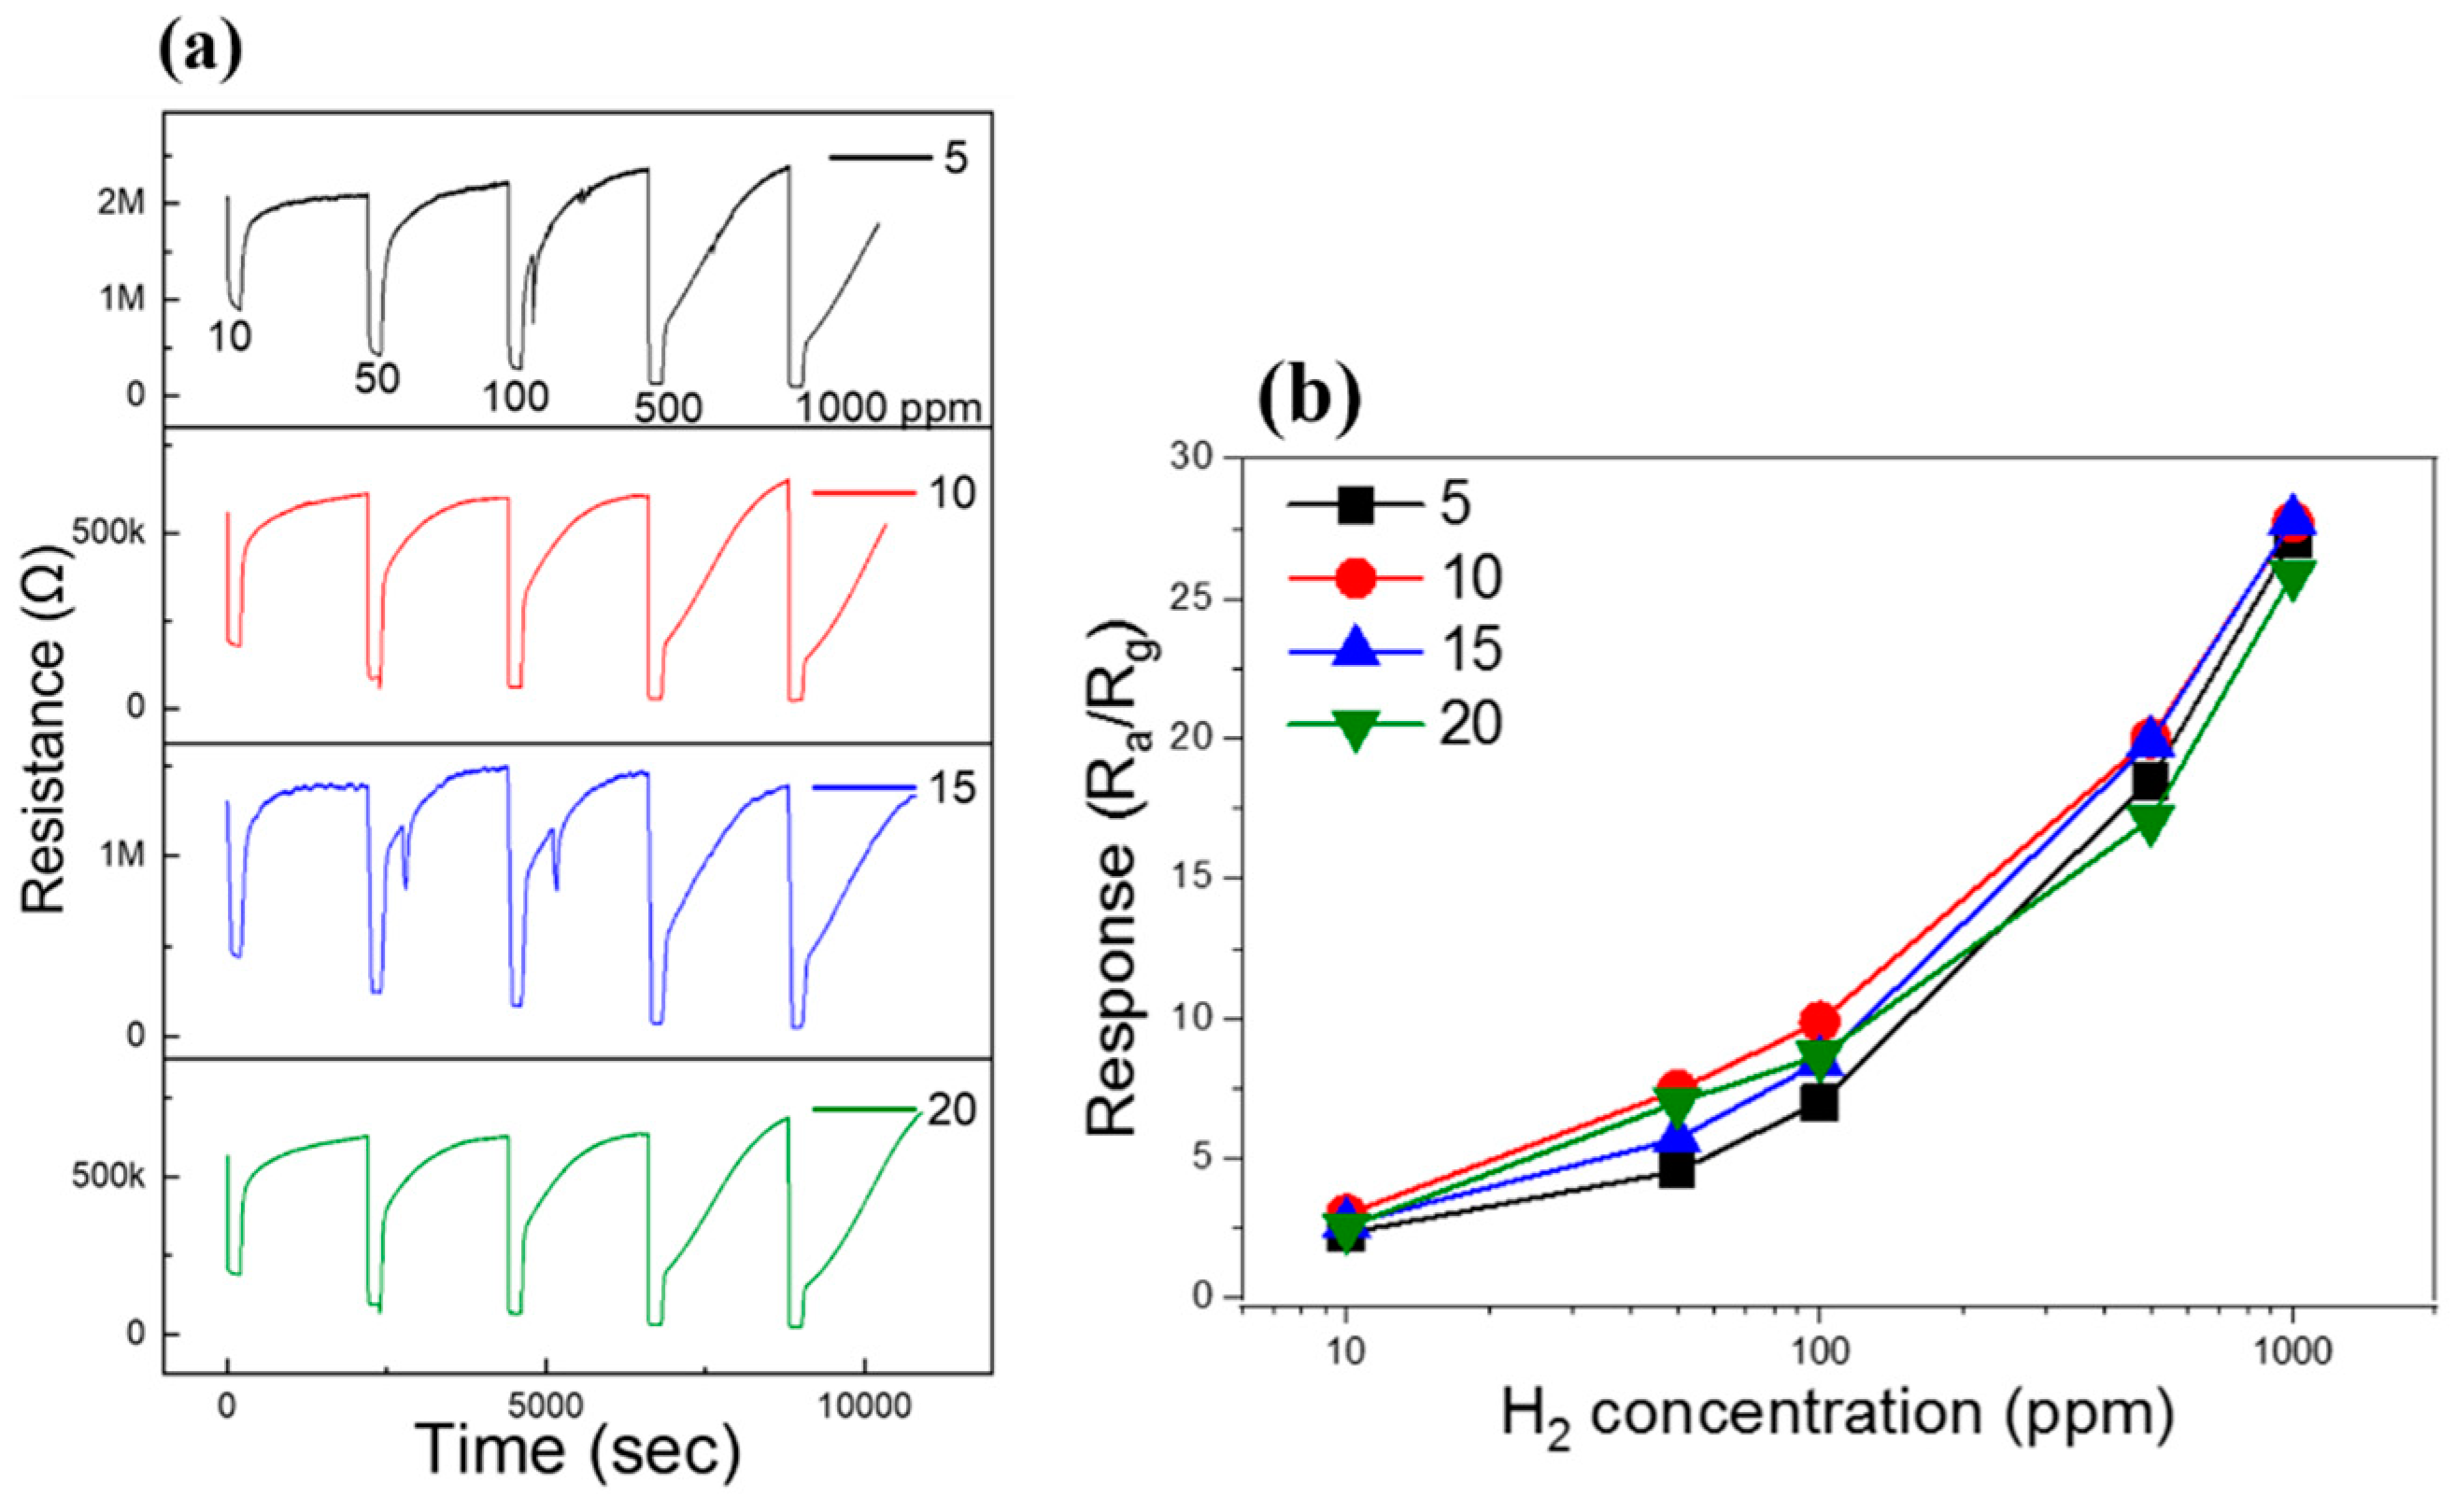
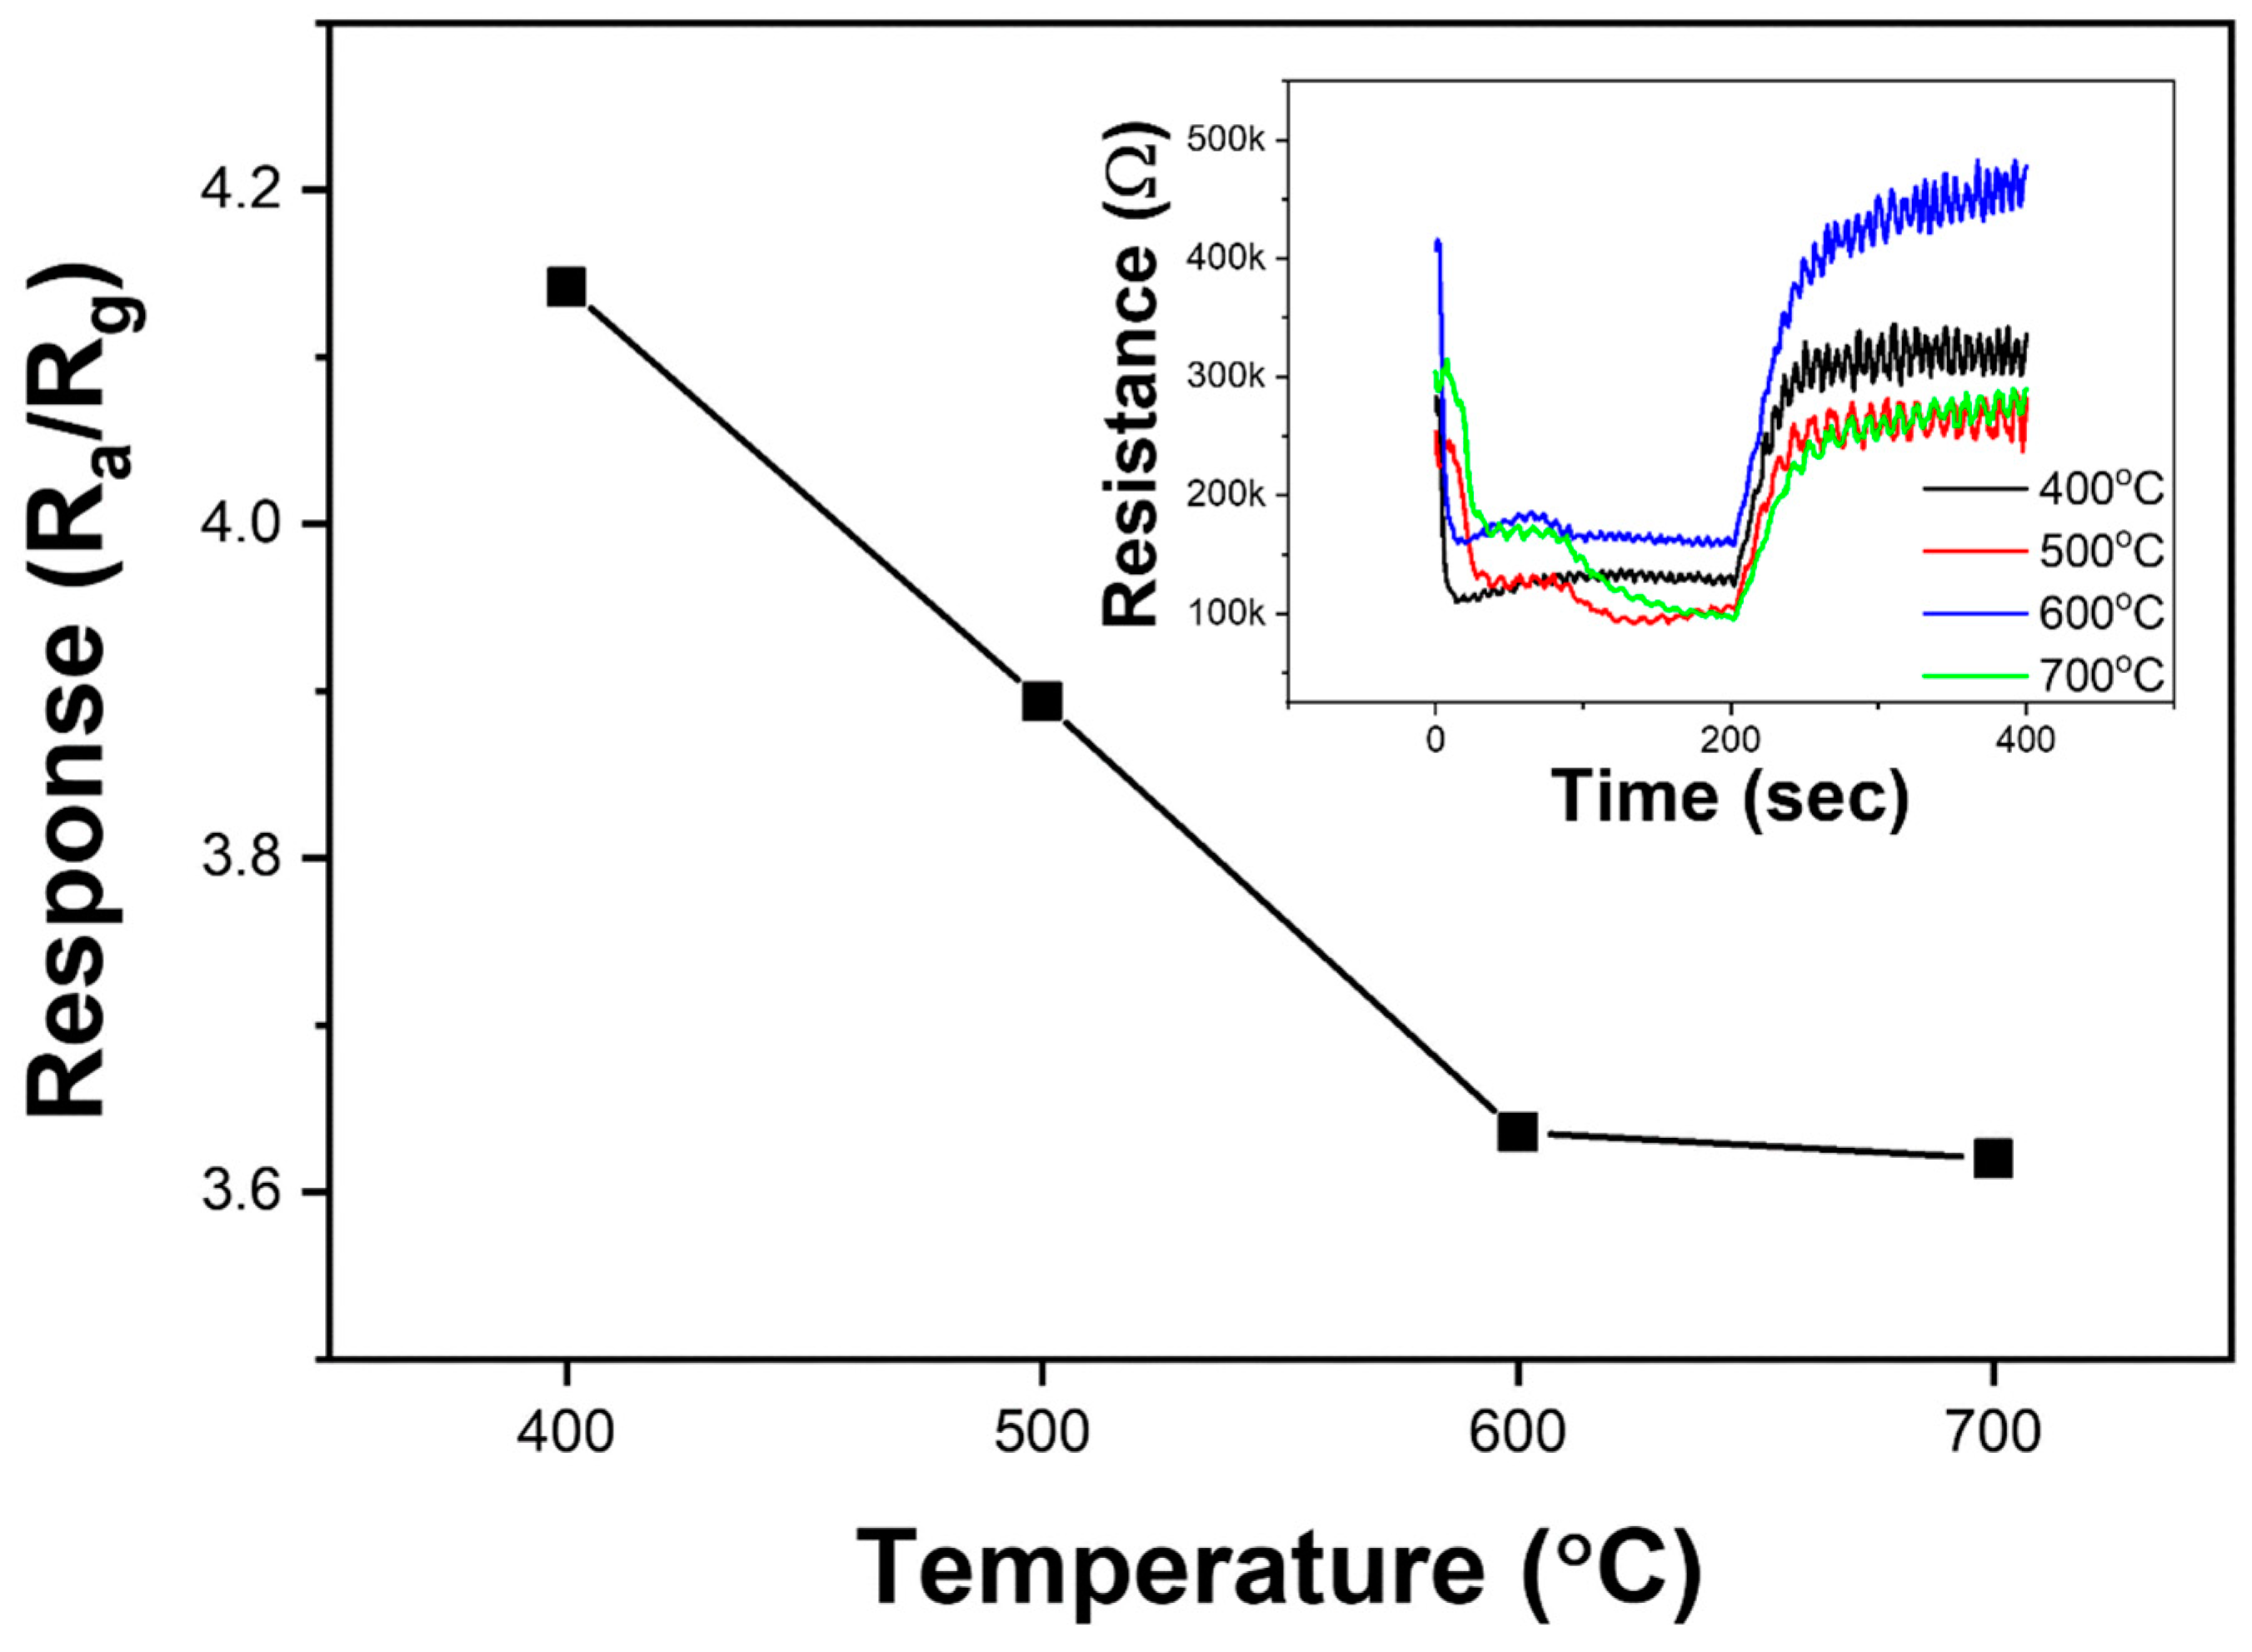
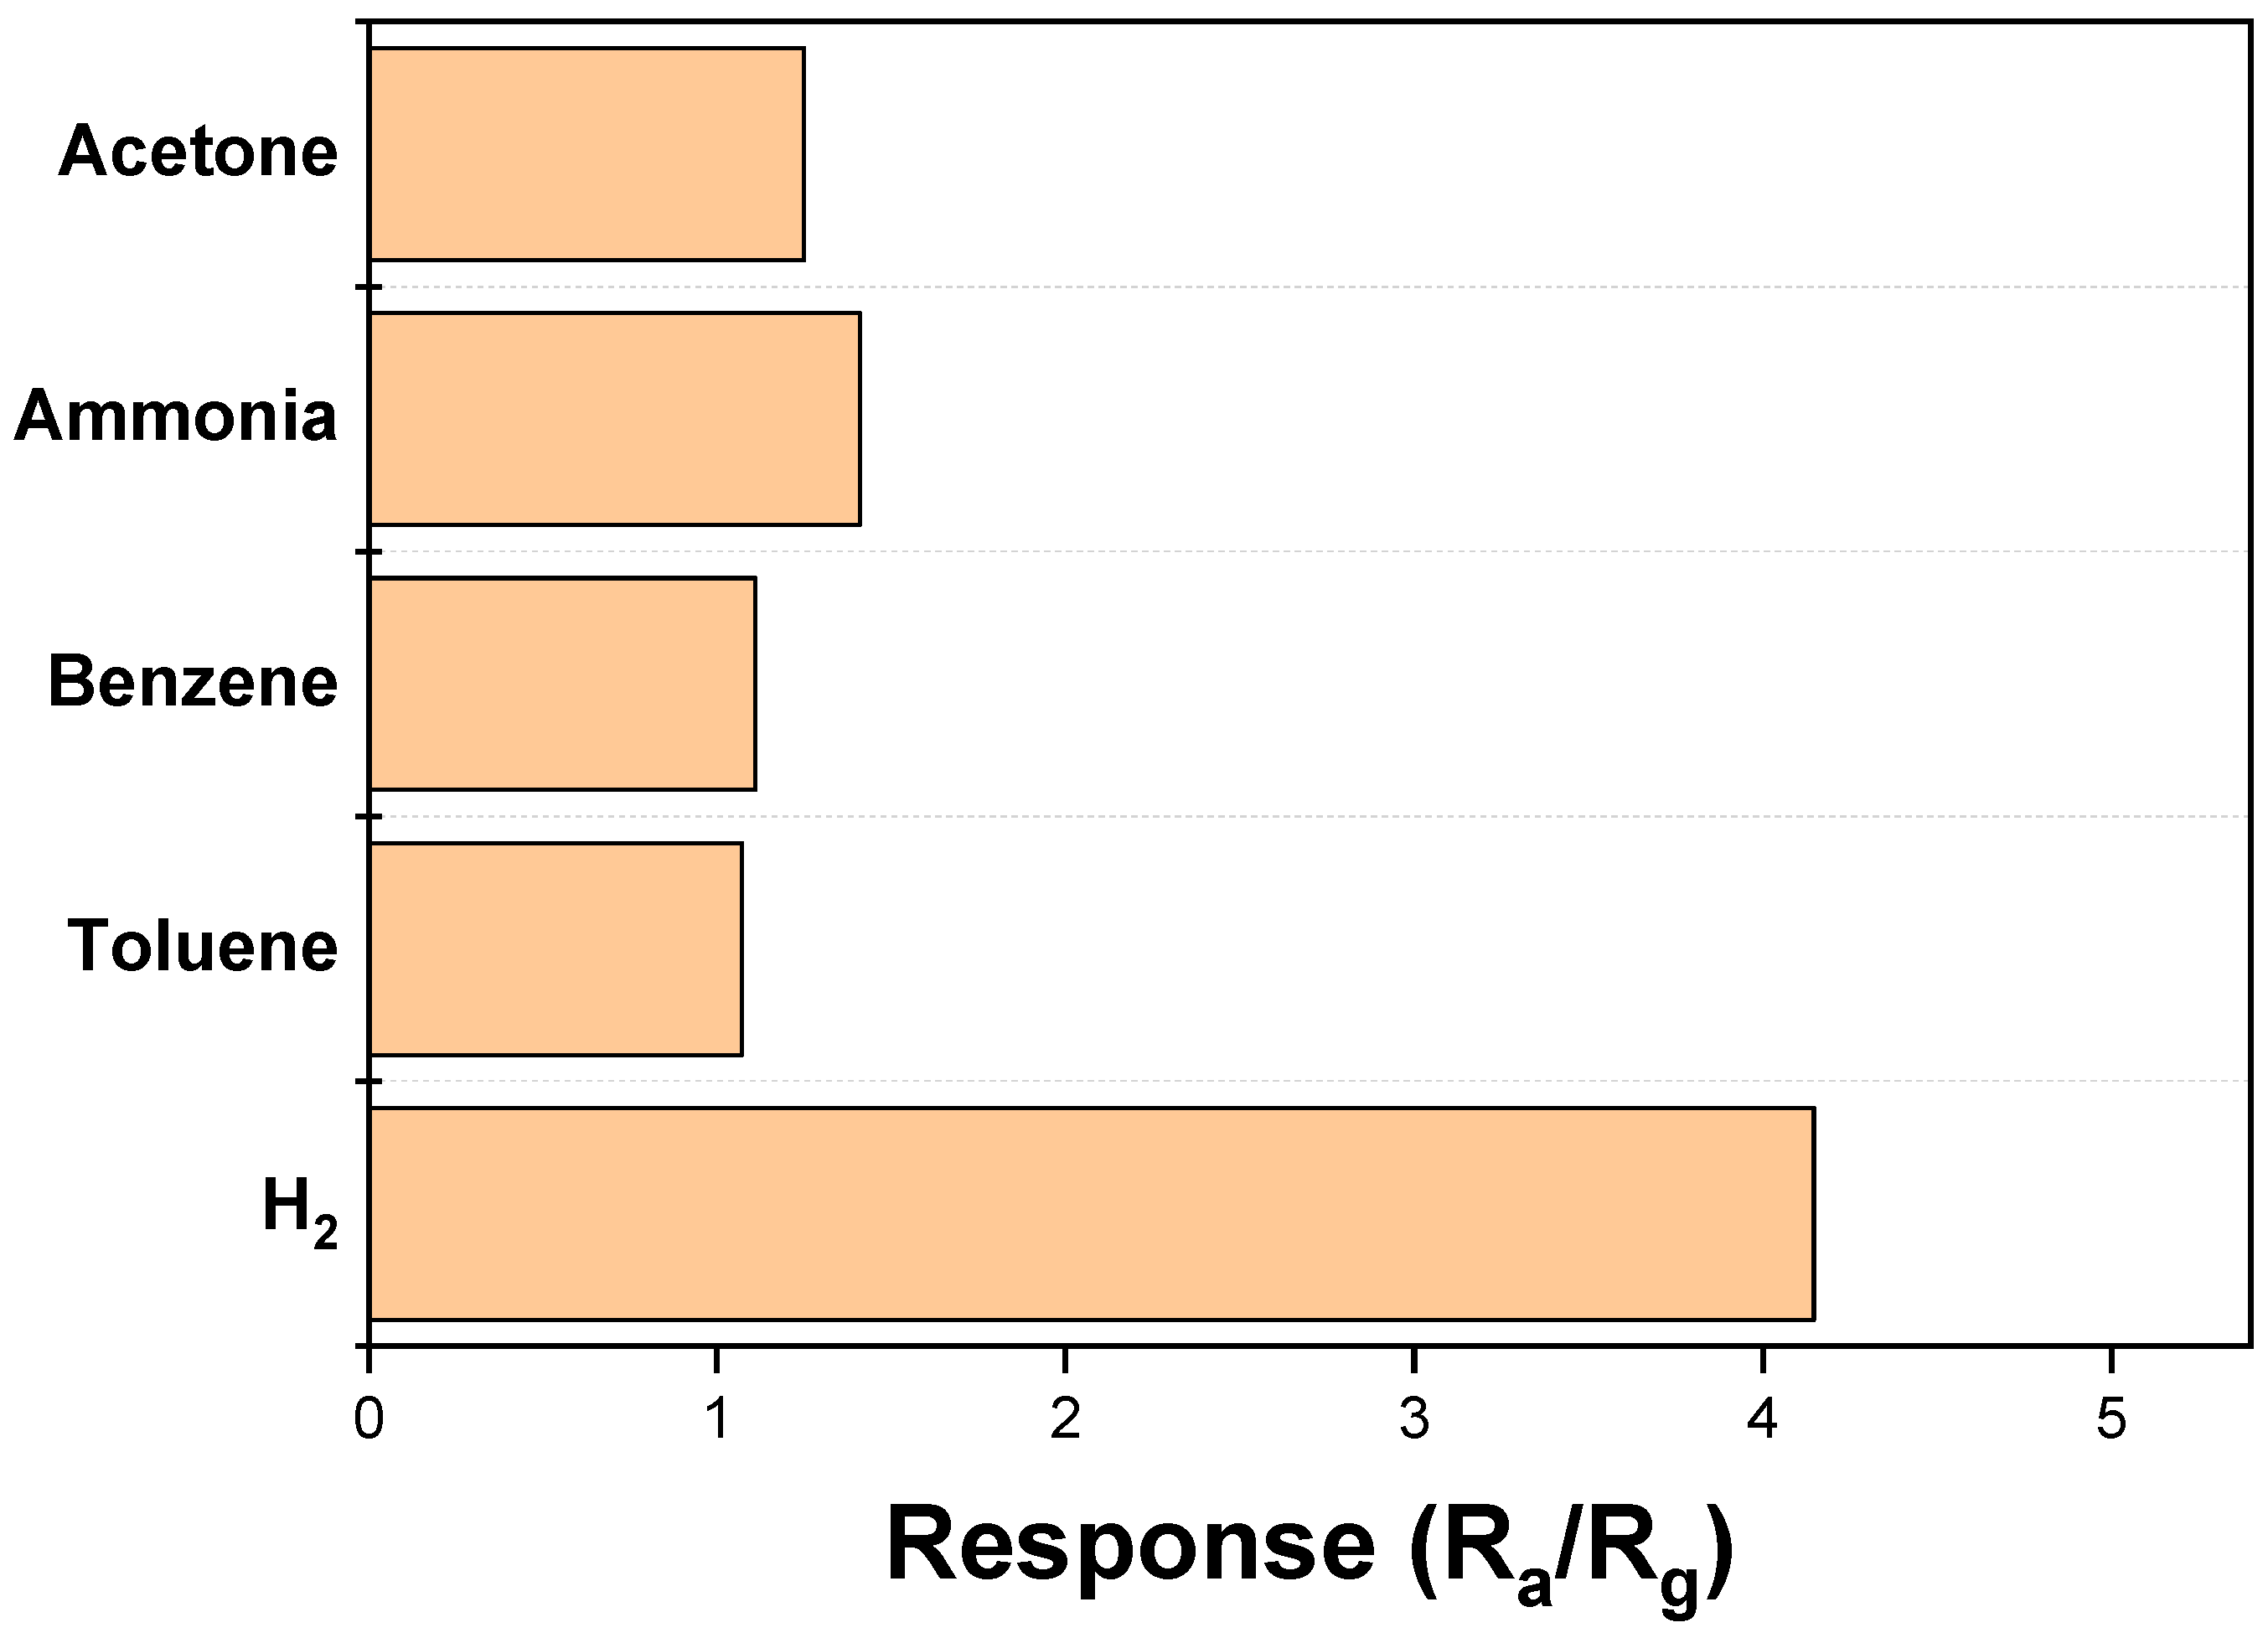
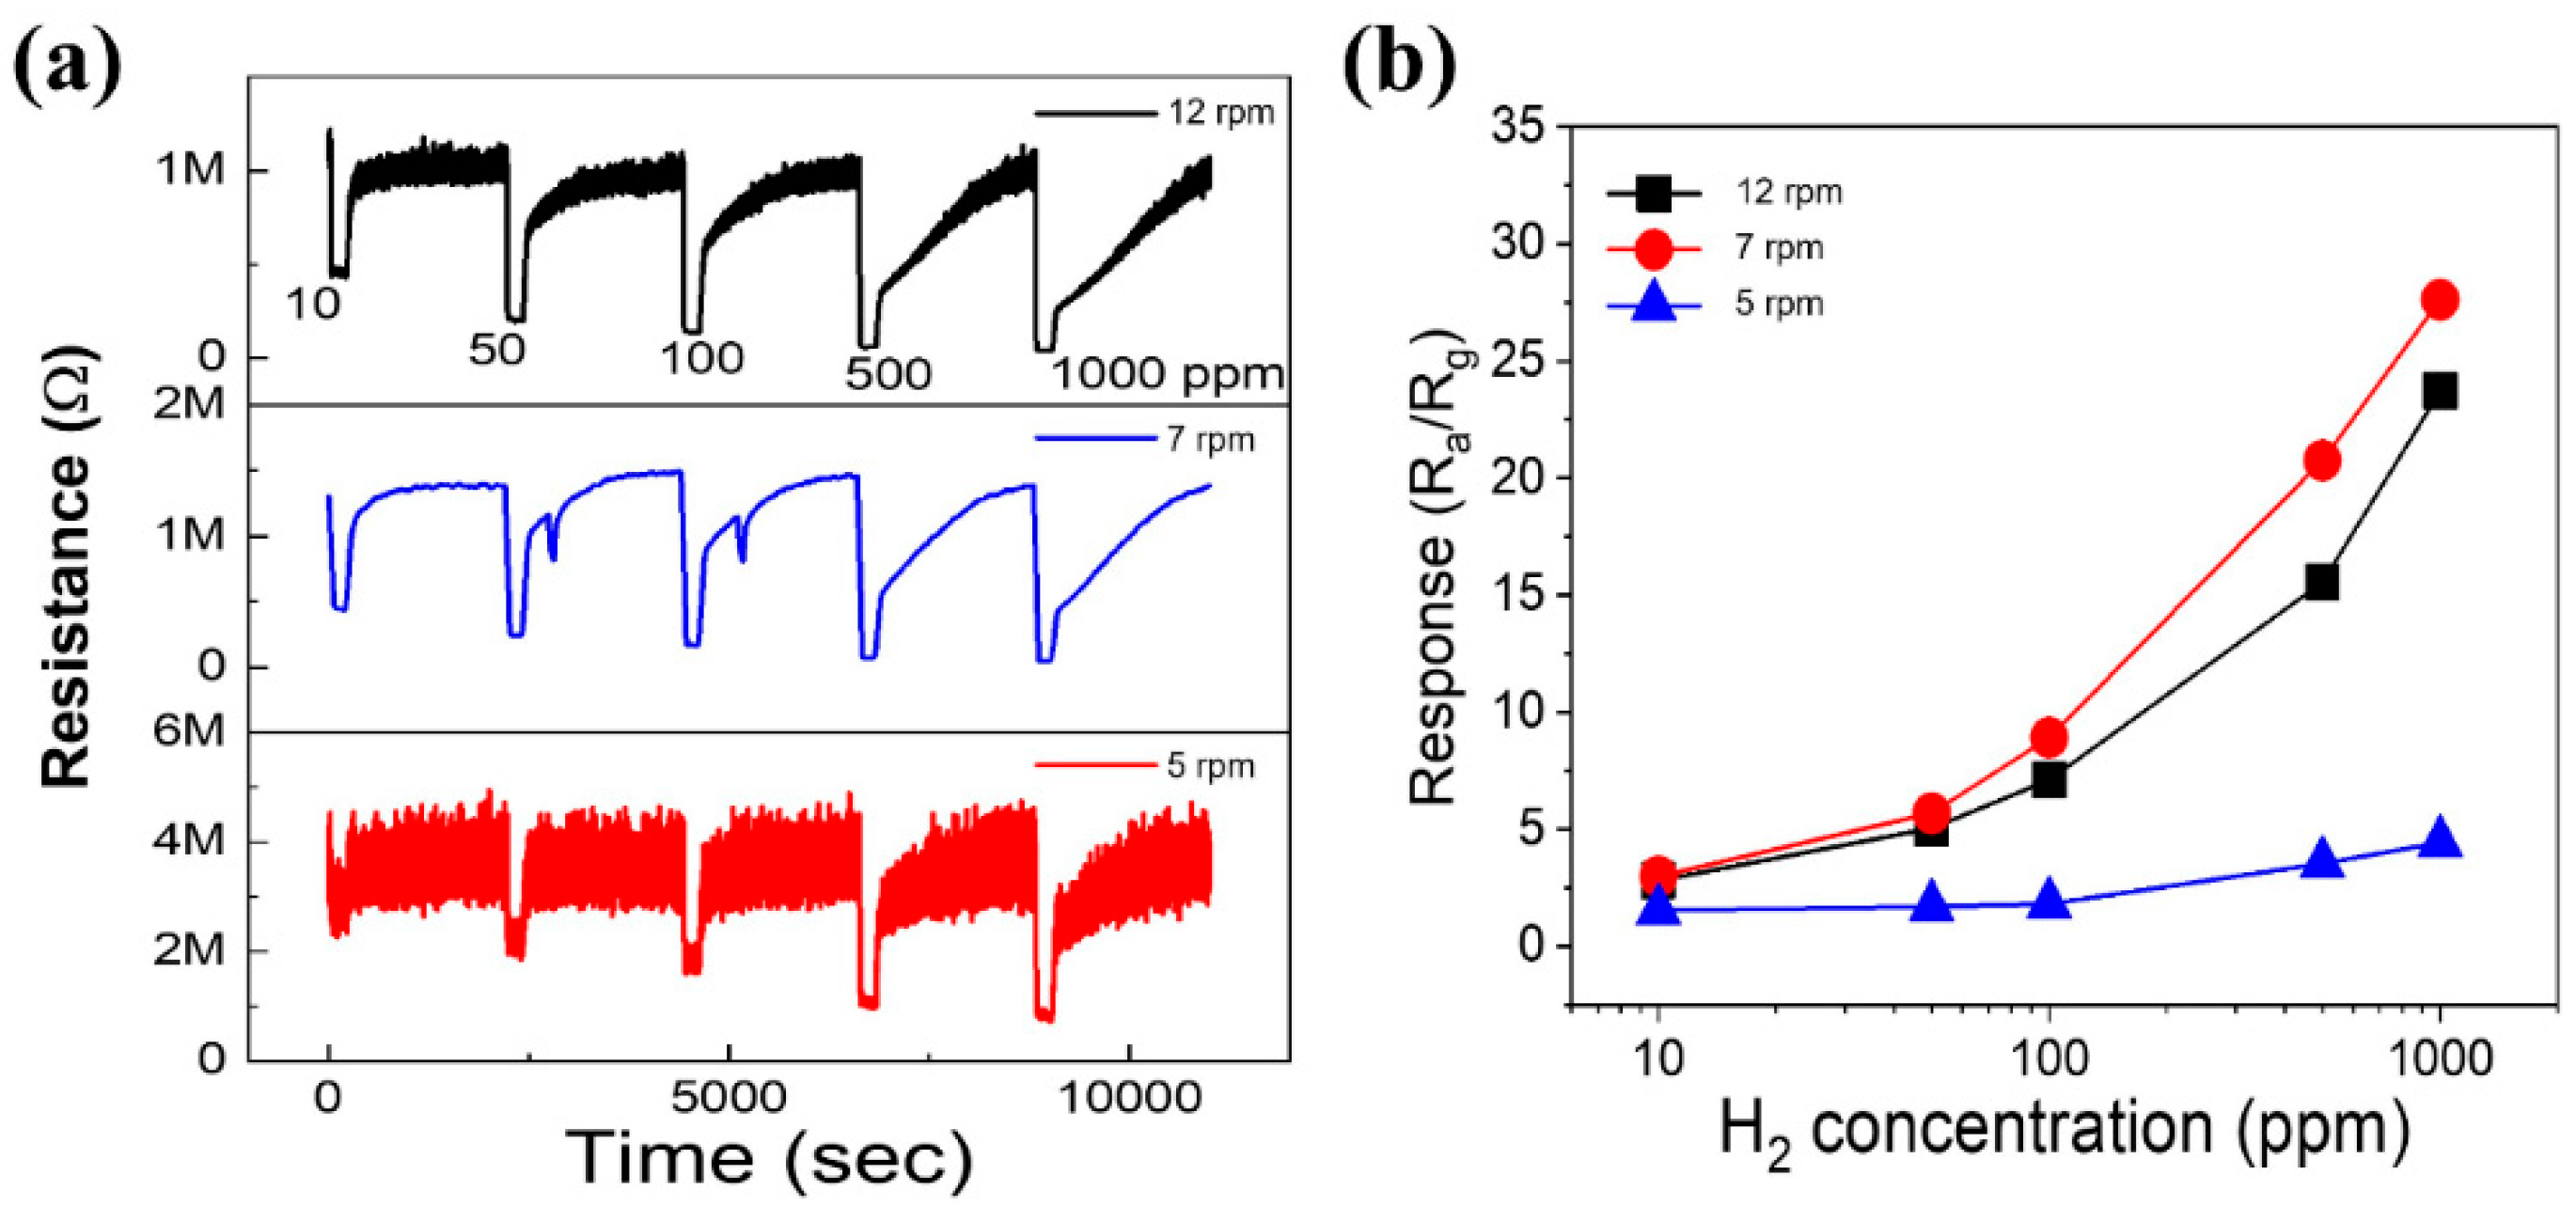
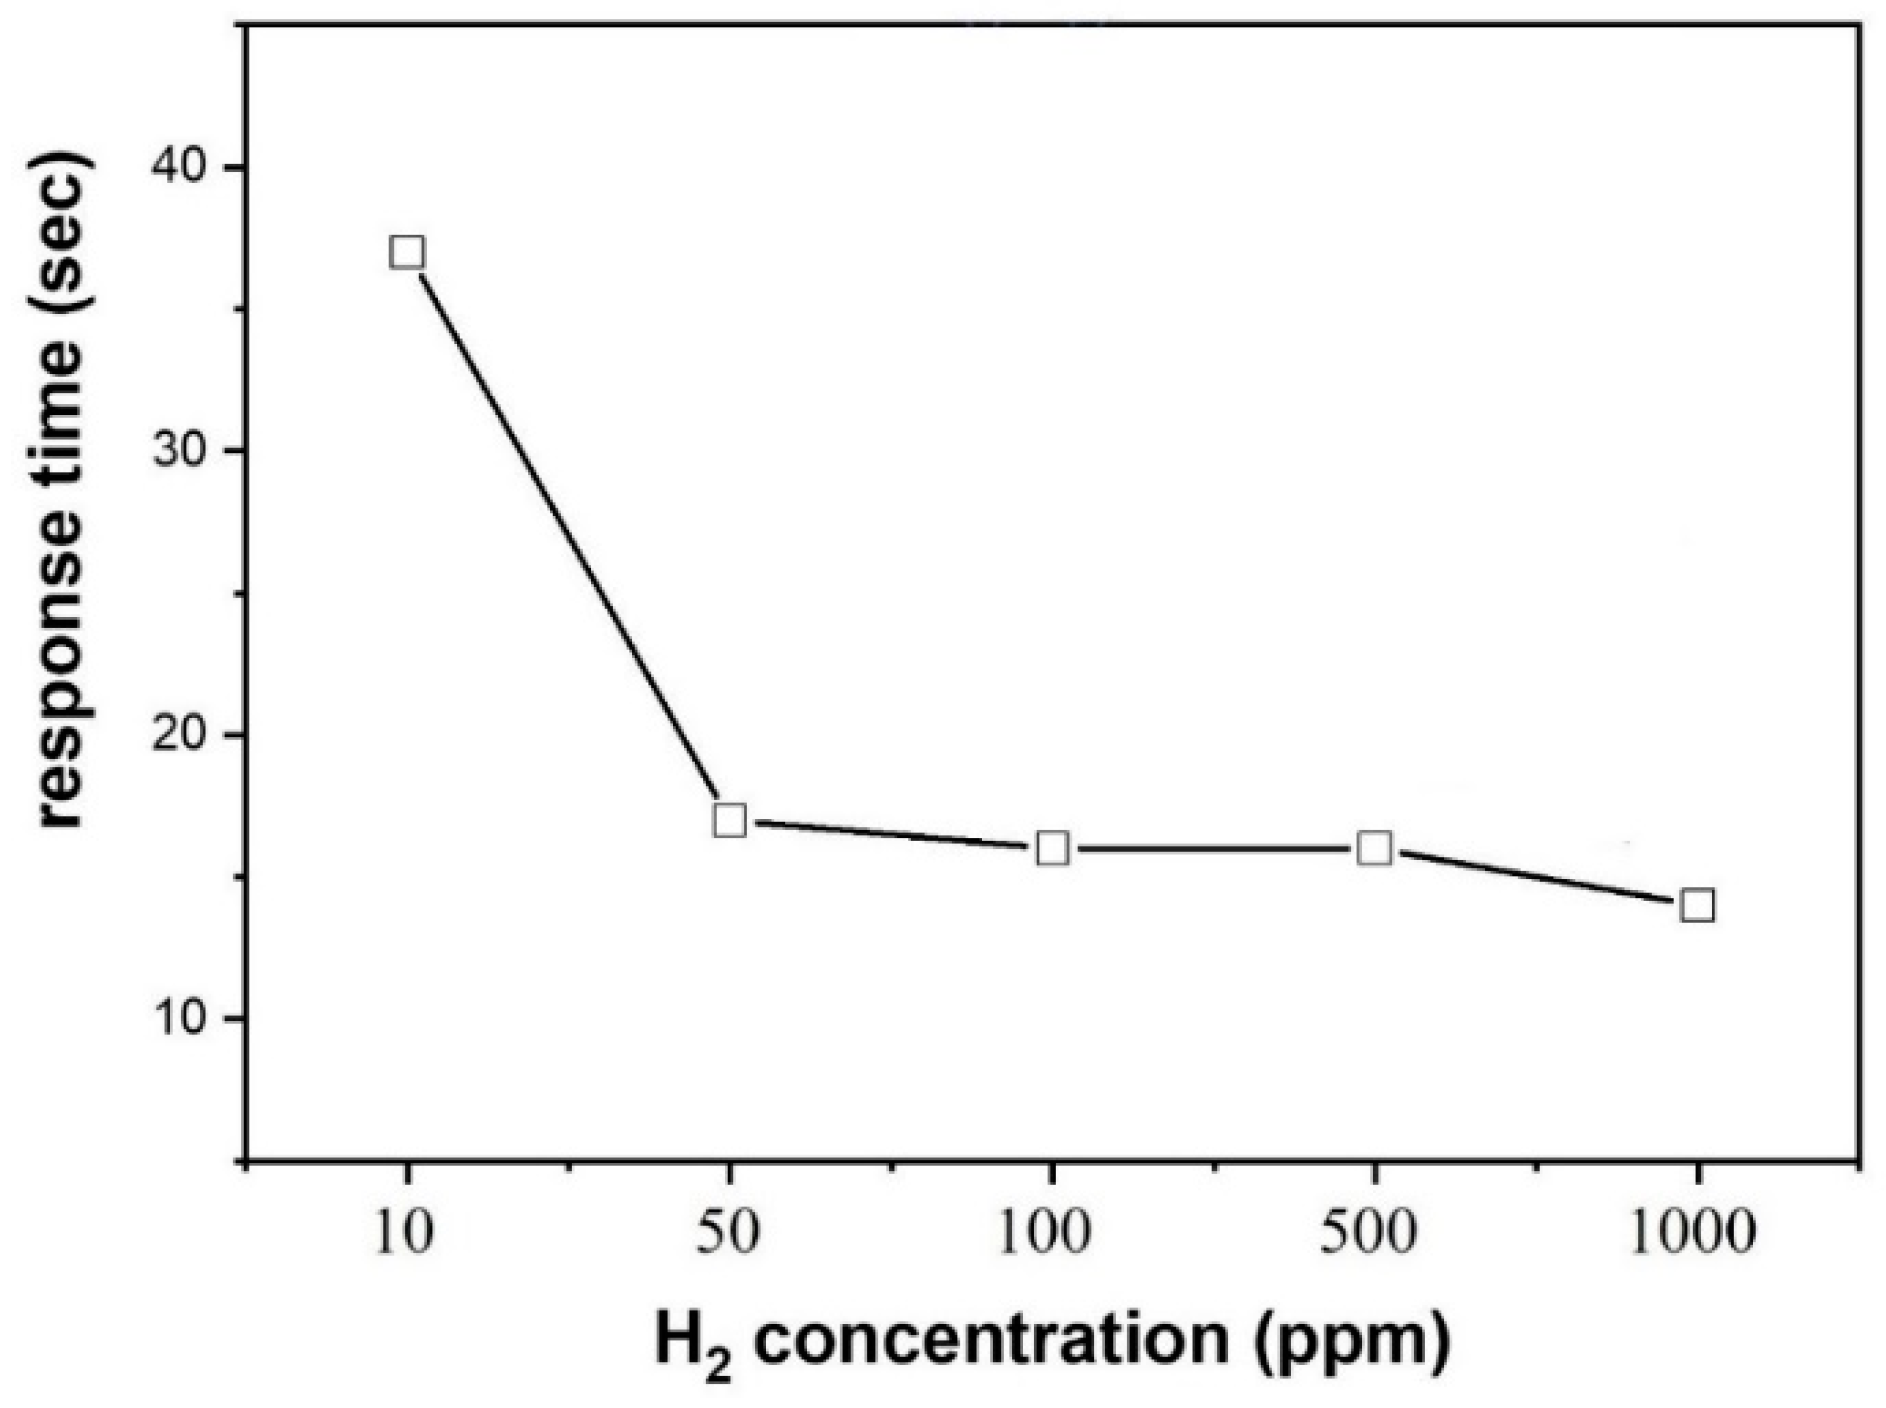
3.2. Gas Sensing Investigations

Sensing temperature is an important parameter of gas sensors. Initially, to determine the optimal sensing temperature of the fabricated gas sensor, it was exposed to 10 ppm H2 gas at different temperatures (Figure S1). The sensor revealed the highest response to H2 gas at 300 °C; thus, it was selected as the optimal sensing temperature. In fact, at low temperatures, the gas did not have sufficient energy to overcome the adsorption barrier and a low response was obtained. At 300 °C, the adsorption rate and desorption rate were equal, resulting in the highest amount of response. However, with a further increase in sensing temperature to 350 °C, the response was decreased owing to a higher desorption rate relative to the adsorption rate at high temperatures. Therefore, all remaining sensing tests were measured at 300 °C. Figure 5a presents transient resistance plots of SnO2 gas sensors with one, two, and three layers over the substrate when exposed to different amounts (10, 50, 100, 500, and 1000 ppm) of H2 gas at 300 °C. The resistance of all the sensors decreased upon the introduction of reducing H2 gas, revealing the n-type nature of the sensors. In fact, reducing gases react with adsorbed oxygen on the sensor surface, and the electrons are released to the sensor layer. Accordingly, for n-type gas sensors, the resistance decreases thanks to providing more charge carriers (electrons) to the sensor. In addition, the sensors exhibited good reversibility, where upon stoppage of the gas, the resistance returned to its initial value. This is an important feature for practical application of the gas sensor. To check and compare the behavior of gas sensors, the gas responses were calculated, and the corresponding sensing calibration curves are presented in Figure 5b to better understand the behaviors of the sensors. Overall, no significant differences were observed among the sensing results of different gas sensors. Therefore, the number of applied layers, from one to three over the substrate had no significant effect on the sensing performance. Based on the obtained results, one layer of sensing material was applied on the substrate for further experiments.
In the next step, we studied the behavior of one layer of the sensors applied on the tubular substrate with different numbers of substrate rotations (5, 10, 15, and 20). Figure 6a displays the transient resistance graphs of the SnO2 gas sensor (one layer) applied to a tubular substrate rotating with different rotations (5, 10, 15, and 20 times) when exposed to various amounts (10, 50, 100, 500, and 1000 ppm) of H2 gas at 300 °C. Also, relevant calibration curves are presented in Figure 6b. Based on the obtained results, the sensor applied on the substrate with ten rotations had the highest response at all concentrations, whereas the sensors applied on the substrates with five and twenty rotations had the lowest response to H2 gas at low (10, 50, and 100 ppm) and high (500 and 1000 rpm) concentrations, respectively.
Subsequently, with the single-layer SnO2 sensor applied under ten rotations of substrate, we also studied the sensing behavior at different rotation speeds (5, 7, and 12 rpm) in response to various amounts of H2 at 300 °C, and then we obtained the relevant calibration graphs (Figure 7a,b). There was a noticeable difference between the sensors’ responses under different substrate rotation speeds. The sensor prepared at a substrate rotation of 7 rpm showed the highest response, whereas the sensor prepared at 5 rpm substrate speed exhibited the lowest response. According to the above findings, one layer of the sensing material applying on the substrate with ten rotations at a rotation speed of 7 rpm results in the best sensor efficiency.
Since the annealing temperature can affect the particle size and crystallinity of SnO2 particles, and these factors ultimately can affect the sensor performance, we also studied the effect of annealing temperature on the gas response. After determining the optimal conditions, we determined the optimal annealing temperature for the SnO2 gas sensors. For this purpose, SnO2 particles were annealed at different temperatures (400, 500, 600, and 700 °C) for 1 h in air. Figure 8 reveals the response of the sensors annealed at different temperatures to 10 ppm H2 gas, and the inset in Figure 8 depicts transient resistance plots of SnO2 gas sensors applied to tubular substrates under optimized conditions and annealed at 400, 500, 600, and 700 °C to 10 ppm H2 at 300 °C. According to the obtained results, the sensor annealed at 400 °C exhibited the highest response to H2 gas, and therefore, it was selected for other experiments. The decrease in the sensor’s response annealed at higher temperatures may be related to the growth of particles at higher temperatures, which decreases the overall surface area of the sensor and causes a decrease in the gas response. Sun et al. [39] also investigated the effect of the annealing temperature (450, 500, and 550 °C) on the gas response of ZnFe2O4 and reported that the best sensing performance was obtained at 450 °C, due to the low particle size of the sensing temperature at this temperature. Katoch et al. [40], investigated the effect of crystallization time on the gas response of ZnO hollow nanofibers and the sensors crystallized for a longer time, which revealed a better response relative to other sensors, which was related to the high crystallinity of the sensor. In the present study, even though at higher annealing temperatures a higher crystallinity is expected, it seems that the role of particle growth is more important than that of improved crystallinity, as pointed out by another study by Katoch et al. [41].
In the next step, the reproducibility of the optimized sensor was tested by fabricating two sensors under optimal fabrication procedures and exposing them to various amounts of H2 at 300 °C (Figure S2a,b). Figure S2c presents the calibration curves of the two gas sensors. The sensors exhibited almost the same responses to various levels of H2 gas, demonstrating their desirable reproducibility.
For real applications, especially for H2 gas detection, the response time is a highly important parameter, so we also calculated the response time of the optimal gas sensor. In Figure 9, the response times of the optimized sensor to 10, 50, 100, 500, and 1000 ppm H2 at 300 °C are given. The response times to the mentioned concentrations were 37, 17, 16, 16, and 14 s, respectively. Therefore, the sensor is fast enough to detect any leakage of H2 gas in real applications. In addition, as expected, the response time decreases with increasing H2 gas concentration because more H2 molecules were easily adsorbed onto the sensor surface.
The selectivity of the optimized sensor was also checked by exposing it to 10 ppm H2, toluene, benzene, ammonia, and acetone at 300 °C. As shown in Figure 10, the sensor shows a higher response to H2 gas relative to other gases. This is mainly due to the small size of the H2 molecules in comparison with other gases, which leads to the easy and fast diffusion of this gas into deep parts of the sensor, resulting in more adsorption and more sensing reactions. Furthermore, the sensing temperature can affect the selectivity of the sensors, and it seems that 300 °C is sufficient for the H2 gas to be sufficiently adsorbed on the sensor surface, and as a result of the subsequent reactions, a higher sensing signal relative to other gases will be generated.

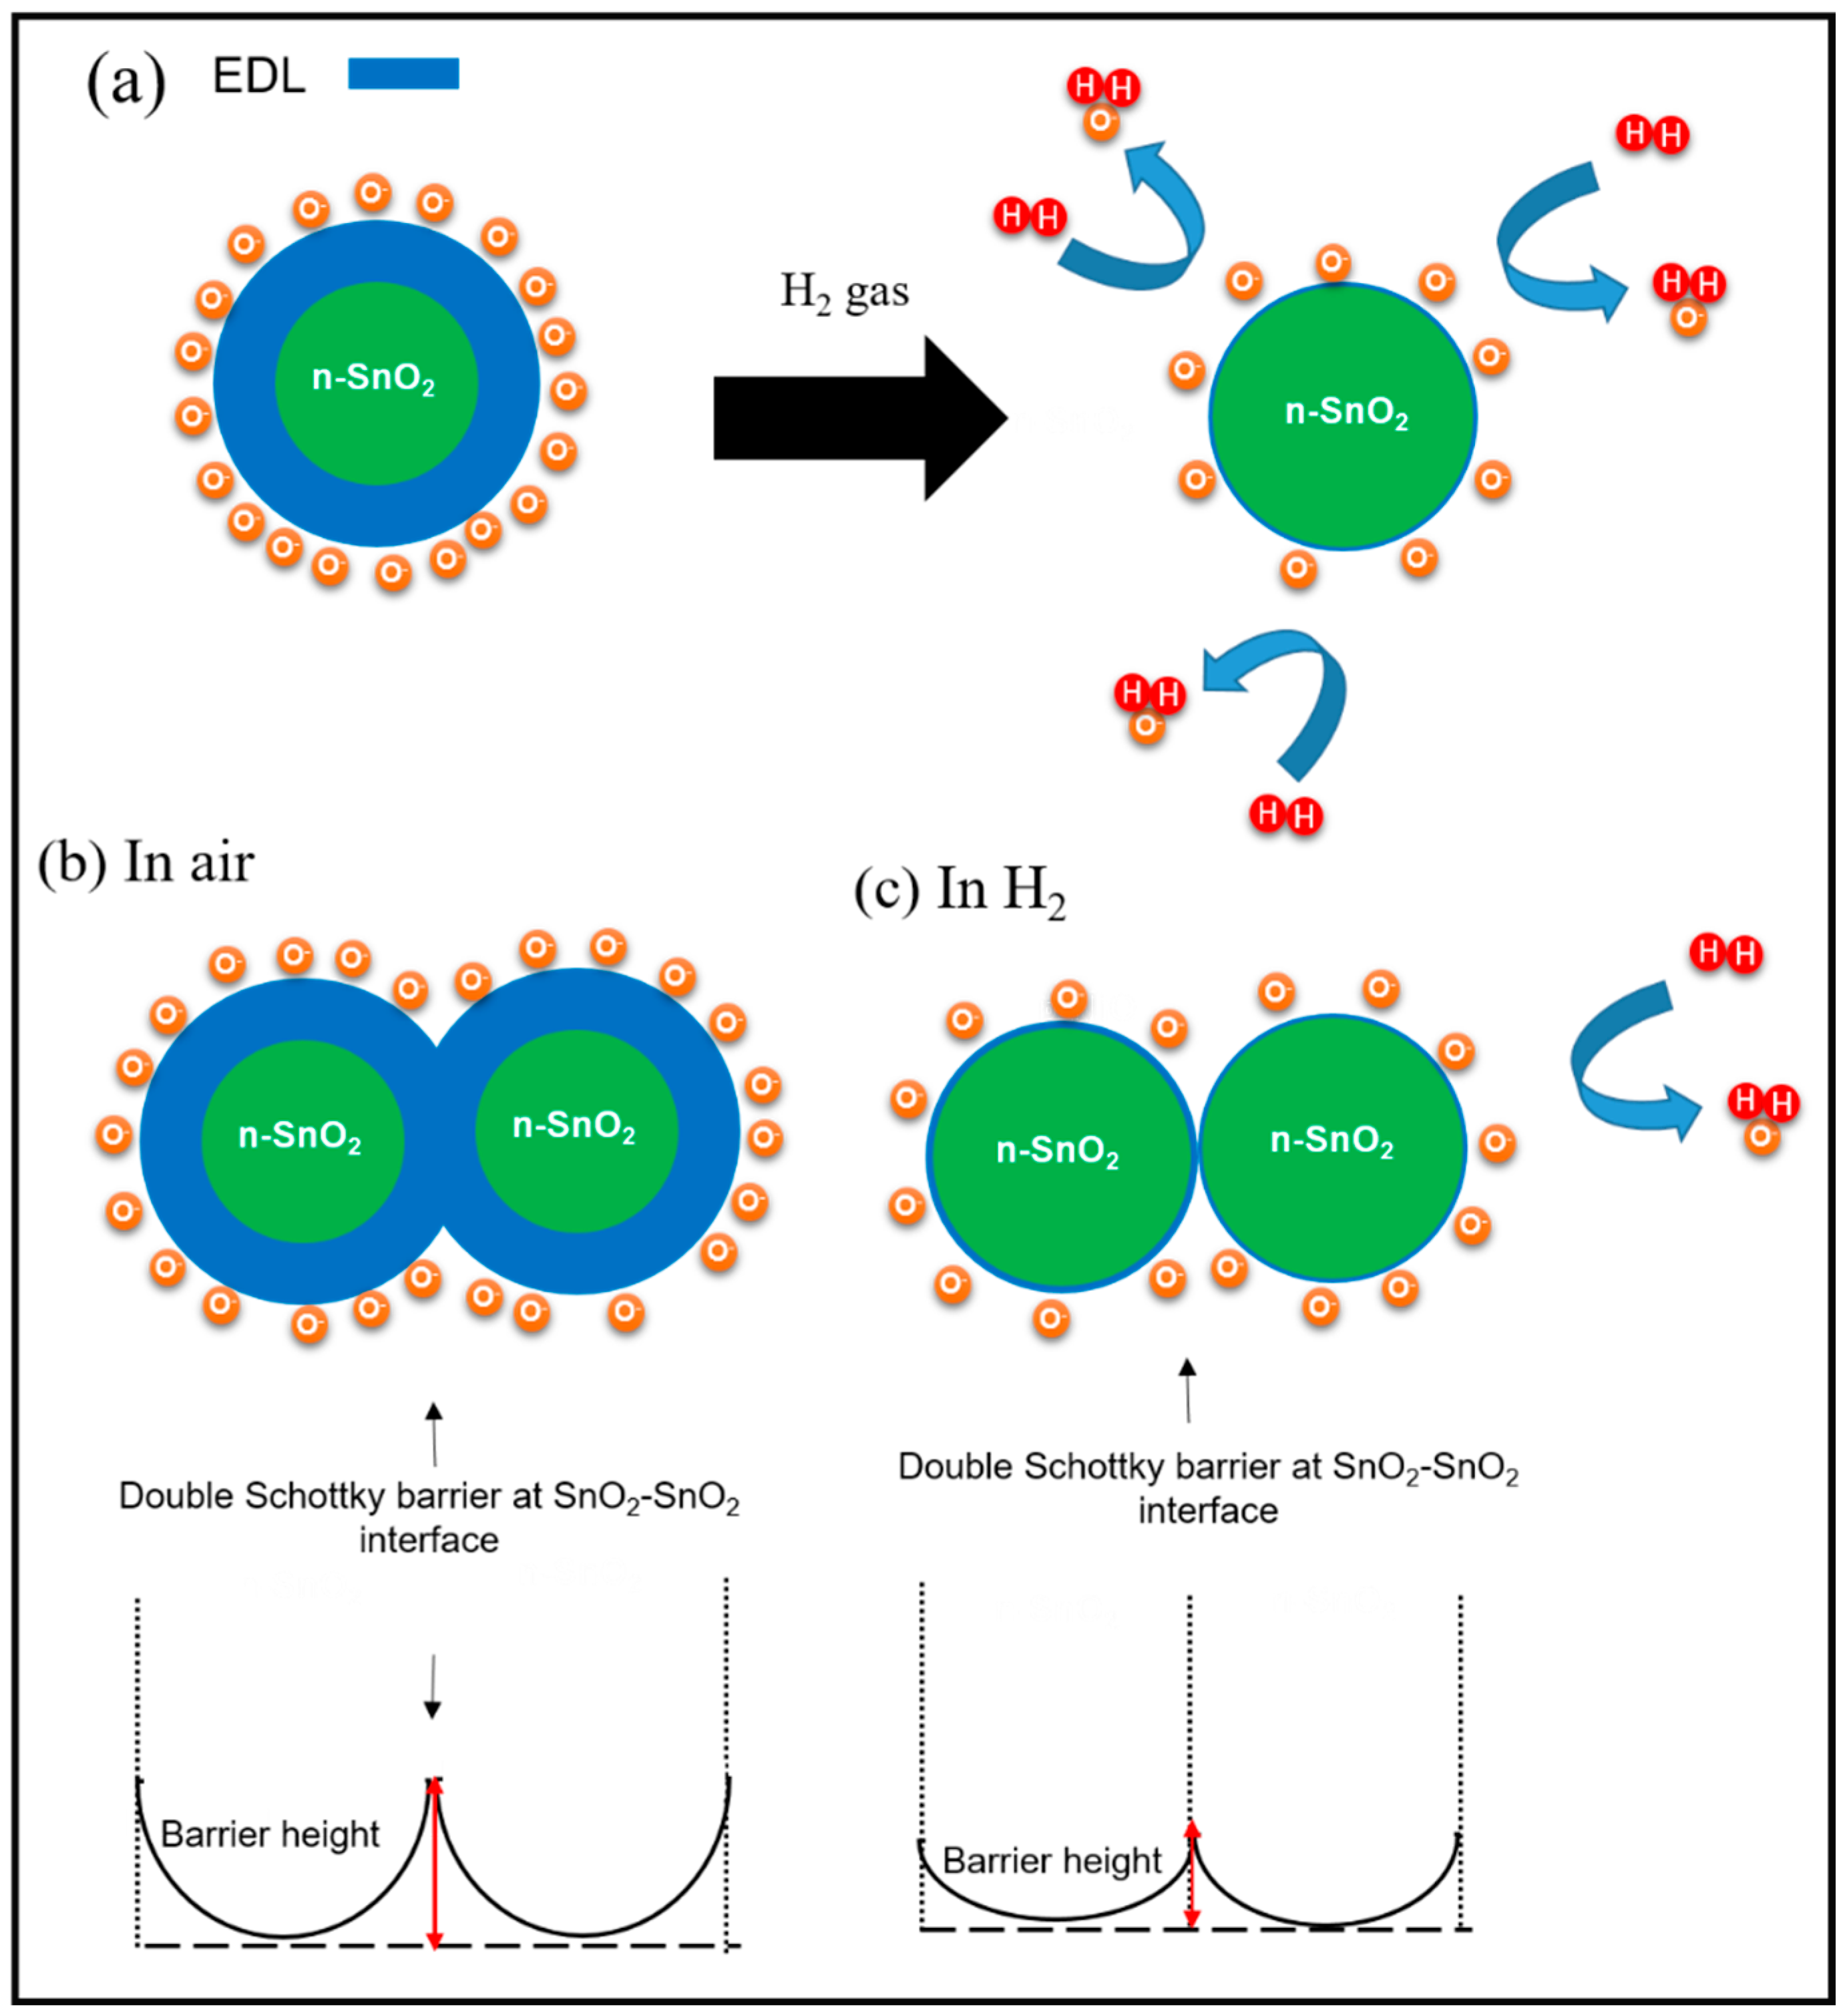
3.3. Proposed Sensing Mechanism

The basic sensing mechanism of resistance gas sensors is based on the variations of resistance in the presence of target gases. Since the present sensor exhibited an n-type nature, we will explain the sensing behavior using the electron depletion layer (EDL) concept. In fresh air, which is mainly composed of N2 and O2 gases, oxygen can be adsorbed on the sensor surface, and because of the high electron affinity of oxygen, electrons can be abstracted from the conduction band of SnO2 as follows [42,43]:
O 2 ( g ) O 2 ( a d s )
O 2 a d s + e O 2
O 2 + e 2 O
O + e O 2
At low temperatures (T < 100 °C), molecular species are dominant, while at higher temperatures, atomic species are dominant [44]. At 300 °C, it can be assumed that O is the dominant species [45]. Owing to the abstraction of electrons by oxygen ions, an EDL is created on the exposed surfaces of the SnO2 particles, leading to an increase in the resistance of SnO2 in air relative to that under vacuum conditions [46]. Thus, the initial high resistance of SnO2 sensor in air is related to the adsorption of oxygen species and formation of EDL, where the concentration of electrons is much lower than the core parts of the sensor. Upon exposure to the H2 gas, H2 reacts with the adsorbed oxygen species as follows [47].
H 2 + O H 2 O + e
Accordingly, water vapor is produced, and the electrons are liberated to the sensor surface. Owing to the release of electrons, the thickness of the EDL will be significantly decreased, which leads to an increase in the sensor conductivity or equivalently a decrease in the sensor resistance in the presence of H2 gas. Therefore, a sensing signal appears owing to the resistance modulation of the gas sensor in the presence of H2 gas. This mechanism is schematically illustrated in Figure 11a. In addition, at the contact points between the SnO2 particles, double Schottky barriers initially form in the air, leading to the formation of potential barriers for the flow of electrons from one grain to another grain. By subsequent exposure to H2 gas, and the release of electrons to the sensor surface, the height of these potential barriers decreases, contributing to the generation of a sensor signal (Figure 11b,c) [48]. In addition, because of the small size of the H2 molecules, they can easily diffuse into the deep parts of the sensor and occupy most of the available adsorption sites in the sensing layer. Hence, the sensor exhibits a relatively high response to small concentrations of H2 [49].

4. Conclusions

In a nutshell, the effect of deposition variables on the H2 gas response of commercially available SnO2 particles was investigated. The SnO2 particles were characterized with different techniques including XRD, SEM, and XPS, and their desired phases, morphologies, and chemical compositions were demonstrated. We varied the number of deposited layers, rotational speed of the substrate, and number of rotations of the substrate on the output of the deposited sensor. The optimal conditions for sensor fabrication to achieve the best performance were the application of one layer of the sensing material to the tubular substrate with ten rotations and a rotation speed of 7 rpm. Furthermore, the effect of the annealing temperature (400, 500, 600, and 700 °C for 1 h) on the response to H2 gas was explored, and annealing at a lower temperature (400 °C/1 h) resulted in a higher sensor performance, which was related to grain growth at high temperatures. The optimized sensor indicated a high response of ~12 to 500 ppm H2 gas at 300 °C. Therefore, the deposition variable and annealing temperature affected the sensing performance and needed to be optimized to obtain the best sensing results.

Supplementary Materials

The following supporting information can be downloaded at: https://www.mdpi.com/article/10.3390/app14041567/s1, Figure S1: Response of SnO2 gas sensor with one layer over substrate to 10 ppm H2 gas versus temperature; Figure S2: (a,b) Reproducibility of optimized gas sensor during two experiments to various concentrations of H2 gas (c) Corresponding calibration curves.

Author Contributions

Conceptualization, Writing—Original Draft Preparation, S.S.K. and H.W.K.; Methodology, M.H.L.; Investigation, M.H.L. and A.M.; Writing—Original Draft Preparation, A.M., S.S.K. and H.W.K.; Writing—Review and Editing, S.S.K. and H.W.K.; Supervision, S.S.K. and H.W.K. All authors have read and agreed to the published version of the manuscript.

Funding

This study was supported by Inha University.

Institutional Review Board Statement

Not applicable.

Informed Consent Statement

Not applicable.

Data Availability Statement

The data presented in this study are available on request from the corresponding author.

Conflicts of Interest

The authors declare no conflicts of interest.

References

  1. Sharma, B.; Sharma, A.; Kim, J.S. Recent advances on H2 sensor technologies based on MOX and FET devices: A review. Sens. Actuators B Chem. 2018, 262, 758–770. [Google Scholar] [CrossRef]
  2. Li, Z.; Yao, Z.; Haidry, A.A.; Plecenik, T.; Xie, L.; Sun, L.; Fatima, Q. Resistive-type hydrogen gas sensor based on TiO2: A review. Int. J. Hydrogen Energy 2018, 43, 21114–21132. [Google Scholar] [CrossRef]
  3. Mobtakeri, S.; Habashyani, S.; Çoban, Ö.; Budak, H.F.; Kasapoğlu, A.E.; Gür, E. Effect of growth pressure on sulfur content of RF-magnetron sputtered WS2 films and thermal oxidation properties of them toward using Pd decorated WO3 based H2 gas sensor. Sens. Actuators B Chem. 2023, 381, 133485. [Google Scholar] [CrossRef]
  4. Karuppasamy, K.; Sharma, A.; Vikraman, D.; Lee, Y.-A.; Sivakumar, P.; Korvink, J.G. Room-temperature response of MOF-derived Pd@PdO core shell/γ-Fe2O3 microcubes decorated graphitic carbon based ultrasensitive and highly selective H2 gas sensor. J. Colloid Interface Sci. 2023, 652, 692–704. [Google Scholar] [CrossRef] [PubMed]
  5. Zhu, S.; Tian, Q.; Wu, G.; Bian, W.; Sun, N.; Wang, X. Highly sensitive and stable H2 gas sensor based on p-PdO-n-WO3-heterostructure-homogeneously-dispersing thin film. Int. J. Hydrogen Energy 2022, 47, 17821–17834. [Google Scholar] [CrossRef]
  6. Ai, T.; Zhang, J.; Li, J.; Zhang, Y.; Yin, Y.; Lu, J. Ultrafast response of Pt functionalized Fe2(MoO4)3 nanoflower gas sensors for ultra-low ppm level H2 gas detection. J. Alloys Comp. 2024, 970, 172567. [Google Scholar] [CrossRef]
  7. Yang, D.; Gopal, R.A.; Lkhagvaa, T.; Choi, D. Metal-oxide gas sensors for exhaled-breath analysis: A review. Meas. Sci. Technol. 2021, 32, 102004. [Google Scholar] [CrossRef]
  8. Urita, Y.; Watanabe, T.; Maeda, T.; Sasaki, Y.; Ishihara, S.; Hike, K.; Sanaka, M.; Nakajima, H.; Sugimoto, M. Breath hydrogen gas concentration linked to intestinal gas distribution and malabsorption in patients with small-bowel pseudo-obstruction. Biomark. Insights 2009, 4, BMI-S2139. [Google Scholar] [CrossRef]
  9. Breedon, M.; Miura, N. Augmenting, H2 sensing performance of YSZ-based electrochemical gas sensors via the application of Au mesh and YSZ coating. Sens. Actuators B Chem. 2013, 182, 40–44. [Google Scholar] [CrossRef]
  10. Fechete, A.; Wlodarski, W.; Kalantar-Zadeh, K.; Holland, A.; Antoszewski, J.; Kaciulis, S.; Pandolfi, L. SAW-based gas sensors with rf sputtered InOx and PECVD SiNx films: Response to H2 and O3 gases. Sens. Actuators B Chem. 2006, 118, 362–367. [Google Scholar] [CrossRef]
  11. Meeran, M.N.; Saravanan, S.P.; Shkir, M.; Kannan, S.K. Fabrication of transition-metal (Zn, Mn, Cu)-based MOFs as efficient sensor materials for detection of H2 gas by clad modified fiber optic gas sensor technique. Opt. Fiber Technol. 2021, 65, 102614. [Google Scholar] [CrossRef]
  12. Cho, S.H.; Suh, J.M.; Jeong, B.; Lee, T.H.; Choi, K.S.; Eom, T.H.; Kim, T.; Jang, H.W. Fast responding and highly reversible gasochromic H2 sensor using Pd-decorated amorphous WO3 thin films. Chem. Eng. J. 2022, 446, 136862. [Google Scholar]
  13. Shi, Y.; Xu, H.; Liu, T.; Zeb, S.; Nie, Y.; Zhao, Y. Advanced development of metal oxide nanomaterials for H2 gas sensing applications. Mater. Adv. 2021, 2, 1530–1569. [Google Scholar] [CrossRef]
  14. Yang, B.; Myung, N.V.; Tran, T.T. 1D metal oxide semiconductor materials for chemiresistive gas sensors: A review. Adv. Electron. Mater. 2021, 7, 2100271. [Google Scholar] [CrossRef]
  15. Kim, H.-J.; Lee, J.-H. Highly sensitive and selective gas sensors using p-type oxide semiconductors: Overview. Sens. Actuators B Chem. 2014, 192, 607–627. [Google Scholar] [CrossRef]
  16. Das, S.; Jayaraman, V. SnO2: A comprehensive review on structures and gas sensors. Prog. Mater. Sci. 2014, 66, 112–255. [Google Scholar] [CrossRef]
  17. Kong, Y.; Li, Y.; Cui, X.; Su, L.; Ma, D.; Lai, T. SnO2 nanostructured materials used as gas sensors for the detection of hazardous and flammable gases: A review. Nano Mater. Sci. 2022, 4, 339–350. [Google Scholar] [CrossRef]
  18. Li, G.; Du, K.; Wang, X.; Wang, X.; Chen, B.; Qiu, C.; Xu, J. Pd nanoparticles decorated SnO2 ultrathin nanosheets for highly sensitive H2 sensor: Experimental and theoretical studies. Int. J. Hydrogen Energy 2024, 50, 761–771. [Google Scholar] [CrossRef]
  19. Pandey, G.; Bhardwaj, M.; Kumar, S.; Lawaniya, S.D.; Kumar, M.; Dwivedi, P.K.; Awasthi, K. Synergistic effects of Pd-Ag decoration on SnO/SnO2 nanosheets for enhanced hydrogen sensing. Sens. Actuators B Chem. 2024, 402, 135062. [Google Scholar] [CrossRef]
  20. Kim, D.S.; Ahemad, M.J.; Le, T.D.; Lee, H.J.; Yu, Y.T. Synergistic effects of bimetallic Pd-Au (alloy)/SnO2 nanocomposites for low temperature and selective hydrogen gas sensors. Mater. Sci. Eng. B 2024, 299, 116939. [Google Scholar] [CrossRef]
  21. Kumar, V.; Gautam, Y.K.; Gautam, D.; Kumar, A.; Adalati, R.; Singh, B.P. highly sensitive and selective hydrogen gas sensor with humidity tolerance using pd-capped SnO2 thin films of various thicknesses. Fuels 2023, 4, 279–294. [Google Scholar] [CrossRef]
  22. Ren, Q.; Zhang, X.Y.; Chen, J.A.; Fang, J.B.; Zi, T.Q.; Zhu, L.; Liu, C.; Han, M.; Cao, Y.Q.; Li, A.D. Ultrasensitive and wide-range flexible hydrogen sensor based on Pd nanoparticles decorated ultrathin SnO2 Film. Adv. Electron. Mater. 2023, 9, 2201047. [Google Scholar] [CrossRef]
  23. Mirzaei, A.; Janghorban, K.; Hashemi, B.; Bonyani, M.; Leonardi, S.G.; Neri, G. A novel gas sensor based on Ag/Fe2O3 core-shell nanocomposites. Ceram. Int. 2016, 42, 18974–18982. [Google Scholar] [CrossRef]
  24. Gui, Y.H.; Tu, Y.S.; Guo, H.S.; Qin, X.Y.; Tian, K.; Qin, X.M.; Guo, D.J.; Guo, X. Microwave-assisted efficient synthesis of ZnO nanospheres for low temperature NO2 gas sensor. Mater. Sci. Eng. B 2024, 299, 117031. [Google Scholar] [CrossRef]
  25. Li, S.-H.; Chu, Z.; Meng, F.-F.; Luo, T.; Hu, X.-Y.; Huang, S.-Z. Highly sensitive gas sensor based on SnO2 nanorings for detection of isopropanol. J. Alloys Comp. 2016, 688, 712–717. [Google Scholar] [CrossRef]
  26. Mohd Chachuli, S.A.; Hamidon, M.N.; Mamat, M.S.; Ertugrul, M.; Abdullah, N.H. A Hydrogen gas sensor based on TiO2 nanoparticles on alumina substrate. Sensors 2018, 18, 2483. [Google Scholar] [CrossRef]
  27. Moon, J.; Hedman, H.-P.; Kemell, M.; Tuominen, A.; Punkkinen, R. Hydrogen sensor of Pd-decorated tubular TiO2 layer prepared by anodization with patterned electrodes on SiO2/Si substrate. Sens. Actuators B. Chem. 2016, 222, 190–197. [Google Scholar] [CrossRef]
  28. Lee, J.H. Technological realization of semiconducting metal oxide–based gas sensors. In Gas Sensors Based on Conducting Metal Oxides; Elsevier: Amsterdam, The Netherlands, 2019; pp. 167–216. [Google Scholar]
  29. Weng, T.-F.; Ho, M.-S.; Sivakumar, C.; Balraj, B.; Chung, P.-F. VLS growth of pure and Au decorated β-Ga2O3 nanowires for room temperature CO gas sensor and resistive memory applications. Appl. Surf. Sci. 2020, 533, 147476. [Google Scholar] [CrossRef]
  30. Sertel, B.C.; Sonmez, N.A.; Kaya, M.D.; Ozcelik, S. Development of MgO: TiO2 thin films for gas sensor applications. Ceram. Int. 2019, 45, 2917–2921. [Google Scholar] [CrossRef]
  31. Chen, E.-X.; Fu, H.-R.; Lin, R.; Tan, Y.-X.; Zhang, J. Highly Selective and Sensitive Trimethylamine Gas Sensor Based on Cobalt Imidazolate Framework Material. ACS Appl. Mater. Interfaces 2014, 6, 22871–22875. [Google Scholar] [CrossRef]
  32. Alrammouz, R.; Podlecki, J.; Abboud, P.; Sorli, B.; Habchi, R. A review on flexible gas sensors: From materials to devices. Sens. Actuators A Phys. 2018, 284, 209–231. [Google Scholar] [CrossRef]
  33. Khan, S.; Ali, S.; Bermak, A. Recent developments in printing flexible and wearable sensing electronics for healthcare applications. Sensors 2019, 19, 1230. [Google Scholar] [CrossRef] [PubMed]
  34. Zhou, C.; Shi, N.; Jiang, X.; Chen, M.; Jiang, J.; Zheng, Y.; Wu, W.; Cui, D.; Haick, H.; Tang, N. Techniques for wearable gas sensors fabrication. Sens. Actuators B Chem. 2022, 353, 131133. [Google Scholar] [CrossRef]
  35. Bag, A.; Lee, N.E. Recent advancements in development of wearable gas sensors. Adv. Mater. Technol. 2021, 6, 2000883. [Google Scholar] [CrossRef]
  36. Wang, T.; Xu, H.; Wang, Y.; Zeng, Y.; Liu, B. Porous SnO2 triple-shelled hollow nanoboxes for high sensitive toluene detection. Mater. Lett. 2020, 264, 127320. [Google Scholar] [CrossRef]
  37. Liu, L.; Wang, Y.; Guan, K.; Liu, Y.; Li, Y.; Sun, F.; Wang, X.; Zhang, C.; Feng, S.; Zhang, T. Influence of oxygen vacancies on the performance of SnO2 gas sensing by near-ambient pressure XPS studies. Sens. Actuators B Chem. 2023, 393, 134252. [Google Scholar] [CrossRef]
  38. Kim, J.-H.; Mirzaei, A.; Kim, S.S.; Park, C. Pt nanoparticle decoration on femtosecond laser-irradiated SnO2 nanowires for enhancing C7H8 gas sensing. Sens. Actuators B Chem. 2023, 379, 133279. [Google Scholar] [CrossRef]
  39. Sun, K.M.; Song, X.Z.; Wang, X.F.; Li, X.; Tan, Z. Annealing temperature-dependent porous ZnFe2O4 olives derived from bimetallic organic frameworks for high-performance ethanol gas sensing. Mater. Chem. Phys. 2020, 241, 122379. [Google Scholar] [CrossRef]
  40. Katoch, A.; Sun, G.J.; Choi, S.W.; Byun, J.H.; Kim, S.S. Competitive influence of grain size and crystallinity on gas sensing performances of ZnO nanofibers. Sens. Actuators B Chem. 2013, 185, 411–416. [Google Scholar] [CrossRef]
  41. Katoch, A.; Abideen, Z.U.; Kim, J.H.; Kim, S.S. Crystallinity dependent gas-sensing abilities of ZnO hollow fibers. Met. Mater. Int. 2016, 22, 942–946. [Google Scholar] [CrossRef]
  42. Kim, J.-H.; Mirzaei, A.; Sakaguchi, I.; Hishita, S.; Ohsawa, T.; Suzuki, T.T. Decoration of Pt/Pd bimetallic nanoparticles on Ru-implanted WS2 nanosheets for acetone sensing studies. Appl. Surf. Sci. 2023, 641, 158478. [Google Scholar] [CrossRef]
  43. Mirzaei, A.; Kim, J.-H.; Kim, H.W.; Kim, S.S.; Kim, H.W. How shell thickness can affect the gas sensing properties of nanostructured materials: Survey of literature. Sens. Actuators B Chem. 2018, 258, 270–294. [Google Scholar] [CrossRef]
  44. Cao, H.; Hu, Z.; Wei, X.; Wang, H.; Tian, X.; Ding, S. Conductometric ethanol gas sensor based on a bilayer film consisting of SnO2 film and SnO2/ZnSnO3 porous film prepared by magnetron sputtering. Sens. Actuators B Chem. 2023, 382, 133562. [Google Scholar] [CrossRef]
  45. Barsan, N.; Weimar, U. Conduction model of metal oxide gas sensors. J. Electroceramics 2001, 7, 143–167. [Google Scholar] [CrossRef]
  46. Li, Z.; Zeng, W.; Li, Q. SnO2 as a gas sensor in detection of volatile organic compounds: A review. Sens. Actuators A Phys. 2022, 346, 113845. [Google Scholar] [CrossRef]
  47. Song, Z.; Zhang, L.; Zhou, Q.; Zhang, Z.; Dong, Z.; Nie, L. In-situ synthesis of needle-like PdO-decorated NiO thin films on Al2O3 substrates for high-performance H2 sensors. Ceram. Int. 2022, 48, 31746–31754. [Google Scholar] [CrossRef]
  48. Suzuki, T.; Sackmann, A.; Oprea, A.; Weimar, U.; Bârsan, N. Chemoresistive CO2 gas sensors based on La2O2CO3: Sensing mechanism insights provided by operando characterization. ACS Sens. 2020, 5, 2555–2562. [Google Scholar] [CrossRef] [PubMed]
  49. Agarwal, S.; Kumar, S.; Agrawal, H.; Moinuddin, M.G.; Kumar, M.; Sharma, S.K. An efficient hydrogen gas sensor based on hierarchical Ag/ZnO hollow microstructures. Sens. Actuators B Chem. 2021, 346, 130510. [Google Scholar] [CrossRef]
Figure 1. (a) Schematic of tubular sensor (b) fixing the tubular substrate before applying the sensing layer to it; (c) real image of the fabricated sensor on support.
Applsci 14 01567 g001
Figure 2. (a) XRD pattern of commercial SnO2 particles. (bd) SEM images of commercial SnO2 particles at different magnifications.
Applsci 14 01567 g002
Figure 3. (a) SEM micrograph; (b) EDS mapping of (c) “Sn” and “O” elements; (d) EDS spectrum of SnO2 powders.
Applsci 14 01567 g003
Figure 4. (a) XPS survey of commercial SnO2 particles, (b) O1s and (c) Sn 3d XPS core-levels.
Applsci 14 01567 g004
Figure 5. (a) Sensing plots of SnO2 gas sensors with one, two, and three layers over the substrate to different amounts of H2 at 300 °C (10, 50, 100, 500, and 1000 ppm); (b) sensing calibration plots of sensors with different layers.
Applsci 14 01567 g005
Figure 6. (a) Dynamic sensing curves of SnO2 gas sensor applied to tubular substrate with different numbers of rotations (5, 10, 15, and 20 times) when exposed to various amounts of H2 gas at 300 °C. (b) Relevant sensing calibration graphs when the substrate was exposed to various amounts of H2 under various rotations.
Applsci 14 01567 g006
Figure 7. (a) Sensing plots of SnO2 gas sensor applied to tubular substrate with different rotation speeds (5, 7, and 12 rpm) to various concentrations of H2 gas at 300 °C. (b) Corresponding sensing calibration plots.
Applsci 14 01567 g007
Figure 8. Response of optimized SnO2 sensor versus annealing temperature to 10 ppm H2 gas at 300 °C. Inset depicts dynamic resistance curves of SnO2 sensors applied on tubular substrates under optimized conditions and annealed at various temperatures (400–700 °C) to 10 ppm H2 gas.
Applsci 14 01567 g008
Figure 9. Response time of optimized SnO2 sensor to 10, 50, 100, 500, and 1000 ppm H2 gas at 300 °C.
Applsci 14 01567 g009
Figure 10. Selectivity histogram of optimized SnO2 sensor at 300 °C to 10 ppm of different gases.
Applsci 14 01567 g010
Figure 11. Sensing mechanism of SnO2 particles gas sensor to H2 gas: (a) change in thickness of EDL in the presence of H2 gas; (b,c) decrease in the height of double Schottky barriers in contact points between SnO2 particles in the presence of H2 gas.
Applsci 14 01567 g011
Disclaimer/Publisher’s Note: The statements, opinions and data contained in all publications are solely those of the individual author(s) and contributor(s) and not of MDPI and/or the editor(s). MDPI and/or the editor(s) disclaim responsibility for any injury to people or property resulting from any ideas, methods, instructions or products referred to in the content.

