Article

Mobile Network Operators’ Assessment Based on Drive-Test Campaign in Urban Area for iPerf Scenario

Institute of Communications Systems, Faculty of Electronics, Military University of Technology, 00-908 Warsaw, Poland
*
Author to whom correspondence should be addressed.
Appl. Sci. 2024, 14(3), 1268; https://doi.org/10.3390/app14031268
Submission received: 4 January 2024 / Revised: 24 January 2024 / Accepted: 26 January 2024 / Published: 3 February 2024
(This article belongs to the Special Issue 5G/6G Mechanisms, Services, and Applications)

Abstract

:
The development of new telecommunication services requires the implementation of advanced technologies and the next generations of networks. Currently, the Long-Term Evolution (LTE) is a widely used standard. On the other hand, more and more mobile network operators (MNOs) are implementing the fifth-generation (5G) New Radio standard in their networks. It allows for increasing throughput, spectral, and energy efficiency and maximizing coverage, while reducing latency. The effectiveness of the introduced changes is measured by assessing the quality of service (QoS) in mobile networks. The paper presents the result evaluation of the QoS measurement campaign carried out using the drive test method in an urban area for four MNOs. We analyze the data transmission scenario, which is the basis of most modern telecommunications services. The result comparison provides an assessment of the 5G service implementation advancement by MNOs. In this analysis, we consider many QoS metrics (e.g., session time, throughput, and round-trip time) and parameters defining the radio signal quality (i.e., reference signal received power, signal-to-interference-plus-noise ratio). Our work also included searching for relationships between these parameters, using a correlation analysis. It allows for the selection of uncorrelated parameters to assess the quality of network, i.e., MNO evaluation, in terms of the provided QoS.

1. Introduction

Implementing and improving assessment mechanisms of the quality of service (QoS) and quality of network (QoN) in digital telecommunications have resulted in the dynamic development of cellular networks and a large diversity of services provided to subscribers and users. It is worth noting that QoS and QoN metrics are the basis for evaluating subsequent generations of mobile networks. For example, for the fifth-generation (5G) New Radio (NR), so-called International Mobile Telecommunications (IMT) for 2020 (IMT-2020), parameters such as user experienced or peak data rates, latency, area traffic capacity, connection density, and spectrum and network energy efficiency are used to show significant improvement in network performance and QoS compared to fourth-generation (4G), i.e., Long-Term Evolution (LTE) or IMT-Advanced, networks [1]. This type of approach and these metrics are also used in political, social, and economic solutions, e.g., in determining the targets and objectives for the development of the digital environment in Europe for 2030, the so-called European Digital Decade [2].
QoS assessment is carried out by mobile network operators (MNOs), providers of services and mobile applications, telecommunications market regulatory authorities [3], and, increasingly often, users of networks and services. QoS measurement from the MNO or user sides can be performed at the network level. Generally, the first approach is only available to MNOs. It is used to optimize the allocation of radio resources to individual users/services [4,5]. However, the second approach can be used by both users and professional companies that provide QoS measurement and MNO evaluation services, e.g., on behalf of regulatory authorities or MNOs themselves [6,7]. Such measurements conducted by independent companies can give the MNOs objective information on QoS and QoN. From the viewpoint of the average network user, assessing QoS (e.g., specific values of throughput or latency) is usually too technical and incomprehensible. Therefore, the so-called quality of experience (QoE), related to the subjective perception of the service, is increasingly analyzed. It is crucial when assessing the smoothness and quality of video or voice transmissions, teleconferencing, online games, website and social media content’s downloading speed, or data transmission speed. The need for user involvement to evaluate QoE is a significant drawback of this approach. Hence, automatons (i.e., machines) or artificial intelligence algorithms are increasingly used for this purpose [8,9,10,11].
Implementing a specific service, e.g., data transmission or video streaming, is necessary to assess the QoS or QoE for such a service. From the viewpoint of professional companies providing services in the QoS/QoE/QoN evaluation, this forces the use of the so-called active measurements. For this purpose, user equipment (UE) operating in the network of a selected MNO is used to realize a specific service, which allows for the QoS/QoE assessment. This approach does not make it possible to assess QoN or MNO continuously and independently of the service provided. Hence, when performing active QoS/QoE measurements, the so-called passive measurements are carried out using scanners. Then, the power and quality of reference signals transmitted by the base stations of a selected MNO are measured, regardless of the provided connections or services [7].
In modern communication networks, QoS has witnessed substantial advancements, with a focus on addressing the challenges posed by the deployment of 4G, 5G, and emerging technologies. One of the innovative directions of development is the integration of machine learning (ML) models to optimize network performance [12,13]. A. Al-Thaedan et al. propose an ML framework for predicting downlink (DL) throughput in 4G and 5G networks, showcasing the need for advanced design and optimization methodologies [13]. Similarly, D. Minovski et al. adopt a comprehensive approach by utilizing ML models for throughput prediction in LTE and 5G networks, with a particular emphasis on real-life measurements and network slices’ performance benchmarking [12].
Another prevalent area of investigation in the literature is the performance analysis of mobile broadband networks in diverse scenarios. A.A. El-Saleh et al. provide a detailed analysis of mobile broadband performance in urban settings [14]. The authors of [15,16,17] show results of drive test campaign for LTE and 5G networks in Malaysia. Throughput measurements performed in urban [16] and rural [15,17] environments allowed us to assess the benefits and transition potential from 4G to 5G non-standalone (NSA) networks. Meanwhile, Ref. [18] focuses on 5G performance measurements in the context of bus transportation systems, emphasizing the need for tools to identify and enhance services. S. Horsmanheimo et al. focus on studying 4G/5G mobile network technologies applied to smart city unmanned aerial vehicle (UAV) services [19]. The results indicate that 5G is more sensitive to altitude changes than 4G, which should be considered in future mobile network planning. On the other hand, an analysis of specific services could be valuable from the end-user perspective. Therefore, some measurement campaigns concentrate on selected services, such as WhatsApp [20], YouTube [7], and web browsing [21].
Aspects of QoE evaluation and measurement, in addition to QoS, are often considered in the literature, e.g., [22,23,24]. A mapping model of 5G key performance indices (KPIs) to QoS and, finally, to QoE metrics is proposed in [23]. Meanwhile, the authors of [24] analyze the impact of software components and virtualization usage on 5G network performance. Furthermore, the authors of [22] delves into the measurement processes of QoS and QoE in 5G technology, highlighting the diverse approaches and the absence of specific standards for 5G. The paper emphasizes the importance of tailoring measurement processes to the specific location and conditions of 5G implementation, offering valuable insights for effective QoS and QoE assessments in diverse scenarios.
KPI measurements in a 5G NSA network are considered in [25]. The paper compares the results against actual hands-on 4G network measurements, confirming the expected superiority of 5G in basic KPIs, including up- and DL throughput, latency, and jitter, using different tools, e.g., iPerf, iPerf3 [26], and Cisco TRex. Moreover, utilization of other KPI measurement tools to assess the throughput and latency for mobile phones is described in [27].
Signal metrics are often the basis for estimating QoS metrics, especially those related to transmission rate or spectrum efficiency. It results from certain theoretical premises, i.e., the Shannon–Hartley theorem [28]:
C = B log 2 ( 1 + S N R ) ,
where C and B are the channel capacity and bandwidth, respectively; and S N R is the signal-to-noise ratio (SNR).
Capacity is the boundary value of the throughput that can be achieved for the given bandwidth and signal quality (i.e., SNR). On the other hand, the parameter C / B 
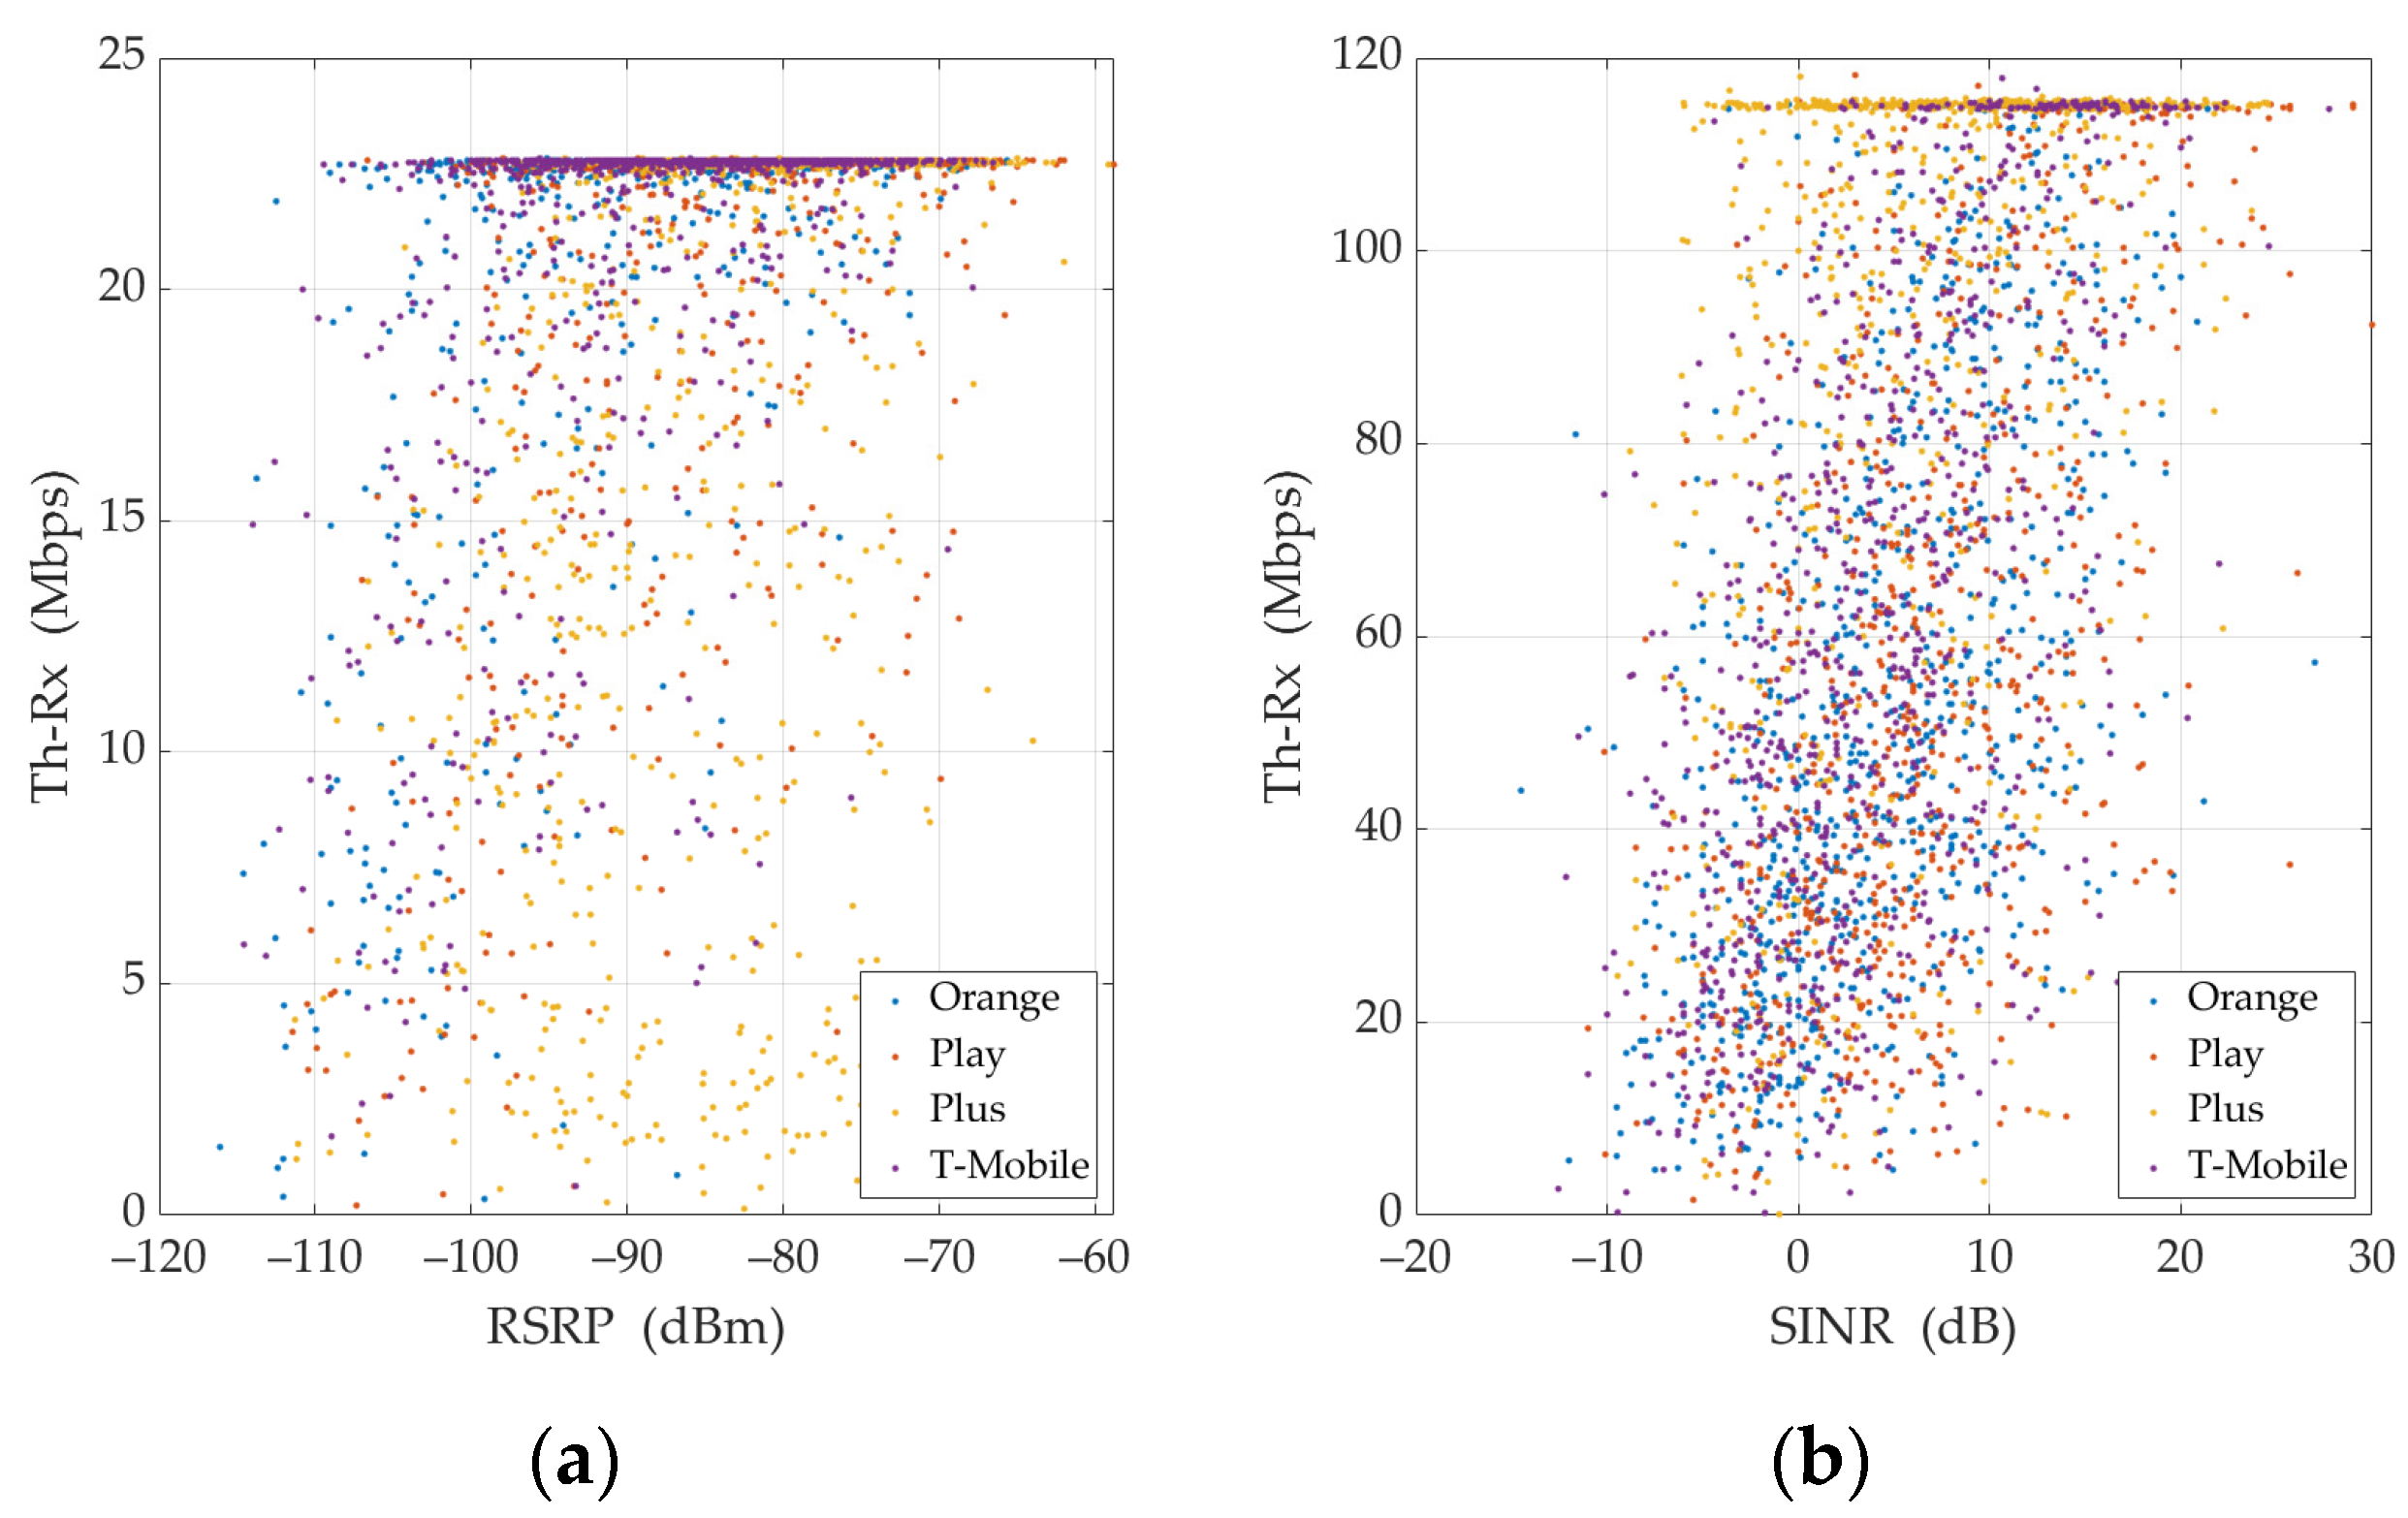
is referred to as spectrum efficiency. Equation (1) implies that throughput should be directly related to a signal quality measure. In the case of mobile networks, the primary metric determining the received signal quality is the signal-to-interference-plus-noise ratio (SINR). However, in practice, a parameter determining the received signal power, i.e., reference signal received power (RSRP), is more often used to estimate throughput. This approach is proposed by M. Lorenz [29], an expert from Rohde & Schwarz (R&S) company. A similar methodology was also used to determine the capacity (i.e., boundary throughput) in LTE and 5G networks by the Polish regulatory authority (i.e., the Office of Electronic Communications) when developing requirements for MNOs related to a 5G auction for the C band [
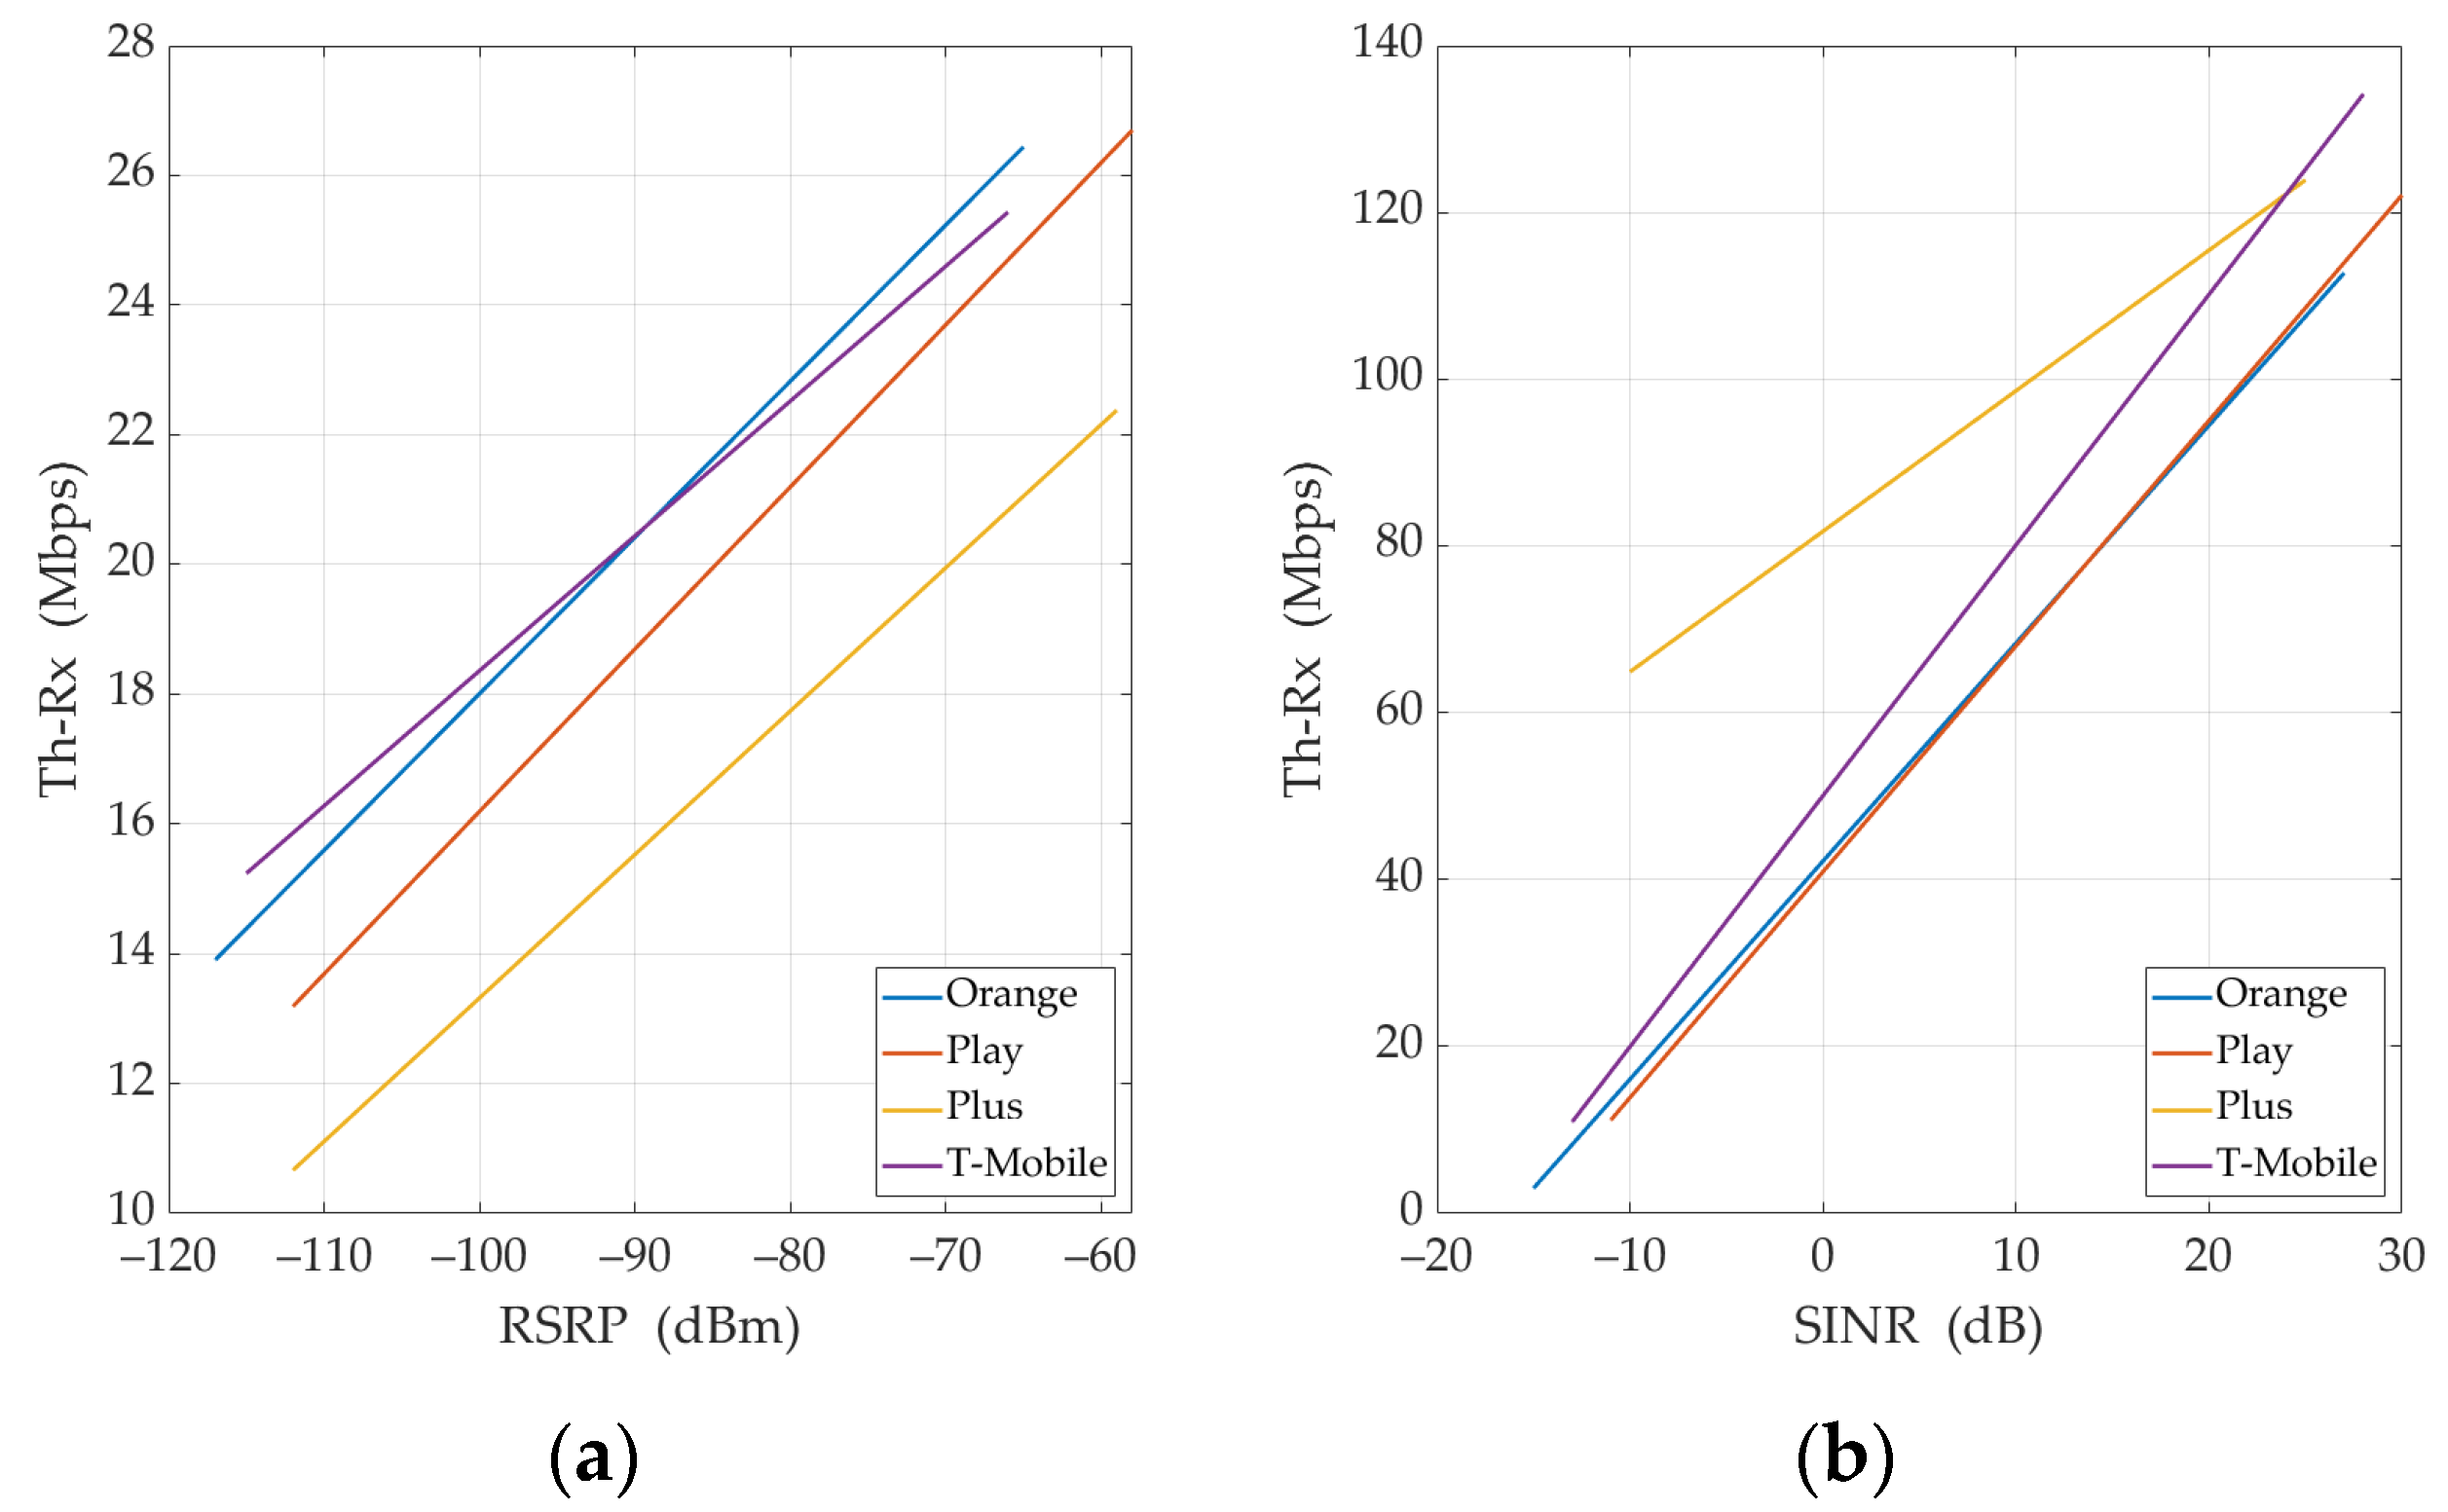
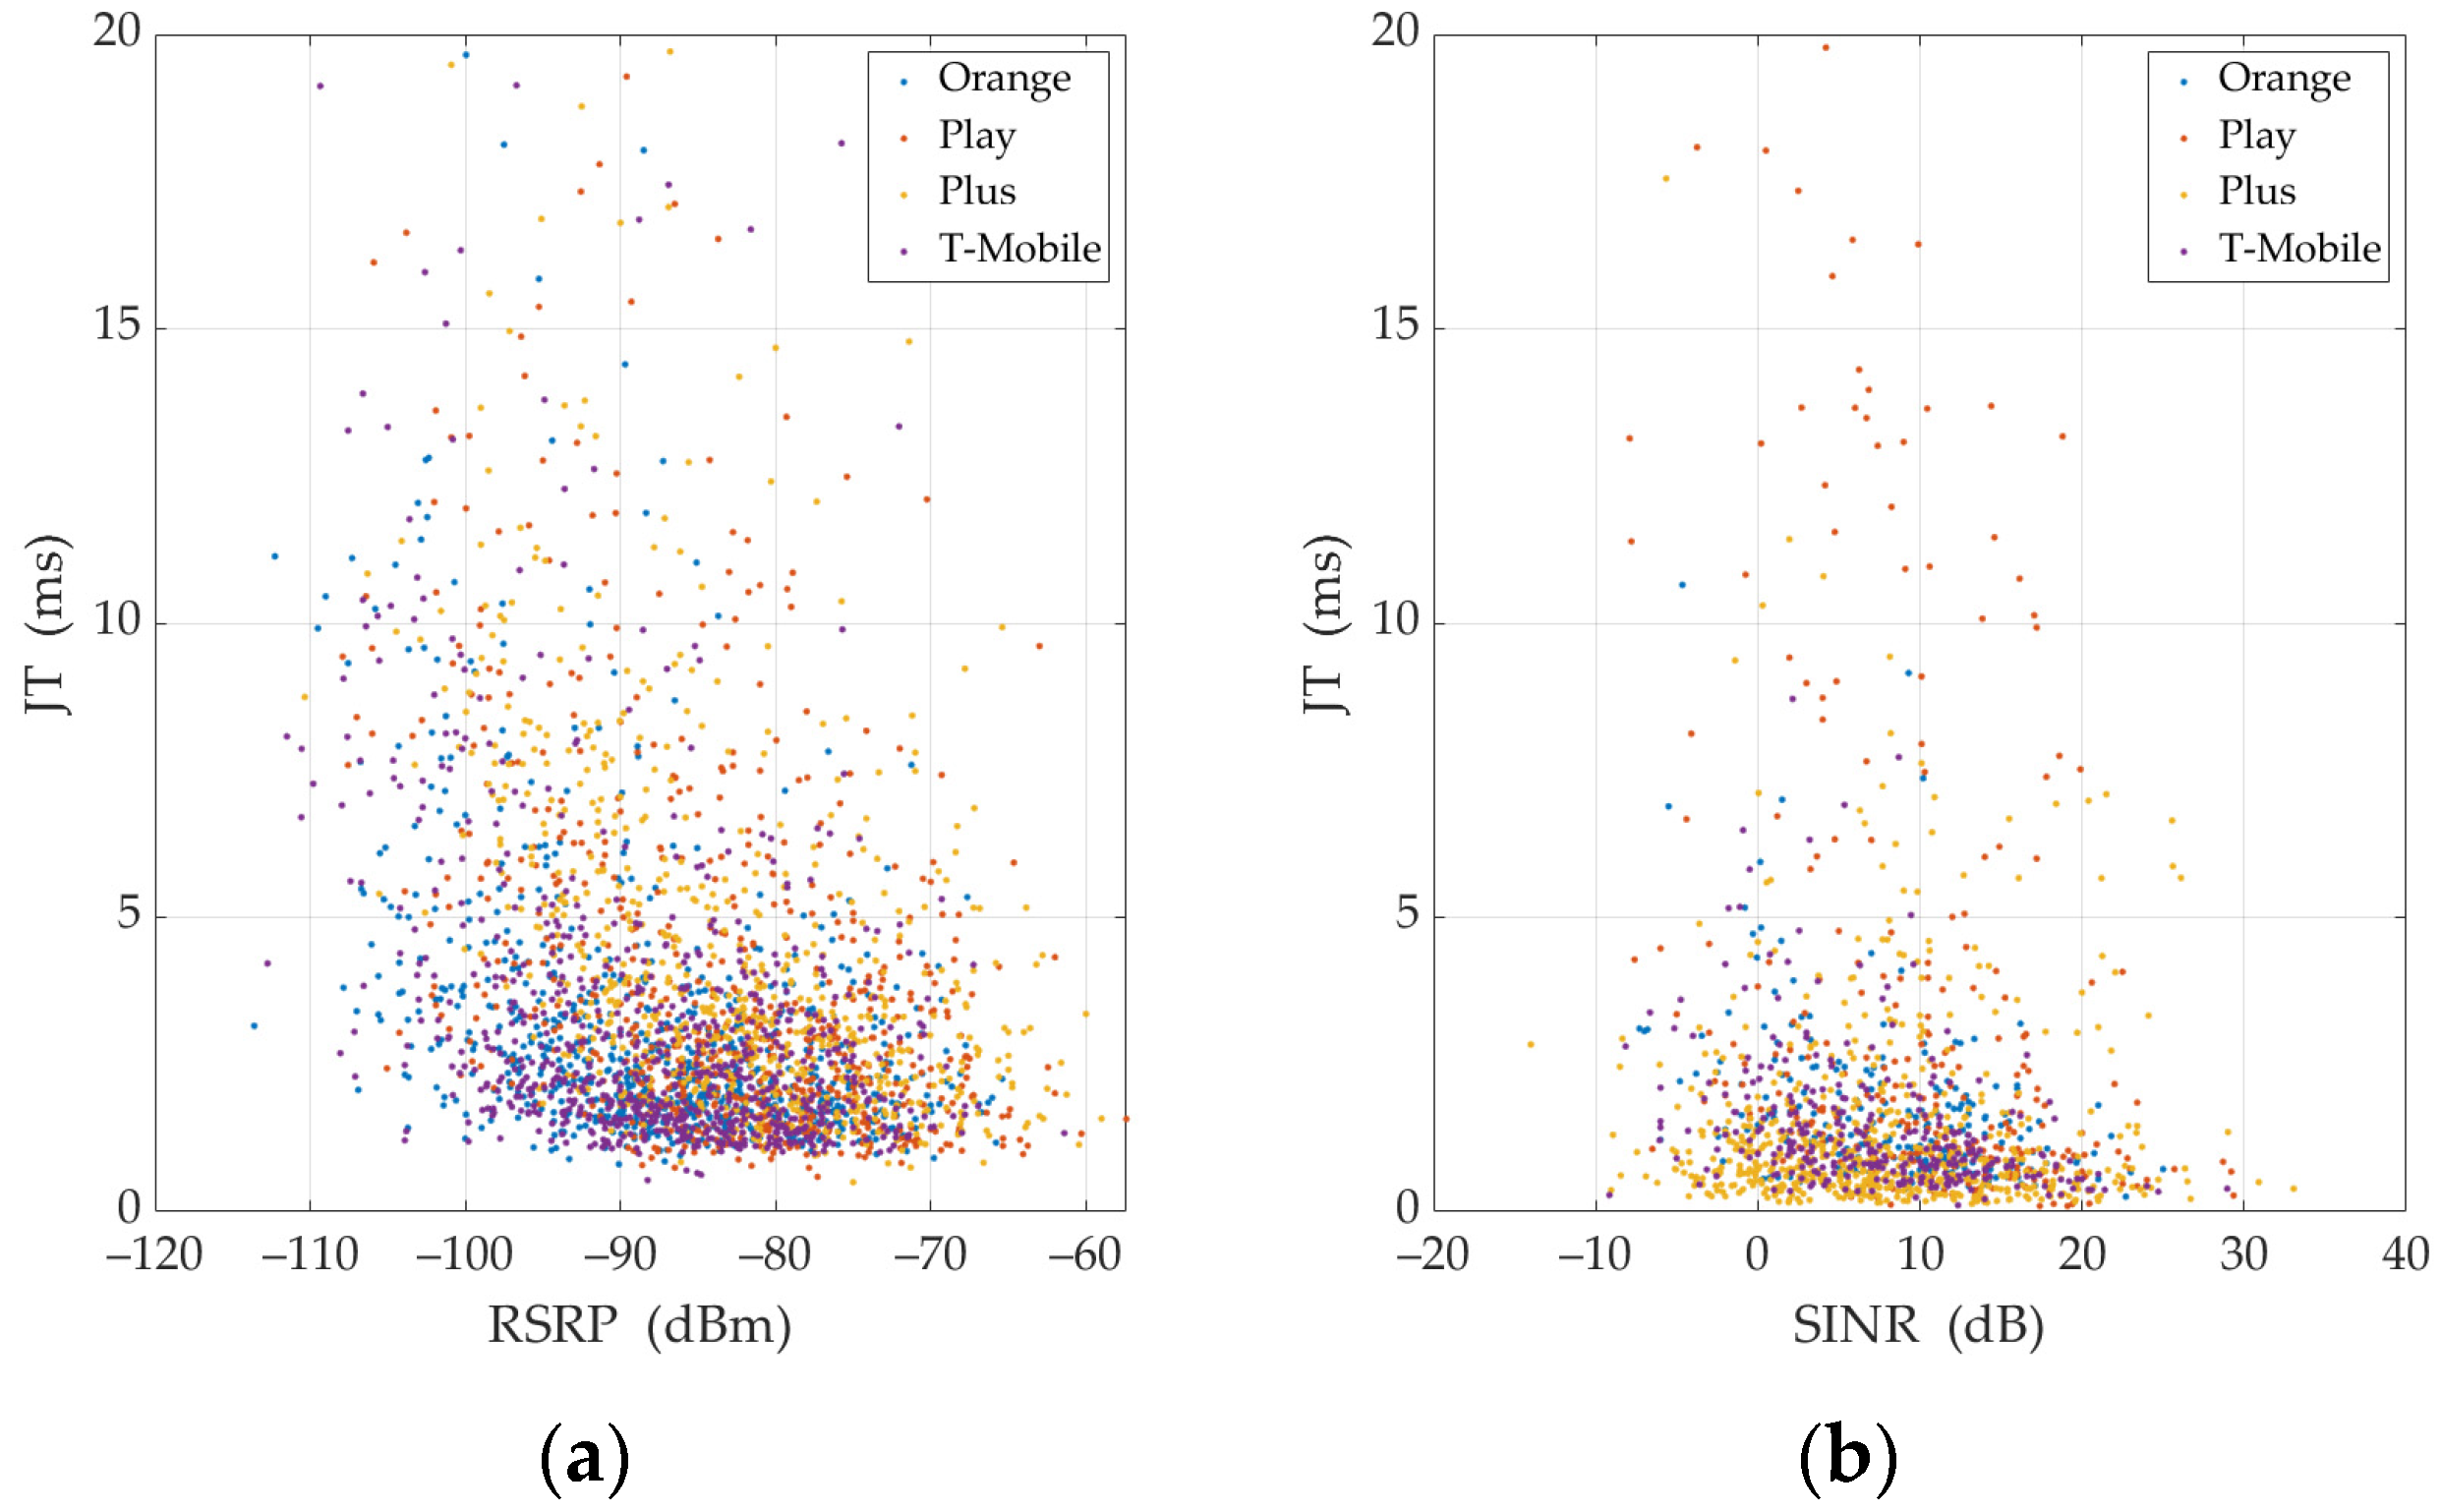
30]. However, we propose a novel approach: using RSRP and SINR for throughput and jitter estimation in UL and DL, respectively.
The main aim of this paper is an analysis of relationships between radio reference signal parameters (such as RSRP, SINR, or Reference Signal Received Quality (RSRQ)) and QoS metrics (i.e., throughput and jitter) in the 5G network. We analyzed the scenario of throughput assessment by using the iPerf application [26,31,
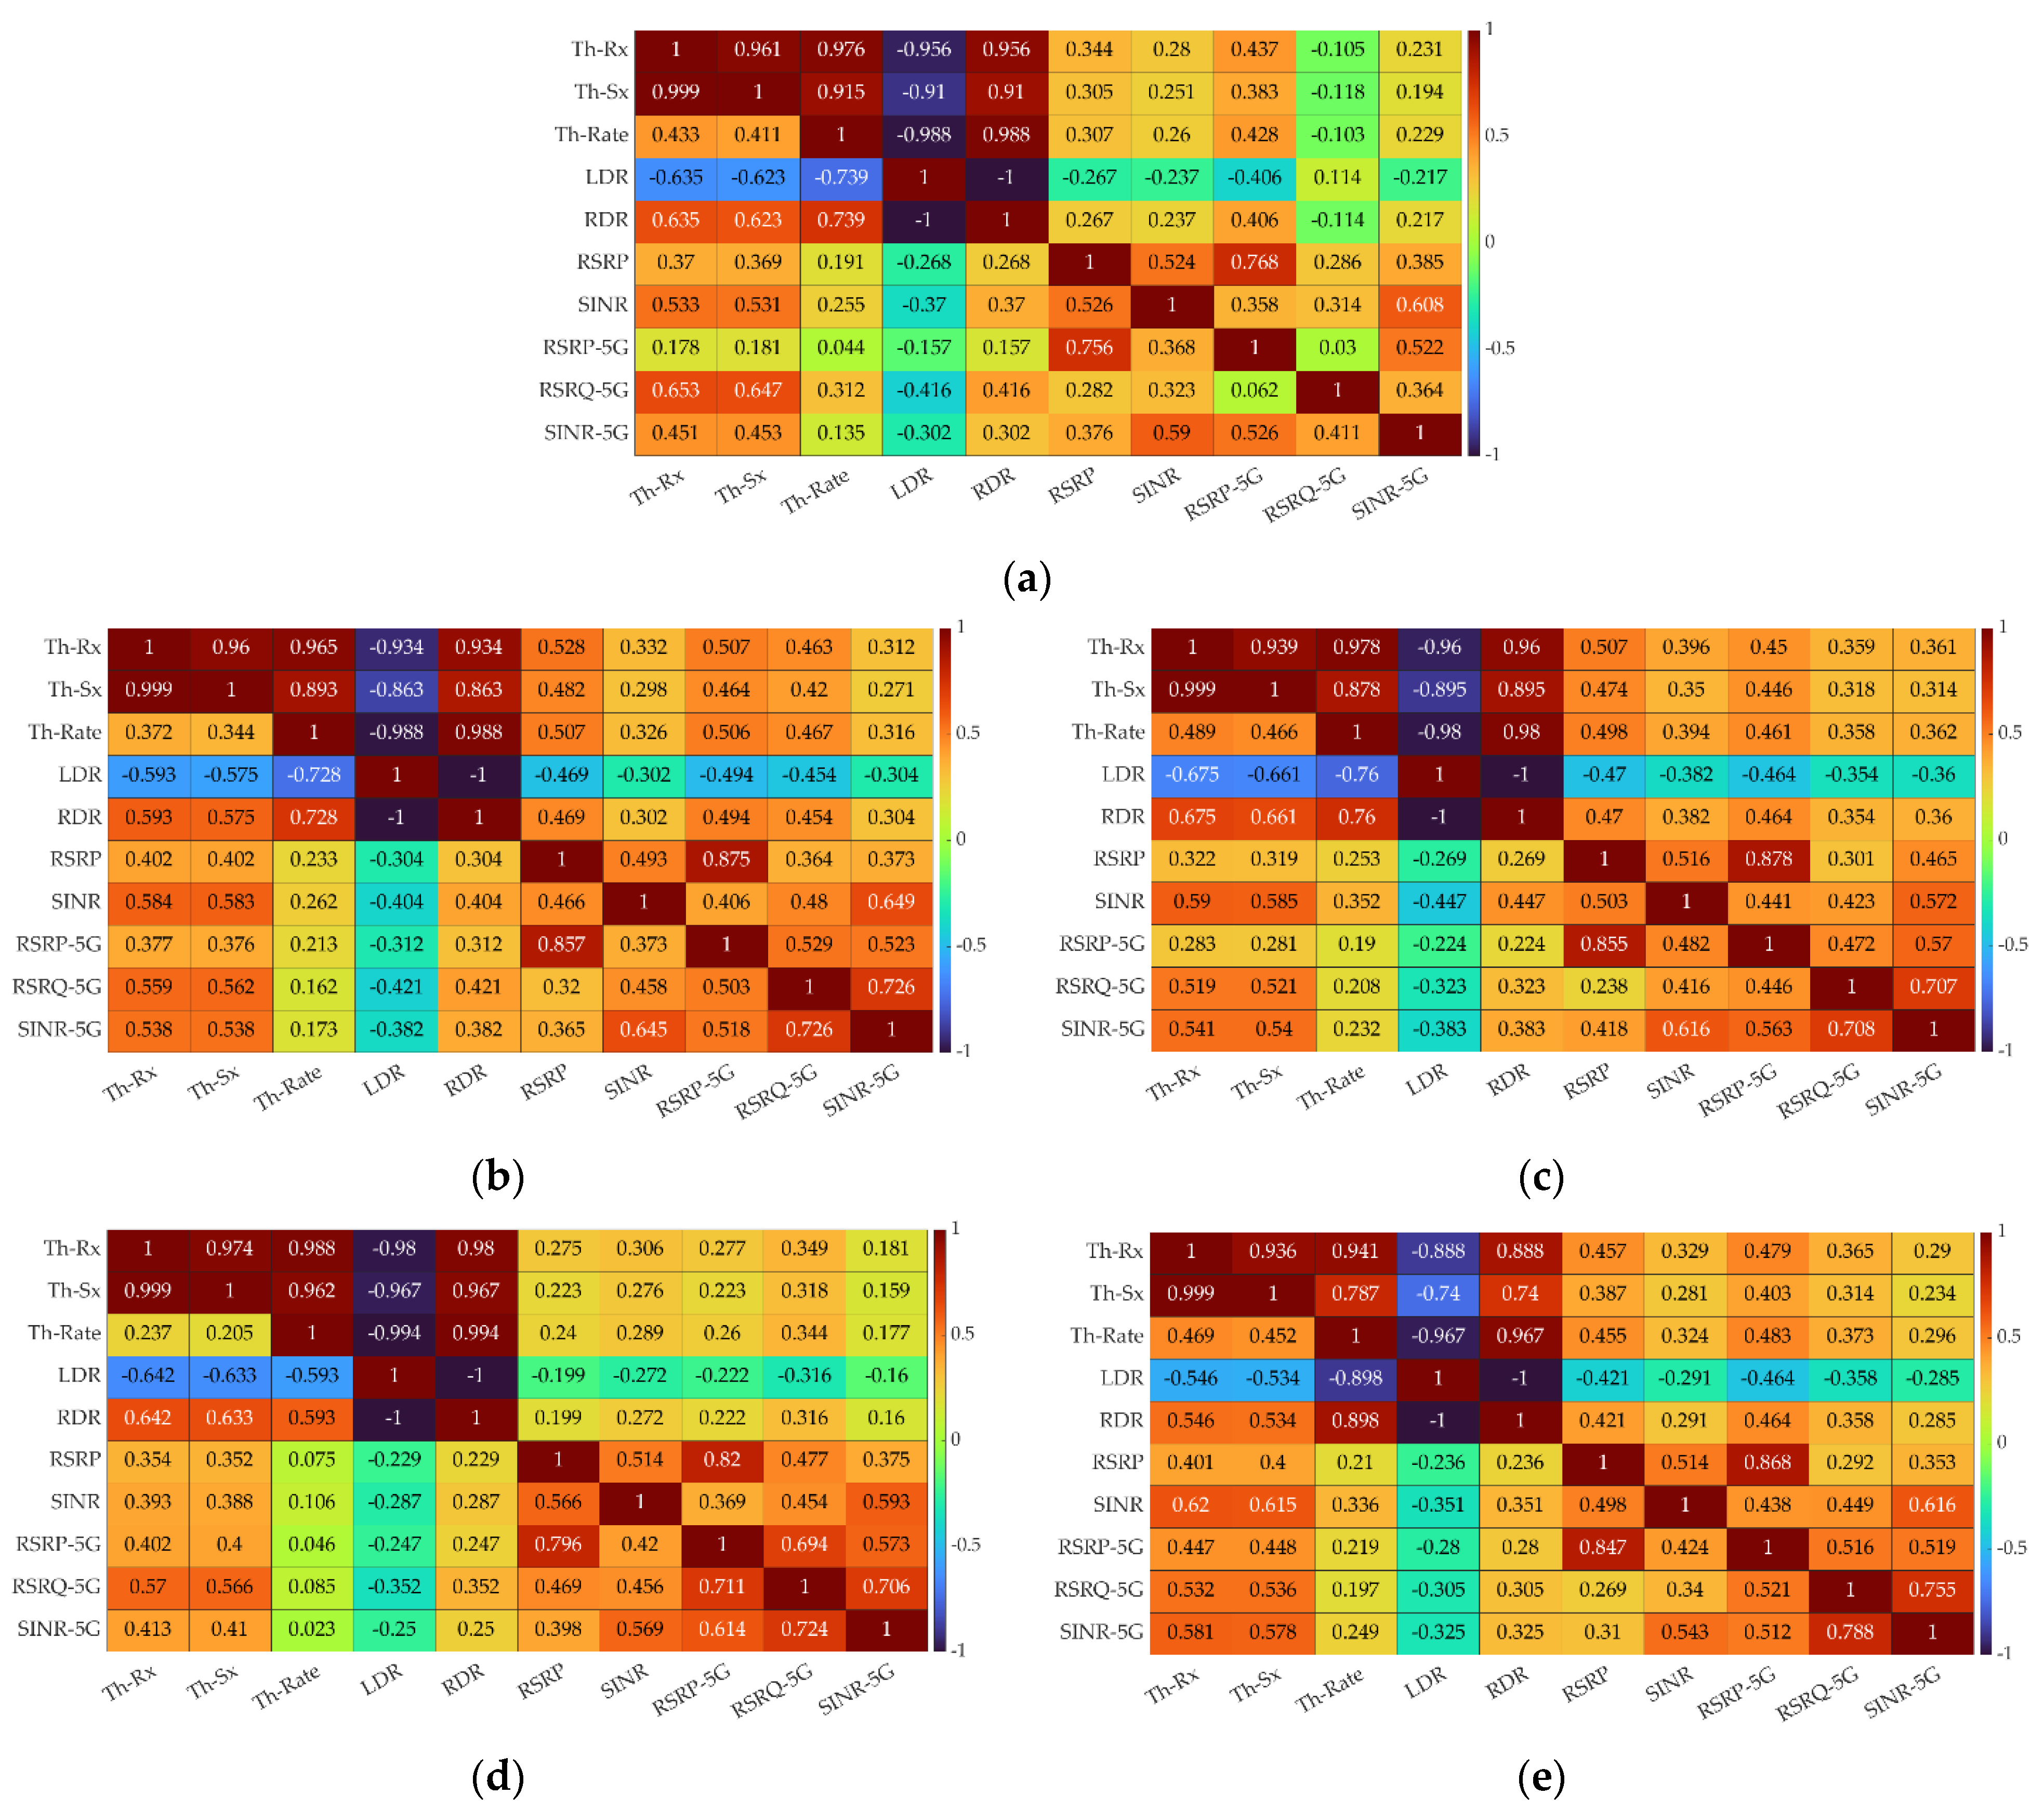
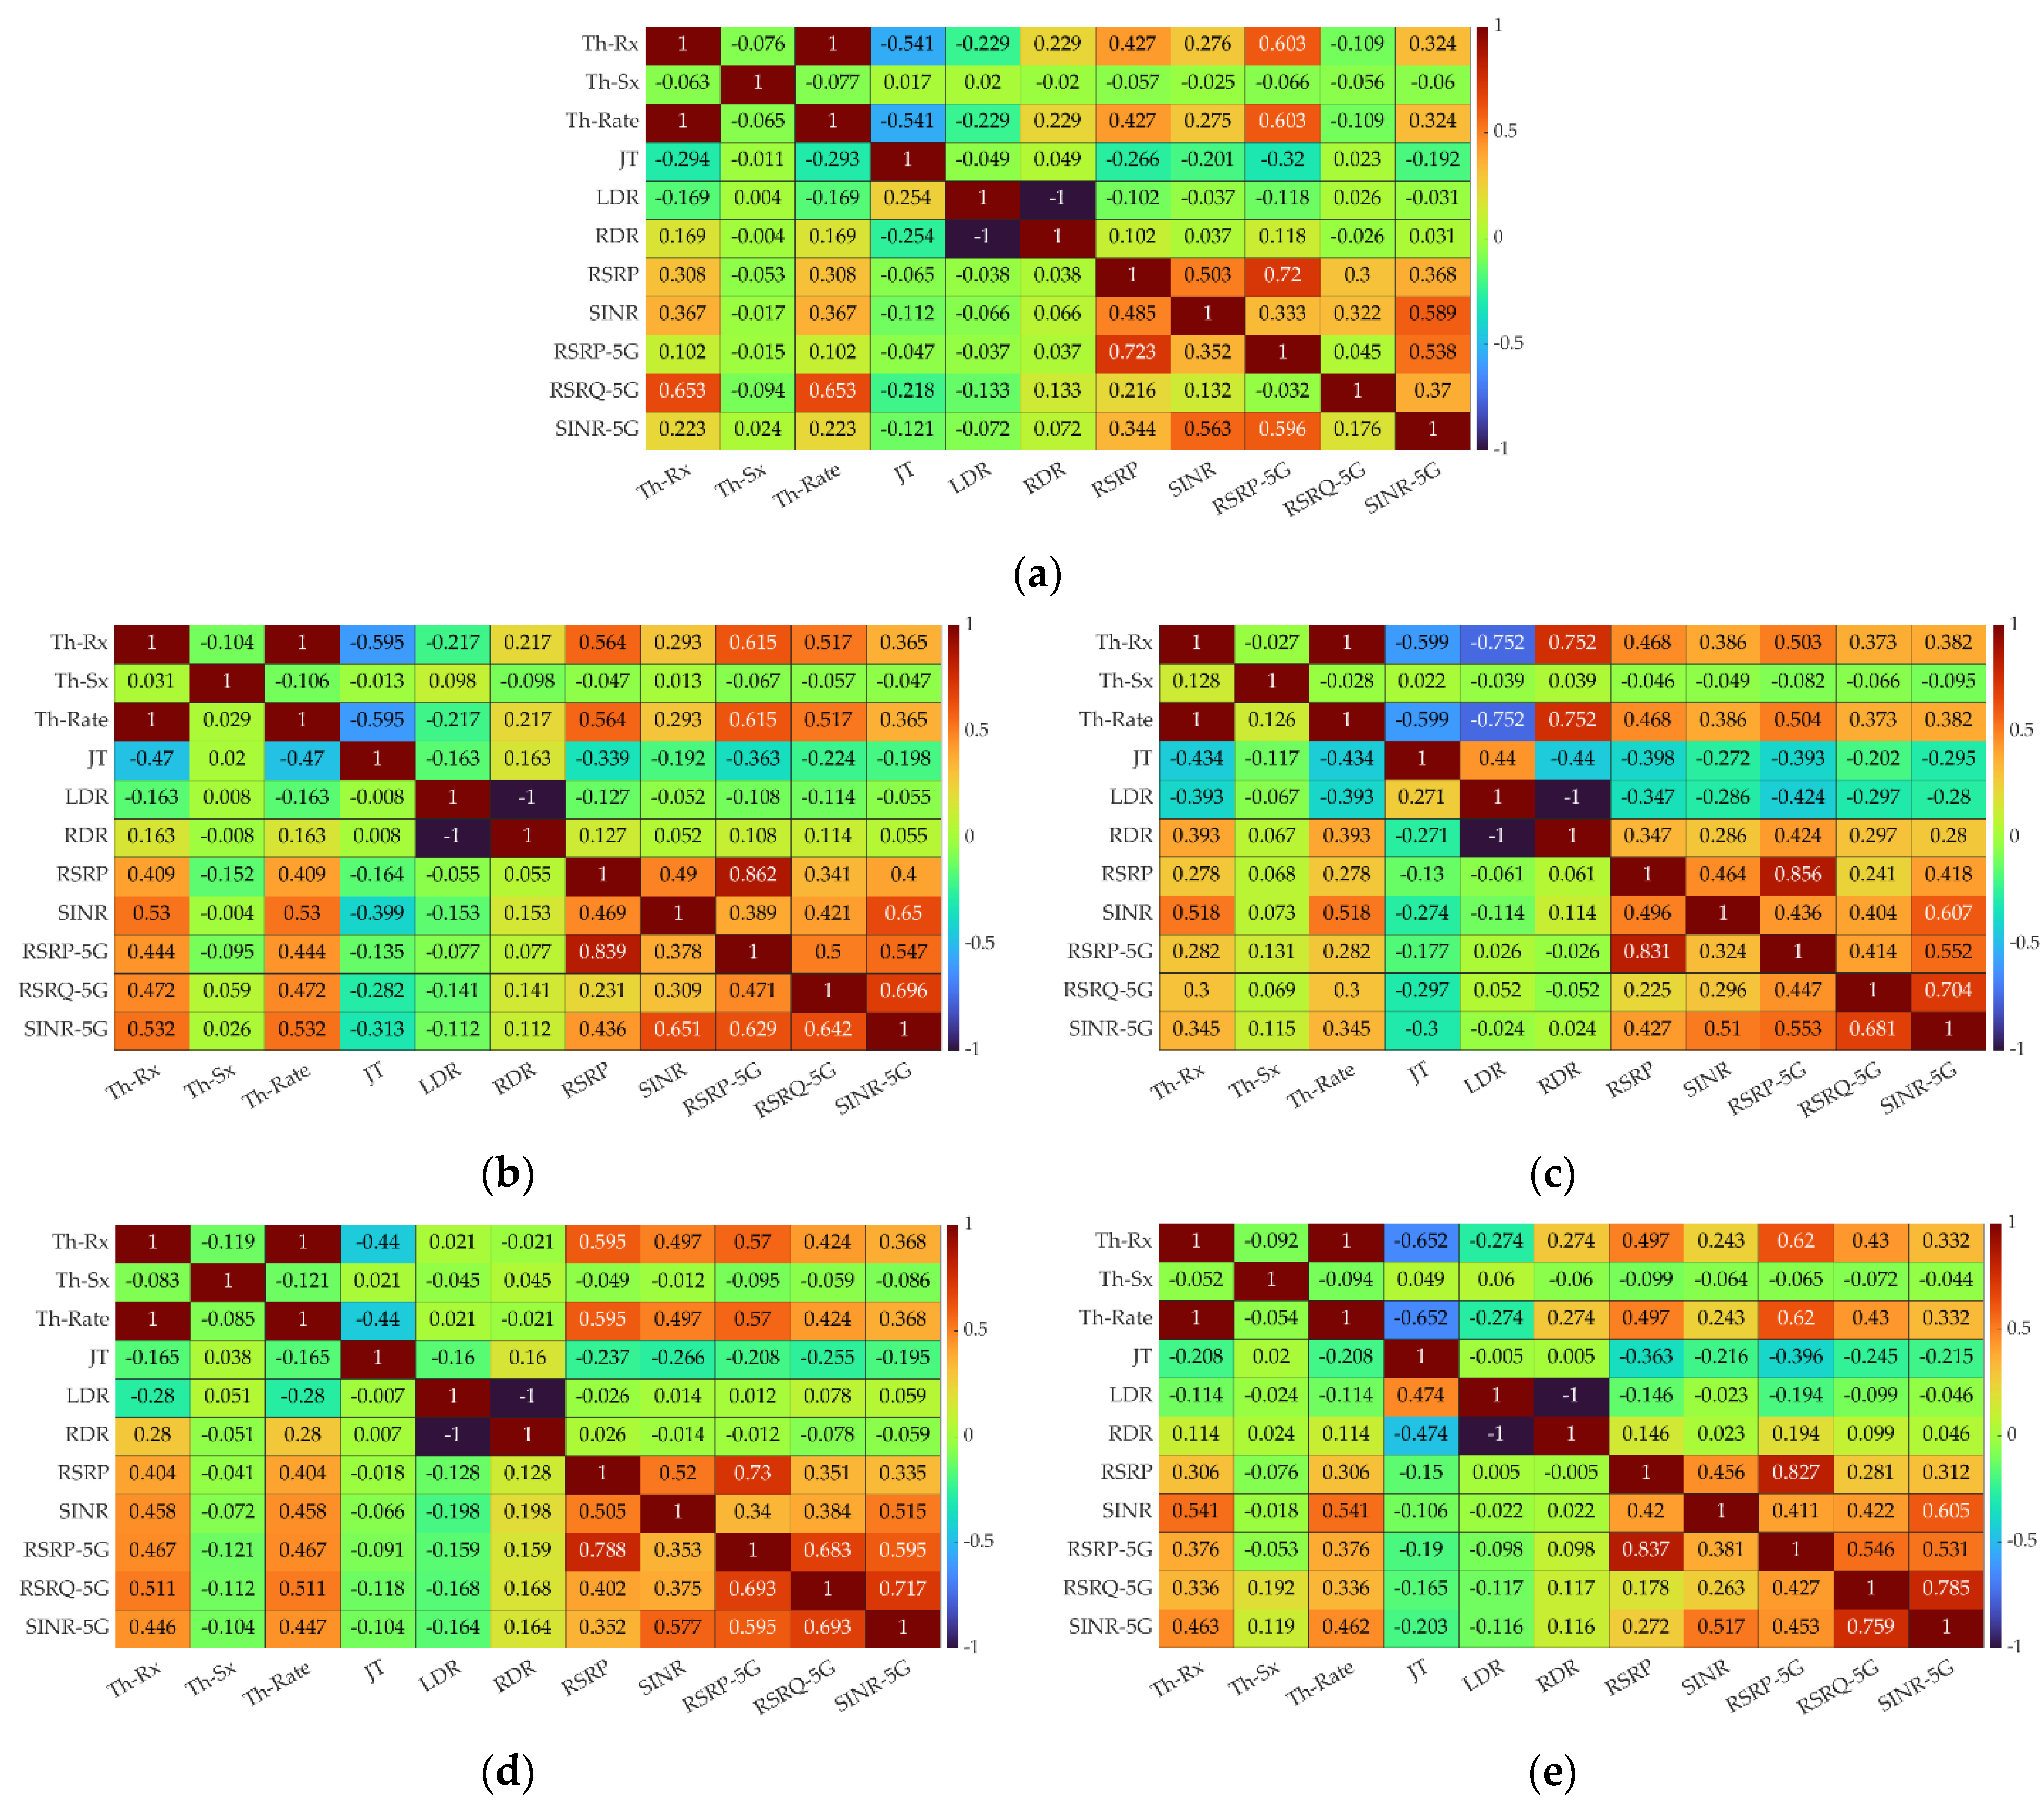
32] and a measurement testbed based on R&S equipment. Measurements in Warsaw for four MNOs were performed by the Systemics-PAB company as part of the drive test campaign. Systemics-PAB provides QoS/QoE assessment services in mobile networks. In the analyzed scenario, throughput and lost datagrams rates are measured for Transmission Control Protocol (TCP) and User Datagram Protocol (UDP) in both uplink (UL) and DL. Additionally, jitter is measured for UDP. In the drive tests, the measurement of signal metrics, i.e., RSRP, SINR, and RSRQ, was performed. The measurements were carried out at the 2.1 and 2.6 GHz bands. In the mobile network, the coverage and capacity issues are connected with the QoS and radio signal parameters. However, based on the collected measurement data, we cannot unambiguously draw conclusions about coverage and capacity. From a propagation viewpoint, the range of base stations for the analyzed bands are similar. Therefore, we may expect the areal aspect of the coverage to be similar for these bands and all MNOs. We calculate correlation coefficients for various pairs of measured parameters, similarly to [13]. The obtained results are the basis for selecting the best signal parameters for estimating throughput or other signal metrics. This approach can also be used in modeling some parameters based on others. Finally, the obtained results allow for the assessment of the MNOs regarding 5G network availability and provided QoS.
Our key contributions are as follows:
  • Selection of measurement data and correlation analysis of QoS metrics for iPerf scenario, four MNOs, TCP and UDP, and UL and DL based on drive-test measurement campaign in Warsaw;
  • Analysis of linear regression between QoS parameters, which can be used in their modeling or estimation;
  • Linking the obtained results with radio resources used by individual MNOs and their radio access network (RAN);
  • Discussion of the results and MNO comparison based on the assessment of the correlation level of QoS parameters;
  • Original approach to the classification/identification of MNOs in Poland based on the RSRQ-5G measurement.
The remainder of the paper is organized as follows. In Section 2, we describe the measurement scenario, testbed, iPerf application, and the QoS and reference signal metrics measured in the drive test campaign. The correlation analysis and relationships between QoS parameters are presented in Section 3 and Section 4, respectively. A discussion of the results, including the comparison of MNOs, is contained in Section 5. Section 6 provides a summary.

2. Drive Test Campaign

2.1. Measurement Scenario

The QoS analysis was carried out based on a 33.5-h drive test campaign in an urban environment that was performed on 23–27 September of the 2021 year by the Systemics-PAB company, which provides a QoS/QoE assessment in mobile networks for MNOs, regulatory authorities, or other entities [33]. The time scheme of the tests is presented in Table 1.
The measurement campaign was carried out for four MNOs: Orange, T-Mobile, Play, and Plus, called Orange Polska, T-Mobile Polska, P4, and Polkomtel, respectively. They are global MNOs providing 4G/5G services in Poland. In the following, we use the shorter brand-name MNOs.
Nowadays, the MNOs use 5G NSA technology. Two methods of ensuring transmission for 5G services are implemented in their networks [33]:
  • Dynamic sharing of 10 or 15 MHz channels within a frequency band at 2.1 GHz for 5G or LTE services, used by Orange, T-Mobile, and Play;
  • Providing a 40 MHz channel within a frequency band at 2.6 GHz used by Plus.
The detailed description of frequency allocation for each MNO is presented in Appendix A.
The purpose of the drive tests was to collect statistically representative measurement data enabling the assessment of the network readiness of four Polish MNOs in Warsaw to support 5G services concerning the service scenarios defined in ‘Mobile and wireless communications Enablers for the Twenty-twenty Information Society-II’ (METIS II) project [
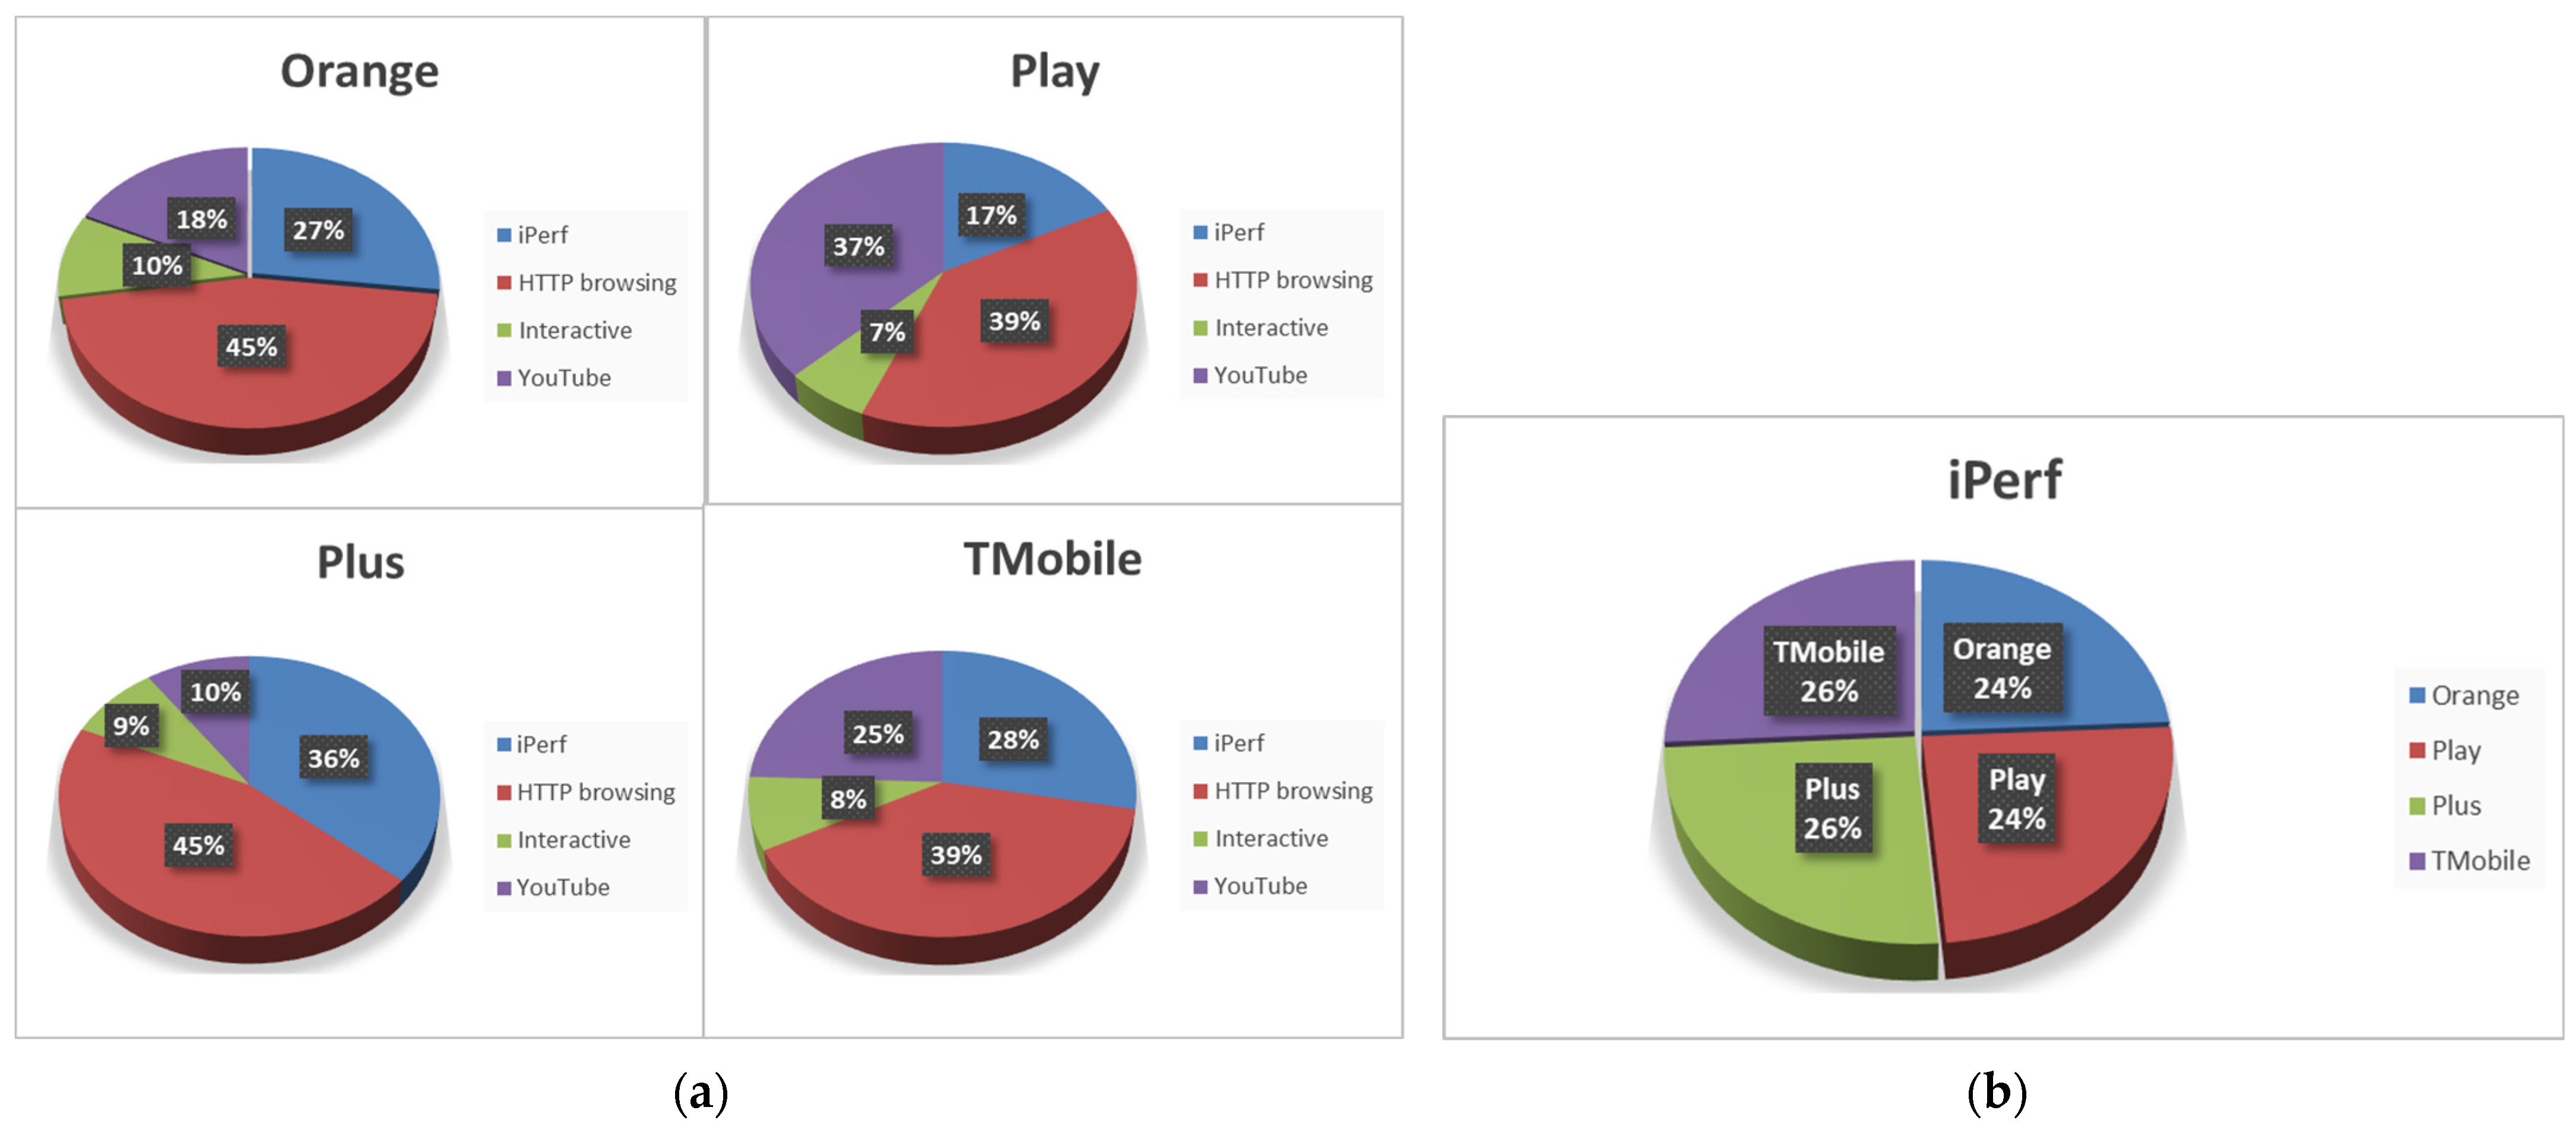
34]. It was possible by conducting a complete set of tests, such as interactive data transmission, iPerf-supported tests, sequential web browsing, and multimedia streaming transfers based on YouTube service. Table 2 presents the number of measurements (so-called bins) for the tested services per each MNO. The total number of performed measurements (bins) was 46,608, of which 340 were incorrect (i.e., lack of a complete set of measured parameters). Figure 1 presents the percentage of the analyzed service bins for each MNO and the percentage of MNO bins in the iPerf test. In this paper, we only analyzed the measurement results for the iPerf tests. We will continue our studies for other services shortly.
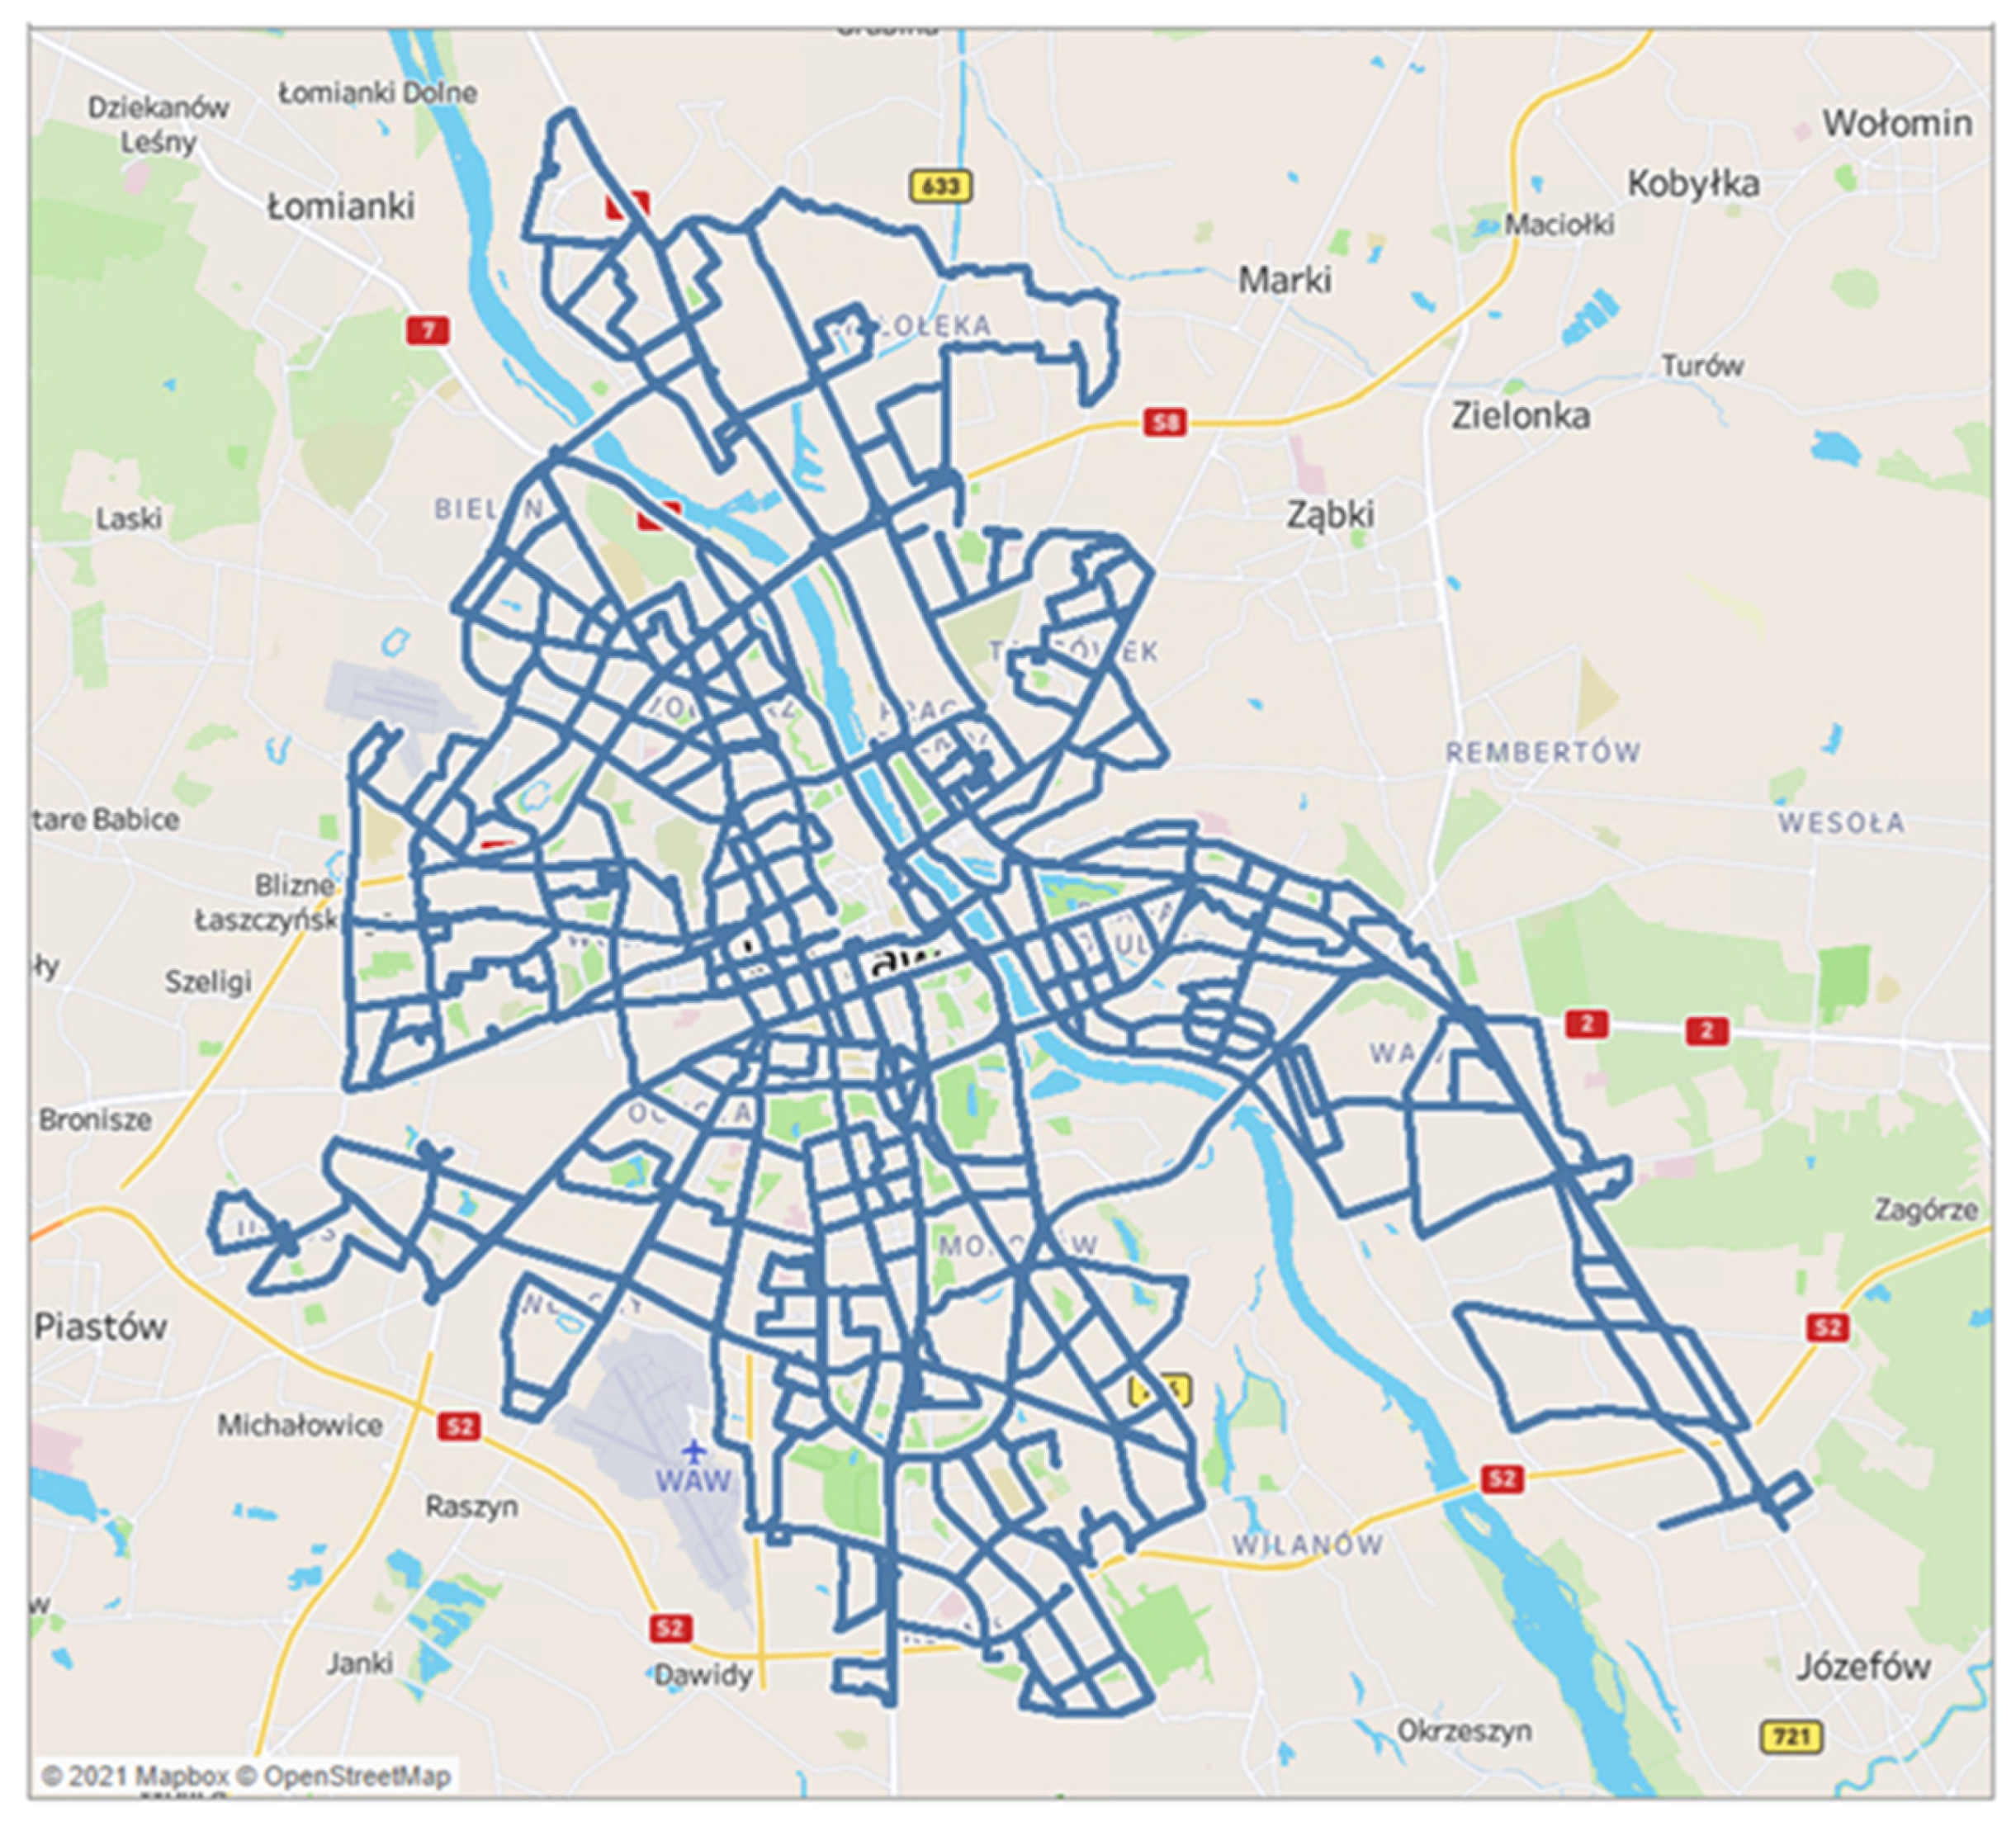
The measurement campaign was carried out in the Capital City of Warsaw. Figure 2 illustrates the measurement vehicle route during the drive test campaign [33]. The average speed of the measurement vehicle varied between 0 and 105 km/h.

2.2. Measurement Testbed

Drive tests were realized using the mobile testbed installed on special cars’ equipped with a set of professional measuring R&S equipment (see Figure 3 [35]), such as [33,35]:
  • R&S Smart Benchmarker Rel. v20.3.95;
  • Measuring terminals (UEs) based on Samsung Galaxy S21 + 5G (SM-G996BDS) (Suwon, Republic of Korea) working as active test probes;
  • R&S SwissQual QualiPoc software(Rel. 20.3.121);
  • Passive Radio Frequency (RF) scanner R&S TSME6 (Munich, Germany);
  • Global Positioning System (GPS) receiver with the GPS antenna.
The R&S Smart Benchmarker Rel. v20.3.95 worked as the main control, synchronization, and measurement unit that controlled and managed all devices of the test station within the test campaigns. The used measuring equipment was fully operational and performed reliable measurements, which were checked and verified during pretests. The measuring stations were operated by qualified, experienced personnel from the Systemics-PAB company. The measurement terminals were used to ensure a fair assessment of all MNOs, enabling the aggregation of all frequency bands used by the measured networks. The main aim of using the passive scanner was to measure the QoS metrics that represented the quality and power of radio reference signals, e.g., RSRP, SINR, or RSRQ. The scanner supports all frequency bands used in tested mobile networks.
The measurements, data processing, and data analysis were carried out under standards defined by ETSI [36,37,38,39,40,41,42] and best industry practices described by R&S in [43,44].
During the tests, controlled measurement conditions were ensured:
  • The measuring terminals were in conditions with a uniform, controlled temperature;
  • The parameters of the measurement terminals affecting the measurement quality, such as processor load or processor/battery temperature, were continuously monitored;
The equipment was mounted in special housings in the roof box at a height of about 1.8 m.

2.3. iPerf Tool

The iPerf tool is used for network performance measurement, testing, and tuning. It is free (i.e., based on Berkeley Software Distribution (BSD) license) and available for various operating systems, including CentOS Linux, FreeBSD, macOS, OpenBSD, Android, other Linux distributions, and Windows. The iPerf is compatible with various protocols, i.e., TCP, UDP, and Stream Control Transmission Protocol (SCTP) with both Internet Protocol (IP) version 4 (IPv4) and 6 (IPv6), and offers a range of customizable parameters. This tool is a staple for network administrators and engineers seeking to troubleshoot network problems, enhance performance, and undertake network experiments. Furthermore, the iPerf plays a crucial role in the performance testing and benchmarking of various network devices. In December 2023, the iPerf3-16 was released [26,31,32].
Tests using the iPerf application were aimed at examining the stability and performance of the radio transmission link. They were carried out for two types of ISO/OSI (International Organization for Standardization/Open Systems Interconnection reference model) transport layer protocols, i.e., TCP and UDP. The set data collected during tests were sequenced into UL and DL streams. This approach allows us to present the behavior of applications using TCP and UDP.
TCP provides connection transmission using acknowledgment mechanisms for uniquely numbered transferred packets called three-way handshakes. It means that the established connection is open for the duration of data transmission, which guarantees a relatively high degree of reliability of flow control connections and increases transmission security. It comes at the cost of information overhead on packet numbering and the need to check the correct transmission of each packet, which reduces the efficiency of data transfer. TCP supports the applications for which the certainty of data delivery is crucial, requiring transfer integrity control, but not time-critical, such as applications based on the following protocols, Hypertext Transfer Protocol (HTTP), File Transfer Protocol (FTP), Secure Shell (SSH), Simple Mail Transfer Protocol (SMTP), and Internet Message Access Protocol (IMAP) 4 [45].
UDP is a connectionless protocol without mechanisms to control the correctness of data flow, which affects the transfer speed and efficiency. UDP implementation ensures faster data transfer, but there is no guarantee of data delivery. This protocol is used by real-time applications, mainly those that exchange large volumes of traffic and do not expect confirmations. It is used primarily by videoconferences, data streaming, and network gaming, as well as applications based on Voice over Internet Protocol (VoIP) or Domain Name System (DNS) [46].
The parameter values adopted in the iPerf tests are contained in Table 3. In TCP, the following test profile was used during iPerf testing: 3 streams of 40 Mbps (7 s transfer time) and 3 streams of 8 Mbps each (5 sec transfer time) for DL and UL, respectively.
UDP is mainly used for network stress testing because TCP automatically limits the throughput to adapt to the available bandwidth. To this aim, a bandwidth for UDP should be chosen far above what the connection can handle, e.g., if a user wants to stress a 10 Mbps connection, he/she should send about 100 Mbps of traffic [31]. Hence, the Lost Datagrams Rate (LDR) for UDP obtained in the test is very high compared to TCP.

2.4. Measured QoS and Signal Metrics

In the analyzed scenario, we evaluated QoS and radio signal quality measures for UL and DL, using the iPerf application for two protocols, TCP and UDP. As basic QoS metrics, we use the following:
  • Th-Sx (Mbps)—Throughput from the sender is defined as an average throughput measurer on the sender side. Basically, in [43], throughput is defined as an average UL or DL throughput over the configured active transfer duration. In the tests, Th-Sx was calculated separately for UL and DL.
  • Th-Rx (Mbps)—Throughput at the receiver is defined as an average throughput measured on the receiver side. Similarly to Th-Sx, throughput is defined as an average UL or DL throughput over the configured active transfer duration [43]. In this research, Th-Rx was calculated separately for UL and DL.
  • Th-Rate (%)—Throughput at Receiver Rate, which is calculated based on the following formula:
Th-Rate = 100 % Th-Rx Th-Sx ,
  • JT (ms)—Jitter is a measure of the Internet Protocol (IP) packet jitter reported by the iPerf application. It is usually equal to or more than 0 on the sender or receiver sides, respectively. Only available as an intermediate result for UDP [43].
  • LDR (%)—Lost Datagrams Rate is the percentage of lost datagrams in relation to the number of total datagrams. Lost Datagrams are defined as the number of datagrams that did not reach the receiver before the end of the active transfer duration and count as lost. Total Datagrams is the number of datagrams sent on the sender side. If the datagram size is smaller than one Ethernet frame, this usually corresponds to the number of IP packets. The parameters mentioned above are usually analyzed for UDP [43].
  • RDR (%)—Received Datagrams Rate, which is determined as follows:
RDR = 100 % LDR ,
Additionally, using the R&S TSME6 scanner, the following radio signal quality parameters are measured:
  • RSRP (dBm)—reference signal received power (RSRP) is utilized mainly to rank among different candidate cells in accordance with their signal strength. Generally, the reference signals on the first antenna port are used to determine this parameter. However, the reference signals sent on the second port can also be used in addition to the radio stations on the first port if UE can detect that they are being transmitted [47]. Basically, RSRP is defined as the linear average over the power contributions (in watts) of the resource elements that carry cell-specific reference signals within the considered measurement frequency bandwidth [48,49].
  • SINR (dB)—Signal-to-interference-plus-noise ratio (SINR) is defined as the linear average over the power contribution (in watts) of the resource elements carrying cell-specific reference signals divided by the linear average of the noise and interference power contribution (in watts) over the resource elements carrying cell-specific reference signals within the same frequency bandwidth [47]. In fact, it is only measured for the reference signal. Therefore, it is called a Reference Signal-SINR (RS-SINR) [48,49].
  • RSRP-5G (dBm)—RSRP for 5G NR is widely named as a Second Synchronization-RSRP (SS-RSRP) [50,51]. It is defined as the linear average over the power contributions (in watts) of the resource elements that carry secondary synchronization signals. It represents the quantitative measure of SS-RSRP. The RSRP-5G range is from –156 to –31 dBm [52]. This parameter gives possibilities to compare the strengths of signals from individual cells in 5G networks, which is key for cell selection or handover. SS-RSRP is the equivalent of RSRP used in LTE [53].
  • RSRQ-5G (dB)—Reference Signal Received Quality (RSRQ) for 5G NR is named as a Second Synchronization-RSRQ (SS-RSRQ) [50,51]. It is defined as the ratio of N×SS-RSRP/NR carrier Received Signal Strength Indication (RSSI), where N is the number of resource blocks in the NR carrier RSSI measurement bandwidth. The measurements in the numerator and denominator shall be made over the same set of resource blocks. The SS-RSRQ measurements can be used for cell selection, cell reselection, and mobility procedures. The RSRQ-5G range is defined from –43 to 20 dB [52]. SS-RSRQ is used in 5G NR networks to determine the quality of the radio channel. RSRQ, unlike RSRP, also includes interference level due to the inclusion of RSSI in the calculation. This parameter is also used for cell selection and handover if the RSRP is insufficient. It happens mainly in border parts of a cell. It is similar to RSRQ determined in LTE [53].
  • SINR-5G (dB)—SINR for 5G is often called a Second Synchronization-SINR (SS-SINR) [50,51]. It is defined as the linear average over the power contribution (in watts) of the resource elements carrying secondary synchronization signals divided by the linear average of the noise and interference power contribution (in watts). In 5G networks, SINR-5G is reported as a coded value via measurement report to a base station. The reported range is from 0 to 127, total 128 values, where values 0 and 127 represent SINR < −23 dB and SINR > 40 dB, respectively [52].
The method of determining the radio signal quality parameters in the 5G-NR system is defined by the 3GPP standard, particularly by the specification [50,51].

3. Correlation Analysis of QoS Metrics

3.1. PCC Results for TCP

Our analysis is based on the Pearson Correlation Coefficient (PCC) [7] between a pair of two variables represented by analyzed parameters. The description of PCC and interpretation of its values [54] is shown in Appendix B. Based on Equation (A1), we determined the correlation degree for every pair of two measured metrics defined in Section 2.4. The PCC results for TCP are presented in Figure 4. This figure depicts one heatmap averaged for all MNOs (a); and four heatmaps for each MNO, i.e., (b) Orange, (c) Play, (d) Plus, and (e) T-Mobile, respectively. Each heatmap shows PCCs for UL and DL illustrated in upper-right and lower-left edges, respectively.
Figure 4 shows that P C C = 1 for LDR and RDR. It means that the relationship between these parameters is linear, as shown in the results from Equation (3). So, next, we only analyze RDR.
For TCP and UL, we may see that Th-Rx is very strongly correlated with the Tx-Sx, Th-Rate, and RDR for all MNOs. In the case of TCP and DL, Th-Rx is very strongly correlated only with Tx-Sx for all MNOs. The correlation between Tx-Rx and Th-Rate is weak or moderate, and the correlation between Th-Rx and RDR is moderate or strong. Generally, for UL and DL, we can classify the relationship between QoS metrics (i.e., Th-Rx, Th-Rate, and RDR) and signal parameters (i.e., RSRP, SINR, RSRP-5G, SINR-5G, RSRQ-5G) as moderate. In the DL case, only the Th-Rate weakly correlates with the signal metrics, whereas the PCCs for signal parameters indicate a moderate or strong correlation between them. By determining PCCs for the entire data set, i.e., for all MNOs (see Figure 4a), we can notice that the correlation degree is usually smaller than for individual MNOs. This is due to the fact that the data set of analyzed parameters for MNOs varies, as is illustrated later in the paper. The RSRQ-5G example shows the best. In this case, the averaged PCCs for all MNOs indicate a very weak correlation, while the corresponding PCCs for individual MNOs are much larger.

3.2. PCC Results for UDP

The PCC results for UDP are presented in Figure 5. Similar to TCP (see Figure 4), Figure 5 illustrates one heatmap averaged for all MNOs (a); and four heatmaps for each MNO, i.e., (b) Orange, (c) Play, (d) Plus, and (e) T-Mobile, respectively. Each heatmap shows PCCs for UL and DL illustrated in the upper-right and lower-left edges, respectively.
The evaluation of PCCs for UDP generally shows that the correlation degrees of parameters are lower than for TCP. Th-Rx is very weakly correlated with Th-Sx and RDR. Meanwhile, the correlation of Th-Rx with Th-Rate is very strong (i.e., linear), and with JT, it is moderate or strong. As mentioned in Section 2.3, for UDP, Th-Sx should be set to a large value that exceeds the throughput achievable. When analyzing measured Th-Sx values, they are usually constant values, much larger than Th-Rx. Therefore, considering Equation (2), we should expect a small absolute value of PCC for Th-Rx and Th-Sx and a very large one for Th-Rx and Th-Rate. On the other hand, the practically constant value of Th-Sx is the reason for a very weak correlation with other analyzed metrics. In the UDP analysis, JT is additionally included. As mentioned, this parameter is moderately (Plus), borderline moderately/strongly (Orange, Play), or strongly (T-Mobile) correlated with Th-Rx and Th-Rate. On the other hand, the correlation of JT with signal metrics is weak. In the case of Th-Rx and Th-Rate, correlation degrees with signal parameters are usually moderate for UL and DL. The nature of the correlation between the signal parameters is similar for UDP and TCP, i.e., from moderate to strongly correlated. This is due to the fact that the signal parameters depend primarily on the propagation conditions and the mutual location of the UE and base station and not on the provided services.

4. Relationship between QoS Metrics

4.1. Analysis for TCP Results

For TCP, we analyzed three QoS parameters, i.e., Th-Rx, Th-Rate, and RDR. From a practical viewpoint, Th-Rx is crucial. Th-Rx is generally moderately correlated with the signal metrics for the three MNOs, i.e., Orange, Play, and T-Mobile. For UL, the largest PCC (i.e., 0.45 < P C C < 0.53 ) was obtained for RSRP (for Orange and Play) or RSRP-5G (for T-Mobile), while the more minor (i.e., 0.29 < P C C < 0.4 ) was obtained for SINR or SINR-5G. For DL and the same three MNOs, higher correlations were obtained between Th-Rx and SINR or SINR-5G (i.e., 0.54 < P C C < 0.62 ) than between Th-Rx and RSRP or RSRP-5G (i.e., 0.28 < P C C < 0.45 ). For Plus, the highest Th-Rx correlation occurs for RSRQ-5G, and PCCs are equal to 0.35 or 0.57 for UL and DL, respectively.
Considering the obtained results, we conclude that RSRP (or possibly RSRP-5G) should be used to estimate Th-Rx for UL TCP. It can be regarded as a similar approach to the one proposed by M. Lorenz [29] and the Office of Electronic Communications, i.e., the Polish regulatory authority [30]. However, for DL TCP, we propose using SINR (or alternatively SINR-5G) for Th-Rx estimation. Figure 6 and Figure 7 illustrate measured Th-Rx versus RSRP or SINR and appropriate regression lines for (a) UL and (b) DL, respectively.
Throughput measurement data for TCP are limited to 22.83 and 118.24 Mbps for UL and DL (see Figure 6a,b), respectively. It is due to the specificity of this protocol. The assessment of the throughput of individual MNOs is complex based on measurement data due to their spreading. This evaluation is facilitated by the regression lines presented in Figure 7a,b. Basically, we can see that, in UL, the lines for Orange and T-Mobile overlap, and the line for Play is close to them. In the DL case, the Orange and Play lines overlap, while the T-Mobile line has a similar slope. The similarity of the lines for Orange and T-Mobile may result from the mentioned RAN sharing and the same base station locations. Therefore, we may generally assume that the throughput versus radio signal parameters for these three MNOs can be modeled with one average curve. The Plus regression lines for both UL and DL are clearly different from other MNOs. The throughput at a given RSRP/SINR value is worse or better than the other MNOs for UL and DL, respectively. A more significant DL throughput may result from the use of the 40 MHz band at the 2.6 GHz frequency, which is used only by Plus in Poland.
For four MNOs and TCP, Figure 8, Figure 9, Figure 10 and Figure 11 present RSRP versus SINR or RSRP-5G versus SINR-5G, respectively. In each figure, we show the measurement data (see Figure 8 and Figure 10) or appropriate regression lines (see Figure 9 and Figure 11) for (a) UL and (b) DL, respectively.
Similar to the above, analyzing the measured parameters is difficult due to their spreading. Therefore, our assessment is based on appropriate regression lines. Generally, the results of the power and quality of reference signals measured according to the methodology for the LTE and 5G standards (see Figure 8 and Figure 9 or Figure 10 and Figure 11, respectively) are similar for all MNOs. In Figure 9, the lines of two MNOs, i.e., for Orange and T-Mobile, or Plus and Play, practically overlap. However, the differences between these two line groups are minor. However, in Figure 11, the lines of three MNOs (i.e., for Orange, T-Mobile, and Play) overlap. For RSRP-5G versus SINR-5G, there is a significant difference only for Plus. In this case, we can see that, with a lower RSRP-5G value, a higher quality, i.e., SINR-5G, may be obtained. It allows for this MNO to provide higher QoS, probably due to using the 2.6 GHz band for 5G technology.
The parameters of all regression lines for TCP are listed in Table A3 in Appendix C.

4.2. Analysis for UDP Results

For UDP, we considered four QoS parameters, i.e., Th-Rx, Th-Rate, JT, and RDR. From a data analysis perspective, Th-Rx and JT are crucial. For all MNOs, Th-Rx is moderately or strongly correlated with the signal metrics. For UL, the largest PCC (i.e., P C C = 0.62 ) is obtained for RSRP-5G (Orange and T-Mobile). The PCCs between Th-Rx and RSRP are equal between 0.47 and 0.59 for all MNOs. The correlation between Th-Rx and SINR-5G or SINR is generally weak (i.e., 0.24 < P C C < 0.39 ) for all MNOs, but for SINR and Plus, the PCC is equal to 0.47. For DL and three MNOs (i.e., Orange, Play, and T-Mobile), we obtain a higher correlation between Th-Rx and SINR/SINR-5G (i.e., 0.34 < P C C < 0.54 ) than between Th-Rx and RSRP/RSRP-5G (i.e., 0.28 < P C C < 0.47 ). The correlation degree of signal parameters with JT is weaker than with Th-Rx, which results in a large spreading of data. Due to the specificity of JT measurement as a time indicator, it has a lower limit equal to 0. Therefore, the estimation is subject to a larger error, similar to Th-Rx for TCP, which has an upper limit. PCCs between JT and RSRP are in the range from –0.40 to –0.24 and are relatively the best among the signal metrics (e.g., 0.40 < P C C < 0.21 for SINR). Therefore, for UDP, we propose a Th-Rx estimation based on RSRP or SINR for UL and DL, respectively, similarly to TCP. Figure 12 and Figure 13 depict measured Th-Rx versus RSRP or SINR and appropriate regression lines for (a) UL and (b) DL, respectively. Analogous graphs for JT are presented in Figure 14 and Figure 15.
For UDP and Th-Rx, we can draw similar conclusions as for TCP. The regression lines for three MNOs (i.e., Orange, T-Mobile, and Play) have similar slopes and intercept points. Primarily, two lines for Orange and T-Mobile in UL and Play and T-Mobile overlap. Only regression lines for Plus, UL and DL, are significantly different. Similar to TCP, at the same RSRP/SINR level, Plus in UDP has lower or higher throughput than other MNOs for UL and DL, respectively.
In the case of JT, regression lines for Orange and T-Mobile overlap for UL and DL. On the other hand, jitter is higher for Play and Plus in UL, and for Play also in DL, respectively. For Plus, JT is lower than Orange/T-Mobile for S I N R < 10   dB and higher for S I N R > 10   dB .
The results obtained for UDP confirm the two main conclusions formulated for TCP: using RAN sharing technology by Orange and T-Mobile provides similar throughput results, and using the 2.6 GHz band by Plus gives higher throughput for DL.
For UDP, we also analyze the relationship between the reference signal parameters representing the received power level and its quality. Measured data and regression lines of RSRP versus SINR and RSRP-5G versus SINR-5G are shown in Figure 16, Figure 17, Figure 18 and Figure 19, respectively.
Based on the results obtained for UDP, we can draw the same conclusions as for TCP (see Section 4.1, Figure 8, Figure 9, Figure 10 and Figure 11). It proves that the analysis of the level and quality of the received signal in mobile networks is independent of the provided services but depends on the radio resources (i.e., used frequency band), the location of the UE in relation to the base station (i.e., the distance between them), the shape and urbanization degree of the terrain, and the related radio wave propagation conditions.
The parameters of all regression lines for UDP are contained in Table A4 in Appendix C.

5. Discussion

5.1. Synthesis of Results

The basic QoS measures used in the assessment of mobile networks are throughput and latency [1]. In the iPerf scenario, we mainly analyzed throughput for TCP and UDP, and additionally jitter for UDP. These parameters are strongly correlated with lost or received datagram rates (i.e., LDR or RDR). Considering the specificity of both analyzed protocols, UDP is usually used for network stress testing and the assessment of the maximum throughput or capacity [26,31,32]. In the context of iPerf tests, it is worth emphasizing that throughputs obtained for TCP and UDP should not be directly compared. This is due to the main advantages and considerations of each protocol, as are shown in Table 4 [43].
In the iPerf scenario, we had no way to evaluate latency. Therefore, we use the global assessment presented by Systemics-PAB in terms of the four implemented measurement scenarios mentioned in Section 2.1. Based on them, three QoS metrics, so-called main KPIs for Internet access, i.e., average DL and UL throughput and latency, were determined, which are depicted in Figure 20 [33]. With regard to the comparison of four Polish MNOs, the obtained results coincide with the conclusions received by Systemics-PAB: throughput for Plus is the highest and lowest for DL and UL, respectively, and Orange and T-Mobile have practical the same KPI values.
When analyzing PCCs averaged for all MNOs (see Figure 4a and Figure 5a), we noticed some discrepancy associated with the RSRQ-5G metric in relation to the PCC for individual MNOs. Well, the RSRQ-5G-associated correlations are usually much lower for all than for the selected MNO. This could indicate that the analyzed data set (in the XY plane, where RSRQ-5G is one of the parameters) for each MNO is clustered and the complete data set for all MNOs is characterized by high dispersion. Therefore, we hypothesized that RSRQ-5G can be used to classify/identify MNOs based on measurements. Considering that RSRQ-5G is strongly correlated with SINR-5G (i.e., 0.64 < P C C < 0.79 ) for all analyzed cases (i.e., all MNOs, TCP and UDP, and UL and DL), we present the measurement data and regression lines in Figure 21, Figure 22, Figure 23 and Figure 24 for TCP and UDP, respectively.
Based on the obtained regression curves (see Figure 22 and Figure 24), we can notice that the lines do not overlap, thus allowing for the identification or classification of MNOs based on averaged measurement data, as well as the assessment of their QoS (i.e., KPIs). For the selected SINR-5G, we can rank MNOs, i.e., Play, T-Mobile, Orange, and Plus, by the increasing RSRQ-5G. In this way, the obtained assessment of MNOs based on the reference signal quality coincides with the assessment of MNOs in terms of KPIs analyzed by Systemics-PAB (see Figure 20).

5.2. Comparison of MNOs

To evaluate the similarity of individual MNOs in terms of the obtained PCC results, we calculated PCCs for each pair of MNOs, using the heatmaps from Figure 4 and Figure 5 as input, as shown in Figure 25. In this case, the heatmap shows PCCs for TCP and UDP illustrated in the upper-right and lower-left edges, respectively. Please note that the different colormap scale ranges from 0.87 to 1.
Heatmaps are more similar for TCP than for UDP. Generally, the smallest PCCs occur for the entire data set (i.e., all MNOs), thus confirming its large variation. The PCCs are most similar for Orange and T-Mobile. It may result from the fact that these MNOs are using the same base stations or mast locations. Already, during the development of the LTE network, these MNOs commissioned the management of RAN, using the RAN sharing technique, for the Net-WorkS! Company (Daytona Beach, FL, USA). Hence, similar values of the relevant QoS metrics and signal parameters were obtained during drive tests for these MNOs. The most significant differences in the analyzed heatmap occur for Plus and Play for TCP and UDP, respectively.

6. Summary

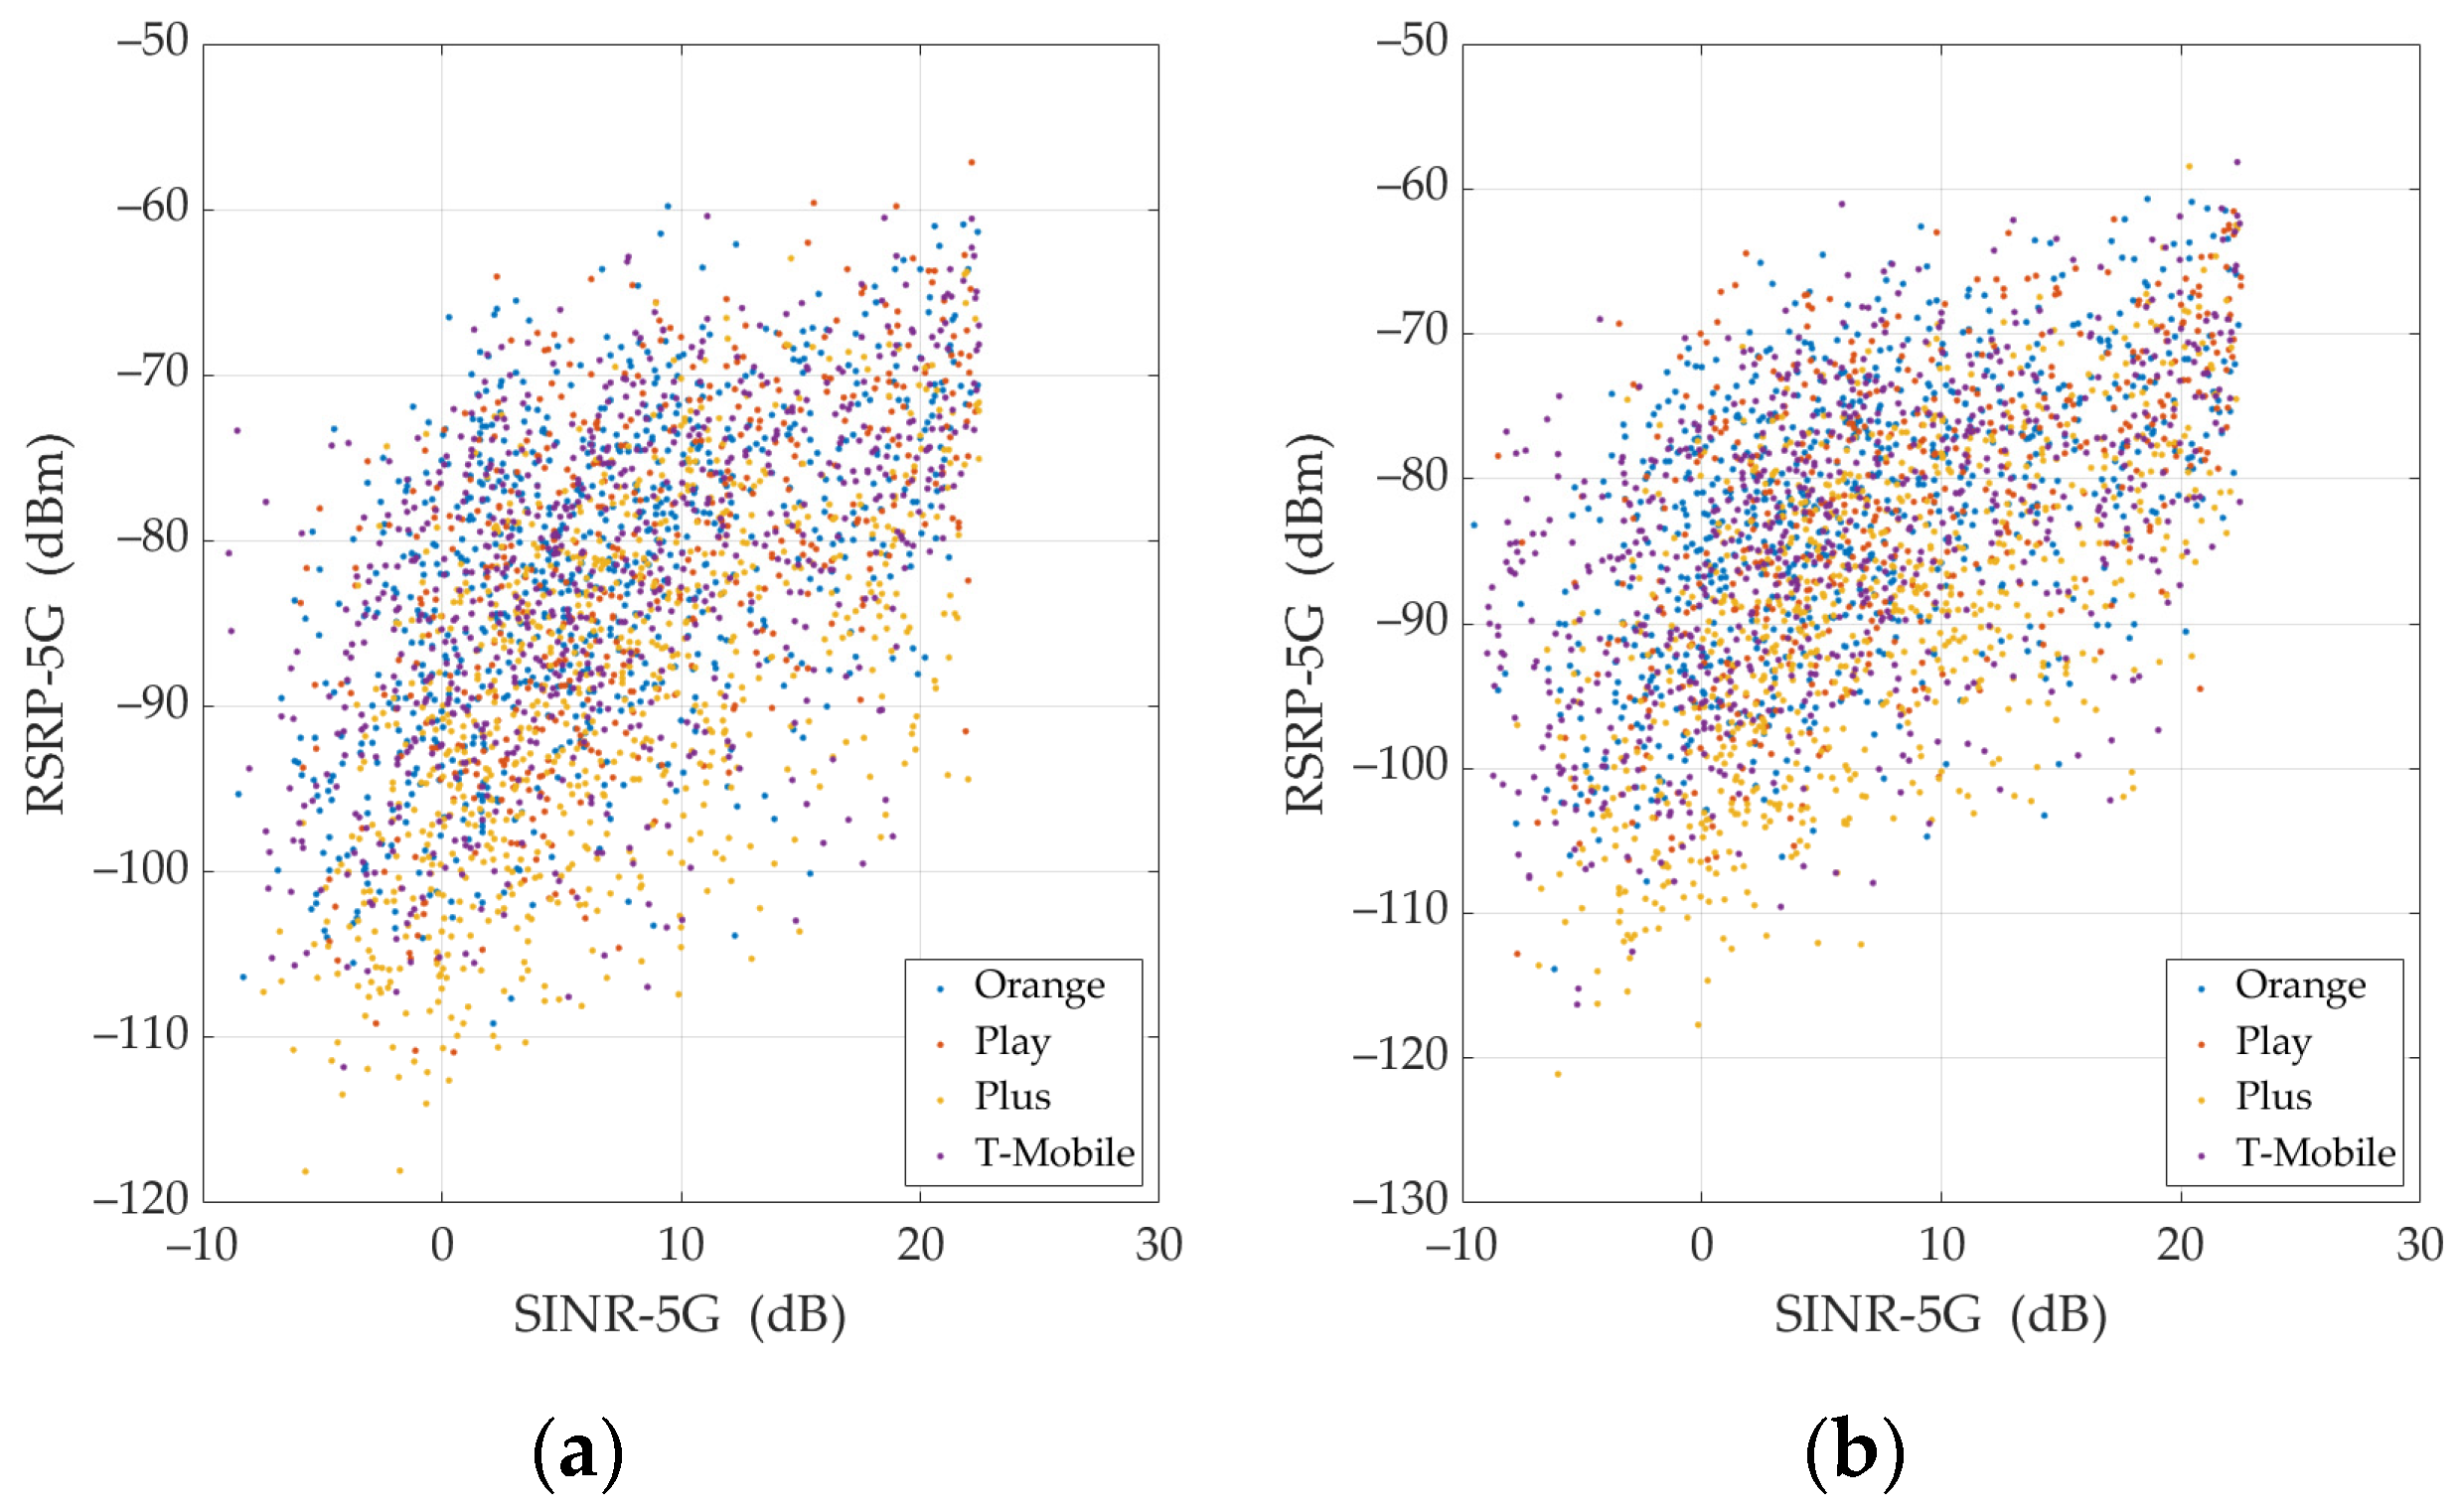
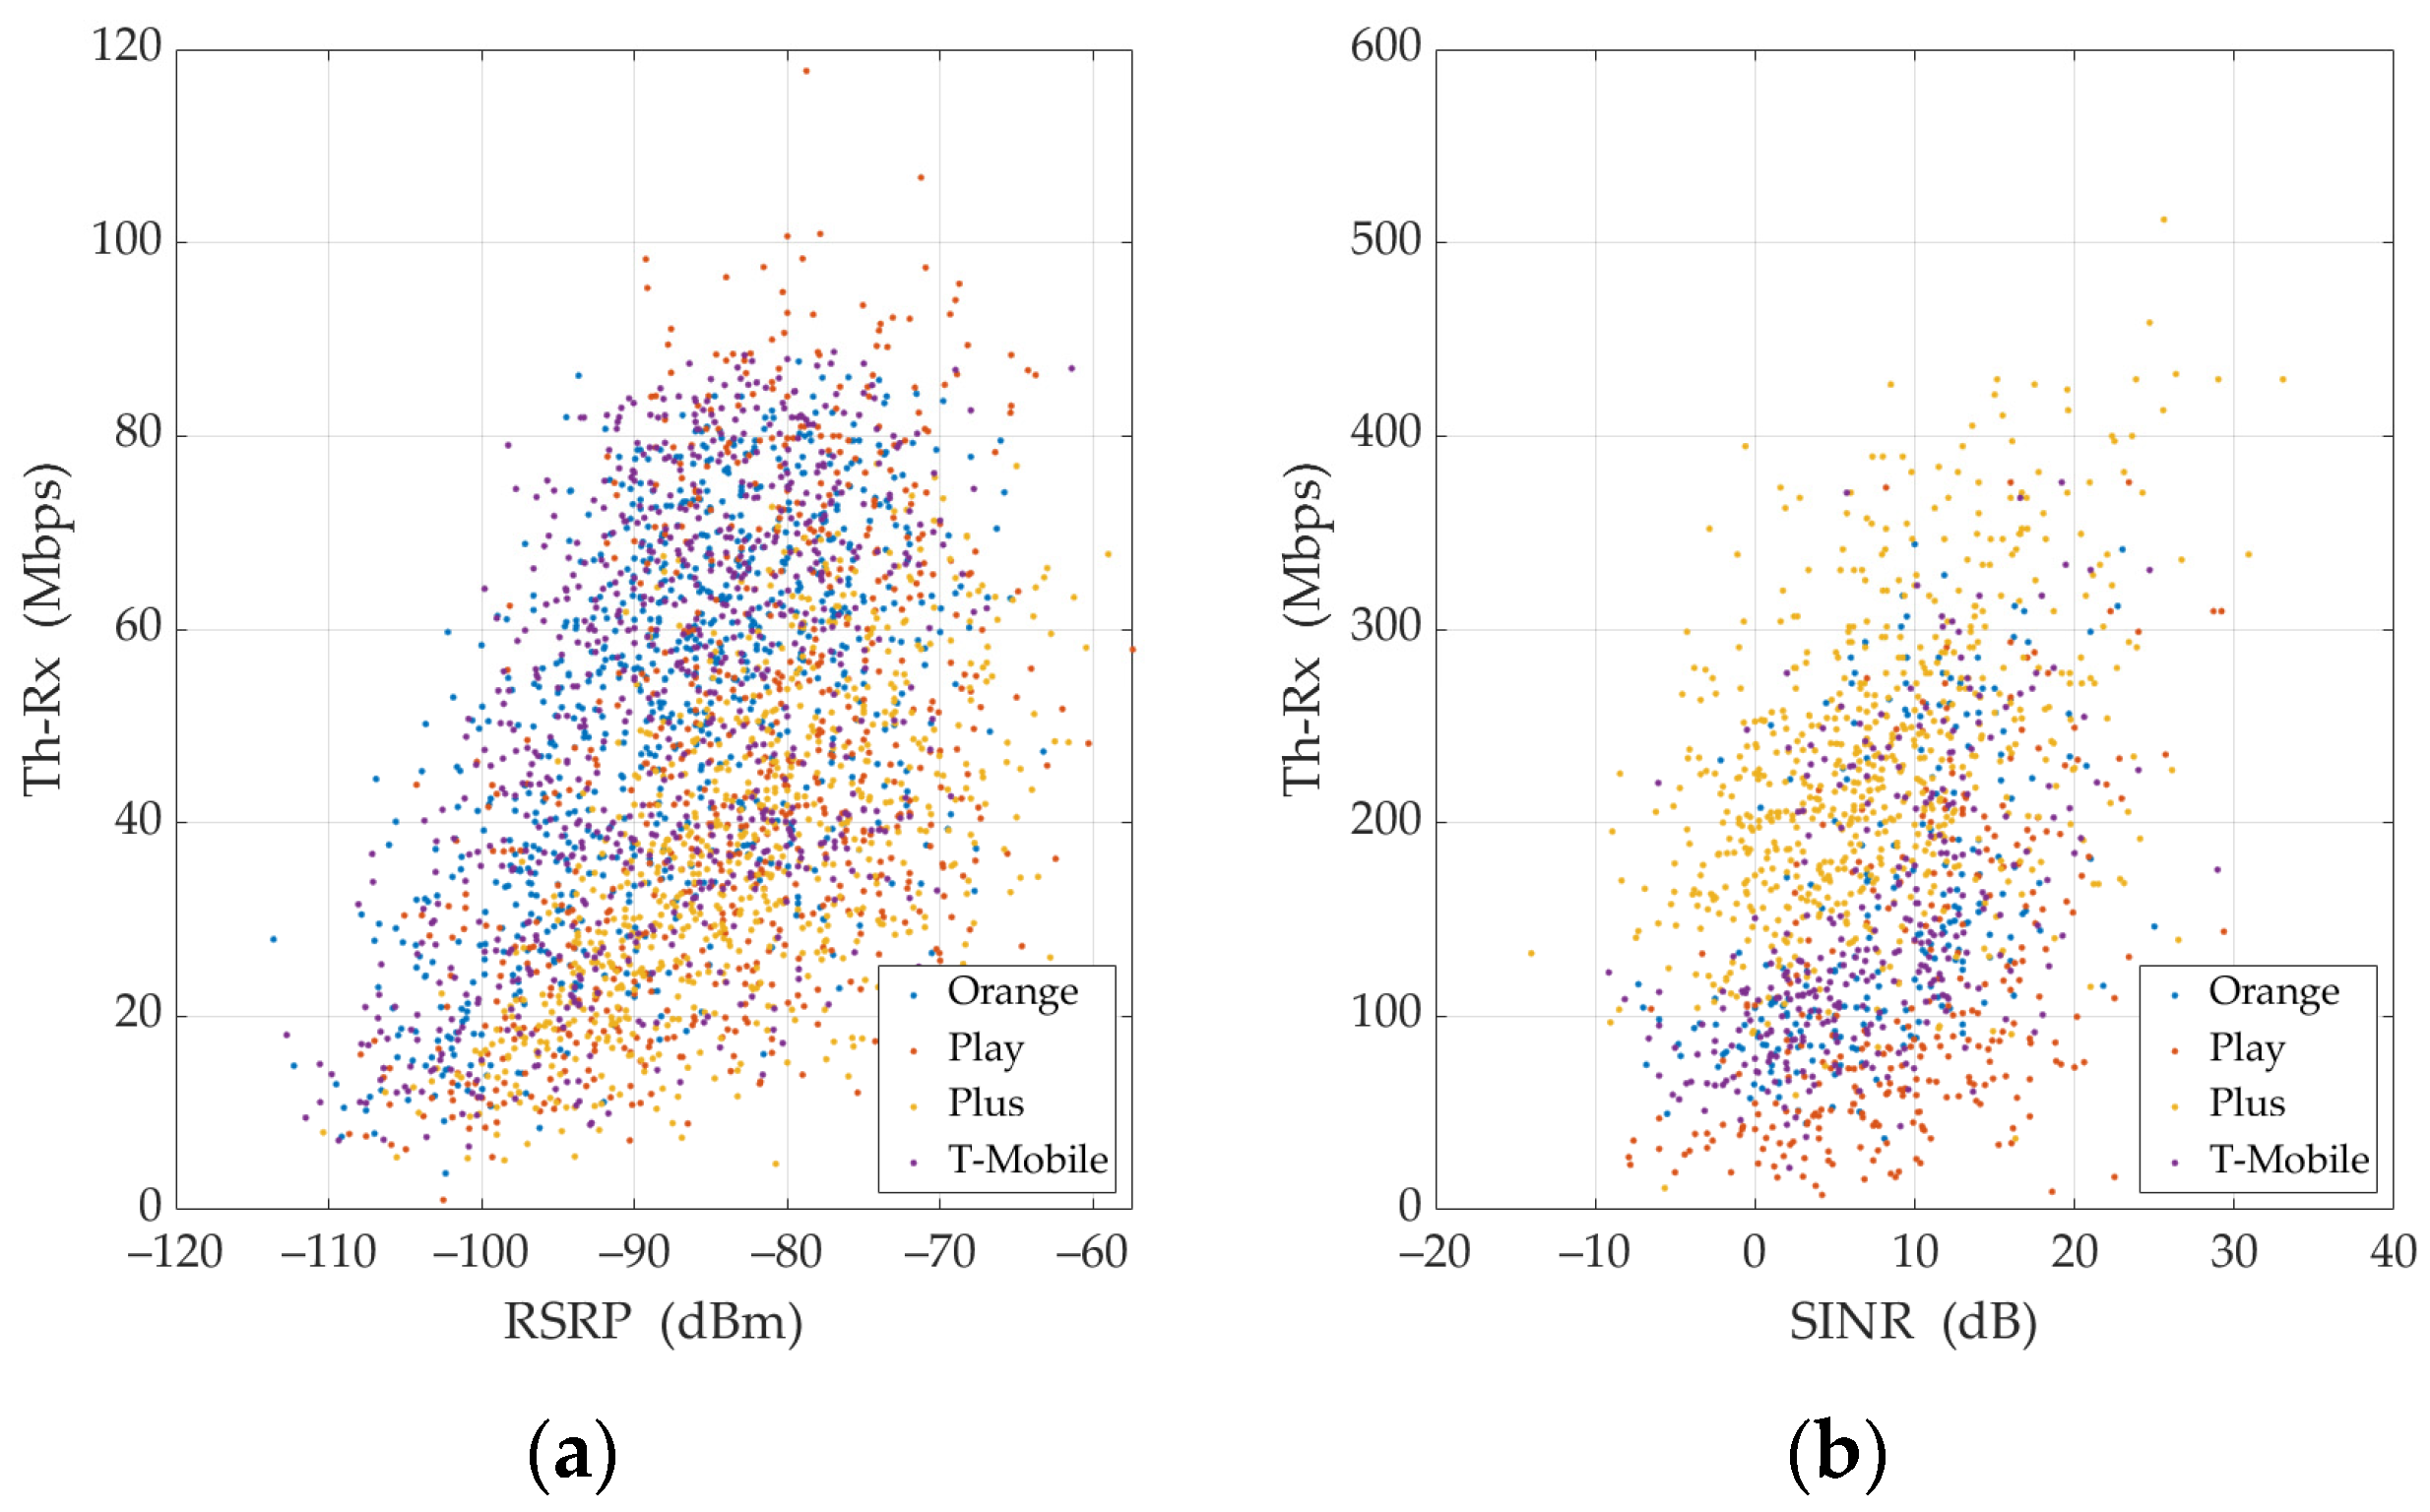
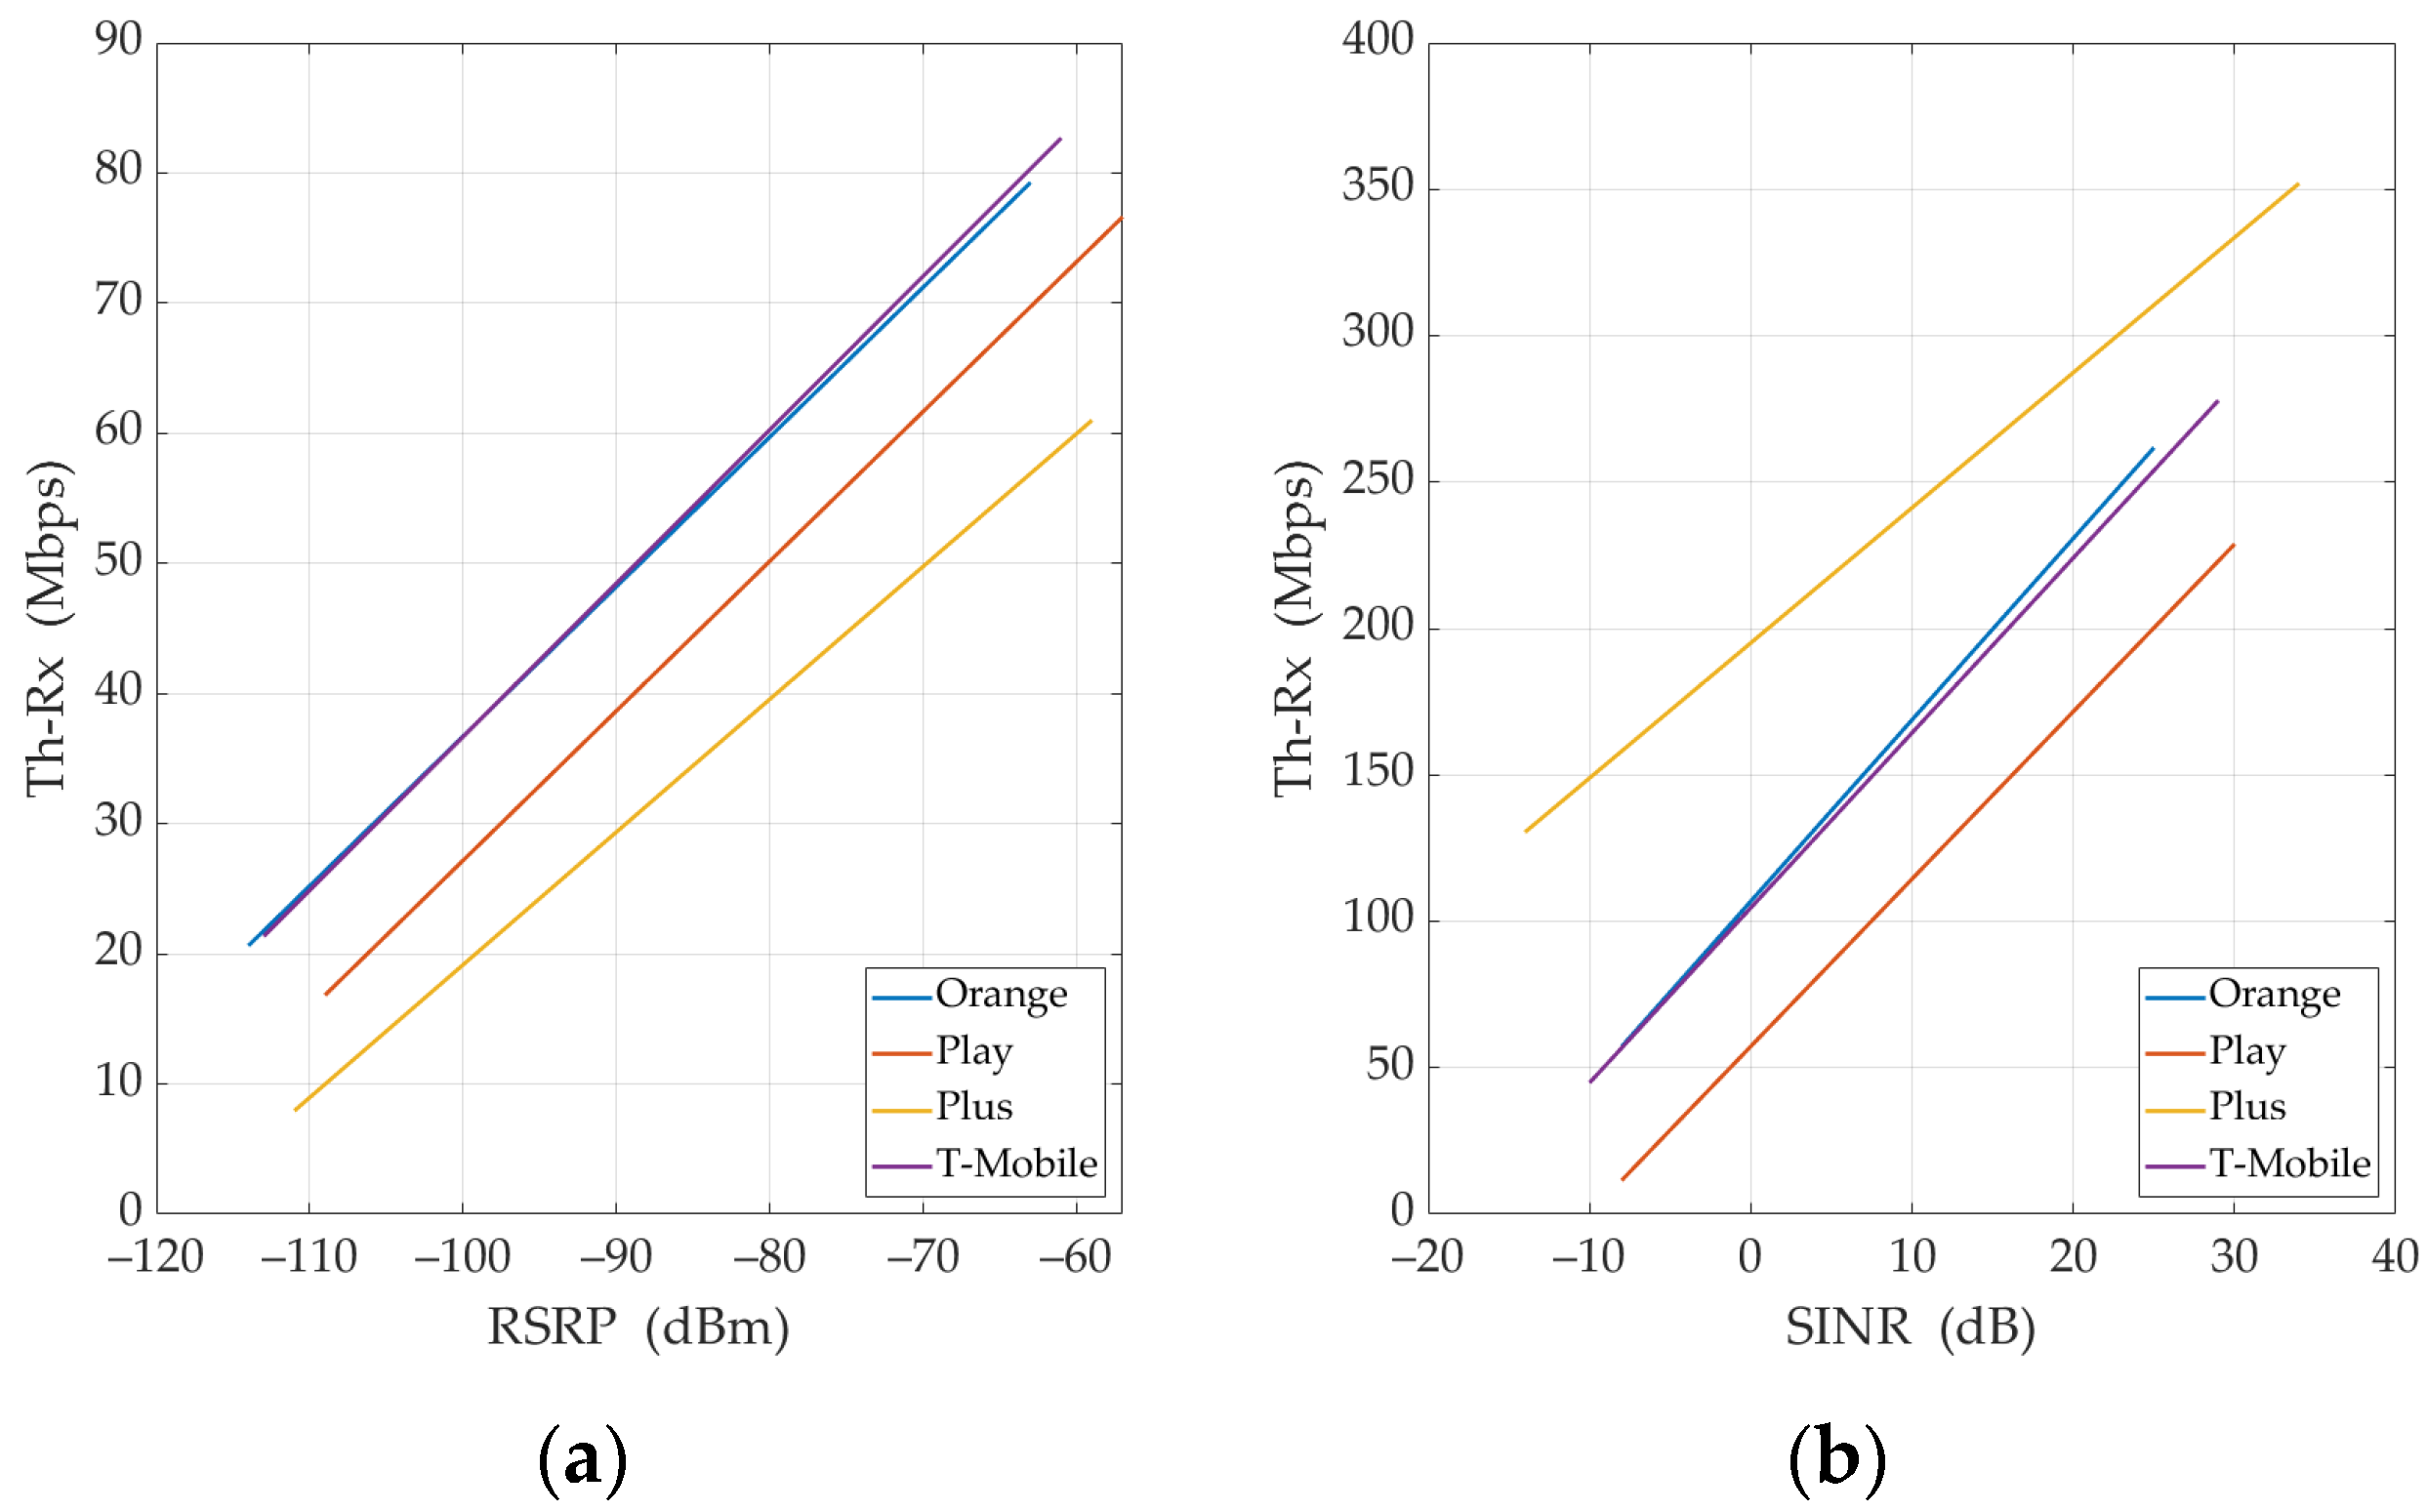
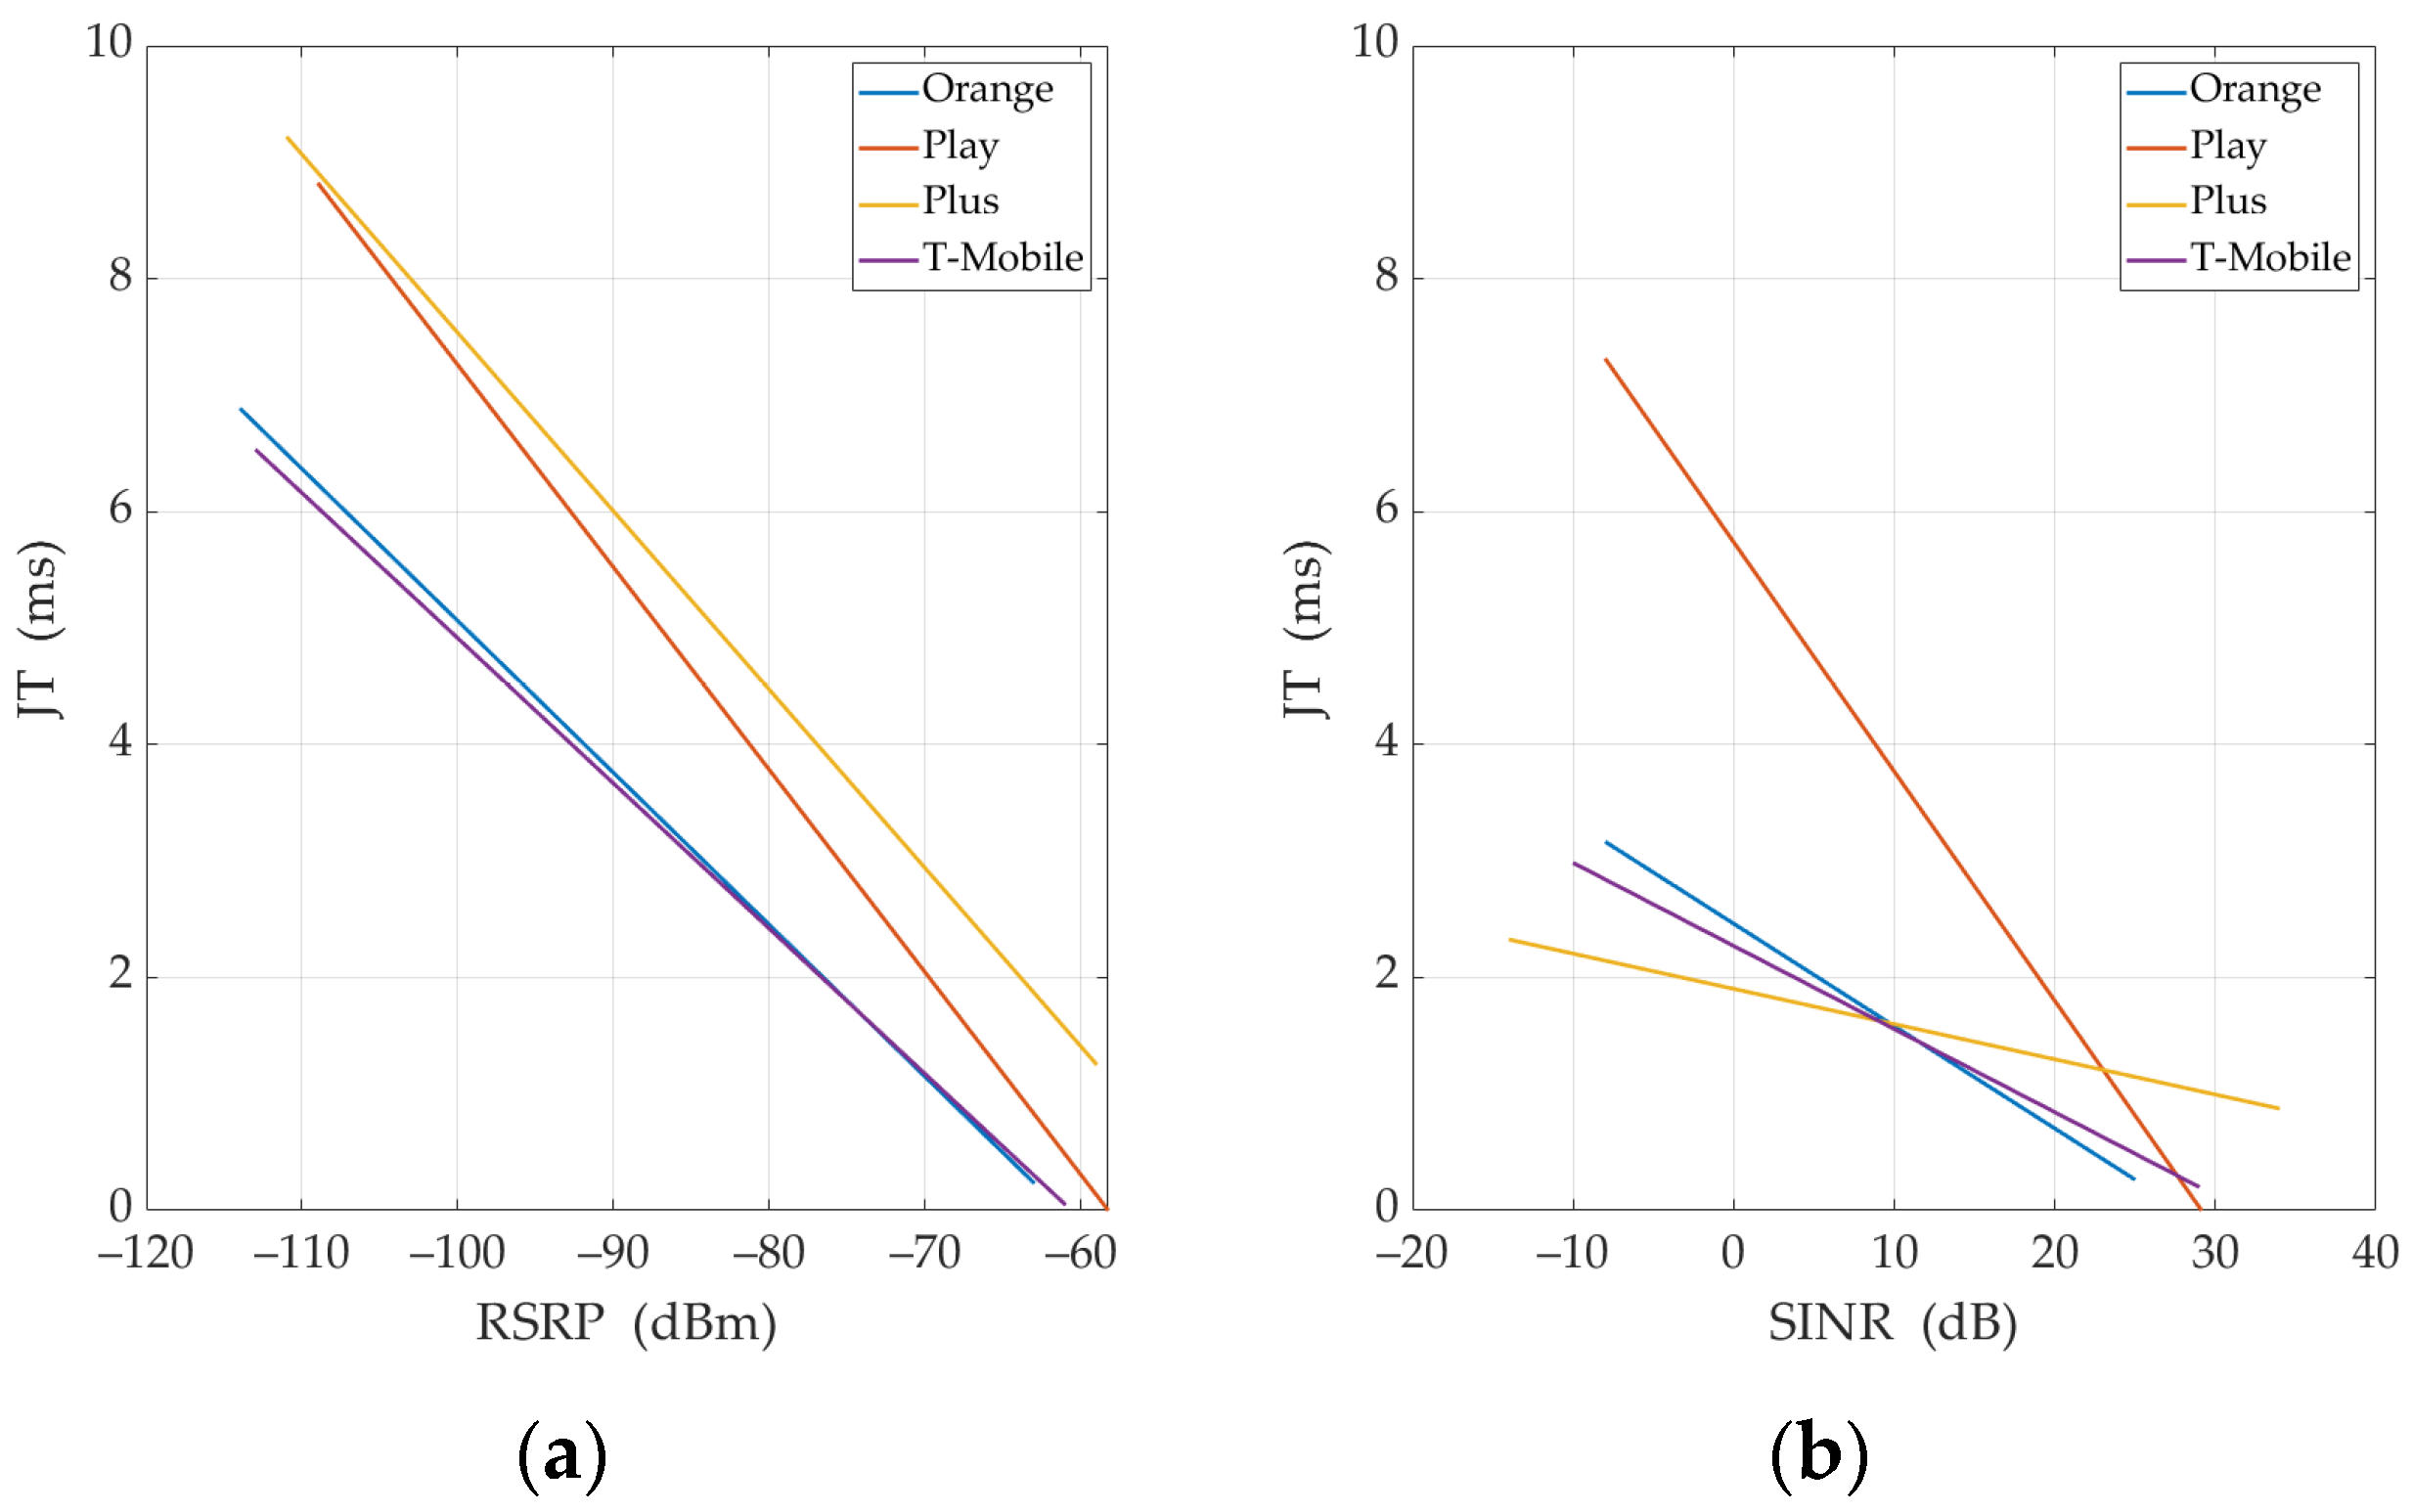
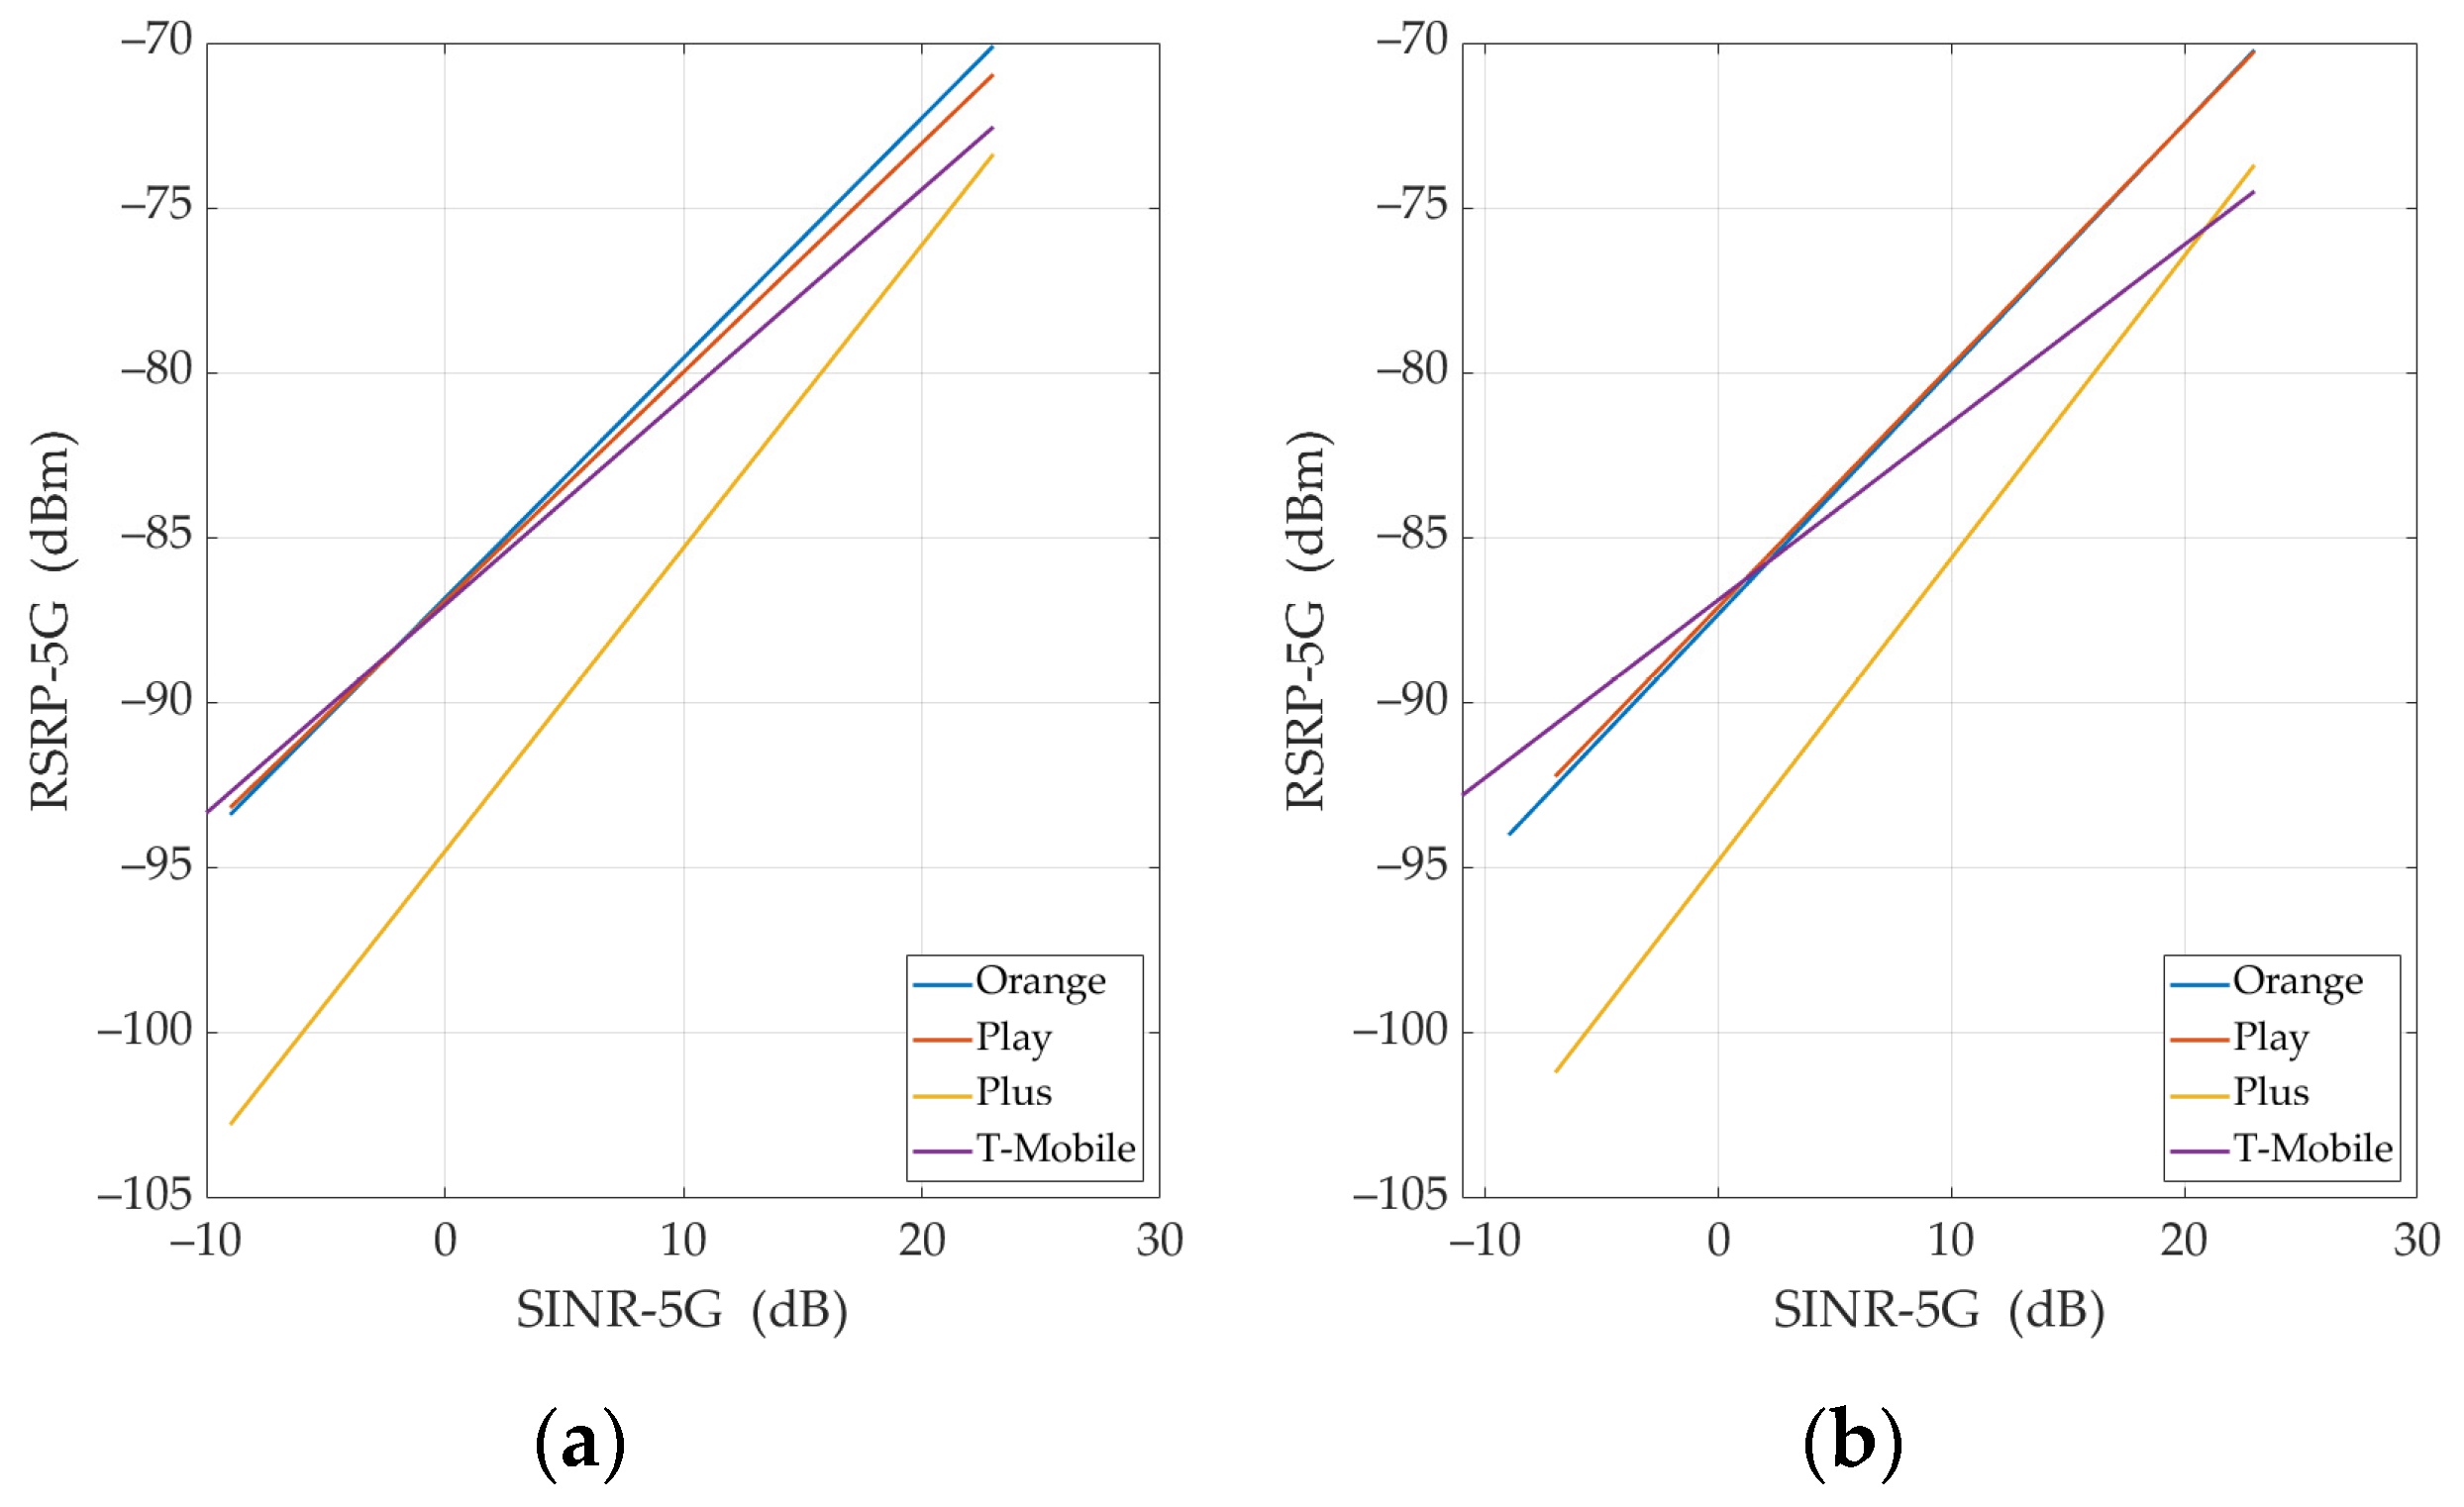
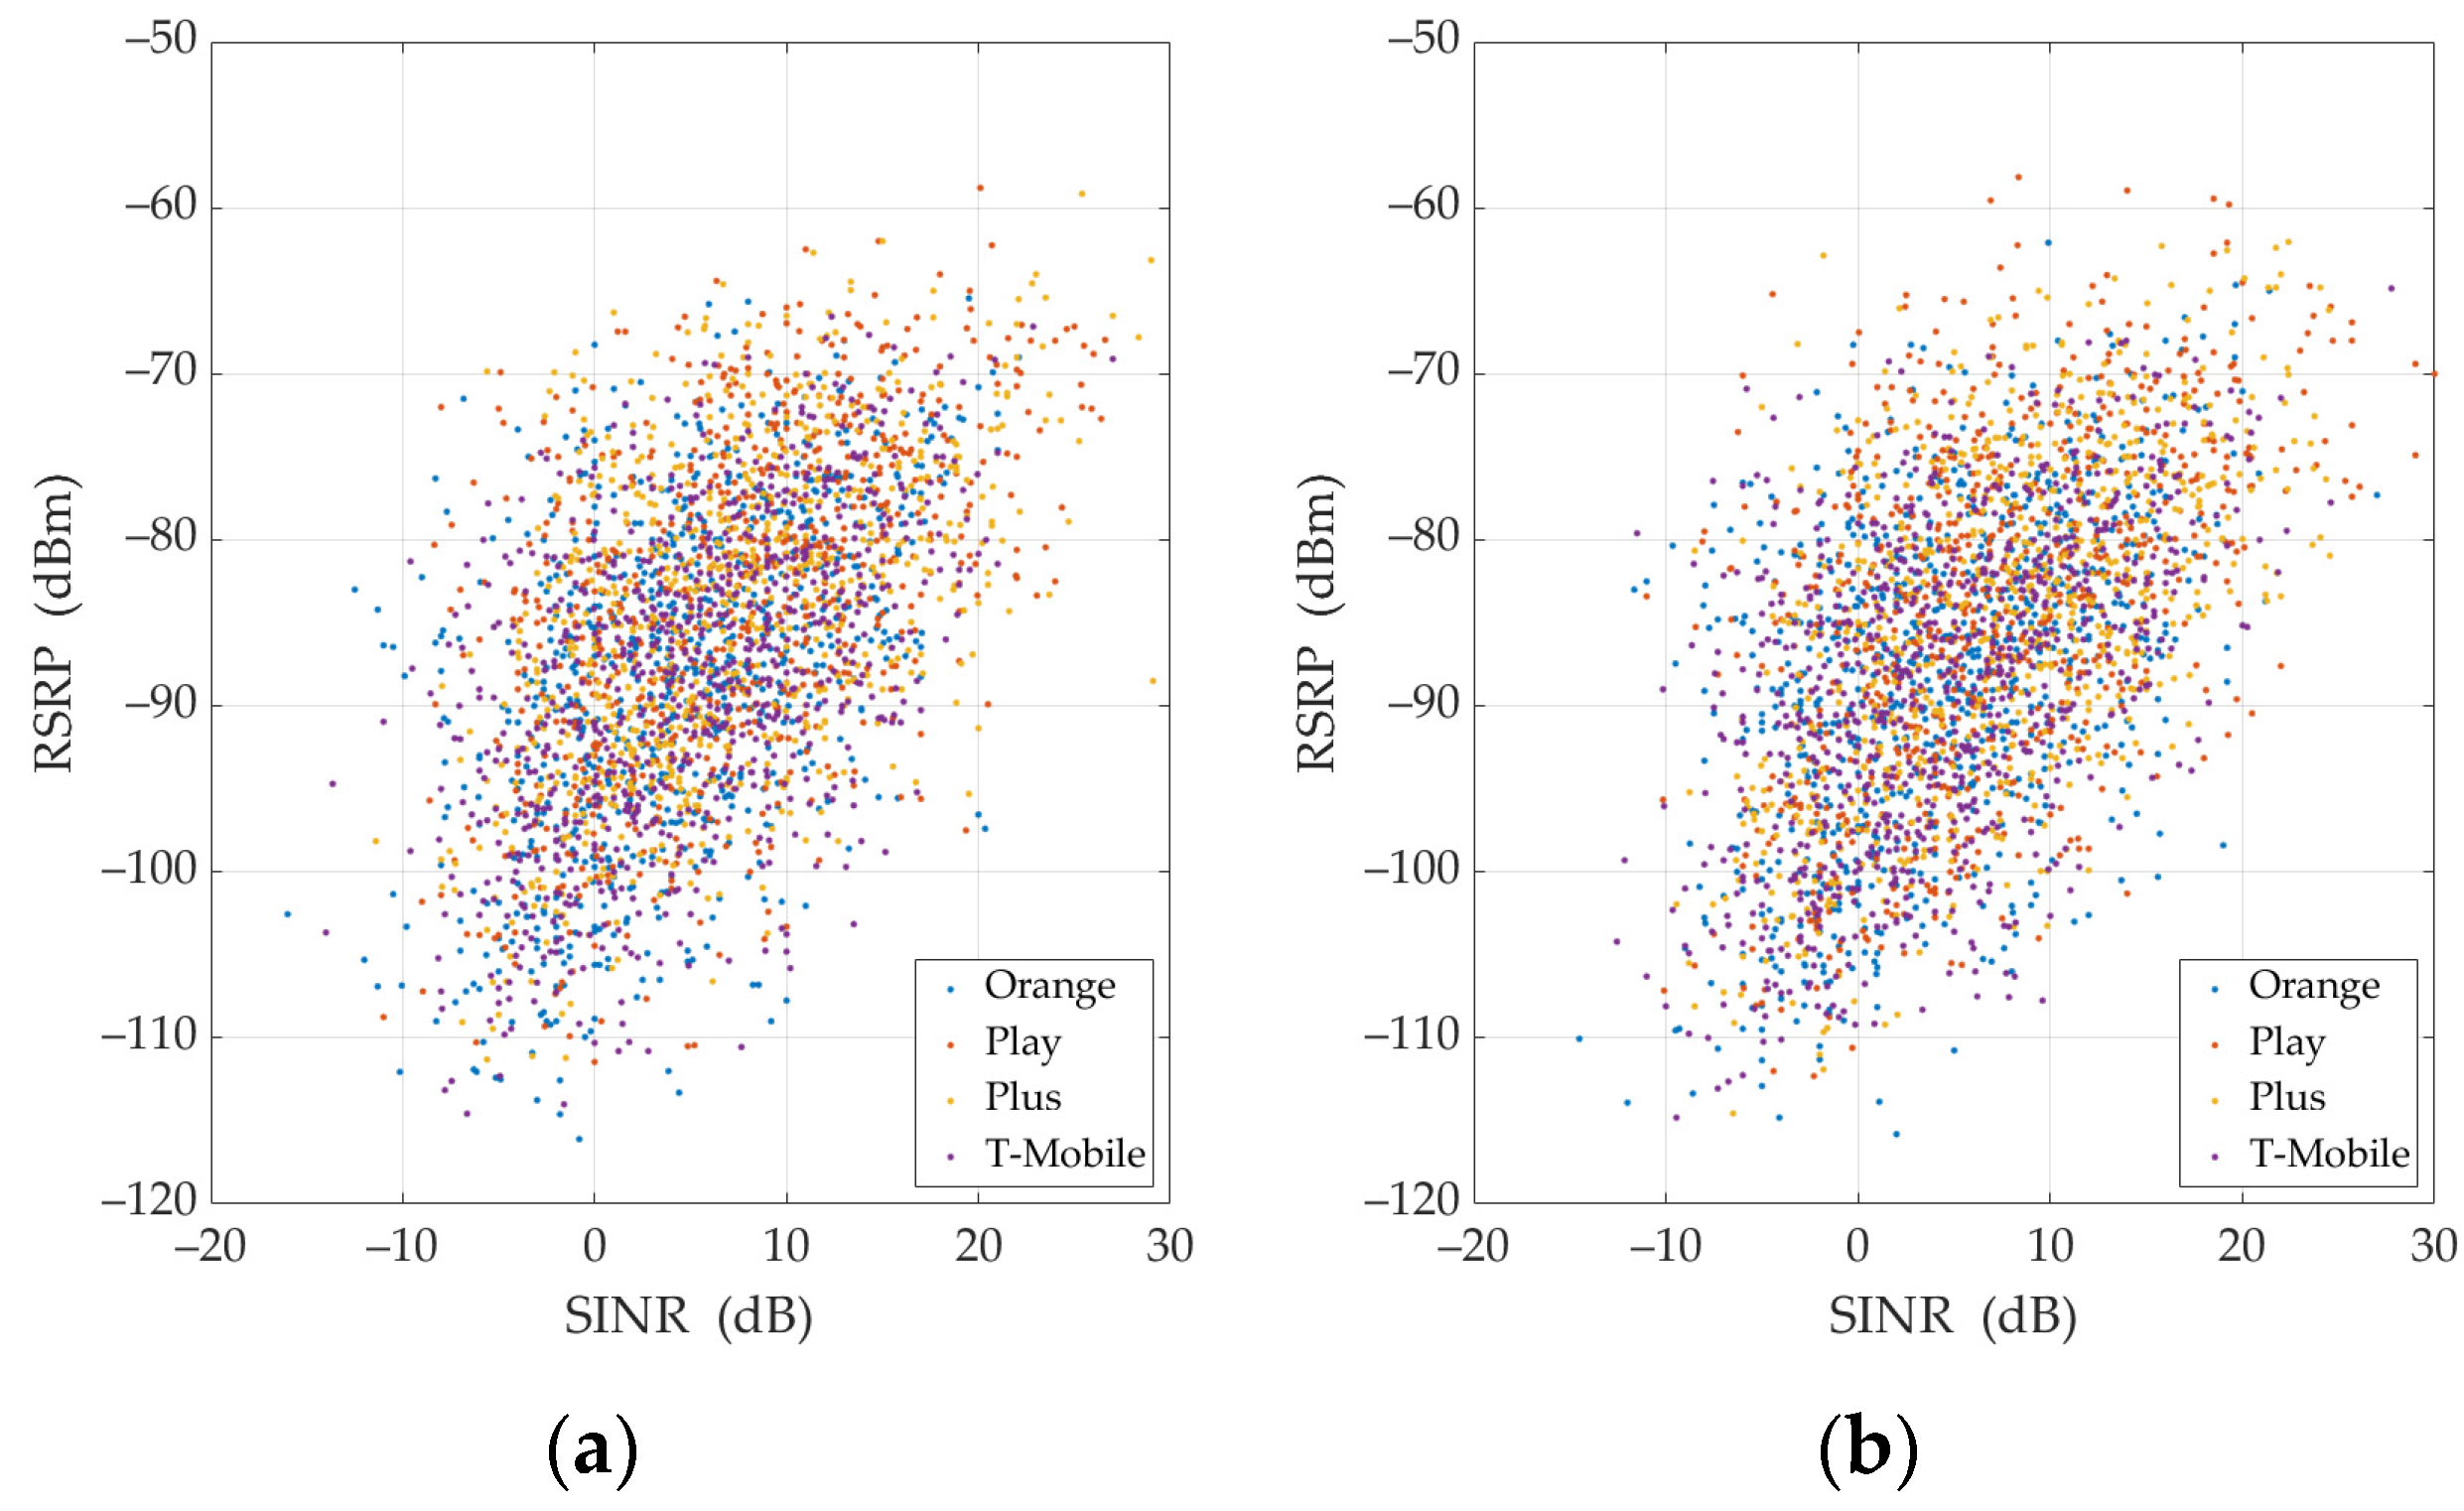
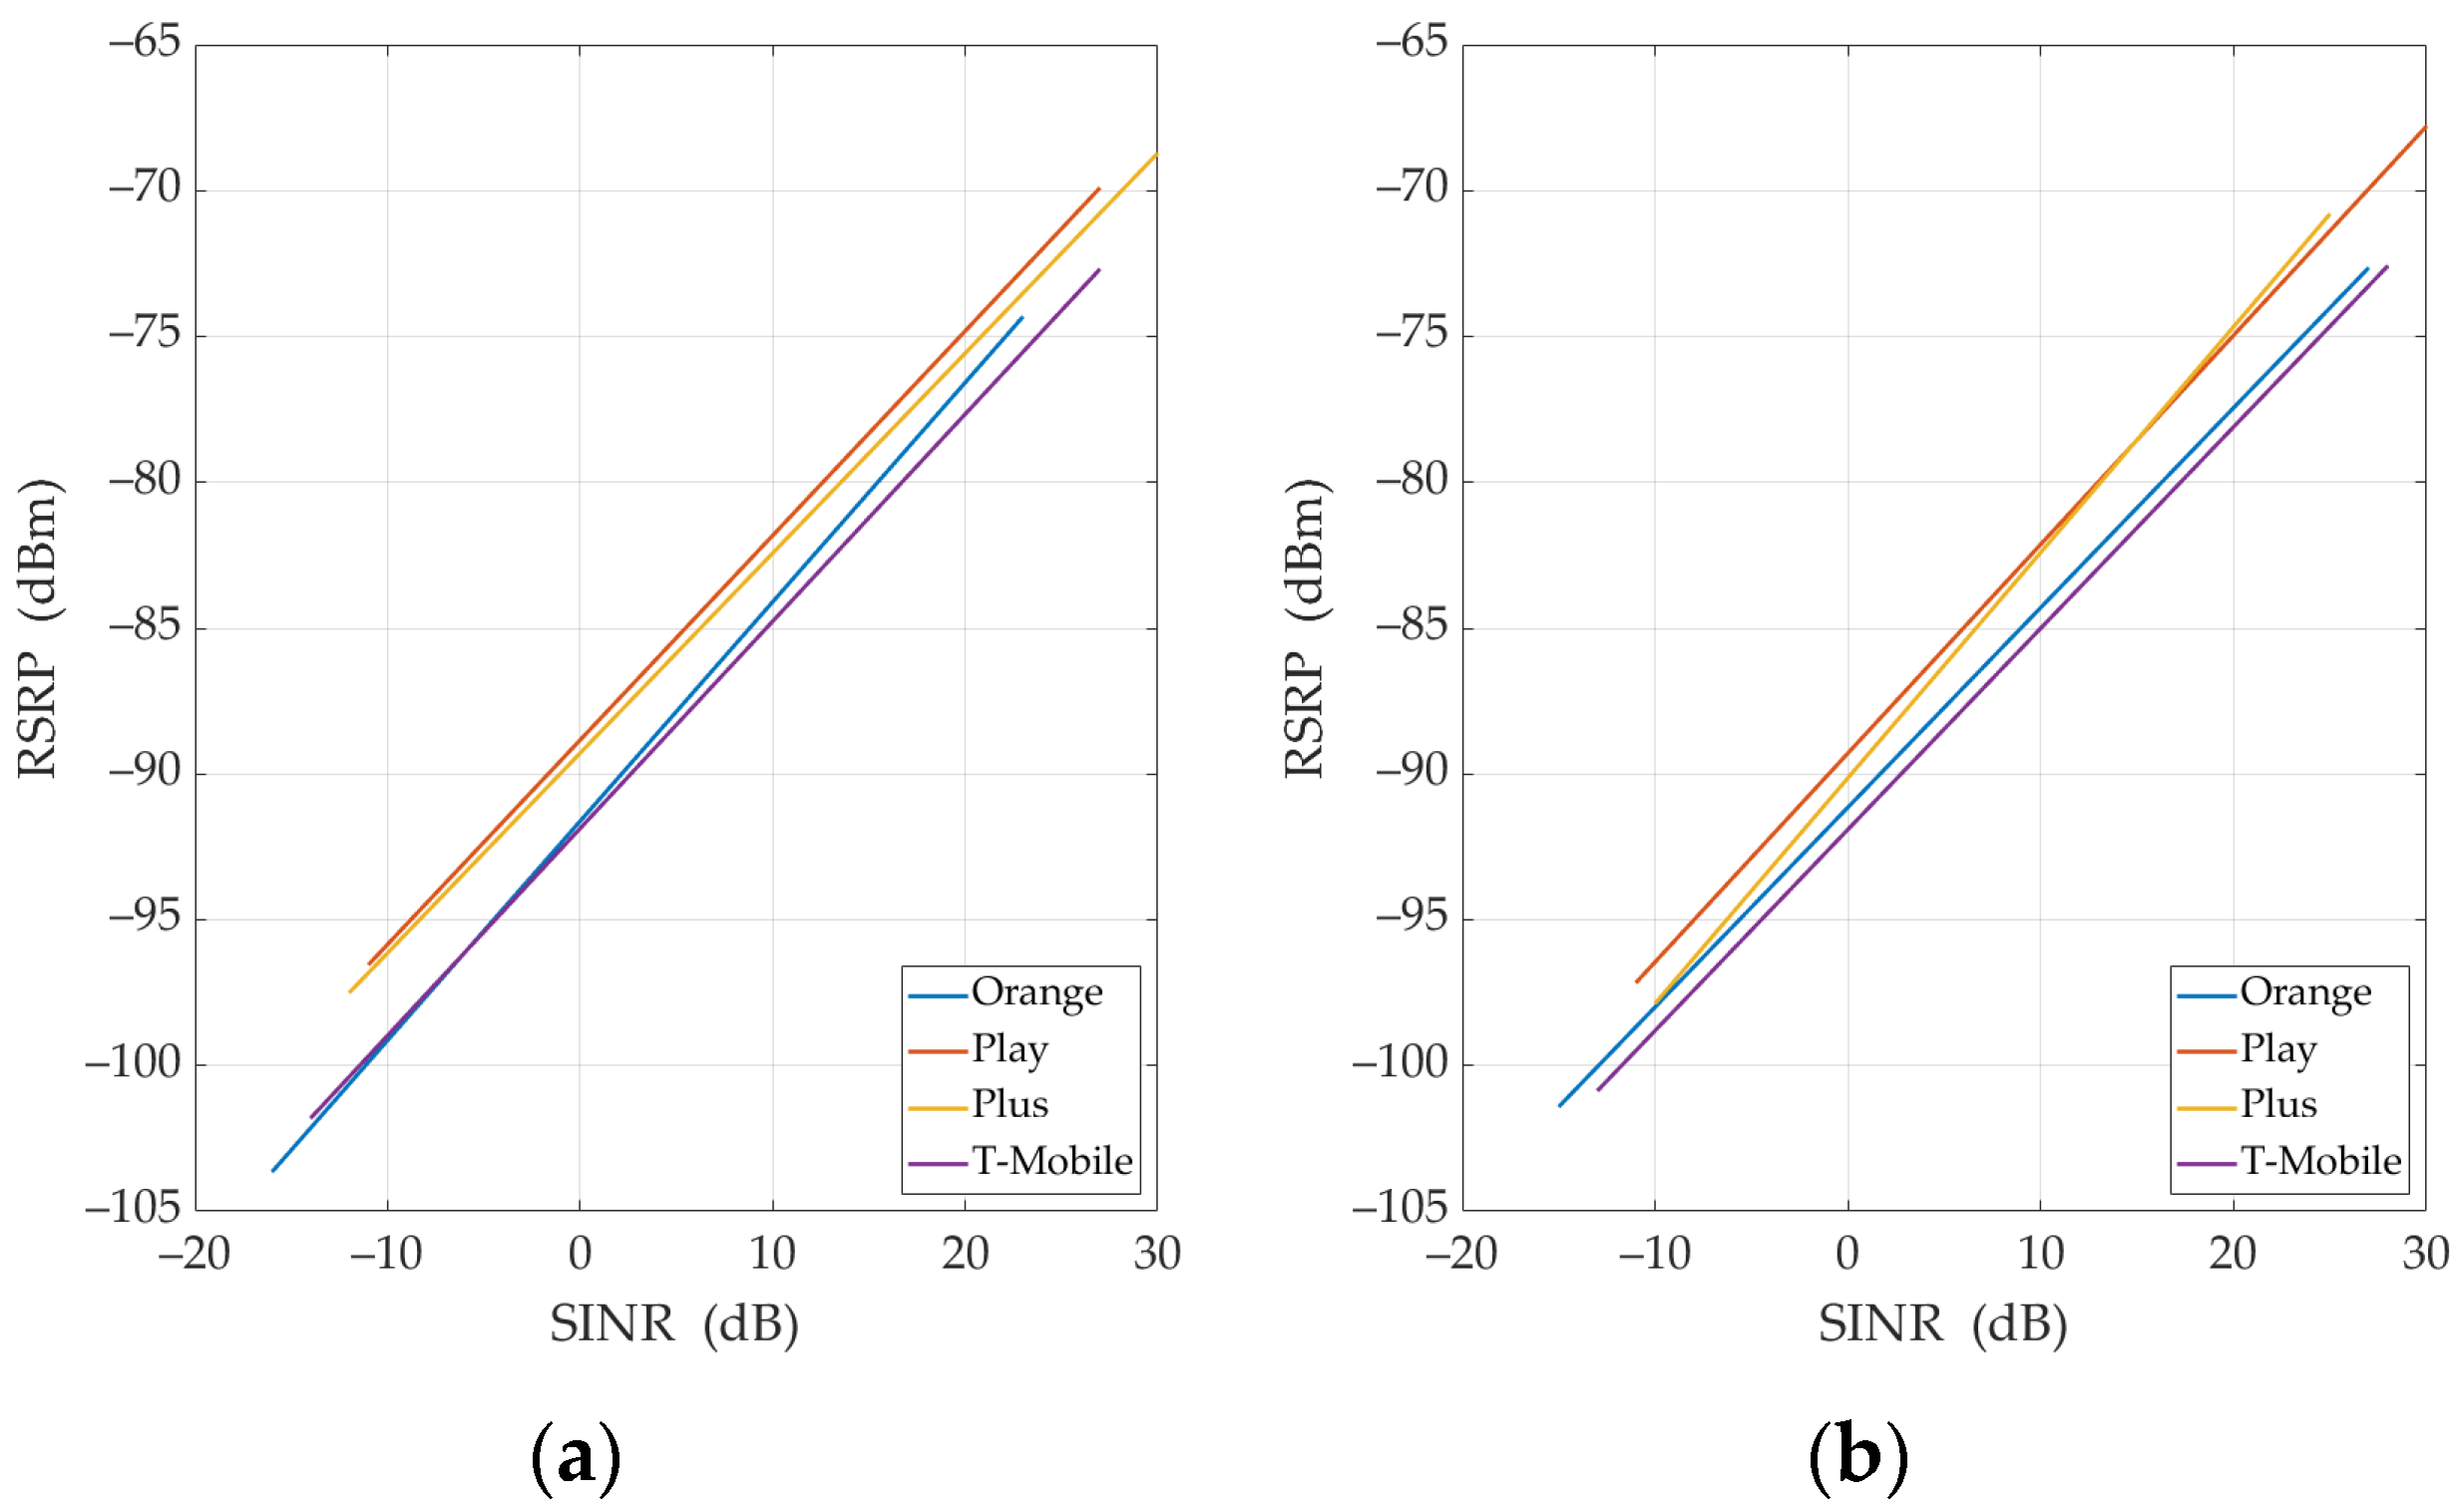
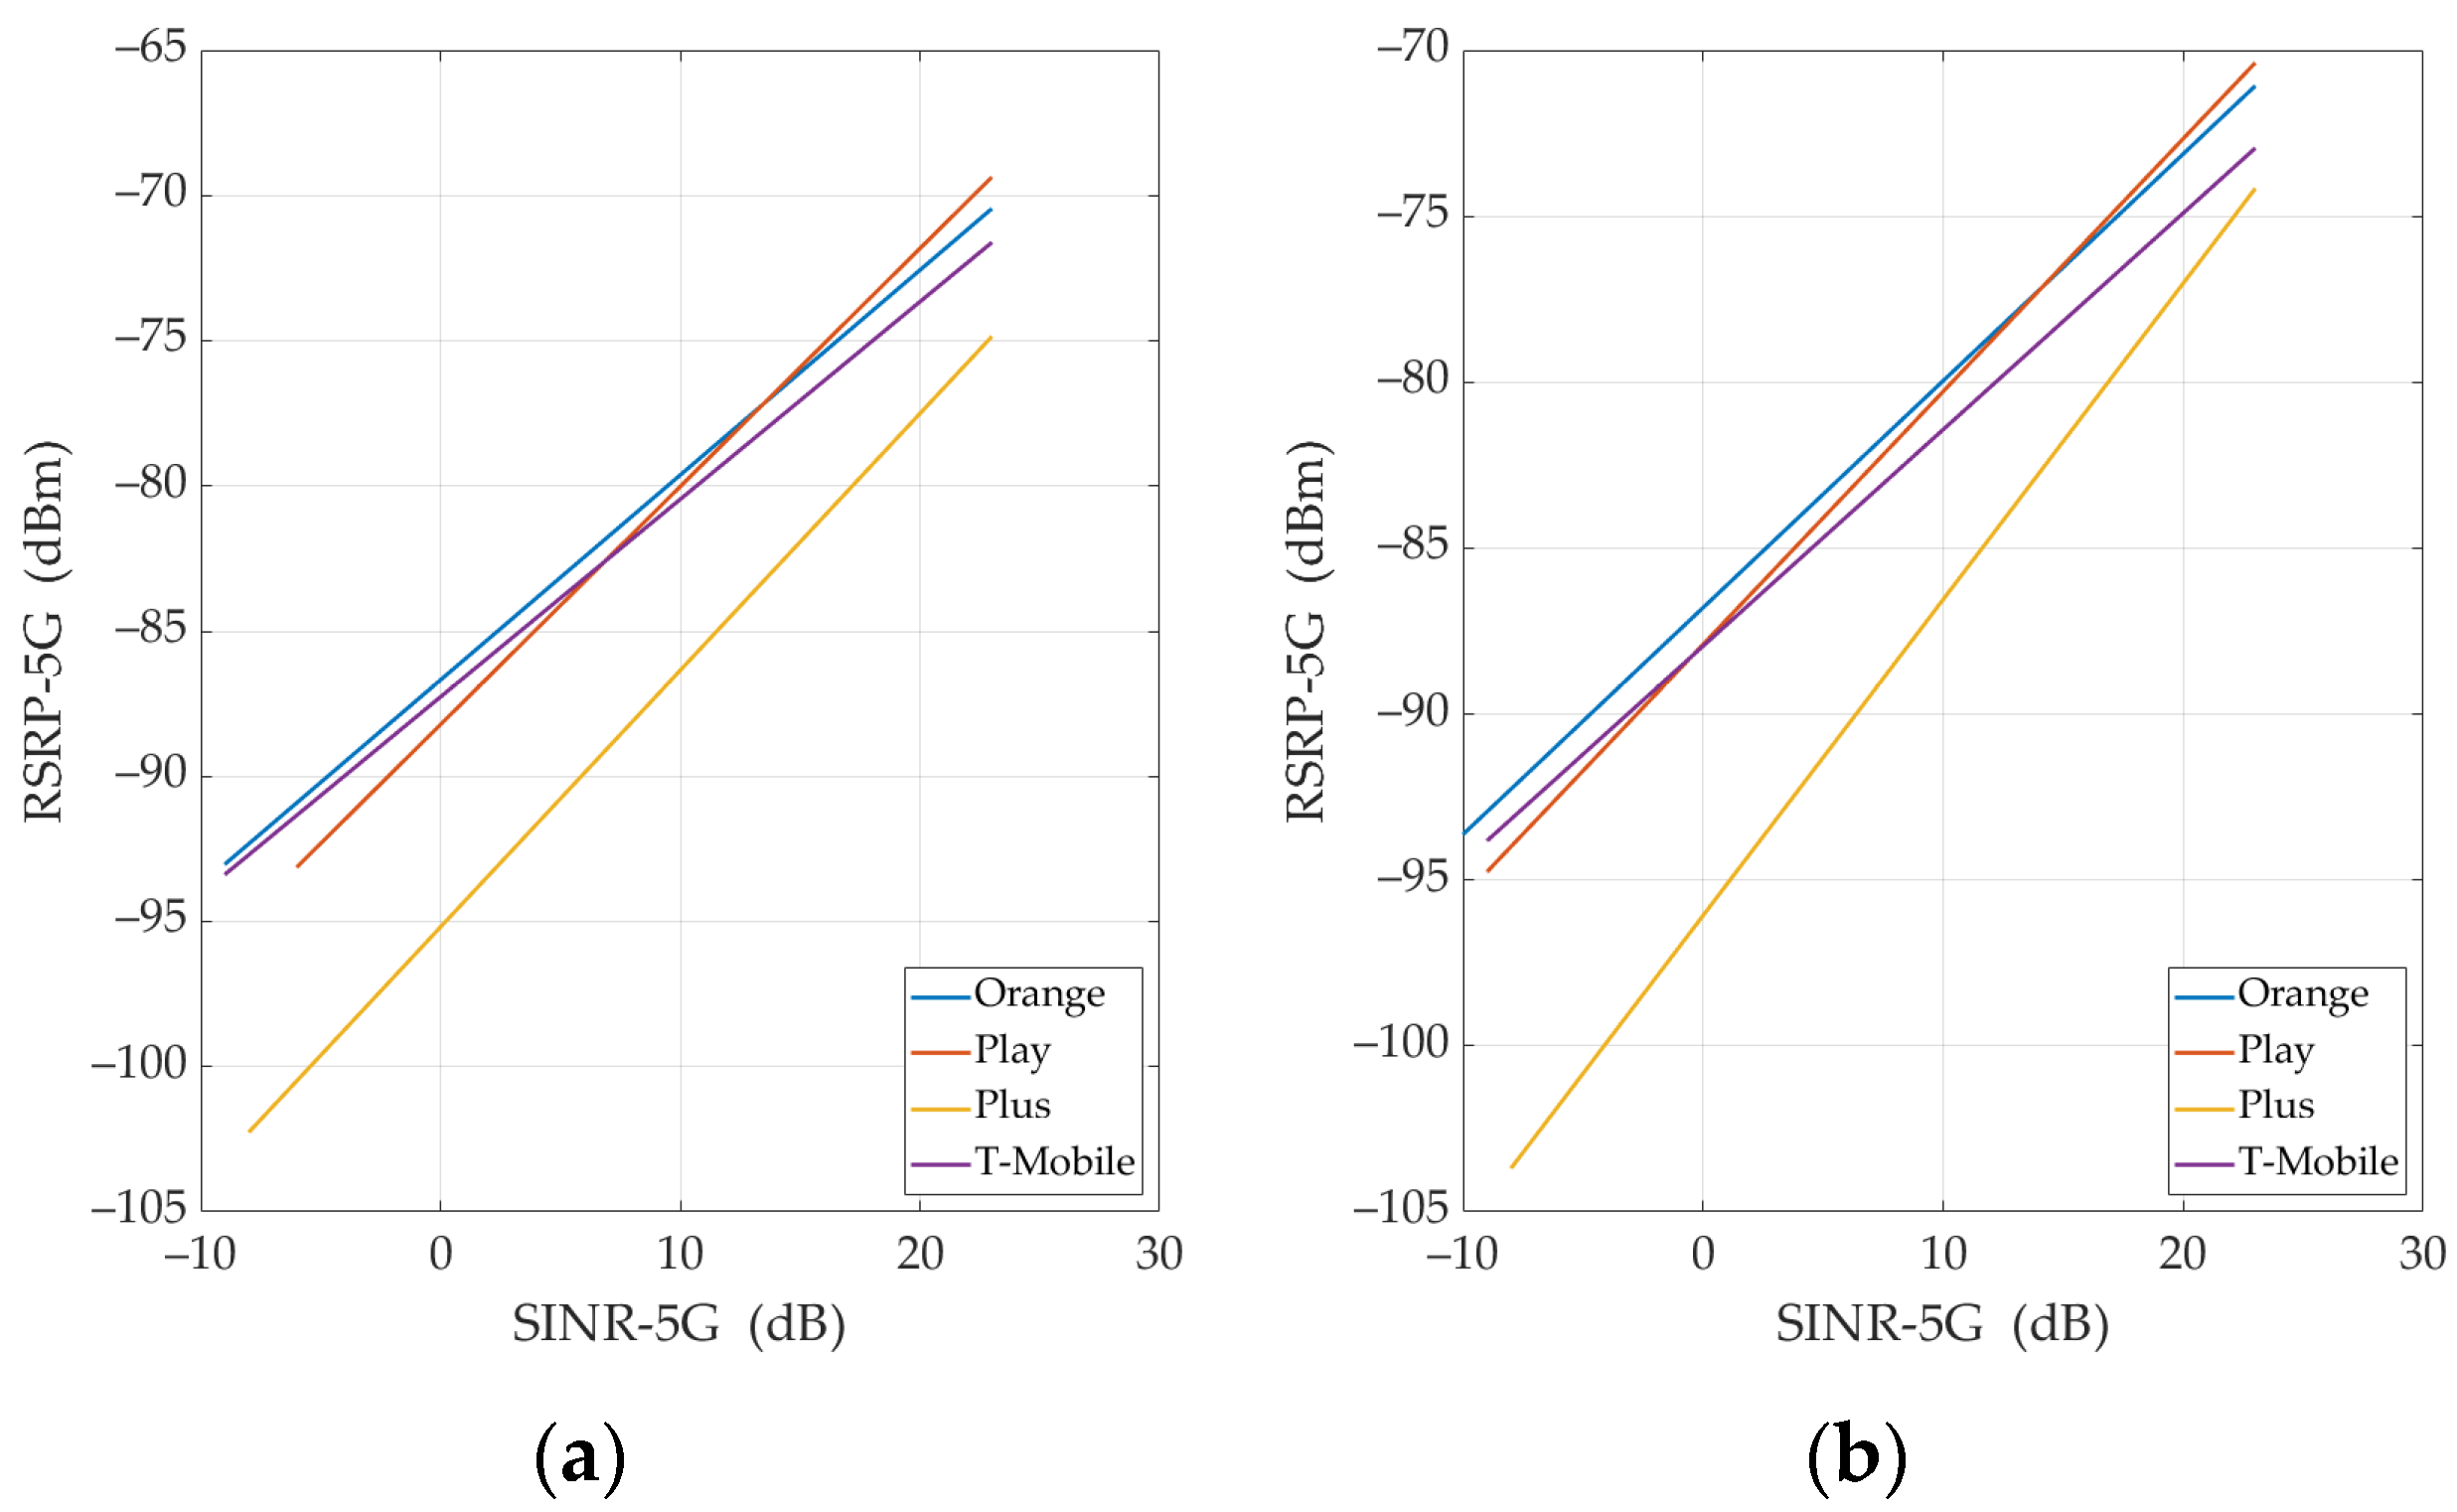
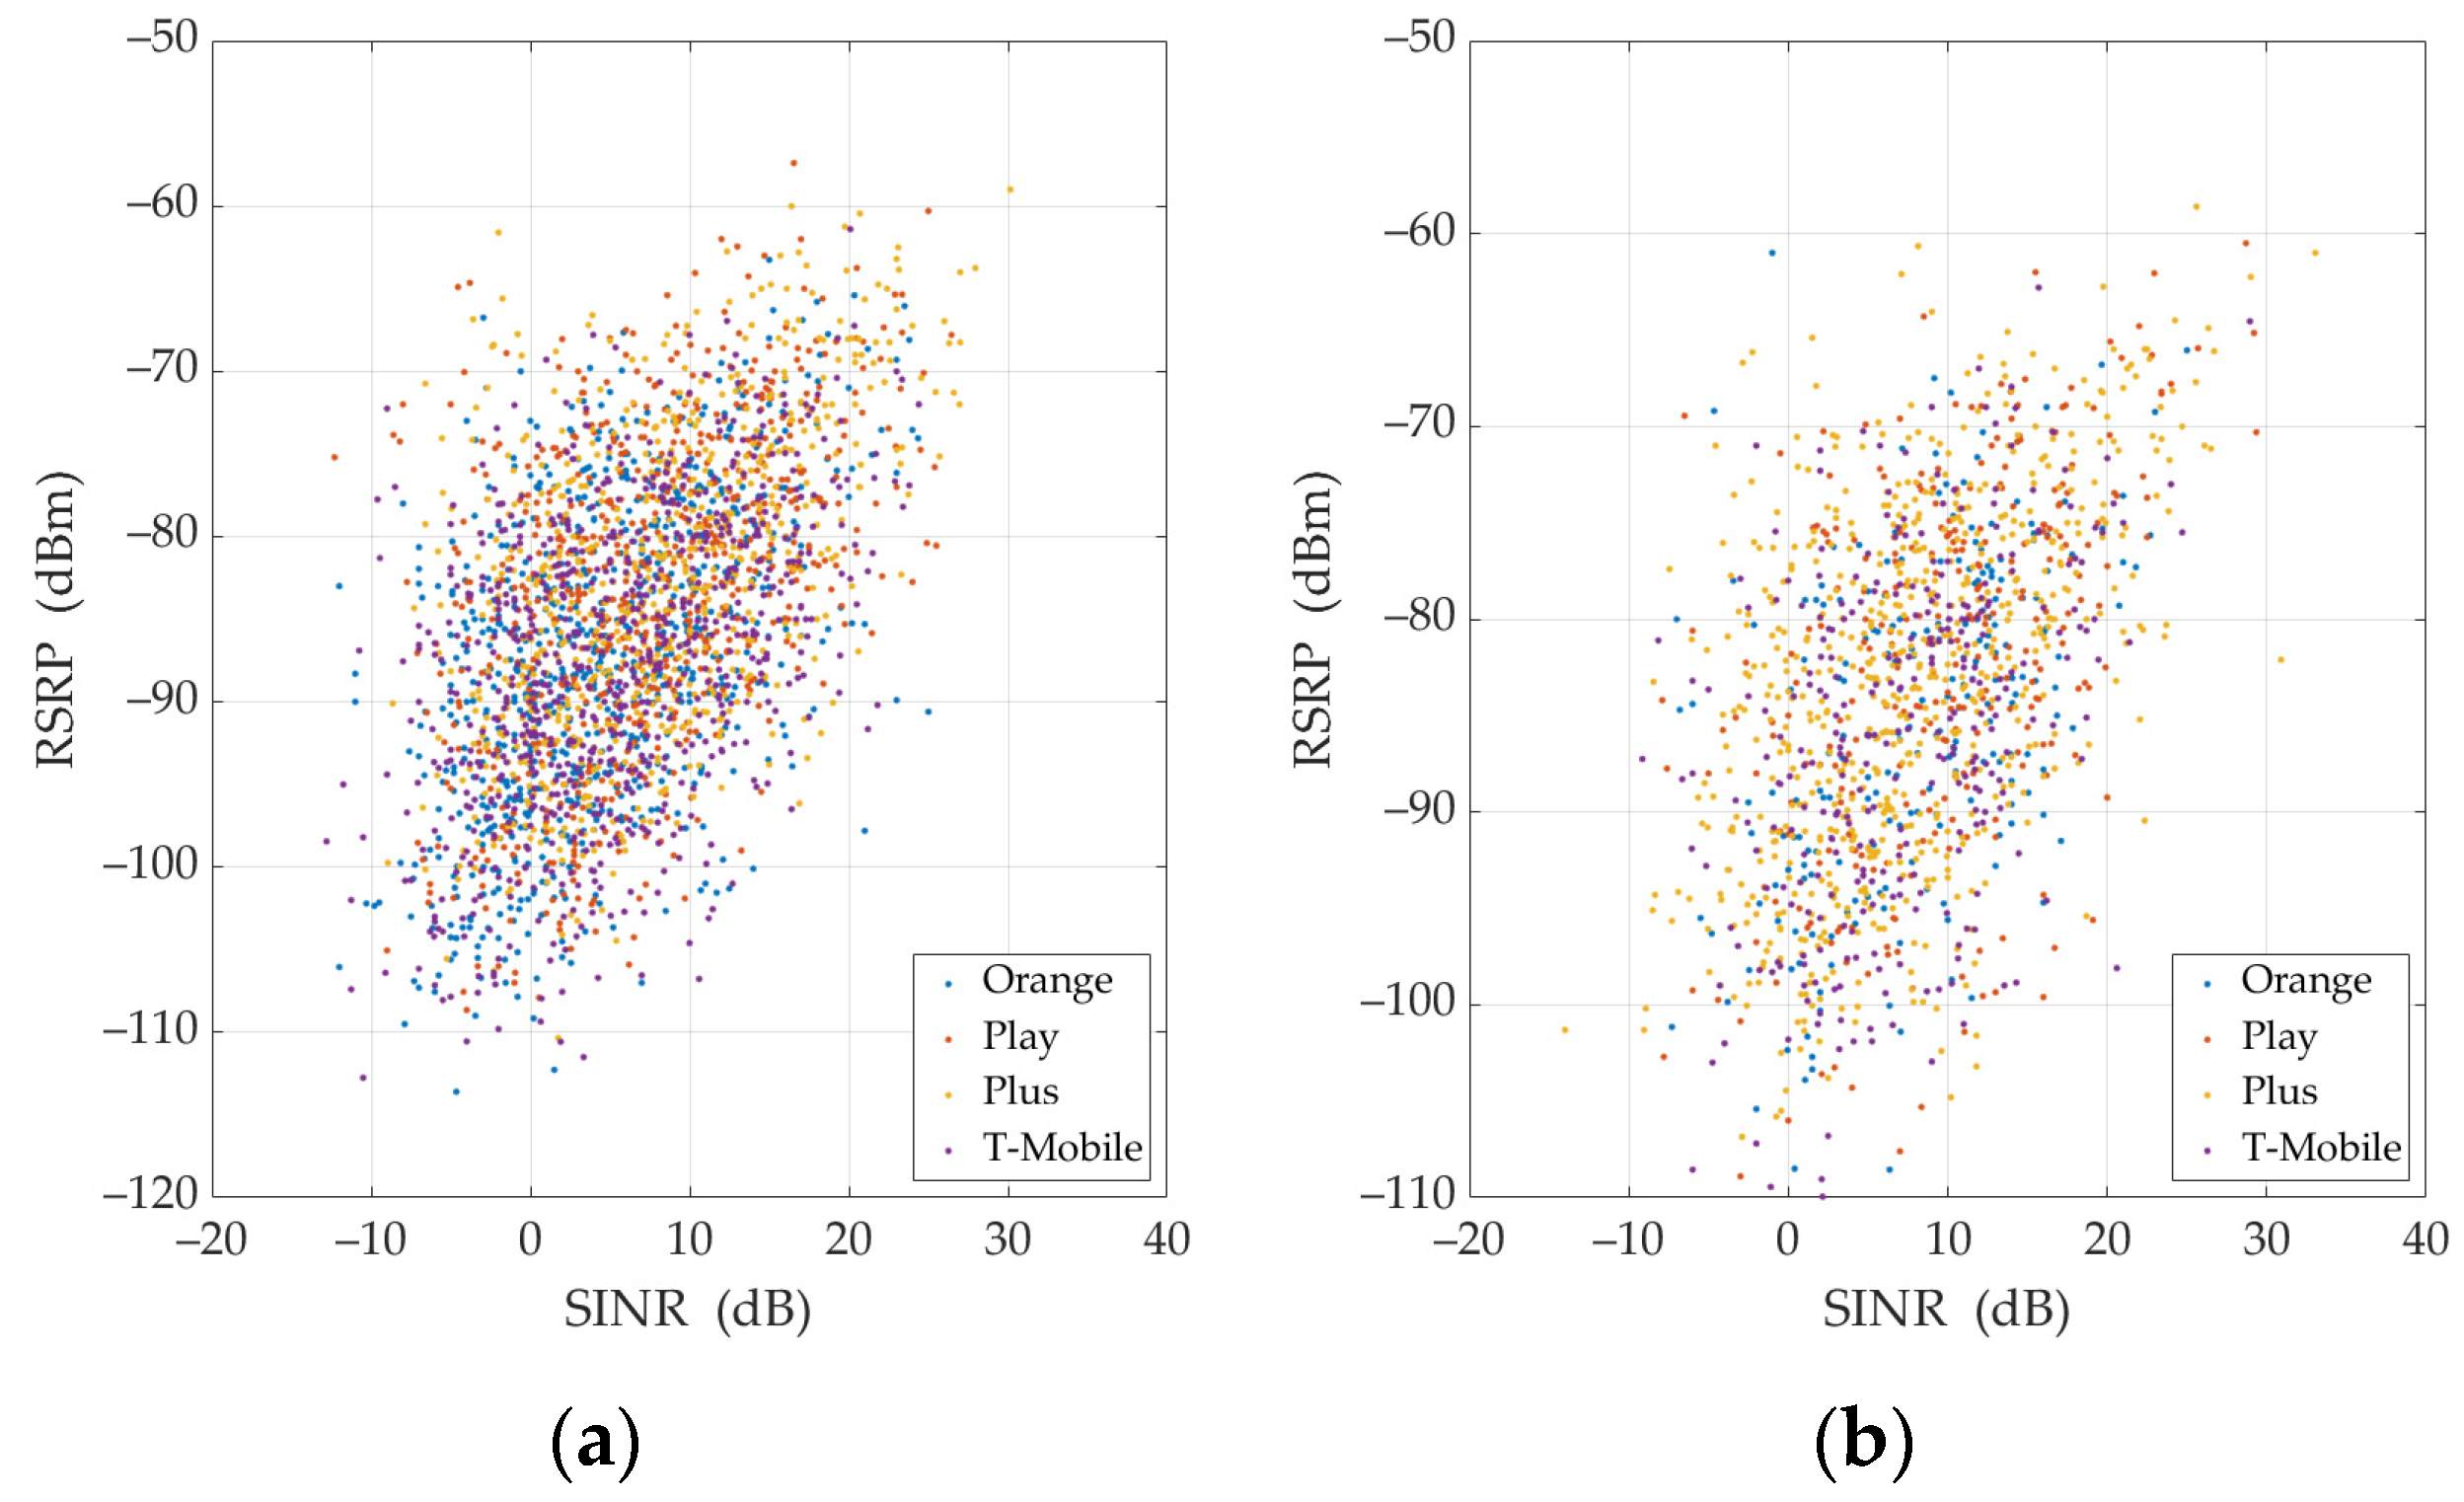
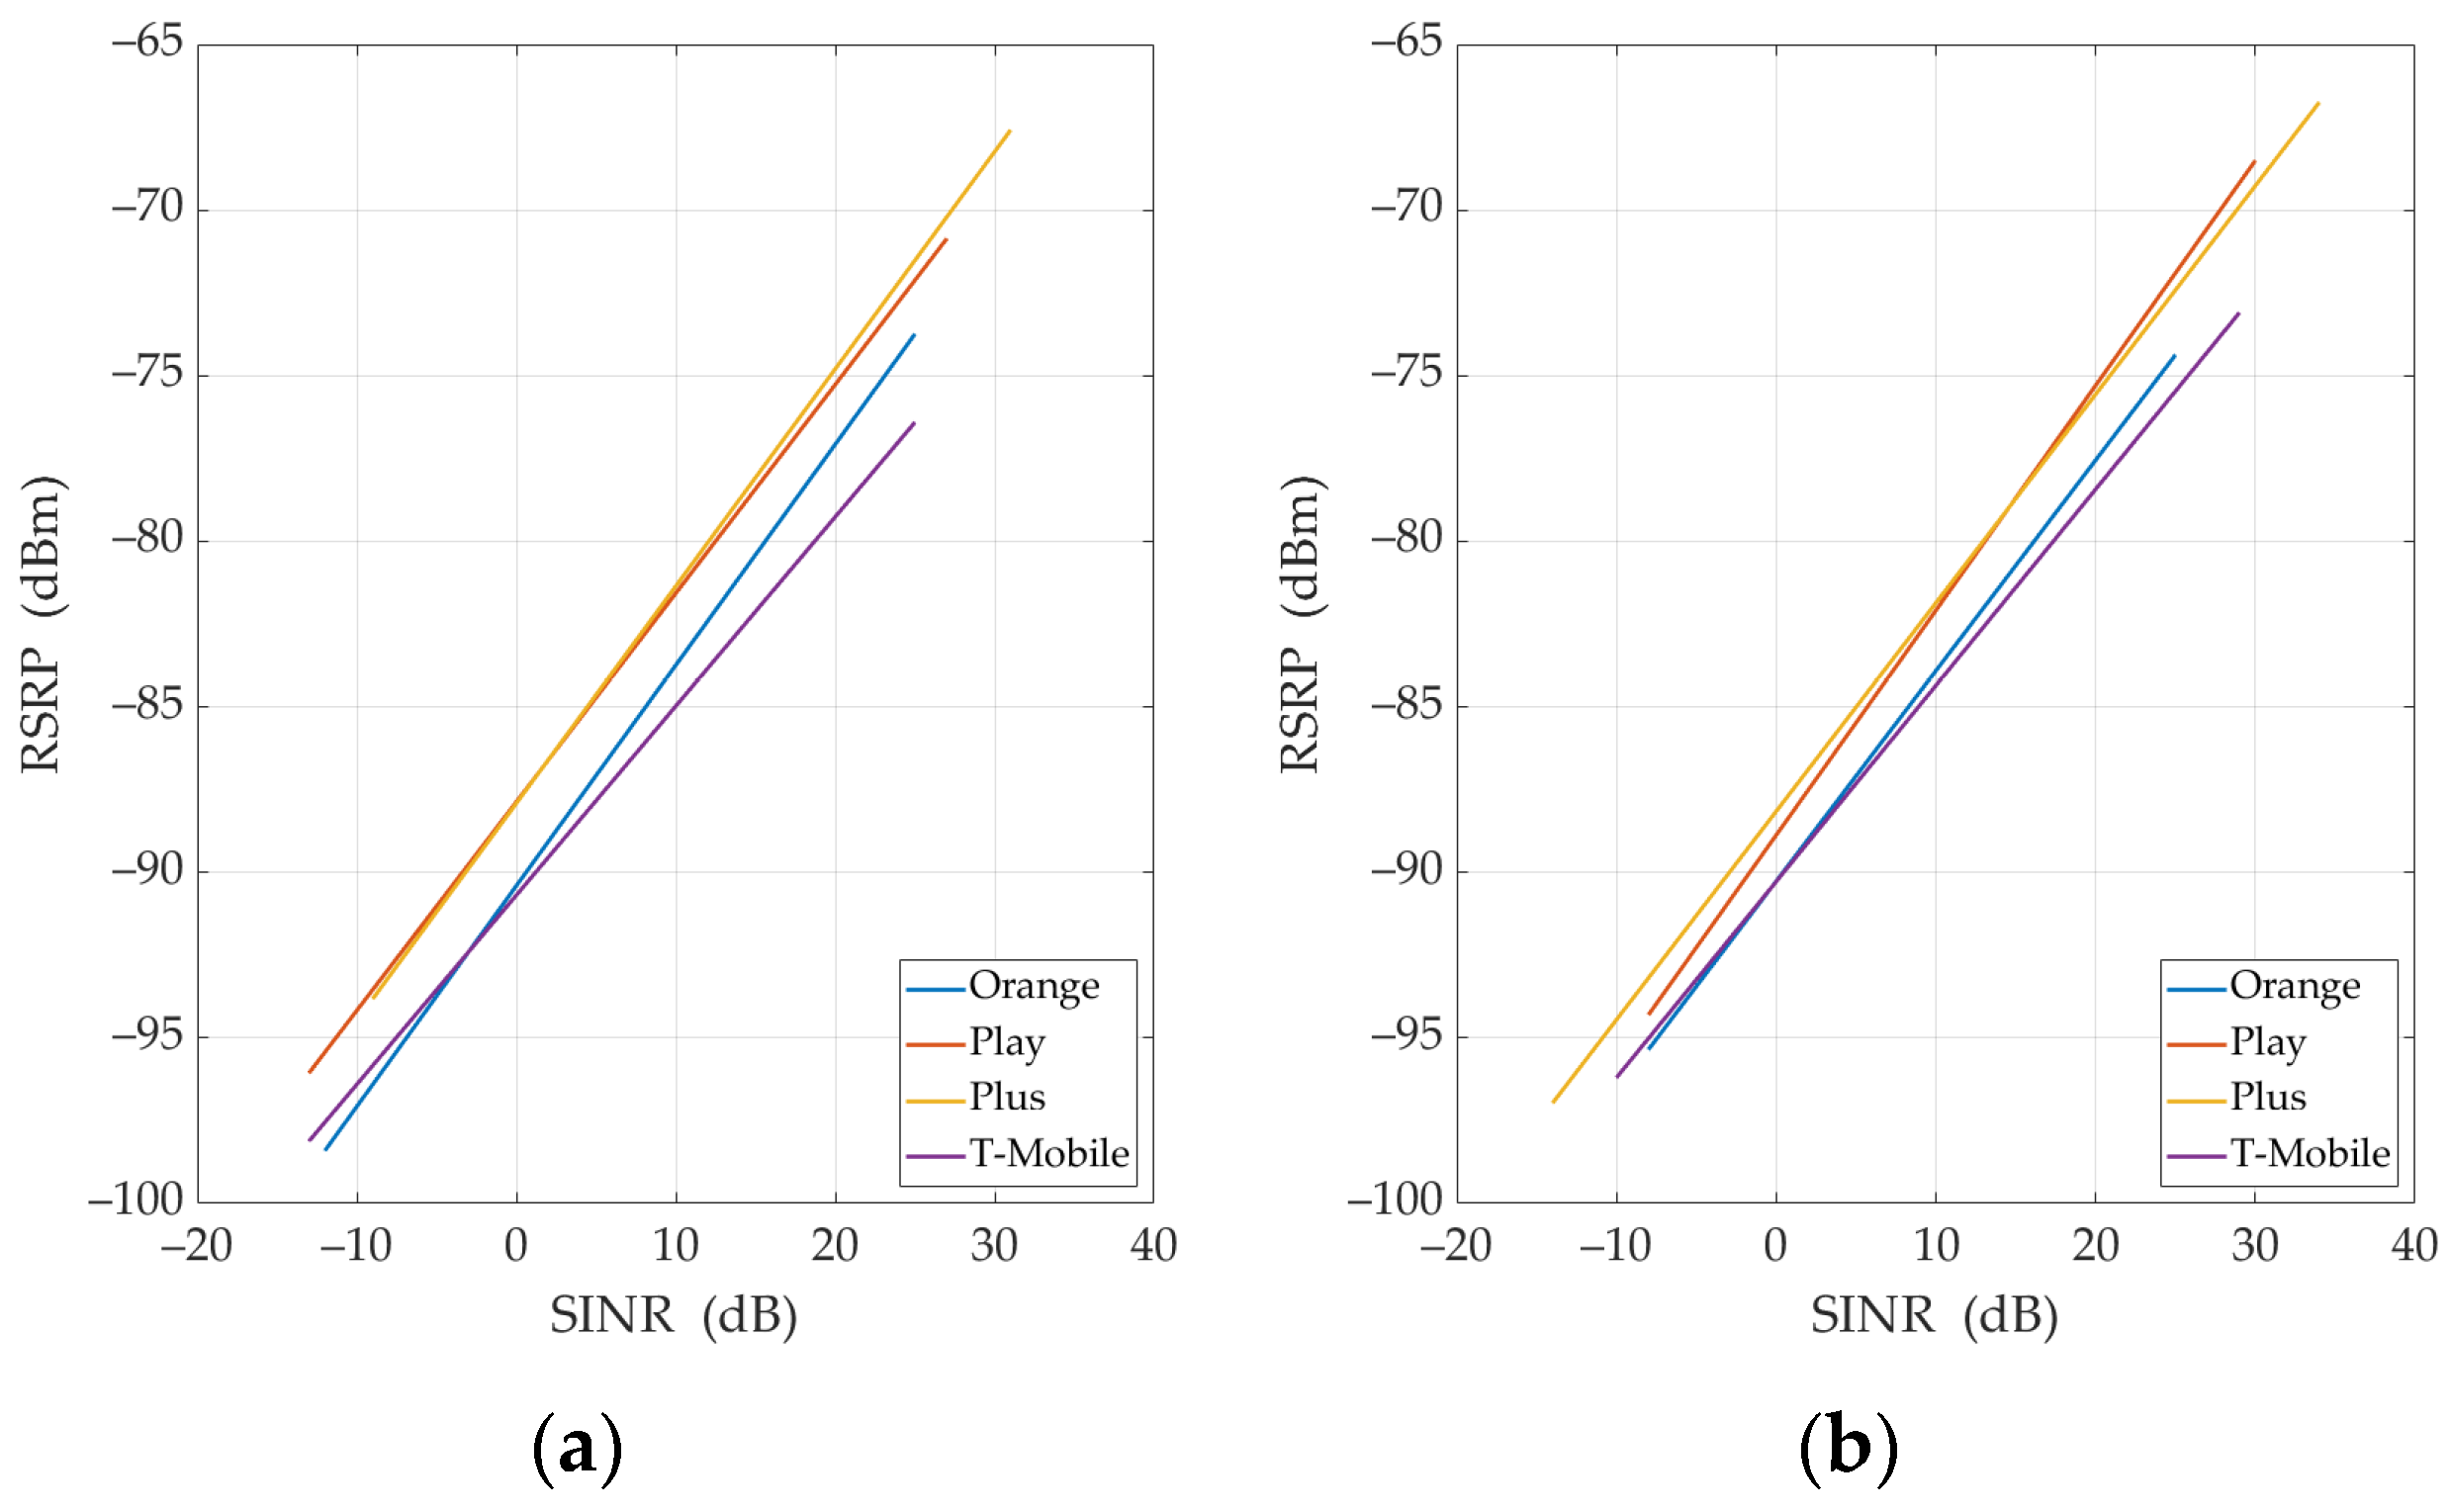
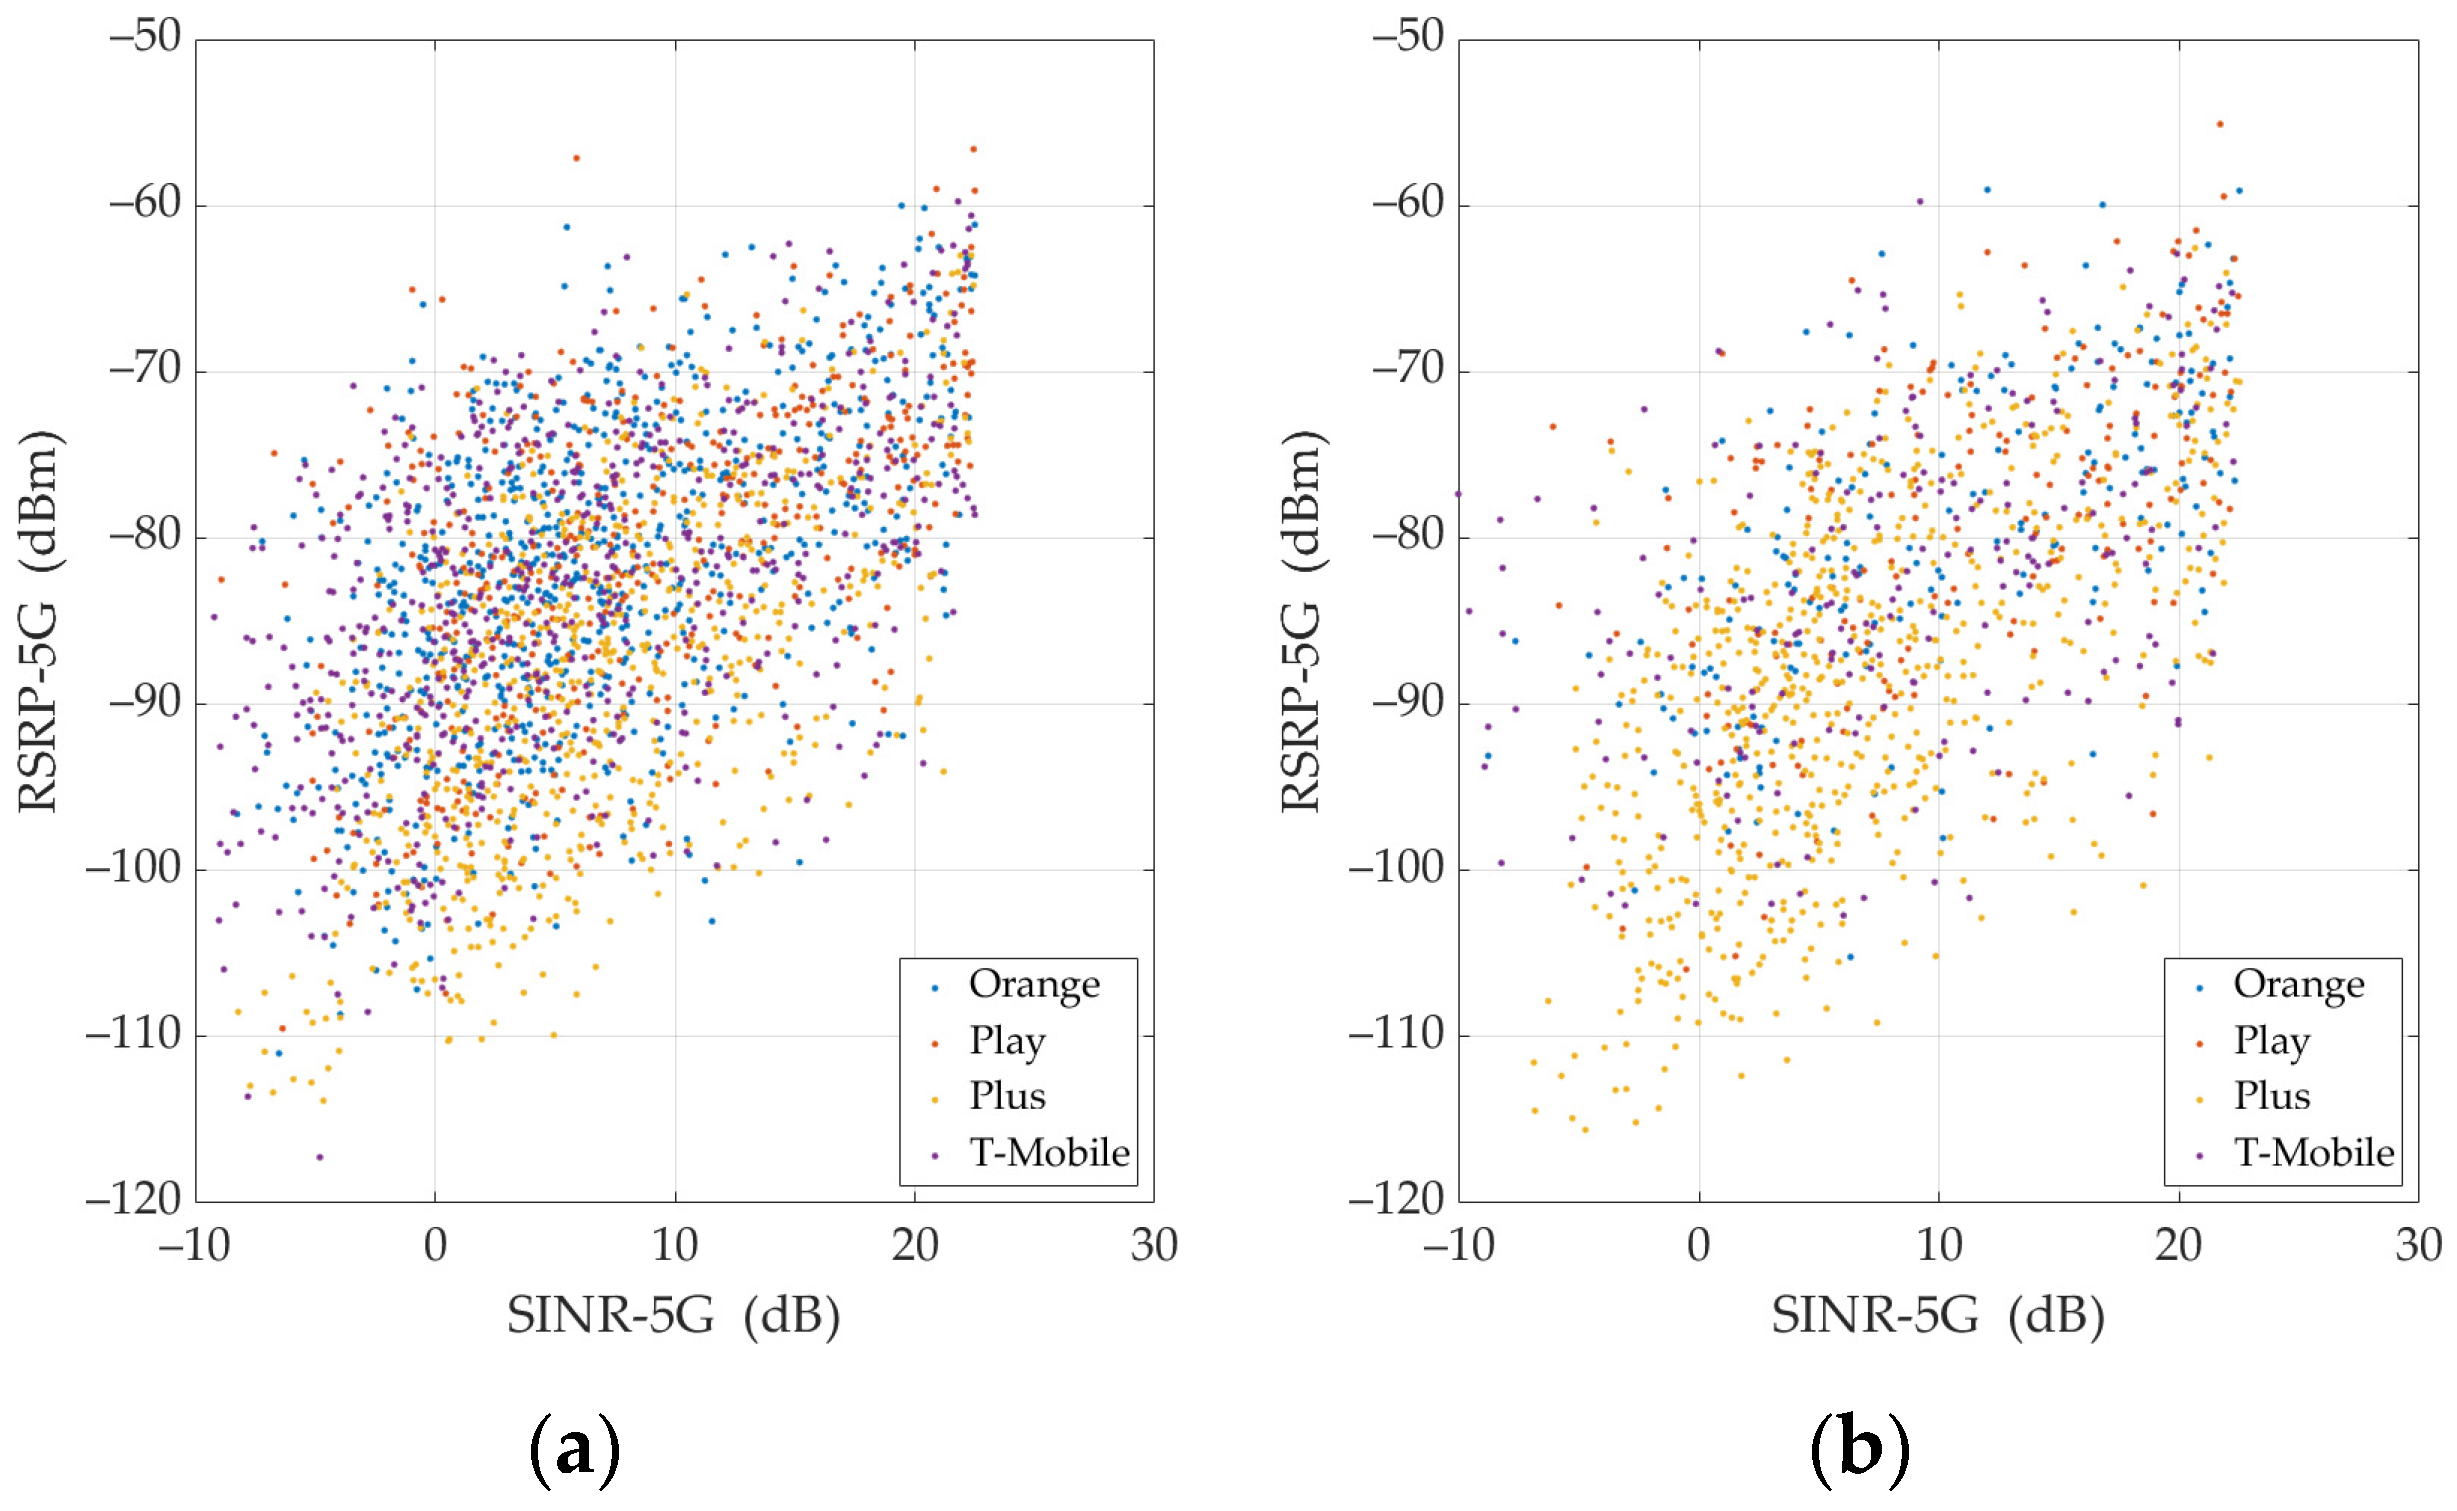
In this paper, we analyzed the QoS metrics and reference signal parameters used in LTE and 5G for the iPerf scenario, which were obtained in the drive test campaign conducted by Systemics-PAB in the urban area for four Polish MNOs. These measurement data were the basis for the correlation analysis performed for TCP and UDP, and UL and DL. Based on PCC, we selected the best signal parameters that can be used to estimate throughput for TCP/UDP, and jitter only for UDP. In this regard, we propose to use RSRP for UL and SINR for DL. In terms of assessing the relationship between radio signal metrics (i.e., RSRP and SINR), we find that these metrics are independent of the provided services and can generally be analyzed independently of the MNO. Only the Plus for the relationship between RSRP-5G and SINR-5G is characterized by a certain deviation.
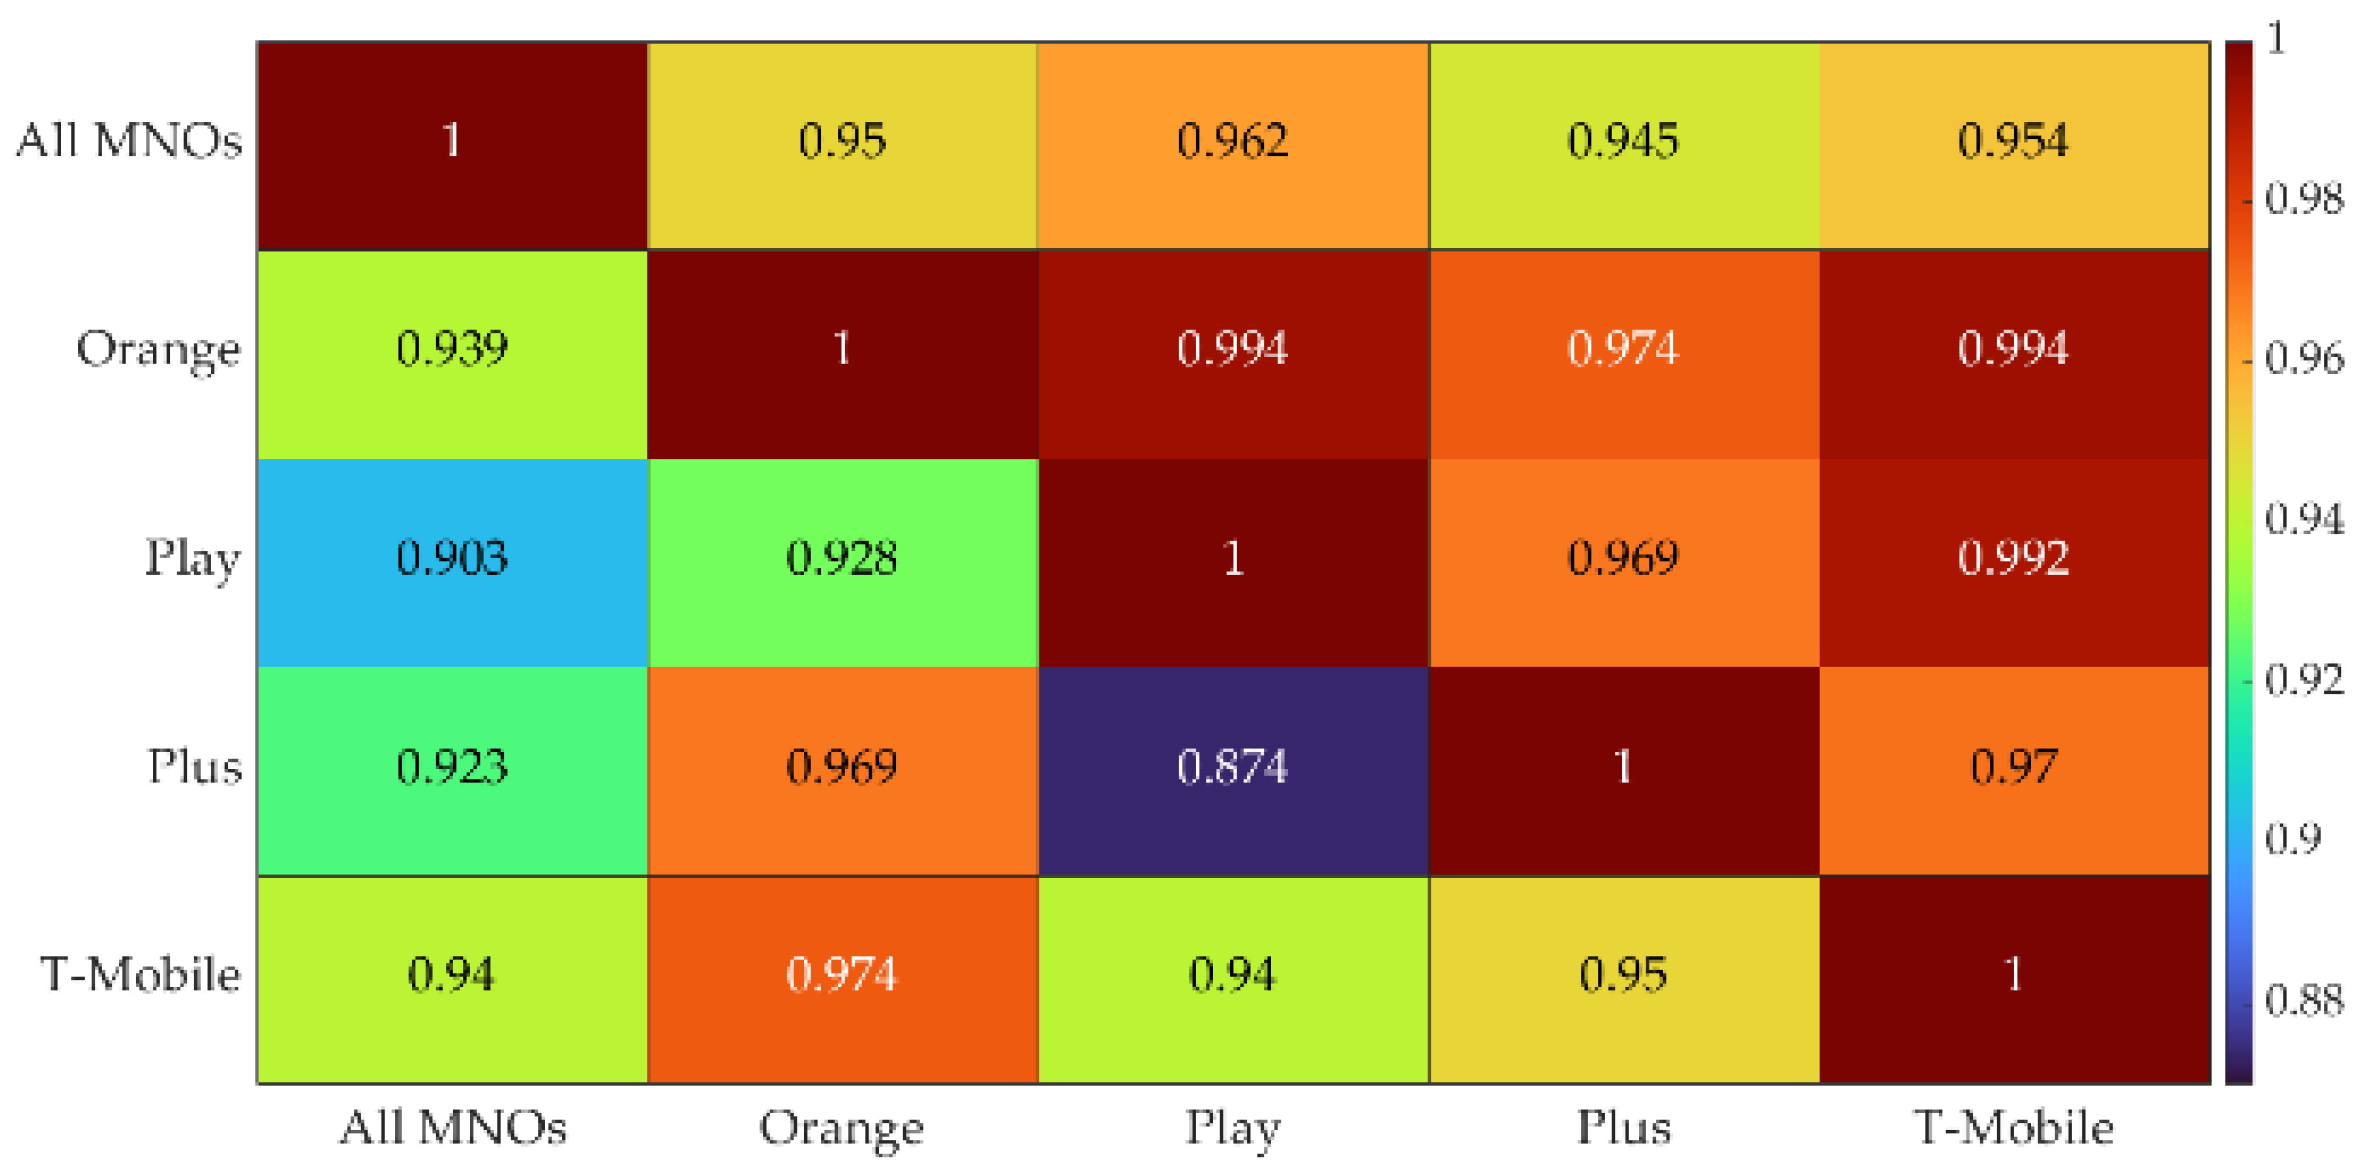
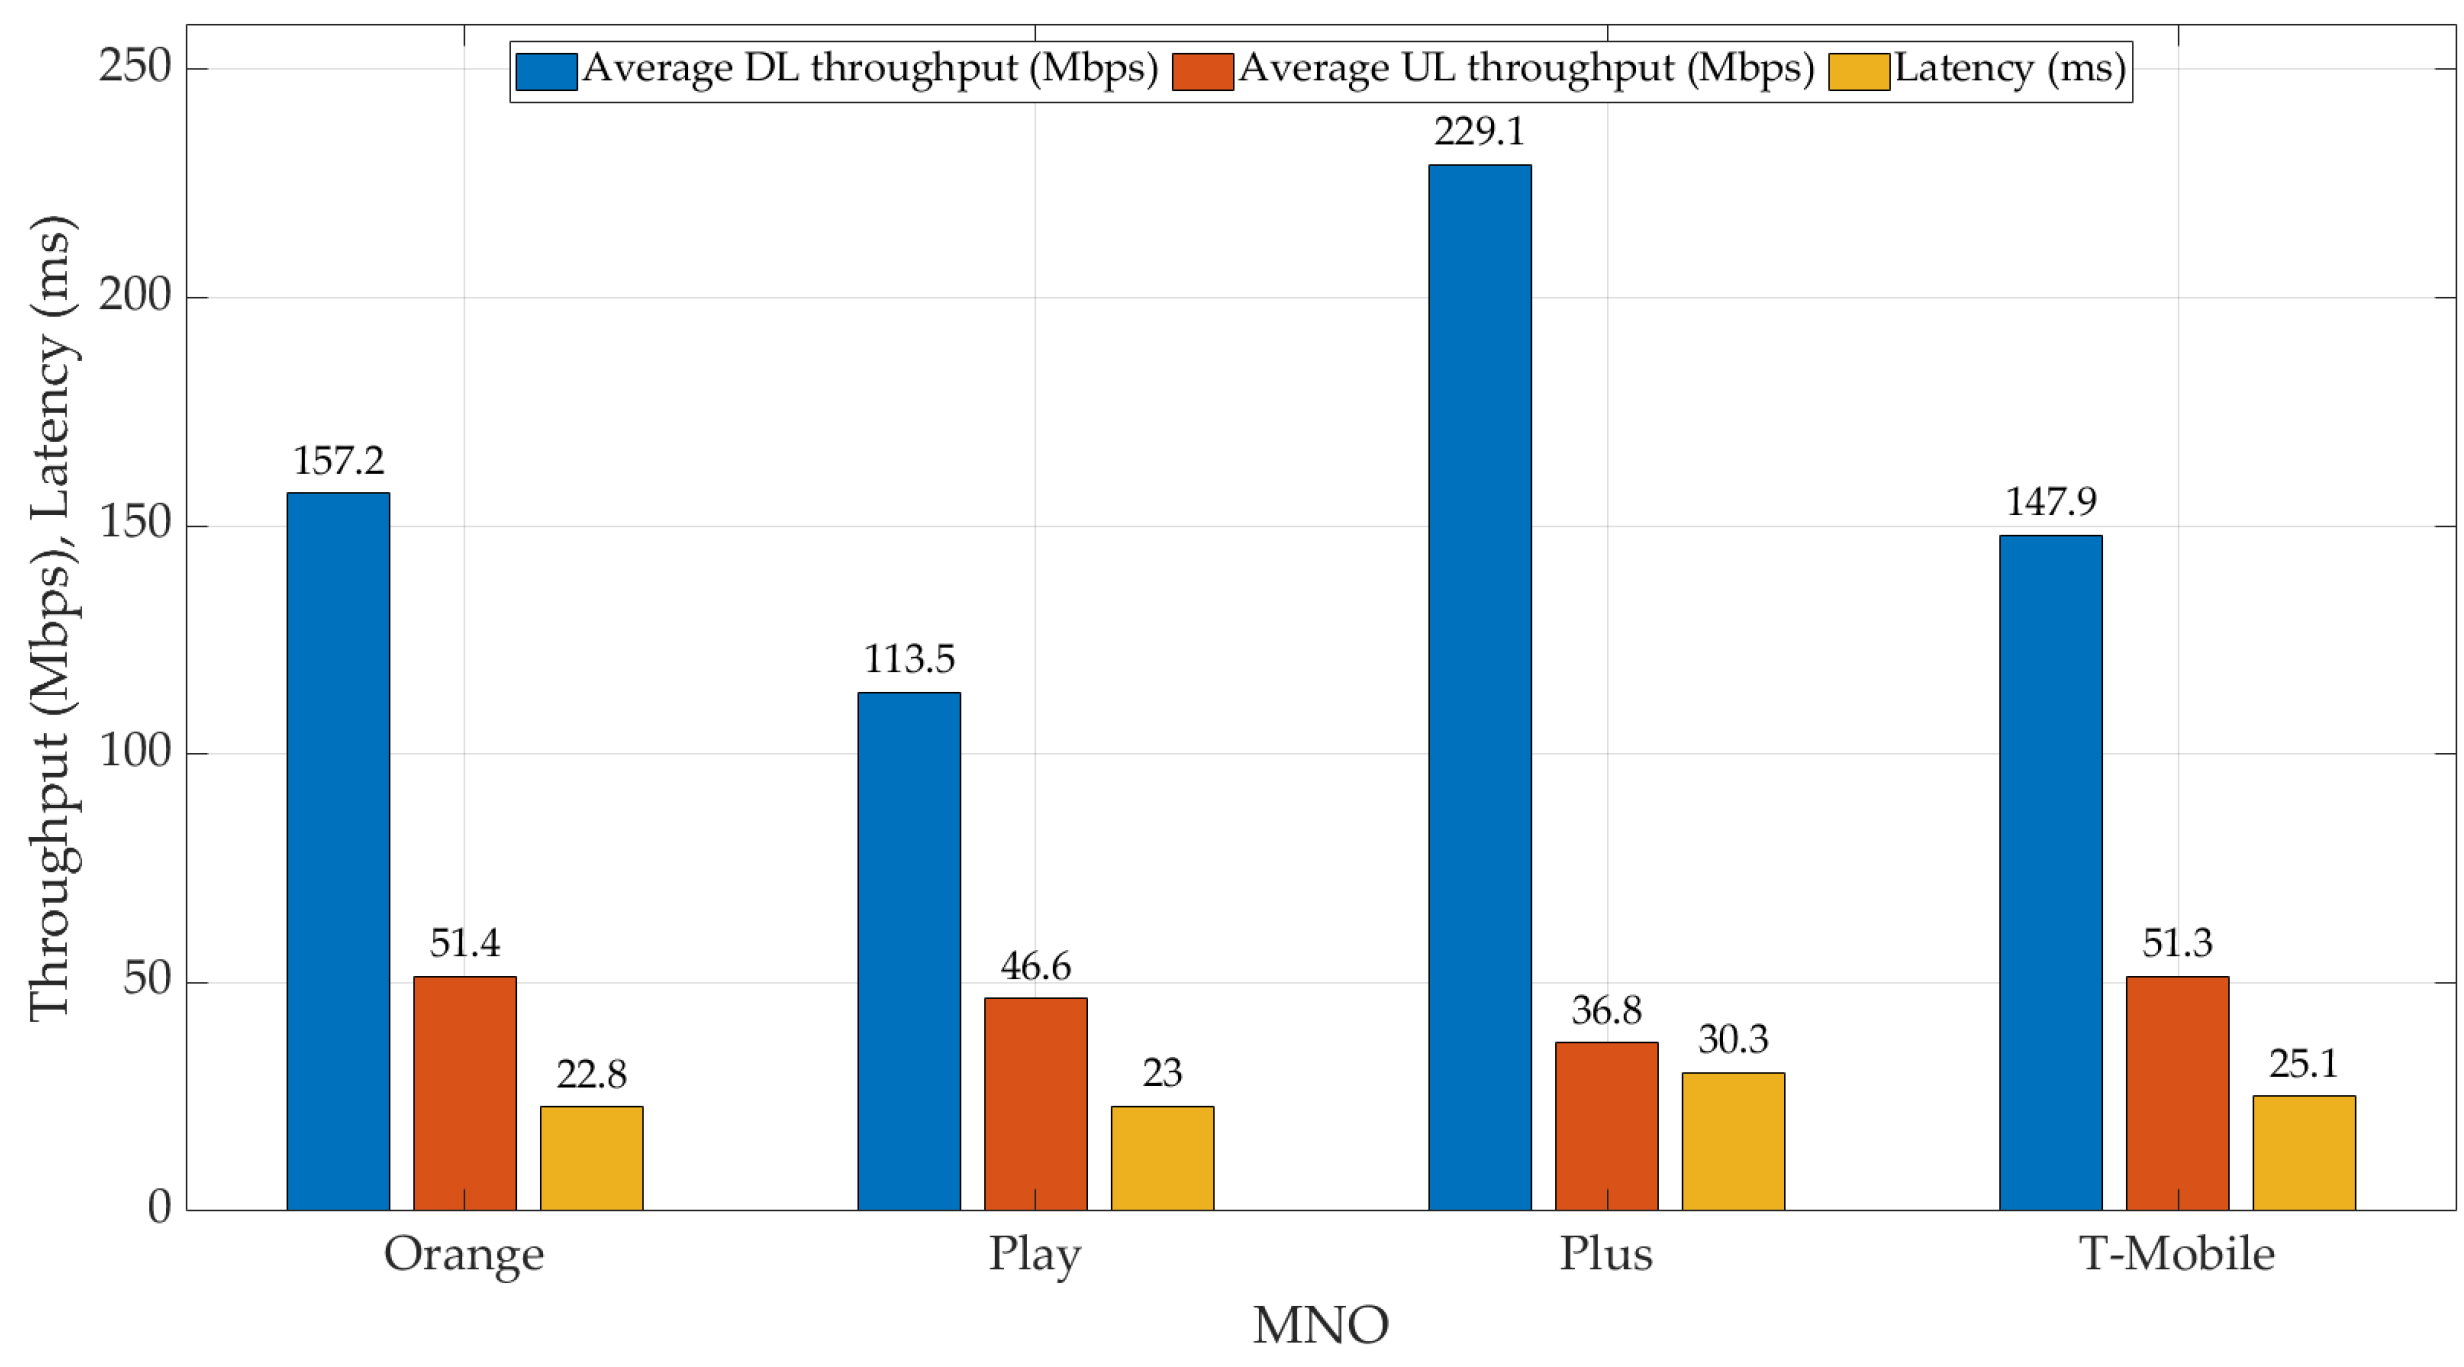
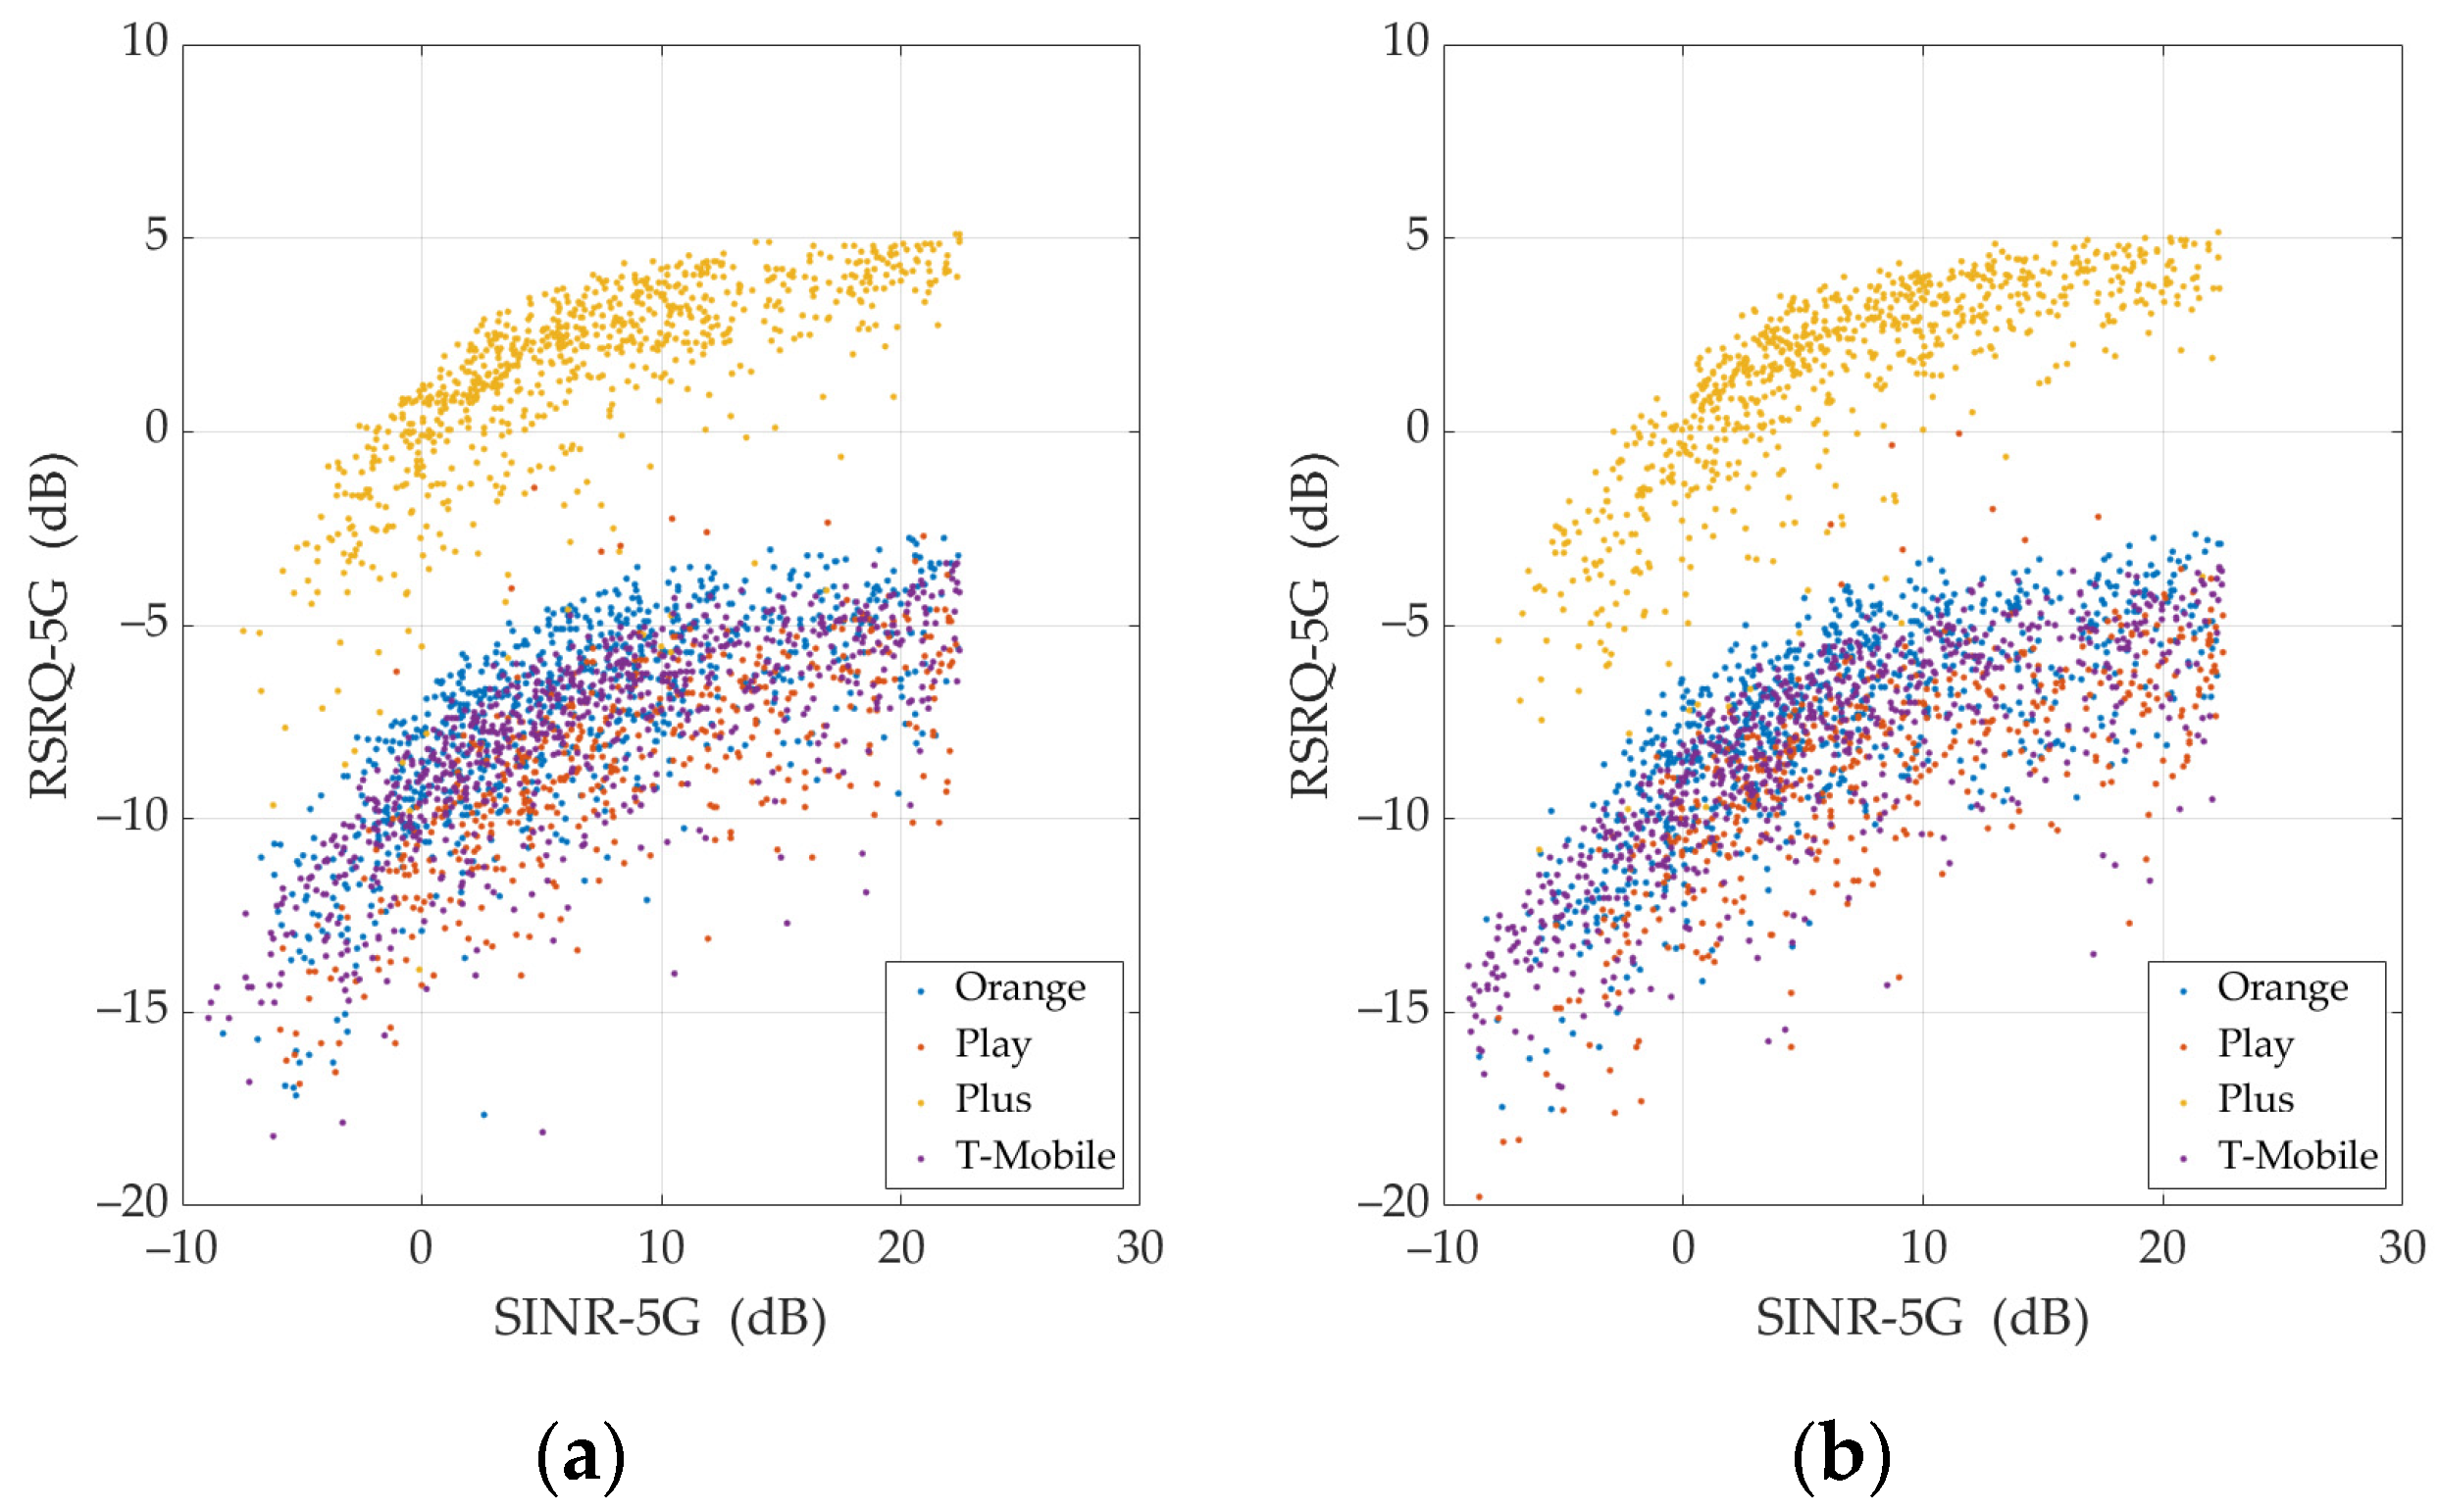
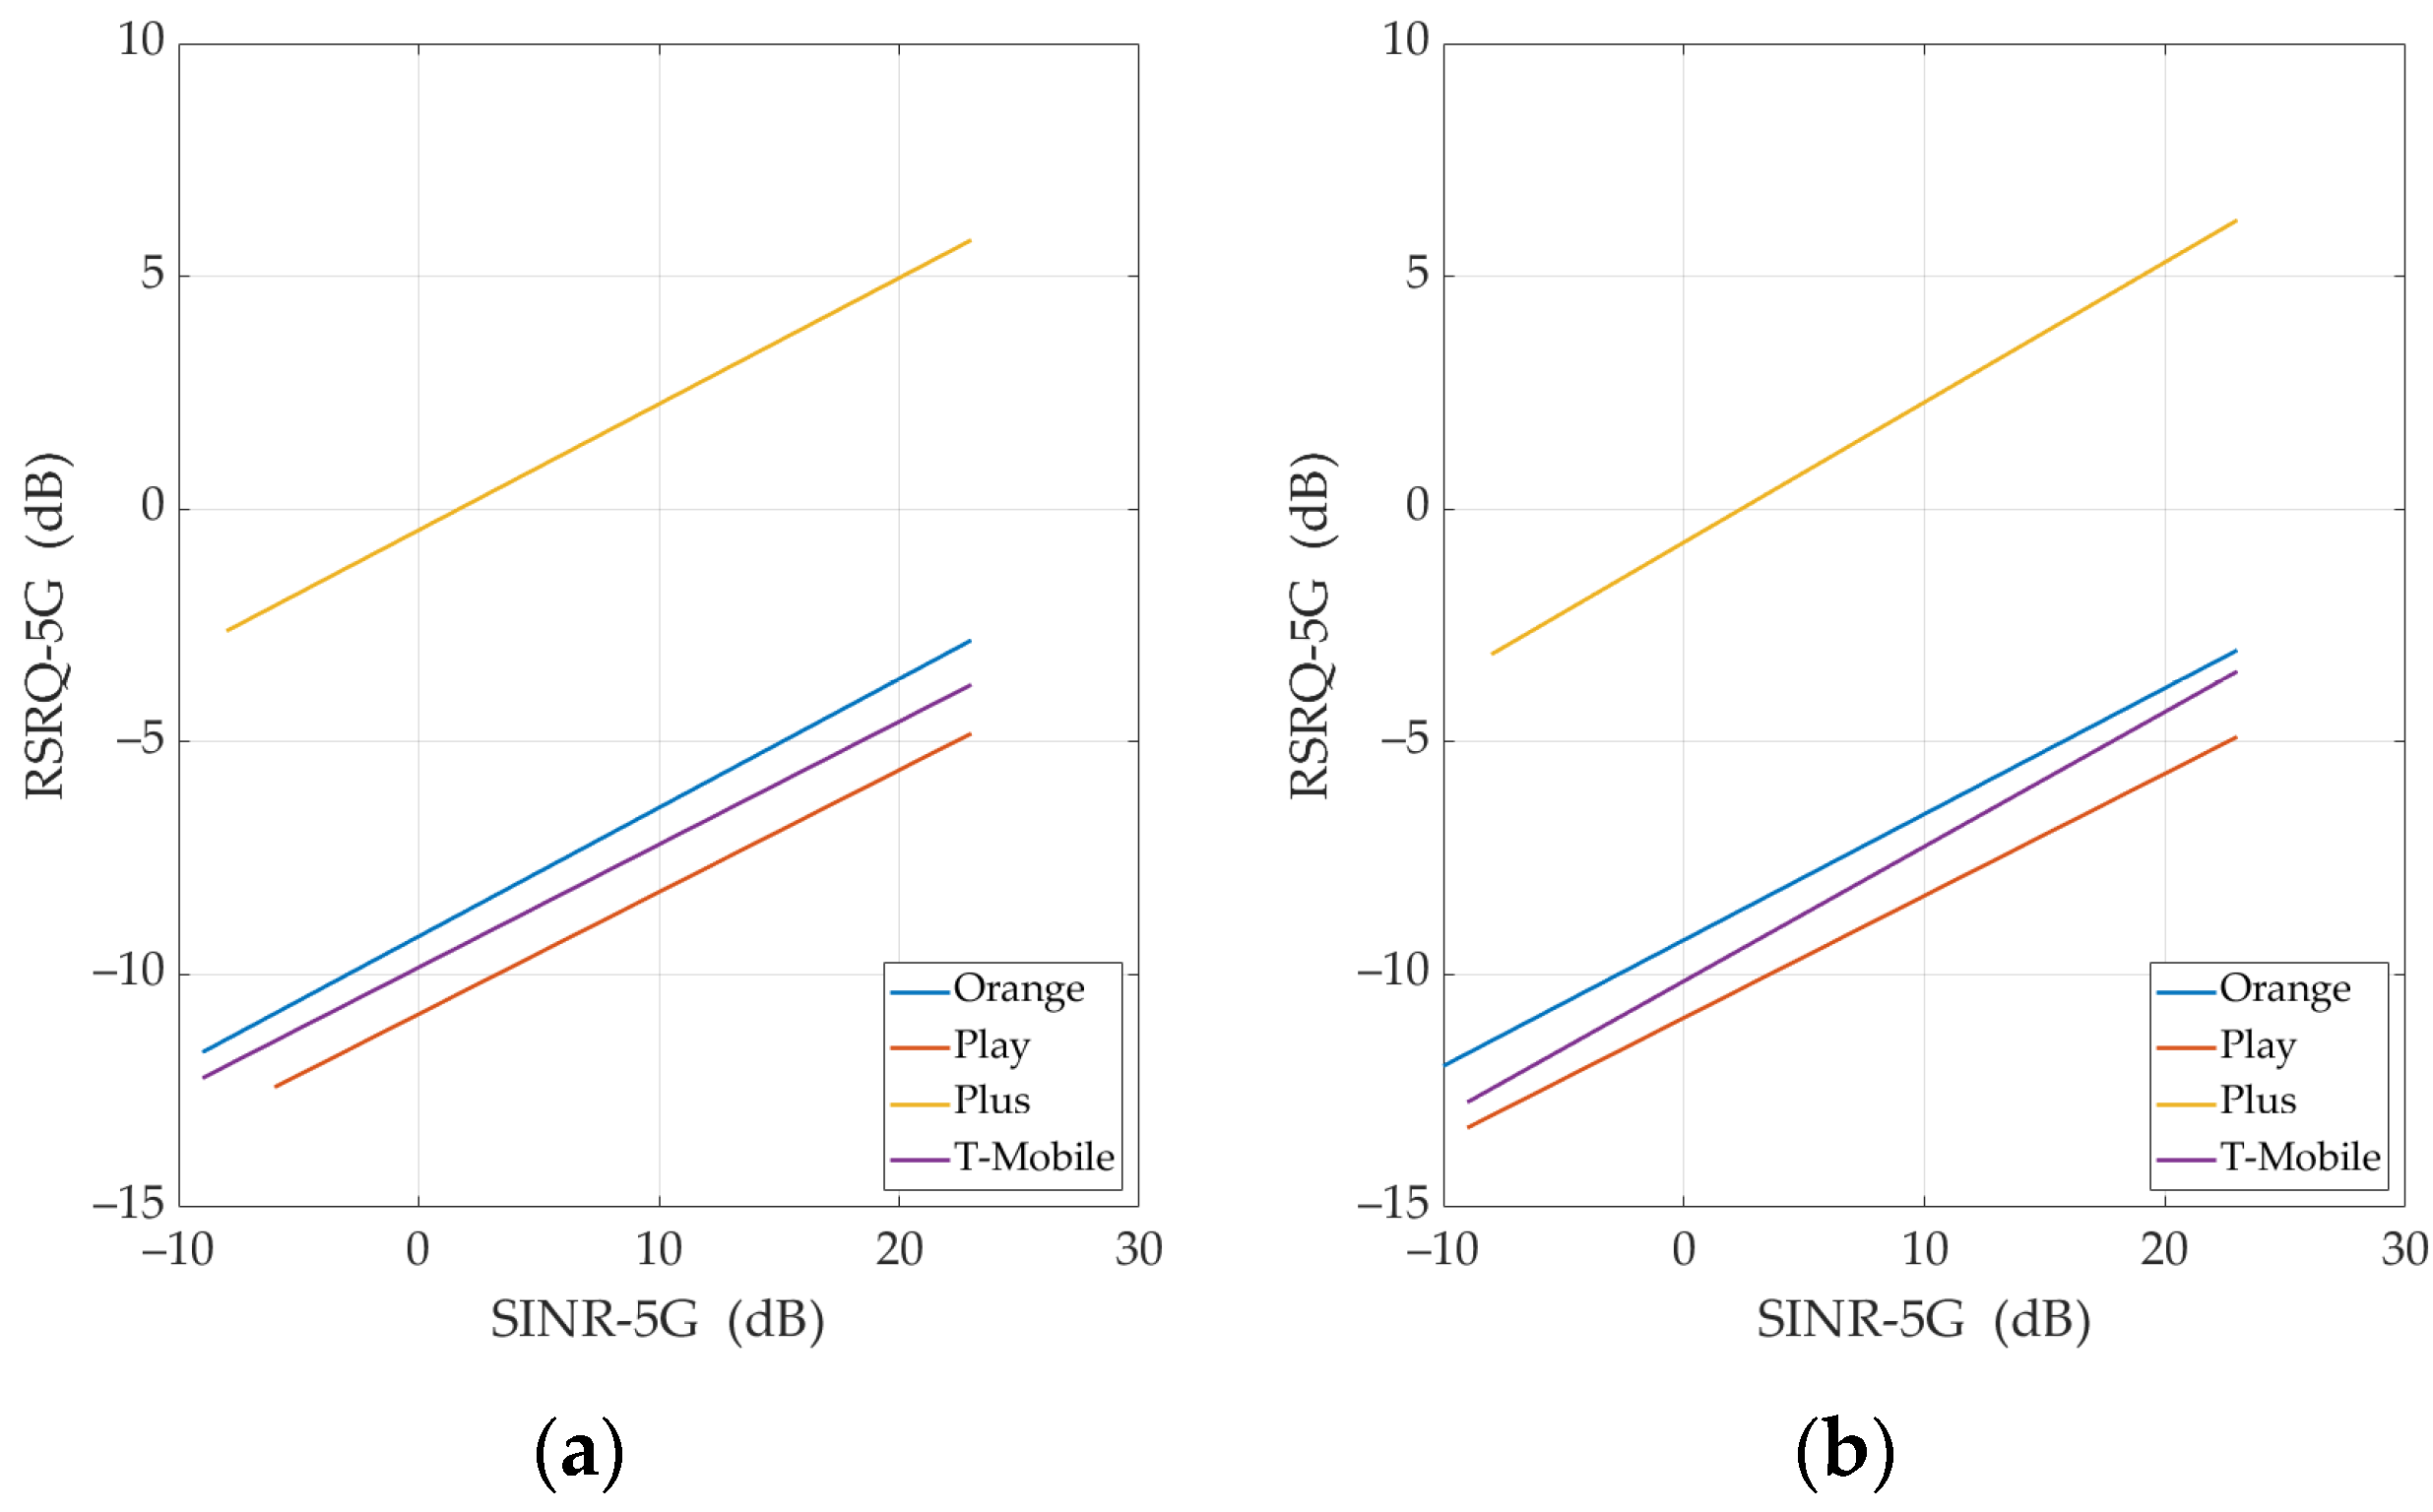
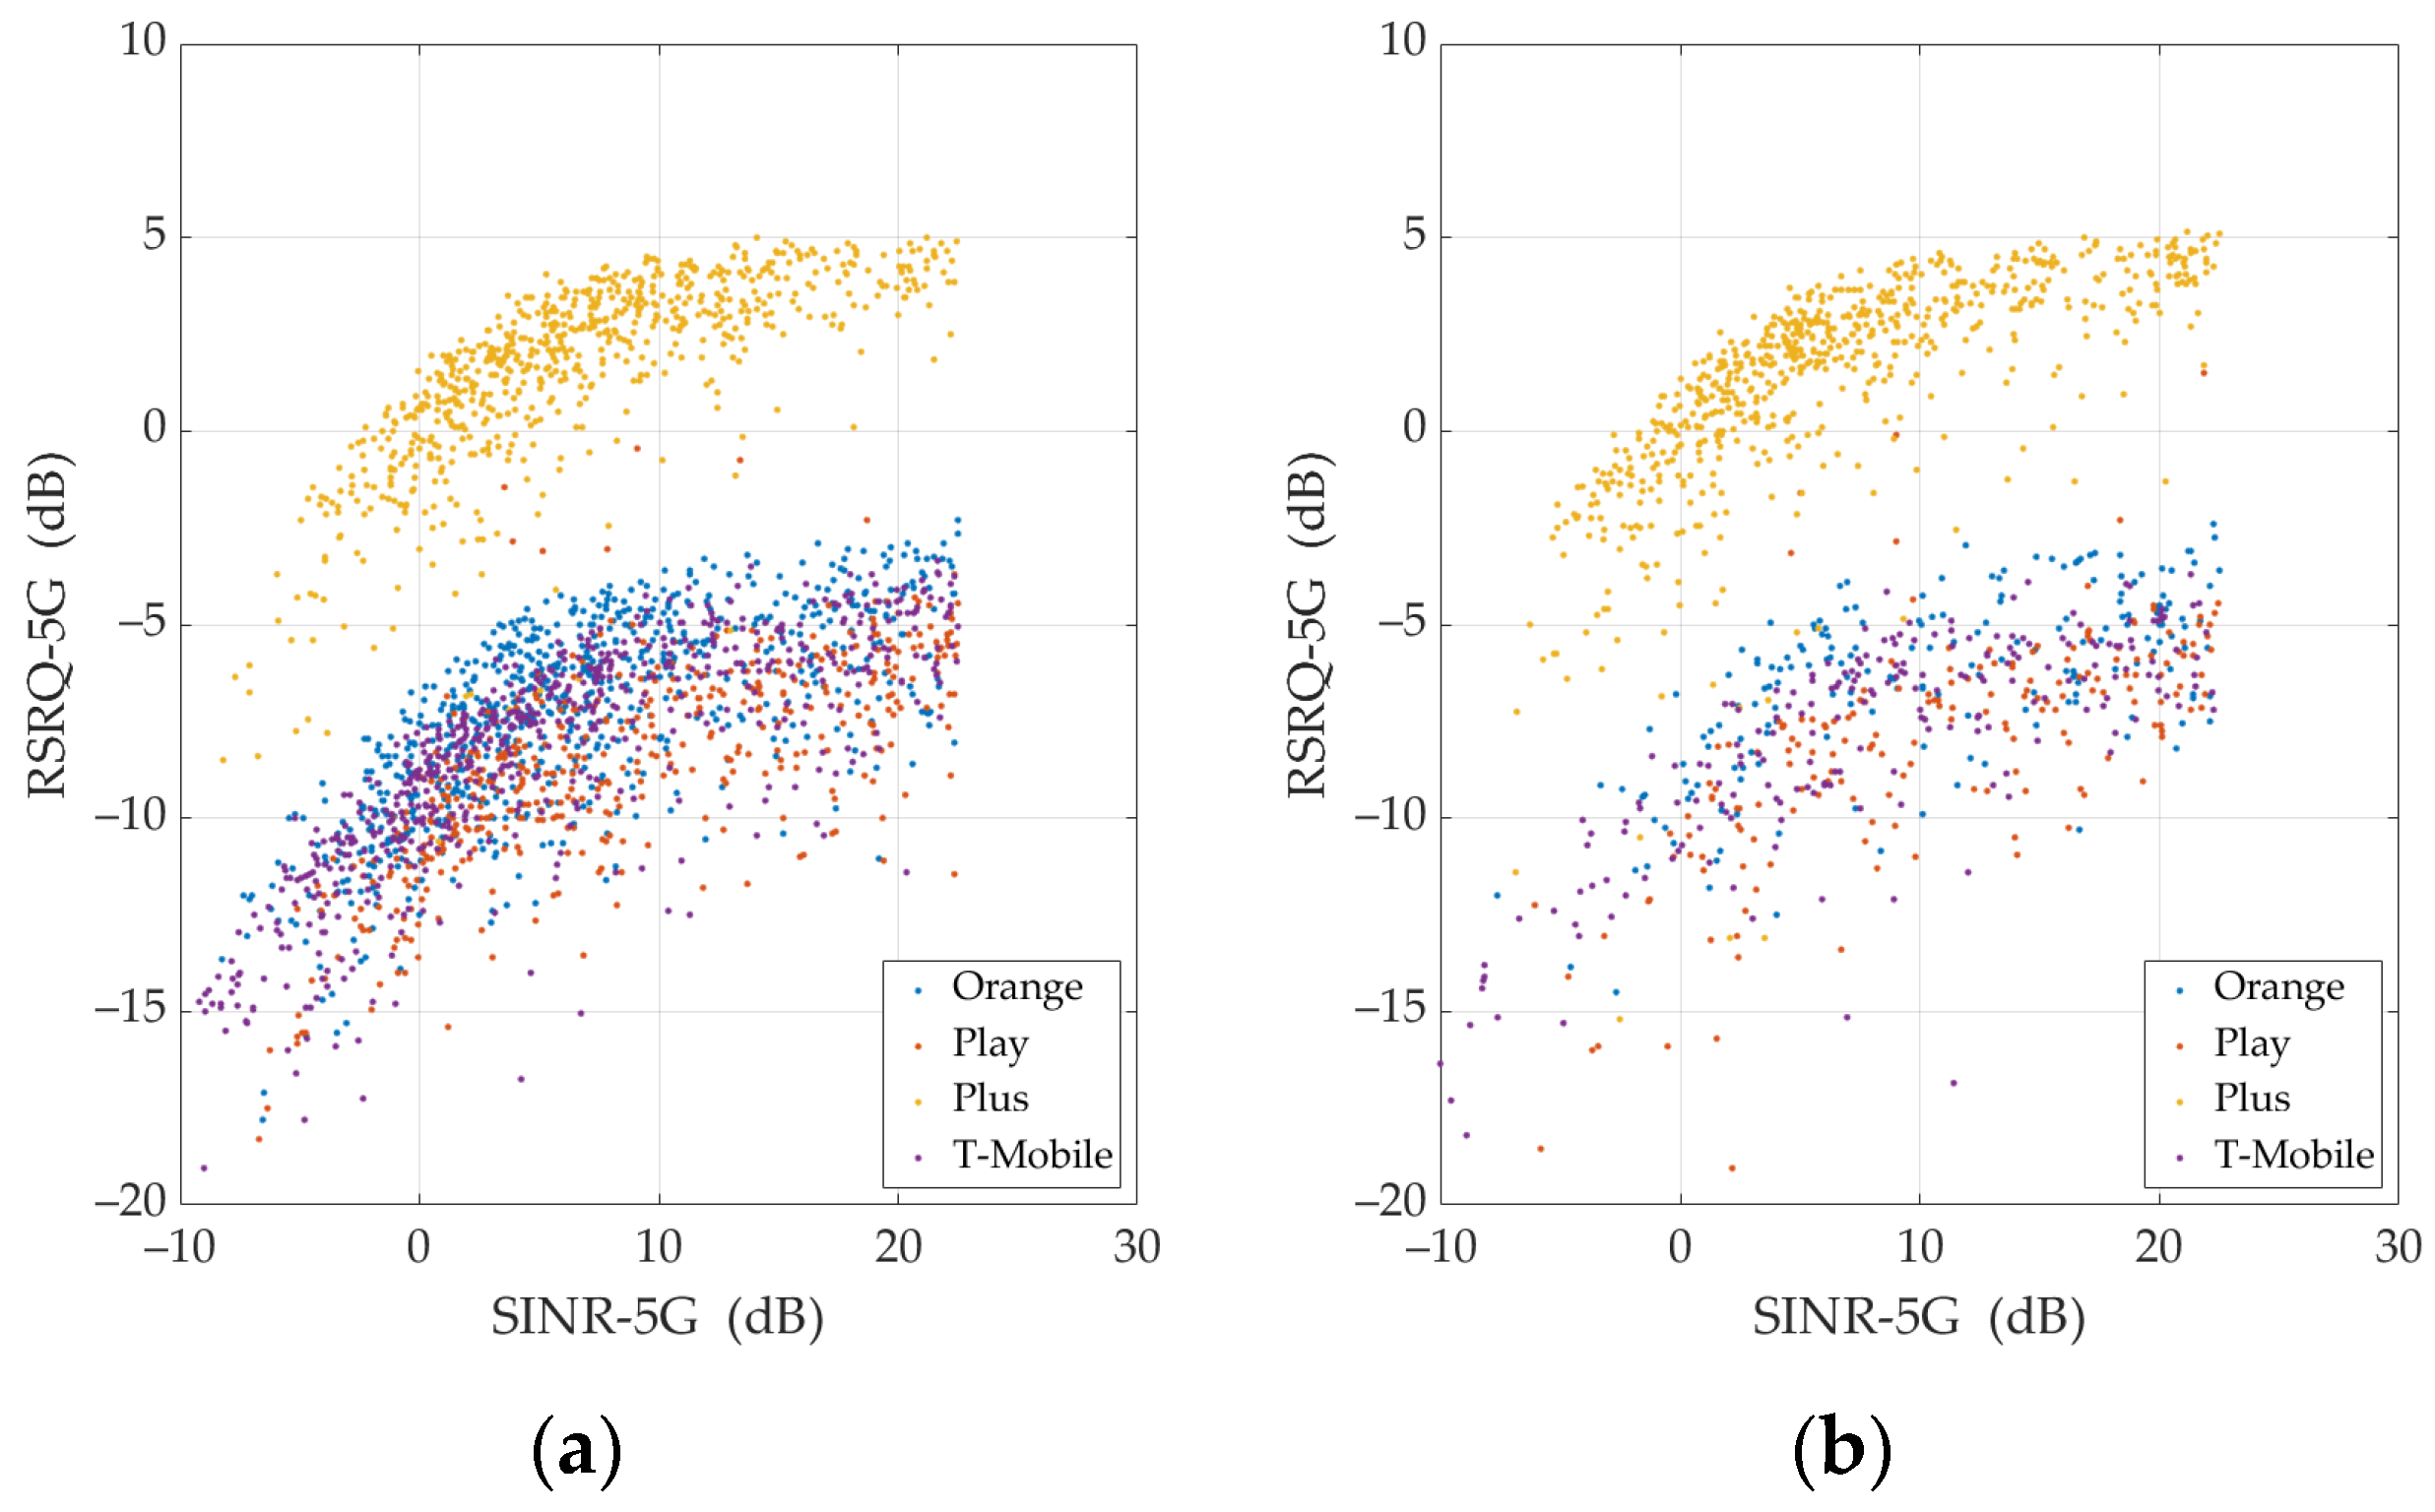
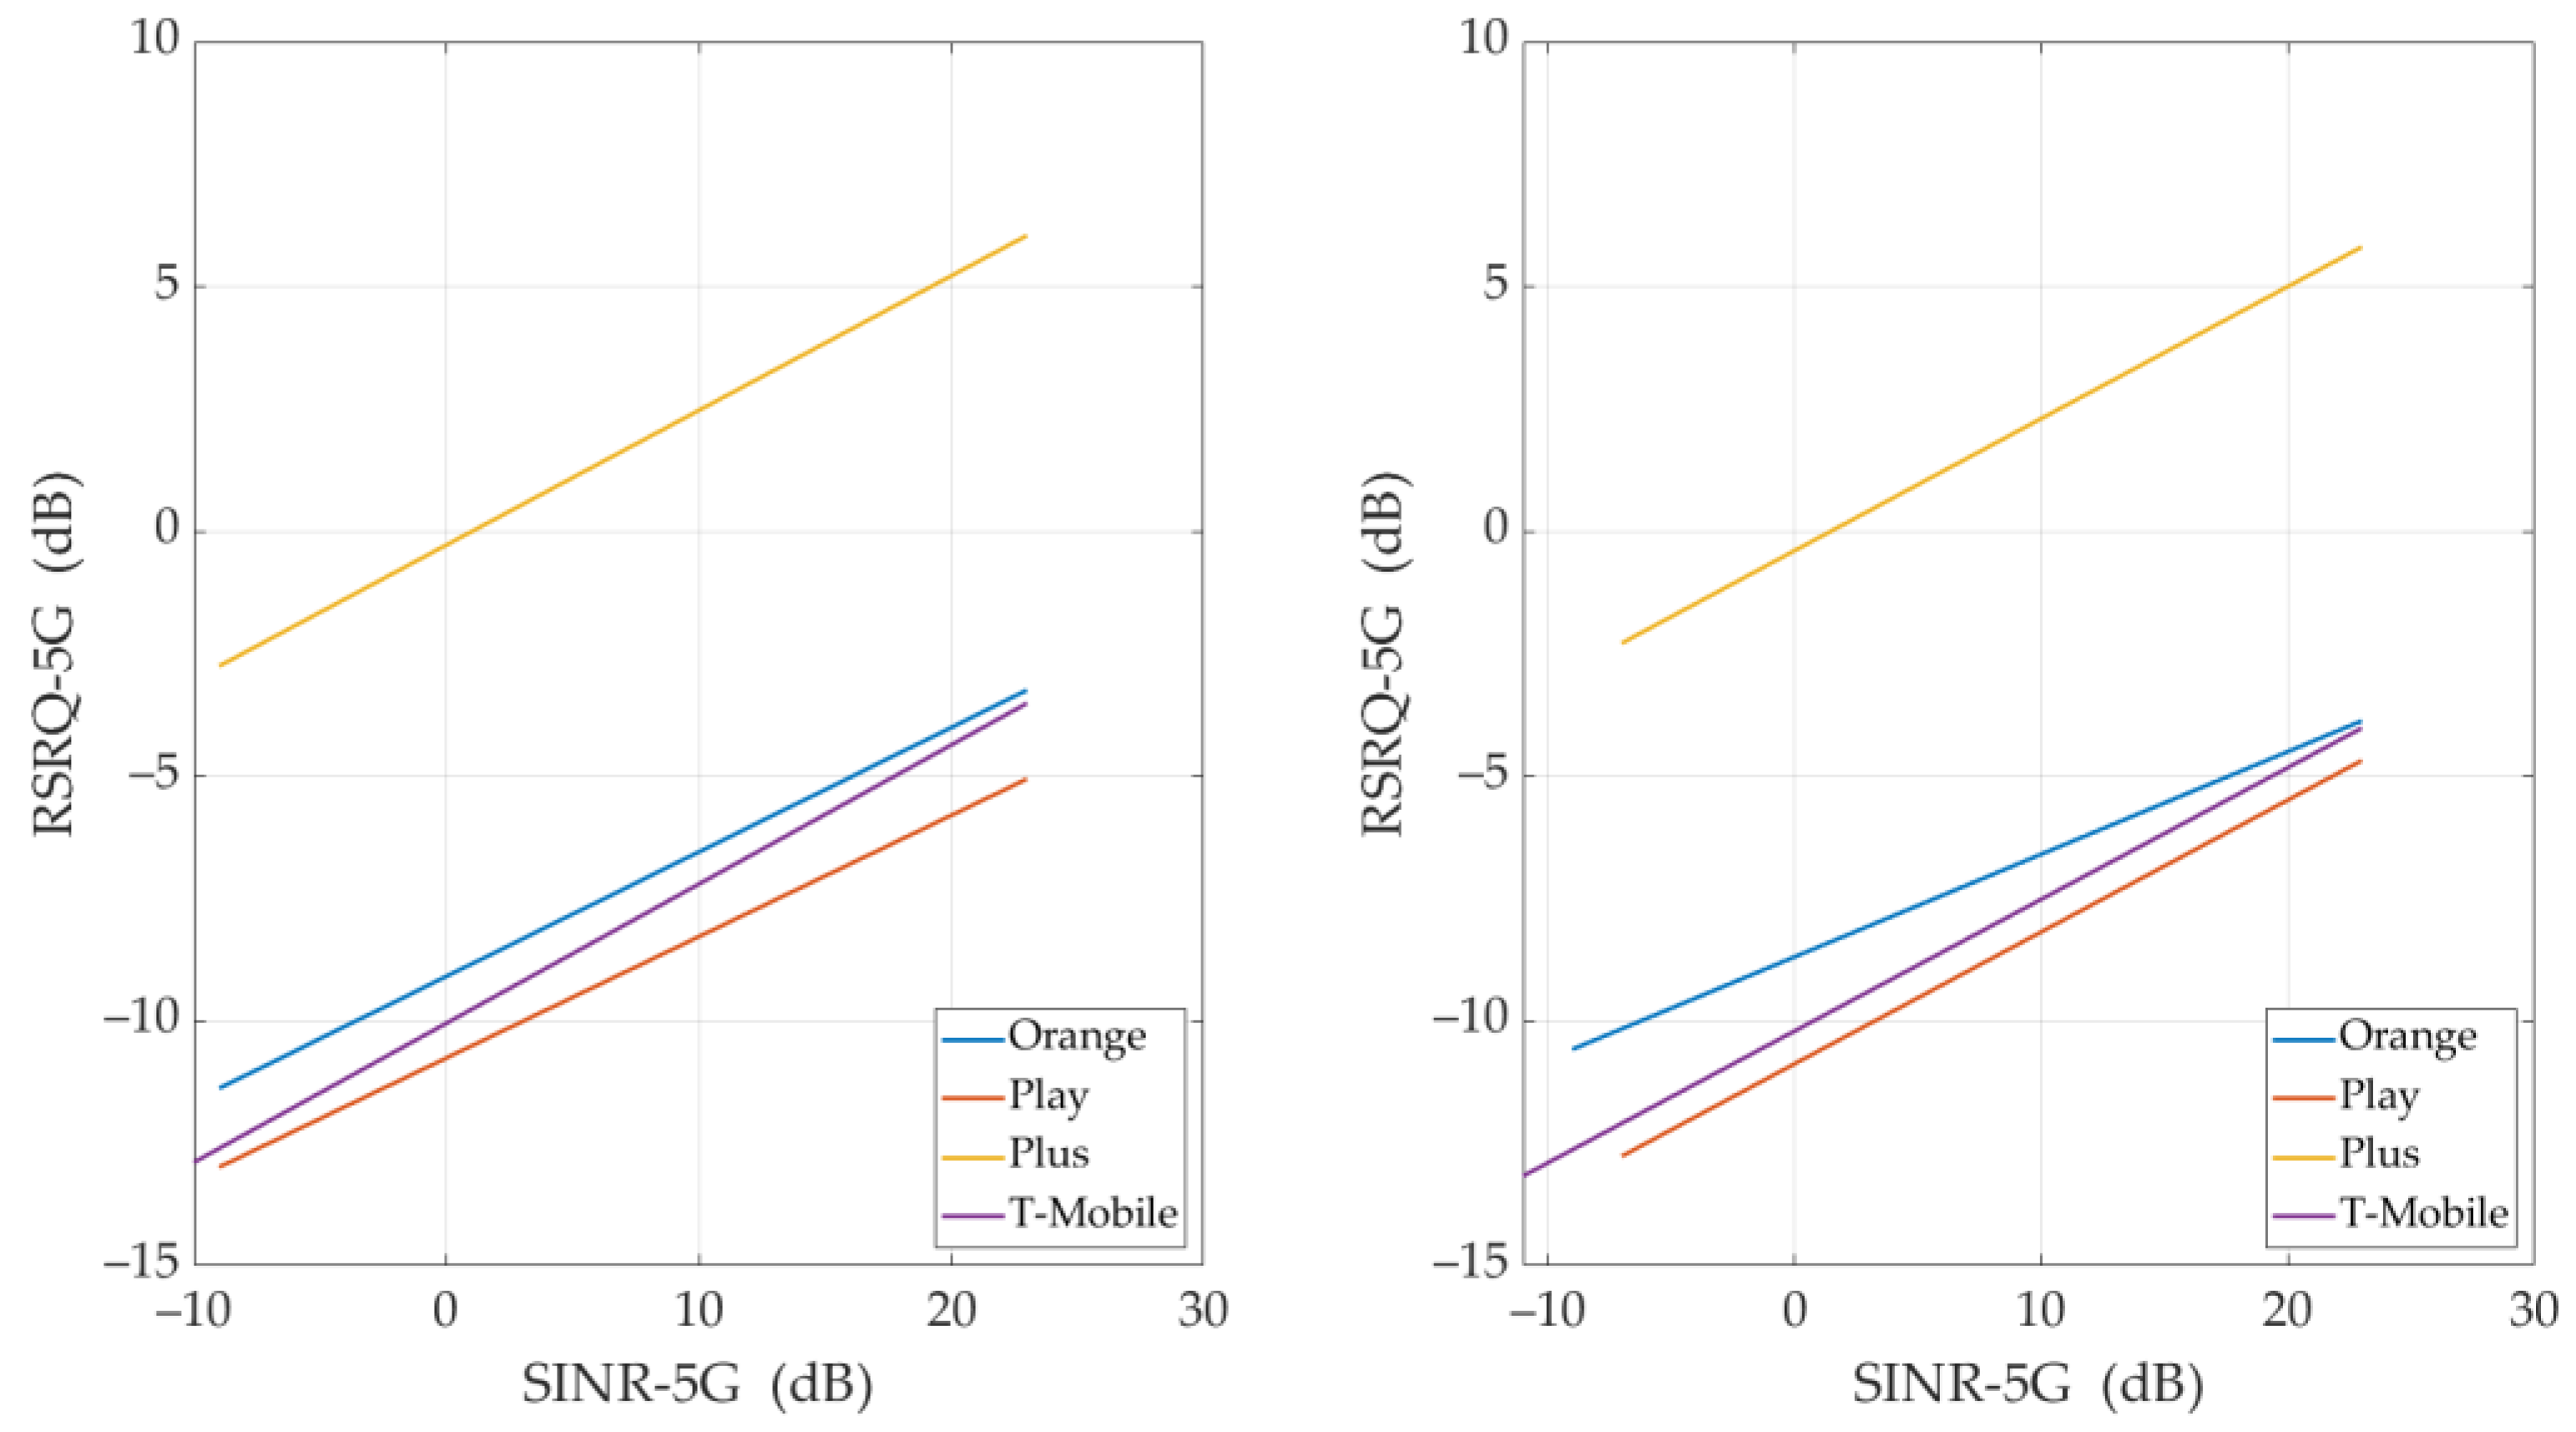
On the other hand, analyzing the relationship between RSRQ-5G and SINR-5G makes it possible to identify MNOs based on averaged measurement data and reflects their KPIs in a broader scope. The analysis of the measurement results confirmed that the use of the same RAN contributed to a very similar QoS assessment for two MNOs, i.e., Orange and T-Mobile. On the other hand, the additional use of the 40 MHz band at the 2.6 GHz band by Plus for the needs of the emerging 5G NR network allowed for higher RSRQ-5G and significantly greater throughput for DL. The remaining MNOs do not have radio resources in this frequency band. Before the auction for the C band, these MNOs (i.e., Orange, Play, and T-Mobile) could only use bands typical for LTE or older generations (i.e., 900, 1800, 1900, or 2700 MHz) for the 5G NR network. This approach is possible thanks to the principle of technological neutrality.
In the near future, the authors plan to analyze other scenarios for QoS tests in Polish mobile networks.

Author Contributions

Conceptualization, D.Z. and J.M.K.; methodology, D.Z. and J.M.K.; software, D.Z. and J.M.K.; validation, D.Z.; formal analysis, D.Z. and J.M.K.; investigation, D.Z.; resources, D.Z.; writing—original draft preparation, D.Z. and J.M.K.; writing—review and editing, D.Z. and J.M.K.; visualization, D.Z. and J.M.K.; supervision, J.M.K.; project administration, J.M.K.; funding acquisition, J.M.K. All authors have read and agreed to the published version of the manuscript.

Funding

This work was financed by the Military University of Technology (WAT) under project no. UGB/22-863/2023/WAT on “Modern technologies of wireless communication and emitter localization in various system applications”.

Institutional Review Board Statement

Not applicable.

Informed Consent Statement

Not applicable.

Data Availability Statement

The data presented in this study was provided by the Systemics-PAB company. The authors are not authorized to provide them.

Acknowledgments

The authors would like to thank the Systemics-PAB company for providing the measurement data.

Conflicts of Interest

The authors declare no conflict of interest.

Correction Statement

This article has been republished with a minor correction to the readability of Tables A3 and A4. This change does not affect the scientific content of the article.

Appendix A

Table A1 presents radio frequency resource allocation for four Polish MNOs in the 2.1 and 2.6 GHz bands [55,56].
Table A1. Radio frequency resource allocation for four Polish MNOs in the 2.1 and 2.6 GHz bands.
BandFrequency (MHz)
OrangePlayPlusT-Mobile
2.1 GHz UL FDD *1920.1–1934.91965.1–1979.92500–25201935.1–1949.9
2.1 GHz DL FDD2110.1–2124.92155.1–2169.92620–26402125.1–2139.9
2.6 GHz UL FDD2520–25352550–25702500–25202535–2550
2.6 GHz DL FDD2640–26552670–26902620–26402655–2670
2.6 GHz UL TDD *2570–2620
2.6 GHz DL TDD2570–2620
* FDD—Frequency Division Duplex; TDD—Time Division Duplex.

Appendix B

The PCC between a pair of two variables ( X , Y ) is defined as follows [7]:
P C C = ρ ( X , Y ) = E { ( X μ X ) ( Y μ Y ) } σ X σ Y ,
where X = { x i } and Y = { y i } represent sets of two analyzed parameters; E { } is the expectation operator, E { ( X μ X ) ( Y μ Y ) } is the covariance of ( X , Y ) ; and μ X , μ Y , σ X , and σ Y represent the mean values and standard deviations of X and Y , respectively, i.e.,
μ X = E { X } , σ X = E { ( X μ X ) 2 } , μ Y = E { Y } , σ Y = E { ( Y μ Y ) 2 } .
In the further analysis, we adopted the interpretation of the PCC according to Table A2 [54].
Table A2. Correlation degrees.
Absolute Value of PCC—|PCC|Correlation Degree
0.00 ÷ 0.19Very weak correlation
0.20 ÷ 0.39Weak correlation
0.40 ÷ 0.59Moderate correlation
0.60 ÷ 0.79Strong correlation
0.80 ÷ 1.00Very strong correlation

Appendix C

Section 4 shows the relationships between the QoS and radio signal metrics. The results are presented in two forms, i.e., the measured data and regression lines, which we may describe with a general formula:
Y = A X + B + ξ σ ,
where X and Y are two analyzed QoSs or signal metrics (described in Section 2.4) considered as abscissa and ordinate variables, respectively; A and B are line parameters, i.e., a slope (gradient) and ordinate axe intercept of the line, respectively; and ξ σ is a zero-mean normal random variable with a deviation equal to σ .
In Table A3 and Table A4, we show the parameter values of the regression lines presented in Section 4 and Section 5 for all MNOs, TCP and UDP, respectively.
Table A3. Parameters of regression lines for TCP.
FigureLinkMetricsOrangePlayPlusT-Mobile
XYABσABσABσABσ
7 (a)ULRSRPTh-Rx0.24142.203.8320.25041.214.2560.22135.417.3400.20839.173.783
7 (b)DLSINRTh-Rx2.61342.1124.062.70640.9326.851.68781.7428.563.00650.0426.03
9 (a)ULSINRRSRP0.752−91.628.5990.701−88.838.5630.686−89.288.1460.710−91.878.014
9 (b)DLSINRRSRP0.685−91.148.6250.716−89.288.9300.774−90.138.1430.690−91.908.225
11 (a)ULSINR-5GRSRP-5G0.706−86.688.0580.820−88.228.3650.884−95.198.6370.680−87.268.466
11 (b)DLSINR-5GRSRP-5G0.683−86.798.1350.762−87.908.3990.953−96.078.5490.652−87.958.788
22 (a)ULSINR-5GRSRQ-5G0.277−9.1801.8350.262−10.851.8540.271−0.4541.8540.264−9.8471.737
22 (b)DLSINR-5GRSRQ-5G0.271−9.2591.8490.263−10.931.9630.301−0.7151.9990.289−10.141.816
Table A4. Parameters of regression lines for UDP.
FigureLinkMetricsOrangePlayPlusT-Mobile
XYABσABσABσABσ
13 (a)ULRSRPTh-Rx1.150151.715.511.150142.220.801.020121.212.761.180154.718.49
13 (b)DLSINRTh-Rx6.197106.863.265.71857.2866.594.617195.166.705.977104.659.57
15 (a)ULRSRPJT−0.131−7.9923.338−0.174−10.133.835−0.153−7.7915.807−0.125−7.5642.873
15 (b)DLSINRJT−0.0882.4621.289−0.1975.7384.865−0.0301.9033.418−0.0712.2714.299
17 (a)ULSINRRSRP0.667−90.418.0190.630−88.878.4820.656−87.927.9020.571−90.697.988
17 (b)DLSINRRSRP0.636−90.267.6330.679−88.878.3830.630−88.158.0100.592−90.288.213
19 (a)ULSINR-5GRSRP-5G0.728−86.847.9000.694−86.937.9920.919−94.5081050.630−87.048.104
19 (b)DLSINR-5GRSRP-5G0.743−87.327.0710.732−87.108.1370.917−94.788.6640.538−86.888.534
24 (a)ULSINR-5GRSRQ-5G0.254−9.0901.8620.248−10.761.9050.275−0.2791.7470.284−10.051.808
24 (b)DLSINR-5GRSRQ-5G0.210−8.6921.9270.269−10.882.1350.270−0.3961.9610.269−10.211.857

References

  1. ITU-R. Recommendation ITU-R M.2083-0: IMT Vision—Framework and Overall Objectives of the Future Development of IMT for 2020 and Beyond; M Series Mobile, Radiodetermination, Amateur and Related Satellite Services; International Telecommunication Union (ITU): Geneva, Switzerland, 2015. [Google Scholar]
  2. European Commission. Europe’s Digital Decade|Shaping Europe’s Digital Future. Available online: https://digital-strategy.ec.europa.eu/en/policies/europes-digital-decade (accessed on 30 December 2023).
  3. Mongay Batalla, J.; Sujecki, S.; Kelner, J.M.; Śliwka, P.; Zmysłowski, D. On Studying Active Radio Measurements Estimating the Mobile Network Quality of Service for the Regulatory Authority’s Purposes. Comput. Netw. 2023, 235, 109980. [Google Scholar] [CrossRef]
  4. Li, J.; Zheng, T.; Guan, W.; Lian, X. An Optimal Resource Allocation Scheme with Carrier Aggregation in 5G Network under Unlicensed Band. Appl. Sci. 2023, 13, 10638. [Google Scholar] [CrossRef]
  5. Agarwal, B.; Togou, M.A.; Marco, M.; Muntean, G.-M. A Comprehensive Survey on Radio Resource Management in 5G HetNets: Current Solutions, Future Trends and Open Issues. IEEE Commun. Surv. Tutor. 2022, 24, 2495–2534. [Google Scholar] [CrossRef]
  6. Zmysłowski, D.; Kelner, J.M.; Falkowski-Gilski, P. Mobile Networks’ Analysis in Terms of QoS Performance Assessment. In Proceedings of the 2022 19th EAI International Conference on Mobile and Ubiquitous Systems: Computing, Networking and Services (EAI MobiQuitous), Pittsburgh, PA, USA, 14–17 November 2022; EAI: Pittsburgh, PA, USA, 2022. [Google Scholar]
  7. Zmysłowski, D.; Kelner, J.M. Drive Test-Based Correlation Assessment of QoS Parameters for Exemplary Measurements Scenario in Suburban Environment. In Proceedings of the 2022 18th International Conference on Web Information Systems and Technologies (WEBIST), Valletta, Malta, 25–27 October 2022; SciTech Publishing: Valletta, Malta, 2022; pp. 497–504. [Google Scholar]
  8. Hewage, C.; Ekmekcioglu, E. Multimedia Quality of Experience (QoE): Current Status and Future Direction. Future Internet 2020, 12, 121. [Google Scholar] [CrossRef]
  9. Dinaki, H.E.; Shirmohammadi, S.; Janulewicz, E.; Côté, D. Deep Learning-Based Fault Localization in Video Networks Using Only Client-Side QoE. IEEE Trans. Artif. Intell. 2020, 1, 130–138. [Google Scholar] [CrossRef]
  10. Barakabitze, A.A.; Walshe, R. SDN and NFV for QoE-Driven Multimedia Services Delivery: The Road towards 6G and beyond Networks. Comput. Netw. 2022, 214, 109133. [Google Scholar] [CrossRef]
  11. Zheng, G.; Yuan, L. A Review of QoE Research Progress in Metaverse. Displays 2023, 77, 102389. [Google Scholar] [CrossRef]
  12. Minovski, D.; Ögren, N.; Mitra, K.; Åhlund, C. Throughput Prediction Using Machine Learning in LTE and 5G Networks. IEEE Trans. Mob. Comput. 2023, 22, 1825–1840. [Google Scholar] [CrossRef]
  13. Al-Thaedan, A.; Shakir, Z.; Mjhool, A.Y.; Alsabah, R.; Al-Sabbagh, A.; Nembhard, F.; Salah, M. A Machine Learning Framework for Predicting Downlink Throughput in 4G-LTE/5G Cellular Networks. Int. J. Inf. Technol. 2024. [Google Scholar] [CrossRef]
  14. El-Saleh, A.A.; Alhammadi, A.; Shayea, I.; Alsharif, N.; Alzahrani, N.M.; Khalaf, O.I.; Aldhyani, T.H.H. Measuring and Assessing Performance of Mobile Broadband Networks and Future 5G Trends. Sustainability 2022, 14, 829. [Google Scholar] [CrossRef]
  15. Shayea, I.; Ergen, M.; Azmi, M.H.; Nandi, D.; El-Saleh, A.A.; Zahedi, A. Corrections to “Performance Analysis of Mobile Broadband Networks With 5G Trends and Beyond: Rural Areas Scope in Malaysia”. IEEE Access 2020, 8, 80173–80174. [Google Scholar] [CrossRef]
  16. Shayea, I.; Azmi, M.H.; Ergen, M.; El-Saleh, A.A.; Han, C.T.; Arsad, A.; Rahman, T.A.; Alhammadi, A.; Daradkeh, Y.I.; Nandi, D. Performance Analysis of Mobile Broadband Networks With 5G Trends and Beyond: Urban Areas Scope in Malaysia. IEEE Access 2021, 9, 90767–90794. [Google Scholar] [CrossRef]
  17. Shayea, I.; Ergen, M.; Azmi, M.H.; Nandi, D.; El-Salah, A.A.; Zahedi, A. Performance Analysis of Mobile Broadband Networks With 5G Trends and Beyond: Rural Areas Scope in Malaysia. IEEE Access 2020, 8, 65211–65229. [Google Scholar] [CrossRef]
  18. Fernández-Berrueta, N.; Figueroa-Lorenzo, S.; Bustamante, P.; Arrizabalaga, S.; Velez, I. 5G Performance Measurements in Mobility for the Bus Transportation System in an Urban Environment. IEEE Access 2023, 11, 127132–127144. [Google Scholar] [CrossRef]
  19. Horsmanheimo, S.; Tuomimäki, L.; Semkin, V.; Mehnert, S.; Chen, T.; Ojennus, M.; Nykänen, L. 5G Communication QoS Measurements for Smart City UAV Services. In Proceedings of the 2022 16th European Conference on Antennas and Propagation (EuCAP), Madrid, Spain, 27 March–1 April 2022; pp. 1–5. [Google Scholar]
  20. Abbas, M. Modelling WhatsApp Traffic Control Time-Based (WTCTB) for 5G Mobile Network. Int. J. Comput. Electron. Asp. Eng. 2023, 4, 110–118. [Google Scholar]
  21. Zmysłowski, D.; Kelner, J.M. Correlational Analysis in QoS Parameter Assessment for 5G Emerging Networks in Poland. In Proceedings of the 2023 Signal Processing Symposium (SPSympo), Karpacz, Poland, 26–28 September 2023; pp. 226–229. [Google Scholar]
  22. Mardian, R.D.; Suryanegara, M.; Ramli, K. Measuring Quality of Service (QoS) and Quality of Experience (QoE) on 5G Technology: A Review. In Proceedings of the 2019 IEEE International Conference on Innovative Research and Development (ICIRD), Jakarta, Indonesia, 28–30 June 2019; pp. 1–6. [Google Scholar]
  23. Banović-Ćurguz, N.; Ilišević, D. Mapping of QoS/QoE in 5G Networks. In Proceedings of the 2019 42nd International Convention on Information and Communication Technology, Electronics and Microelectronics (MIPRO), Opatija, Croatia, 20–24 May 2019; pp. 404–408. [Google Scholar]
  24. Galluccio, L.; Grasso, C.; Grasso, M.; Raftopoulos, R.; Schembra, G. Measuring QoS and QoE for a Softwarized Video Surveillance System in a 5G Network. In Proceedings of the 2019 IEEE International Symposium on Measurements & Networking (M&N), Catania, Italy, 8–10 July 2019; pp. 1–6. [Google Scholar]
  25. Soós, G.; Ficzere, D.; Varga, P.; Szalay, Z. Practical 5G KPI Measurement Results on a Non-Standalone Architecture. In Proceedings of the 2020 IEEE/IFIP Network Operations and Management Symposium (NOMS), Budapest, Hungary, 20–24 April 2020; pp. 1–5. [Google Scholar]
  26. Iperf3: A TCP, UDP, and SCTP Network Bandwidth Measurement Tool. 2023. Available online: https://iperf.fr/ (accessed on 3 January 2024).
  27. Daengsi, T.; Ungkap, P.; Pornpongtechavanich, P.; Wuttidittachotti, P. QoS Measurement: A Comparative Study of Speeds and Latency for 5G Network Using Different Speed Test Applications for Mobile Phones. In Proceedings of the 2021 IEEE 7th International Conference on Smart Instrumentation, Measurement and Applications (ICSIMA), Bandung, Indonesia, 23–25 August 2021; pp. 206–210. [Google Scholar]
  28. Ziółkowski, C.; Kelner, J.M.; Krygier, J.; Chandra, A.; Prokeš, A. Radio Channel Capacity with Directivity Control of Antenna Beams in Multipath Propagation Environment. Sensors 2021, 21, 8296. [Google Scholar] [CrossRef] [PubMed]
  29. Lorenz, M. How Fast Is My Data Highway? Cost-Effective Estimation of Achievable Data Throughput Based on Network Scanners. In Proceedings of the 2023 11th Mobile Network Testing Forum (MNT), Paris, France, 23–24 May 2023. [Google Scholar]
  30. Office of Electronic Communications. Capacity Measurements in 4G/5G Networks (In Polish: Pomiary Przepustowości w Sieciach 4G/5G); Office of Electronic Communications: Warsaw, Poland, 2023. [Google Scholar]
  31. Wachowski, M. iPerf Testing—Overview and Basic Use Case. Available online: https://codilime.com/blog/iperf-testing/ (accessed on 27 December 2023).
  32. Iperf3—Iperf3 3.15 Documentation. Available online: https://software.es.net/iperf/ (accessed on 27 December 2023).
  33. Kondej, J. Readiness of Mobile Networks to Provide 5G Services—Report on the Results of the Research in Warsaw, 23–27 August 2021|Systemics-PAB. Available online: https://www.syspab.eu/readiness-of-mobile-networks-to-provide-5g-services-report-on-the-results-of-the-research-in-warsaw/ (accessed on 2 January 2024).
  34. Ayoubi, S.E.E.; Jeux, S.; Marache, F.; Pujol, F.; Fallgren, M.; Spapis, P.; Yang, C.; Widaa, A.; Markendahl, J.; Ghanbari, A.; et al. METIS II. Deliverable D1.1. Refined Scenarios and Requirements, Consolidated Use Cases, and Qualitative Techno-Economic Feasibility Assessment. 2016. Available online: https://metis-ii.5g-ppp.eu/wp-content/uploads/deliverables/METIS-II_D1.1_v1.0.pdf (accessed on 3 January 2024).
  35. Maximize Network Quality and Performance. In Test Solution Guide for Targeted, QoE Centric Network Improvements; Rohde & Schwarz GmbH & Co. KG: Munich, Germany, 2023.
  36. ETSI TR 103 559 V1.1.1 (2019-08); Speech and Multimedia Transmission Quality (STQ)l Best Practices for Robust Network QoS Benchmark Testing and Scoring. European Telecommunications Standards Institute (ETSI): Sophia Antipolis, France, 2019.
  37. ETSI TS 102 250-6 V1.3.1 (2019-11); Speech and Multimedia Transmission Quality (STQ); QoS Aspects for Popular Services in Mobile Networks; Part 6: Post Processing and Statistical Methods. European Telecommunications Standards Institute (ETSI): Sophia Antipolis, France, 2019.
  38. ETSI TS 102 250-1 V2.3.1 (2019-11); Speech and Multimedia Transmission Quality (STQ); QoS Aspects for Popular Services in Mobile Networks; Part 1: Assessment of Quality of Service. European Telecommunications Standards Institute (ETSI): Sophia Antipolis, France, 2019.
  39. ETSI TS 102 250-2 V2.7.1 (2019-11); Speech and Multimedia Transmission Quality (STQ); QoS Aspects for Popular Services in Mobile Networks; Part 2: Definition of Quality of Service Parameters and Their Computation. European Telecommunications Standards Institute (ETSI): Sophia Antipolis, France, 2019.
  40. ETSI TS 102 250-3 V2.4.1 (2019-11); Speech and Multimedia Transmission Quality (STQ); QoS Aspects for Popular Services in Mobile Networks; Part 3: Typical Procedures for Quality of Service Measurement Equipment. European Telecommunications Standards Institute (ETSI): Sophia Antipolis, France, 2019.
  41. ETSI TS 102 250-4 V2.3.1 (2019-11); Speech and Multimedia Transmission Quality (STQ); QoS Aspects for Popular Services in Mobile Networks; Part 4: Requirements for Quality of Service Measurement Equipment. European Telecommunications Standards Institute (ETSI): Sophia Antipolis, France, 2019.
  42. ETSI TS 102 250-5 V2.5.1 (2019-11); Speech and Multimedia Transmission Quality (STQ); QoS Aspects for Popular Services in Mobile Networks; Part 5: Definition of Typical Measurement Profiles. European Telecommunications Standards Institute (ETSI): Sophia Antipolis, France, 2019.
  43. Data Performance—Capacity and iPerf. In Test Description. Release 22.2; Rohde & Schwarz SwissQual AG: Zuchwil, Switzerland, 2022.
  44. Data Performance—Interactivity and Latency. In Test Description Release 22.2; Rohde & Schwarz SwissQual AG: Zuchwil, Switzerland, 2022.
  45. Wesley, E. Transmission Control Protocol (TCP); Internet Engineering Task Force: Fremont, CA, USA, 2022. [Google Scholar]
  46. User Datagram Protocol (UDP); Internet Engineering Task Force: Fremont, CA, USA, 1980.
  47. Afroz, F.; Subramanian, R.; Heidary, R.; Sandrasegaran, K.; Ahmed, S. SINR, RSRP, RSSI and RSRQ Measurements in Long Term Evolution Networks. Int. J. Wirel. Mob. Netw. 2015, 7, 113–123. [Google Scholar] [CrossRef]
  48. ETSI TS 136 214 V16.1.0 (2020-07); LTE; Evolved Universal Terrestrial Radio Access (E-UTRA); Physical Layer; Measurements (3GPP TS 36.214 Version 16.1.0 Release 16). European Telecommunications Standards Institute (ETSI): Sophia Antipolis, France, 2020.
  49. ETSI TS 136 133 V17.9.0 (2023-05); LTE; Evolved Universal Terrestrial Radio Access (E-UTRA); Requirements for Support of Radio Resource Management (3GPP TS 36.133 Version 17.9.0 Release 17). European Telecommunications Standards Institute (ETSI): Sophia Antipolis, France, 2023.
  50. ETSI TS 138 215 V16.2.0 (2020-07); 5G; NR; Physical Layer Measurements (3GPP TS 38.215 Version 16.2.0 Release 16). European Telecommunications Standards Institute (ETSI): Sophia Antipolis, France, 2020.
  51. ETSI TS 138 214 V16.5.0 (2021-04); 5G; NR; Physical Layer Procedures for Data (3GPP TS 38.214 Version 16.5.0 Release 16). European Telecommunications Standards Institute (ETSI): Sophia Antipolis, France, 2021.
  52. 5G NR RSRQ Measurements and Its Mapping. Techplayon. 2021. Available online: https://www.techplayon.com/5g-nr-rsrq-measurements-and-its-mapping/ (accessed on 3 January 2024).
  53. Synchronization Signal Reference Signal Received Power. Available online: http://comtech.vsb.cz/qualmob/rsrp_5g.html (accessed on 2 December 2023).
  54. Campbell, M.J. Statistics at Square One, 12th ed.; Wiley-Blackwell: Hoboken, NJ, USA, 2021; ISBN 978-1-119-40130-8. [Google Scholar]
  55. Information about Spectrum Occupancy in Bands 420 MHz, 450 MHz, 800 MHz, 900 MHz, 1800 MHz, 2100 MHz, 2600 MHz, 3600 MHz (In Polish). Available online: https://bip.uke.gov.pl/dostepnosc-czestotliwosci/informacja-o-zajetosci-widma-tresci/informacja-o-zajetosci-widma-w-pasmach-420-mhz-450-mhz-800-mhz-900-mhz-1800-mhz-2100-mhz-2600-mhz-3600-mhz,13,0.html (accessed on 23 January 2024).
  56. Poland 5G—NR, 4G—LTE Frequency Spectrum Bands, 3G—WCDMA, 2G—GSM, FDD, TDD, FR1, FR2 mmWave Mobile Networks. Available online: https://www.spectrum-tracker.com/Poland (accessed on 23 January 2024).
Figure 1. (a) Percentage of analyzed service bins for each MNO and (b) percentage of MNO bins in iPerf test.
Applsci 14 01268 g001
Figure 2. Measurement route during drive test campaign in Warsaw [33].
Applsci 14 01268 g002
Figure 3. Drive-test cars with R&S Smart Bechmarker [35].
Applsci 14 01268 g003
Figure 4. PCCs for TCP, UL/DL: (a) averaged all MNOs, (b) Orange, (c) Play, (d) Plus, and (e) T-Mobile.
Applsci 14 01268 g004
Figure 5. PCCs for UDP, UL/DL: (a) average of all MNOs, (b) Orange, (c) Play, (d) Plus, and (e) T-Mobile.
Applsci 14 01268 g005
Figure 6. Measured Th-Rx versus (a) RSRP for four MNOs, TCP, and UL; or (b) SINR for four MNOs, TCP, and DL.
Applsci 14 01268 g006
Figure 7. Regression lines of Th-Rx versus (a) RSRP for four MNOs, TCP, and UL; or (b) SINR for four MNOs, TCP, and DL.
Applsci 14 01268 g007
Figure 8. Measured RSRP versus SINR for four MNOs, TCP: (a) UL or (b) DL.
Applsci 14 01268 g008
Figure 9. Regression lines of RSRP versus SINR for four MNOs, TCP: (a) UL or (b) DL.
Applsci 14 01268 g009
Figure 10. Measured RSRP-5G versus SINR-5G for four MNOs, TCP: (a) UL or (b) DL.
Applsci 14 01268 g010
Figure 11. Regression lines of RSRP-5G versus SINR-5G for four MNOs, TCP: (a) UL or (b) DL.
Applsci 14 01268 g011
Figure 12. Measured Th-Rx versus (a) RSRP for four MNOs, UDP, and UL; or (b) SINR for four MNOs, UDP, and DL.
Applsci 14 01268 g012
Figure 13. Regression lines of Th-Rx versus (a) RSRP for four MNOs, UDP, and UL; or (b) SINR for four MNOs, UDP, and DL.
Applsci 14 01268 g013
Figure 14. Measured JT versus (a) RSRP for four MNOs, UDP, and UL; or (b) SINR for four MNOs, UDP, and DL.
Applsci 14 01268 g014
Figure 15. Regression lines of JT versus (a) RSRP for four MNOs, UDP, and UL; or (b) SINR for four MNOs, UDP, and DL.
Applsci 14 01268 g015
Figure 16. Measured RSRP versus SINR for four MNOs, UDP: (a) UL or (b) DL.
Applsci 14 01268 g016
Figure 17. Regression lines of RSRP versus SINR for four MNOs, UDP: (a) UL or (b) DL.
Applsci 14 01268 g017
Figure 18. Measured RSRP-5G versus SINR-5G for four MNOs, UDP: (a) UL or (b) DL.
Applsci 14 01268 g018
Figure 19. Regression lines of RSRP-5G versus SINR-5G for four MNOs, UDP: (a) UL or (b) DL.
Applsci 14 01268 g019
Figure 20. Main KPIs for Internet access for four Polish MNOs based on drive test campaign (based on [33]).
Applsci 14 01268 g020
Figure 21. Measured RSRQ-5G versus SINR-5G for four MNOs, TCP: (a) UL or (b) DL.
Applsci 14 01268 g021
Figure 22. Regression lines of RSRQ-5G versus SINR-5G for four MNOs, TCP: (a) UL or (b) DL.
Applsci 14 01268 g022
Figure 23. Measured RSRQ-5G versus SINR-5G for four MNOs, UDP: (a) UL or (b) DL.
Applsci 14 01268 g023
Figure 24. Regression lines of RSRQ-5G versus SINR-5G for four MNOs, UDP: (a) UL or (b) DL.
Applsci 14 01268 g024
Figure 25. Similarity assessment of PCC heatmaps for the MNOs, TCP and UDP.
Applsci 14 01268 g025
Table 1. Time schedule of measurement campaign.
DataTime
23 September 202114:42–18:18
24 September 202108:34–17:39
25 September 202108:11–16:41
26 September 202108:41–18:19
27 September 202107:59–09:19
Table 2. Number of performed bins for tested services per each MNO.
MNOiPerfHTTP BrowsingInteractiveYouTubeAll Services
Orange285948461027190010,632
Play287963821071610516,437
Plus300537627167958278
T-Mobile30604293903266510,921
All MNOs11,80319,283371711,46546,268
Table 3. Parameters of iPerf tests for TCP and UDP.
ParameterTCPUDP
Target throughput (Mbps)8 for UL/40 for DL100
Total target throughput (Mbps)24 for UL/120 for DL100
Parallel streams310
Buffer size81921200
Transfer duration (s)5 for UL/7 for DL3
Table 4. Main considerations and advantages of UDP and TCP [43].
PropertyUDPHTTP/TCPFTP/TCP
Focus on unidirectional traffic without dependencies on return channelYesNoNo
Uplink throughput is measured on receiving side, i.e., as the true network throughputYesNoNo
Sustainable capacity required as resultYesYesNo
Intermediate throughput is measured on IP-levelYesYesNo
Applicable for the Network Performance ScoreNoYesNo
Disclaimer/Publisher’s Note: The statements, opinions and data contained in all publications are solely those of the individual author(s) and contributor(s) and not of MDPI and/or the editor(s). MDPI and/or the editor(s) disclaim responsibility for any injury to people or property resulting from any ideas, methods, instructions or products referred to in the content.

