Article

A Study on the Softening Shear Model of the Energy Pile–Soil Contact Surface

1
School of Mechanics and Civil Engineering, China University of Mining and Technology, Xuzhou 221116, China
2
State Key Laboratory of Intelligent Construction and Healthy Operation and Maintenance of Deep Underground Engineering, China University of Mining and Technology, Xuzhou 221116, China
3
Yunlong Lake Laboratory of Deep Underground Science and Engineering, Xuzhou 221006, China
*
Authors to whom correspondence should be addressed.
Appl. Sci. 2024, 14(3), 1072; https://doi.org/10.3390/app14031072
Submission received: 6 December 2023 / Revised: 13 January 2024 / Accepted: 25 January 2024 / Published: 26 January 2024
(This article belongs to the Special Issue Latest Research on Geotechnical Engineering)

Abstract

:
In this paper, a finite element numerical model of thermal-hydro-mechanical of energy piles under multi-layer geological conditions was established, and field tests of ultra-long energy pile (1000-mm-diameter, 44-m-long) were carried out to reveal the temperature distribution and mechanical properties of energy pile under typical working conditions. Based on the analytical results, a softening shear model of the energy–soil interface under the condition of large shear displacement was proposed with the load transfer method, and the reliability of the model was verified. The model can simulate the shear–displacement relationship of the pile–soil interface under different geological conditions.

1. Introduction

Energy piles, incorporating foundation piles and closed-loop heat exchangers, are a novel technology for heating and cooling buildings [1]. Compared to ground source heat pumps GHSP, energy piles not only can reduce considerably installation costs by avoiding drilling boreholes, but also do not require additional underground space for installation. Moreover, because concrete or steel has a higher thermal conductivity than soil, energy piles can provide a more efficient heat exchange. The composition of the energy pile system is shown in Figure 1.
The heat exchanger tubes installed in energy piles are generally arranged in single U, double U in series, double U in parallel, triple U in parallel, quadruple U in series, and spiral [2], as shown in Figure 2. Different arrange forms have their own characteristics, for example, the single U-shape layout is simple but provides less heat exchange than the complex spiral layout, and different arrange forms are selected according to different use scenarios.
In the actual engineering application, energy piles will continue to exchange heat with the surrounding soil relative to conventional bored piles, and additional temperature stresses and deformations will be generated within the piles due to the constraints of the surrounding soil that the energy piles are not able to deform freely [3]. At the same time, the propagation of heat between the piles and the soil will affect the mechanical properties of the pile–soil contact surfaces, and the soil around the piles will change its properties due to the action of the temperature, which will change the pile–soil interface load transfer law in the presence of upper loads in energy piles being changed [4].
Feligha et al. [5] found that the behavior at the pile–soil interface was found to vary according to surface roughness. Friction behavior is likely to be generally classified into three failure modes, namely full sliding at the interface, shear failure within the soil, and a mixed behavior, where interface sliding and shear deformation of the soil specimen proceed simultaneously. Pincus et al. [6] found that the direct shear test was able to consider the effect of volume deformation of the soil around the pile on the shear characteristics, which is consistent with the volume deformation during the shear process of the pile–soil contact surface in reality. Since energy piles have both bearing and heat transfer functions, the shear characteristics of the pile–soil contact surface under temperature action need to be investigated [7]. There are many research results of pile–soil contact surface shear tests under varying temperatures that mainly focus on the relationship between the shear stress and shear displacement of the pile–soil contact surface. In addition, we evaluated the nonlinear response and assessed the bearing capacity of the piles and obtained a very valuable reference [8,9].
Laloui et al. [10] conducted in situ tests on a four-story building at the Swiss Federal Institute of Technology (ETH) in Lausanne, Switzerland, and found that temperature variations caused a significant change in the pile lateral frictional resistance. Yazdani et al. [11] found that the shear characteristics of the pile–soil contact surface under thermal loading are mainly affected by the applied normal stress and that the shear deformation occurs at the contact surface between the energy pile and the soil rather than the entire soil. Xiao et al. [12] found that when the roughness of the pile–soil contact surface was low and that the effect of cyclic thermal loading on the shear strength of the contact surface was negligible at lower normal stresses. However, when the normal stress was greater than 100 kPa, the shear strength of the contact surface increased by 20% after 10.5 thermal cycles. Yin et al. [13] found that cyclic thermal loading increased the peak shear strength of the pile–soil contact surface but had no significant effect on the residual shear strength.
By studying the load transfer characteristics of the pile–soil contact surface under the effect of temperature, it is found that the calculation idea of the load transfer method can also be applied to the settlement and axial force calculation of energy piles [14]. The load transfer method is widely used in traditional pile settlement and axial force calculations, and its basic idea is to divide the pile into several elastic units, each of which is connected to the soil body by a nonlinear spring, which is used to simulate the load transfer relationship between the pile and the soil [15]. In addition, some scholars have analyzed the influence of the discretization used on the results obtained, and found that the way in which discretization is performed can affect results [16,17].
Rotta Loria et al. [18] found that the interaction of shear displacements between groups of piles decreases under conditions of nonlinear deformation of the soil body. Laloui et al. [19] found that the effect of thermal loading on the displacement of end-bearing energy piles is greater than that on friction energy piles. Nghiem et al. [20] proposed a finite element model that can represent the mechanical properties of the pile–soil interface. Knellwolf et al. [21] were the first that used the load transfer method for the calculation of internal forces and displacements of energy piles by utilizing the condition of temperature-induced conservation of external forces at the neutral point to compute internal forces and displacements induced with temperature loading. In the above research studies, the pile–soil contact surface is equivalent to a spring model to study the shear characteristics of the pile–soil contact surface.
The existing studies have not considered the effect of softening on the shear characteristics, but the softening phenomenon has an important effect on the bearing performance of energy piles. The softening phenomenon during the shear process of pile–soil contact surface was observed [22], and the softening phenomenon of the soil on the pile side leads to a decrease in the rate of change of the pile axial force along the depth [23]. Therefore, Zhao et al. [24] proposed a load transfer model under softening and, based on this model, derived the equation for the relationship between pile top load and settlement; Xia et al. [25] proposed a nonlinear method to represent the relationship between pile lateral friction resistance and displacement by means of a nonlinear model in the form of a segmented function; Ni et al. [26] derived a load transfer model considering both hardening and softening effects; Suryatriyastui et al. [12] proposed a load transfer model considering cyclic hardening and softening. Further research found that the shear properties of pile–sand contact surface were affected by cyclic temperature loading but not by constant temperature loading and that the shear strength increased with increasing temperature [27,28].
In this paper, a finite element numerical model of thermal-hydro-mechanical of energy piles under multi-layer geological conditions was established, and field tests of ultra-long energy pile (1000-mm-diameter, 44-m-long) were carried out to reveal the temperature distribution and mechanical properties of the energy pile under typical working conditions. On this basis, the axial deformation mechanism of energy pile was proved. Furthermore, based on load transfer method, a softening shear model of the energy–soil interface under large shear displacement was proposed. The model was used to identify the relationship between shear stress and shear displacement on the pile–soil contact surface and to verify the reliability of the model, which can simulate the shear–displacement relationship of the pile–soil interface under different geological conditions.

2. Materials and Methods

2.1. Governing Equation

The governing equations for the heat exchange between the fluid in the tube and the tube wall are as follows:
ρ A C p T t + ρ A C p u e t t T = t ( A k t T ) + 1 2 f D ρ A d h u u 2 + Q + Q w a l l
In the equation, ρ is the density of water in the heat exchanger tube, kg/m3. A is the over-water area of the heat exchanger tube, m2. t is the time, s. Cp is the constant pressure heat capacity of water, J·(kg·K)−1. et is the unit tangential vector of the pipe axis. ∇t is the time gradient. k indicates thermal conductivity of water, W·(m·K)−1. fD is the darcy friction factor. dh is the hydraulic diameter, m. Q is the general heat source per unit of pipe length, W/m. Qwall is the amount of heat transfer of fluid through the pipe wall per unit of pipe length, W/m.
The governing equations for the fluid in the heat exchanger tube are as follows:
ρ u t = t p e t 1 2 f D ρ d h u u + F e t
A ρ t + t ( A ρ u e t ) = 0
In the equation, ( 1 / 2 ) f D ( ρ / d h ) u u is the pressure drop of a fluid in a pipe due to viscous shear, and u indicates average velocity of the fluid in the cross-section of the pipe, m/s. ρ indicates fluid density, kg/m3. P indicates pressure, Pa. fD is the darcy friction factor. F indicates volumetric force term, N/m3.
The governing equations for the heat exchange between the pipe wall and the pile and the soil around the pile are as follows:
( ρ C p ) e f f T t + ρ f C p , f u T + q = Q + Q p + Q v d + Q g e o
q = k e f f T
The controlling equations for subsurface seepage water are as follows:
t ( ε p ρ ) + ( ρ u ) = Q m
u = κ μ ( p ρ g )
In the equation, ρ indicates fluid density, kg/m3. εp is the porosity. Qm is a quality source term, kg/(m3·s). u is the darcy speed, m/s. κ is the permeability of the porous medium, m2. μ is the dynamic viscosity of the fluid, Pa·s. P is pore pressure, Pa. ρg is the gravity term.
The controlling equations for strain in the pile body εT-rstr is as follows:
ε T r s t r = ε T f r e e ε T o b s
In the equation, εT-free is the free thermal strain when the pile is not restrained, and εT-obs is the strain in the pile body that is suppressed due to the constraints.
According to the Hooke–Duhamel thermoelectricity criterion, the stresses in isotropic materials are calculated as follows:
σ = σ 0 + C : ( ε ε 0 α Δ T )
In the equation, σ0 indicates initial stress, and ε0 indicates initial strain. C is the fourth-order elasticity tensor. α is the coefficient of thermal expansion. ΔT is the temperature change.

2.2. Model Assumptions

The operation process of the energy pile in the soil body is a complex unsteady state heat transfer, seepage, and mechanical transfer process that includes convective heat transfer in the embedded pipe inside the pile, heat conduction between the wall of the embedded pipe and the concrete of the pile body, heat conduction between the concrete of the pile body and the soil around the pile body, and heat transfer by seepage of groundwater and thermal deformation caused by the change of the temperature of the pile and soil, etc. The numerical simulation situation is somewhat different from the field in situ test, and certain assumptions need to be made before establishing the numerical model to facilitate the calculation and analysis.
(1)
The physical properties of soil in heat transfer engineering are constant, and the substances within the soil do not undergo phase changes.
(2)
The thermal-physical parameters of the pile concrete remain unchanged during the heat transfer process, and the concrete pile transfers heat in a thermally conductive manner.
(3)
The effects of temperature changes in the soil along the depth direction and of air heat transfer at the surface are not considered.
(4)
The contact thermal resistance between the wall of the embedded pipe in the pile and the pile body, and between the pile body and the soil around the pile is not considered.
(5)
Seepage velocity and direction remain constant.
(6)
The formation in the seepage area is an isotropic saturated porous medium.
(7)
The deformation of the pile body is elastic and the deformation of the soil around the pile is elastic-plastic.
Based on the actual installation setting of energy piles during on-site testing, a coupled heat–flow–force numerical model of parallel 3U-type buried energy piles was established, defining the x-direction of the coordinate axis of the numerical model to be the seepage direction, where the positive direction of the x-direction is the downstream of the seepage flow, the y-direction is perpendicular to the seepage flow direction, and the z-direction is the depth direction of the energy piles.

2.3. Modeling Process

The geometric model of the coupled thermal-hydro-mechanical numerical model of energy piles under multilayered geological conditions arranges a cylinder containing curves inside in a multilayered rectangular body. As shown in Figure 3, the curve represents the heat exchanger pipe, the cylinder represents the concrete pile, and the multilayer rectangular body represents the multilayer soil body, which is as follows: heterogeneous fill, silty powdery clay, powdery clay, powdery fine sand, strongly weathered mudstone, and moderately weathered mudstone from shallow to deep in order. To avoid the influence of soil body dimensions on the heat exchange of the energy pile, the length and width of the soil body are not less than 20 times the diameter of the energy pile, and the height of the soil body is not less than 2 times the length of the energy pile.
The grid dissection of the model adopts a user-controlled grid, the maximum and minimum cell sizes of the soil region around the pile are 7760 and 564, the maximum and minimum cell sizes of the energy pile region are 4940 and 212, the maximum and minimum cell sizes of the heat exchanger pipe edge are 2820 and 28.2, respectively, the final number of grids in the model area is 207,407, the minimum cell quality is 0.1271, and the model grid dissection results are shown in Figure 3.
When the seepage rate of groundwater in the soil body is less than 0.5 m/a, the effect of seepage on heat exchange can be ignored, so the two layers of fine powdered sand are regarded as a seepage layer, and the other strata are regarded as a water barrier without groundwater seepage.
This numerical model considers the pile concrete and the surrounding soil as linear elastic materials. The material model of pile concrete is set as the Bresler–Pister criterion and the material model of surrounding soil is set as the Mohr–Coulomb criterion. Since both the pile deformation due to the heat transfer temperature difference and the structural load of the energy pile do not reach the yield strength of the material, the yield damage of the material is not considered.

2.4. Model Verification

Hua Xincheng AB Lot Project, located at the intersection of Jiangdong Middle Road and Hexi Street in Hexi New Town, Nanjing, covers an area of about 163,000 m2, with a total construction area of about 1,000,000 m2, foundation pit excavation area of 98,000 m2, with a perimeter of about 1271.3 m and an excavation depth of about 16.5 m, and with a total of 4378 drilled piles. The energy pile is 44 m long and 1000 mm in diameter with a full-depth reinforcement cage. Three U-shaped high-density polythene pipes with a diameter of 25 mm and a thickness of 2.3 mm were embedded in the energy pile as the ground heat exchanger. Due to the reinforcement cage being installed in sections, the heat exchanger was not attached to the reinforcement cage. The procedure of heat exchanger installment is as follows. First, install the reinforcement cage. Second, push 3 U-shaped pipes to design depth by the modified tremie. Third, pour the concrete. The geological substrate of the project is typical of the Yangtze River floodplain; the geological condition and the groundwater level was close to the ground surface during testing. The physical parameters in the test are shown in Table 1. As shown in Table 2, the material of energy pile is concrete; the actual test results show that the elastic modulus is 32,800 MPa; Poisson’s ratio is 0.2; the coefficient of expansion is 1.0 × 10⁻⁵; tensile strength is 2.39 MPa; compressive strength is 26.80 MPa; and biaxial compressive strength is 29.48 MPa.
Due to the limitation of monitoring conditions, this in situ test selects 2630# energy pile as the monitoring pile. The pile diameter is Φ1000 mm, the length of the pile is 58 m, and the concrete strength is C40. The heat exchanger pipe of the 2630# energy pile is laid in the form of 3U parallel connection, the heat exchanger pipe adopts the HDPE (high-density polyethylene) pipe with the size of dn25 mm × en2.3 mm, the depth of the heat exchanger pipe is 32 m under the top of the pile, the thermal response test is carried out by using the thermostatic method for the heat exchanger pipe in the pile, and the initial temperature of soil at the test site is about 20 °C. Thermal response testing of the heat exchanger pipe in the energy pile was carried out using the thermostatic method, and the initial temperature of the soil at the test site was measured to be about 20 °C.
PT100 platinum resistance thermometers, vibrating wire steel stress gauges, vibrating wire concrete strain gauges, and vibrating wire earth pressure gauges are installed in 2630# energy piles. Seven platinum resistance thermometers are installed along the pile body, with burial depths of 15.5 m, 22.5 m, 29.5 m, 36.5 m, 42.5 m, 51.5 m and 57.0 m. At the same depth of the thermometers, vibrating wire type reinforcement stress gauges and concrete strain gauges are symmetrically installed to monitor the axial stress and radial strain, with a total of 14 reinforcing bar stress gauges and 14 concrete strain gauges. One soil pressure gauge is welded at the pile end of the energy pile for measuring the bearing capacity at the pile end, and three soil pressure gauges are welded at the pile side for measuring the soil pressure at the pile side. The actual placement location of the sensors is shown in Figure 4.
Usually the source-side water temperature of the ground source heat pump is 10–20 °C higher than the initial ground temperature, and since the initial ground temperature of the test site is about 20 °C, the constant inlet temperature of this experiment is 40 °C. The heat exchanger pipe of the test pile is buried in 3U parallel type, and the flow rate is set to the maximum flow rate of 1.3 m3/h of the thermal response meter, which corresponds to an average flow rate of water in the heat exchanger pipe of 0.3 m/s.

2.4.1. Comparative Analysis of Supply and Return Temperatures

As shown in Figure 5, the supply and return water temperature of the heat exchanger pipe in the energy pile varies with time. By comparison, it is found that the test return water temperature and the simulated return water temperature are very consistent with each other in the trend of change, so the finite element model can consider the temperature change characteristics in the heat exchanger tube under the action of seepage.

2.4.2. Comparative Analysis of Supply and Return Temperatures

The temperature change curve of pile body with burial depth at different times of in situ test and numerical modeling is shown in Figure 6. Due to the limitation of field test conditions, there are certain fluctuations in the measured temperature values, and the simulation results are very consistent with the test results in terms of the change trend and the size of the temperature, so that the finite element model can consider the temperature change characteristics of the concrete of the pile body outside the heat exchanger pipe of the energy pile and the soil around the pile under the action of seepage flow.

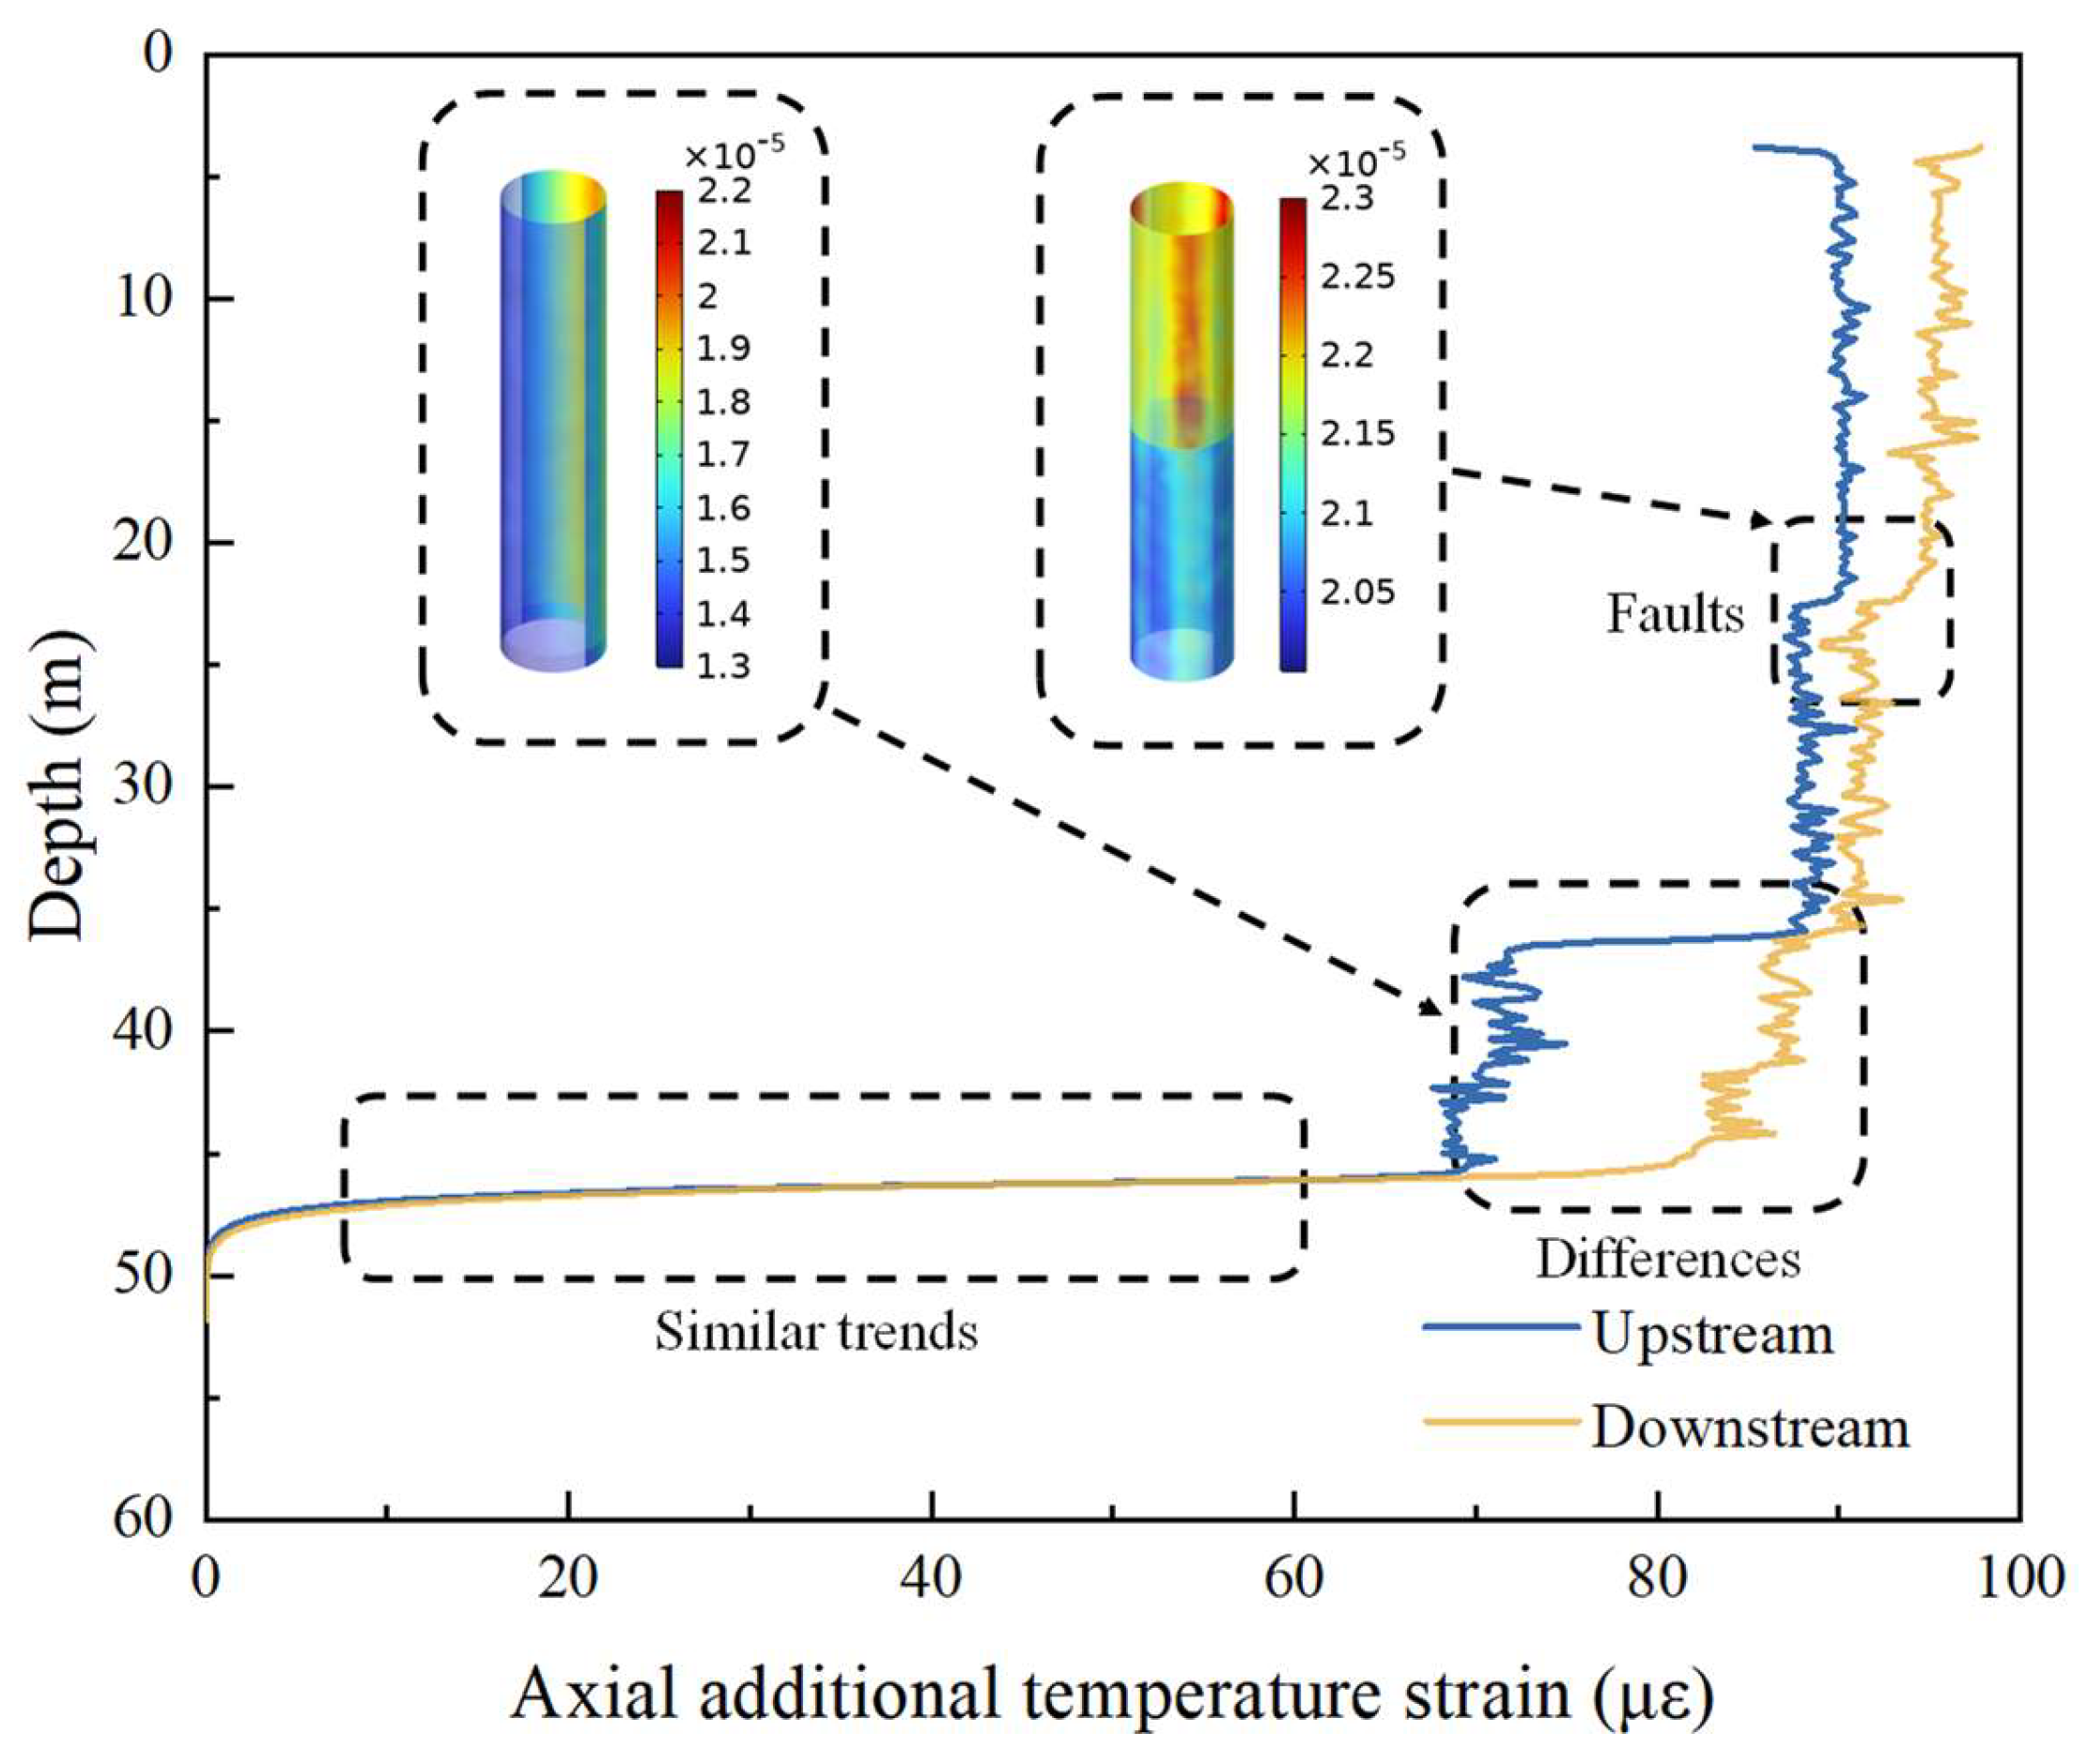
2.4.3. Comparative Analysis of Axial Temperature Strain

The in situ tests and retrograde were conducted for 30 days and recorded the inlet and outlet temperatures of the heat exchanger tubes, the temperature values of the piles measured by platinum resistors, the axial stress values of the piles measured by reinforcing steel gauges, the radial strains of the piles measured by concrete strain gauges, and the soil pressures on the side of the piles. Figure 7 shows the change curves of axial additional temperature strain of pile body with burial depth at different times of in situ test and numerical modeling. By comparison, it is found that the test strain values are very consistent with the simulated temperature values in terms of change trend and numerical magnitude, so the finite element model can consider the axial deformation characteristics of the energy pile under seepage.

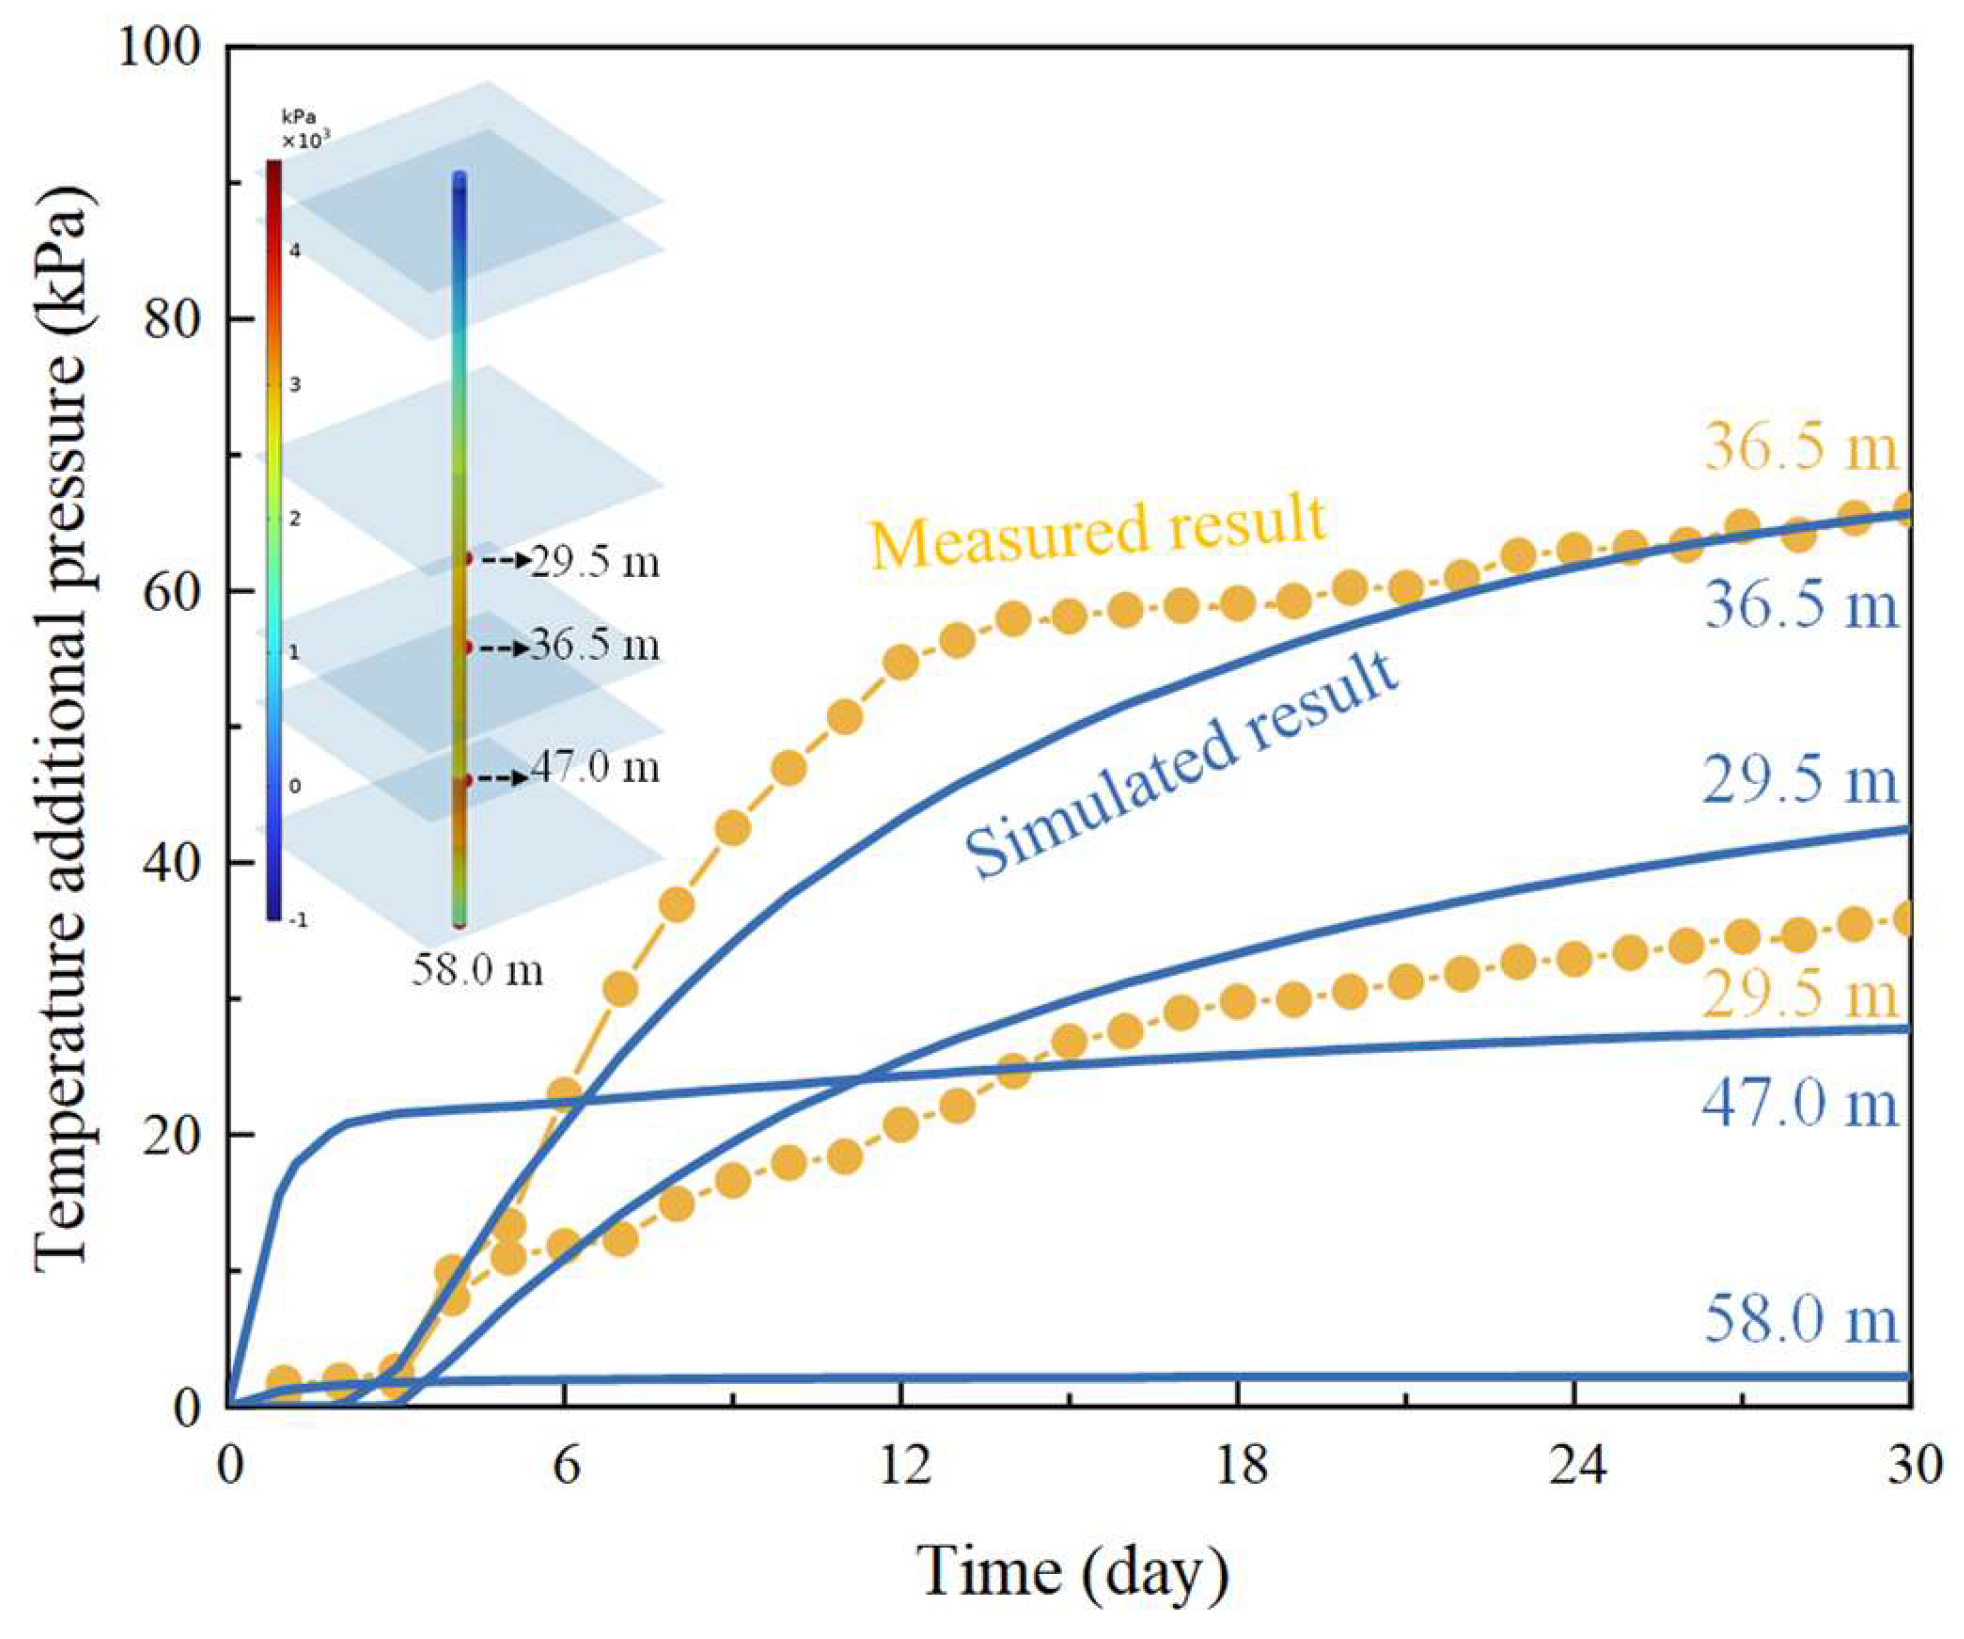
2.4.4. Comparative Analysis of Temperature Additional Pressure on Pile Side

Figure 8 shows the temperature additional pressure versus time curve on the pile side. In the in situ experiments, vibrating string earth pressure gauges were installed at different depths of the concrete-filled piles to measure the changes of the soil pressure on the pile side. Due to the limitation of the field test conditions, the seam of the earth pressure gauge will enter part of the concrete, so the in situ measurement value is smaller than the simulation result, and the comparison can be seen that the change trend of the test and simulation results is consistent. Thus, this finite element model can reflect the characteristics of the earth pressure at the pile–soil boundary. From Figure 8, the change value of earth pressure at 29.5 m and 36.5 m below the surface becomes larger with the increase in temperature. From the simulation results, the change value of temperature additional pressure on the pile side increases and then decreases with the increase in burial depth.

3. Results

3.1. The Evolution of Supply and Return Water Temperatures

Figure 5 shows the change curve of supply and return water temperature of the energy pile heat exchanger tube with time for in situ test and numerical simulation under seepage, which shows that the return water temperature increases gradually with the operation time, and the temperature change amplitude is decreasing, and finally reaches stability. Under the in situ test condition from 1 d to 28 d, the corresponding return water temperature increased from 35.20 °C to 38.00 °C, with a growth rate of 7.95%. Under numerical simulation condition from 1 d to 28 d, the corresponding return water temperature increased from 33.66 °C to 37.64 °C, with a growth rate of 11.82%. Seepage can increase the heat transfer per unit of delayed meter of energy piles, and the heat transfer increases with the seepage rate. Numerical simulation analysis shows that the heat exchange per unit of delayed meter of the energy pile is 93.90 W/m after 30 d of operation without seepage. The heat exchange per unit of delayed meter is 98.4 m/a when the seepage rate is 50 m/a, which is 4.79% higher than that without seepage. When the seepage rate is 100 m/a, the heat exchange per unit of delayed meter is 103.49 m/a, which is 10.21% higher than that in the case of no seepage. The reason for this phenomenon is that groundwater seepage enhances the convective heat transfer inside the soil, reduces the temperature of the pile body and the soil around the pile, and increases the temperature difference of heat transfer in the heat transfer tube, thus increasing the heat transfer.

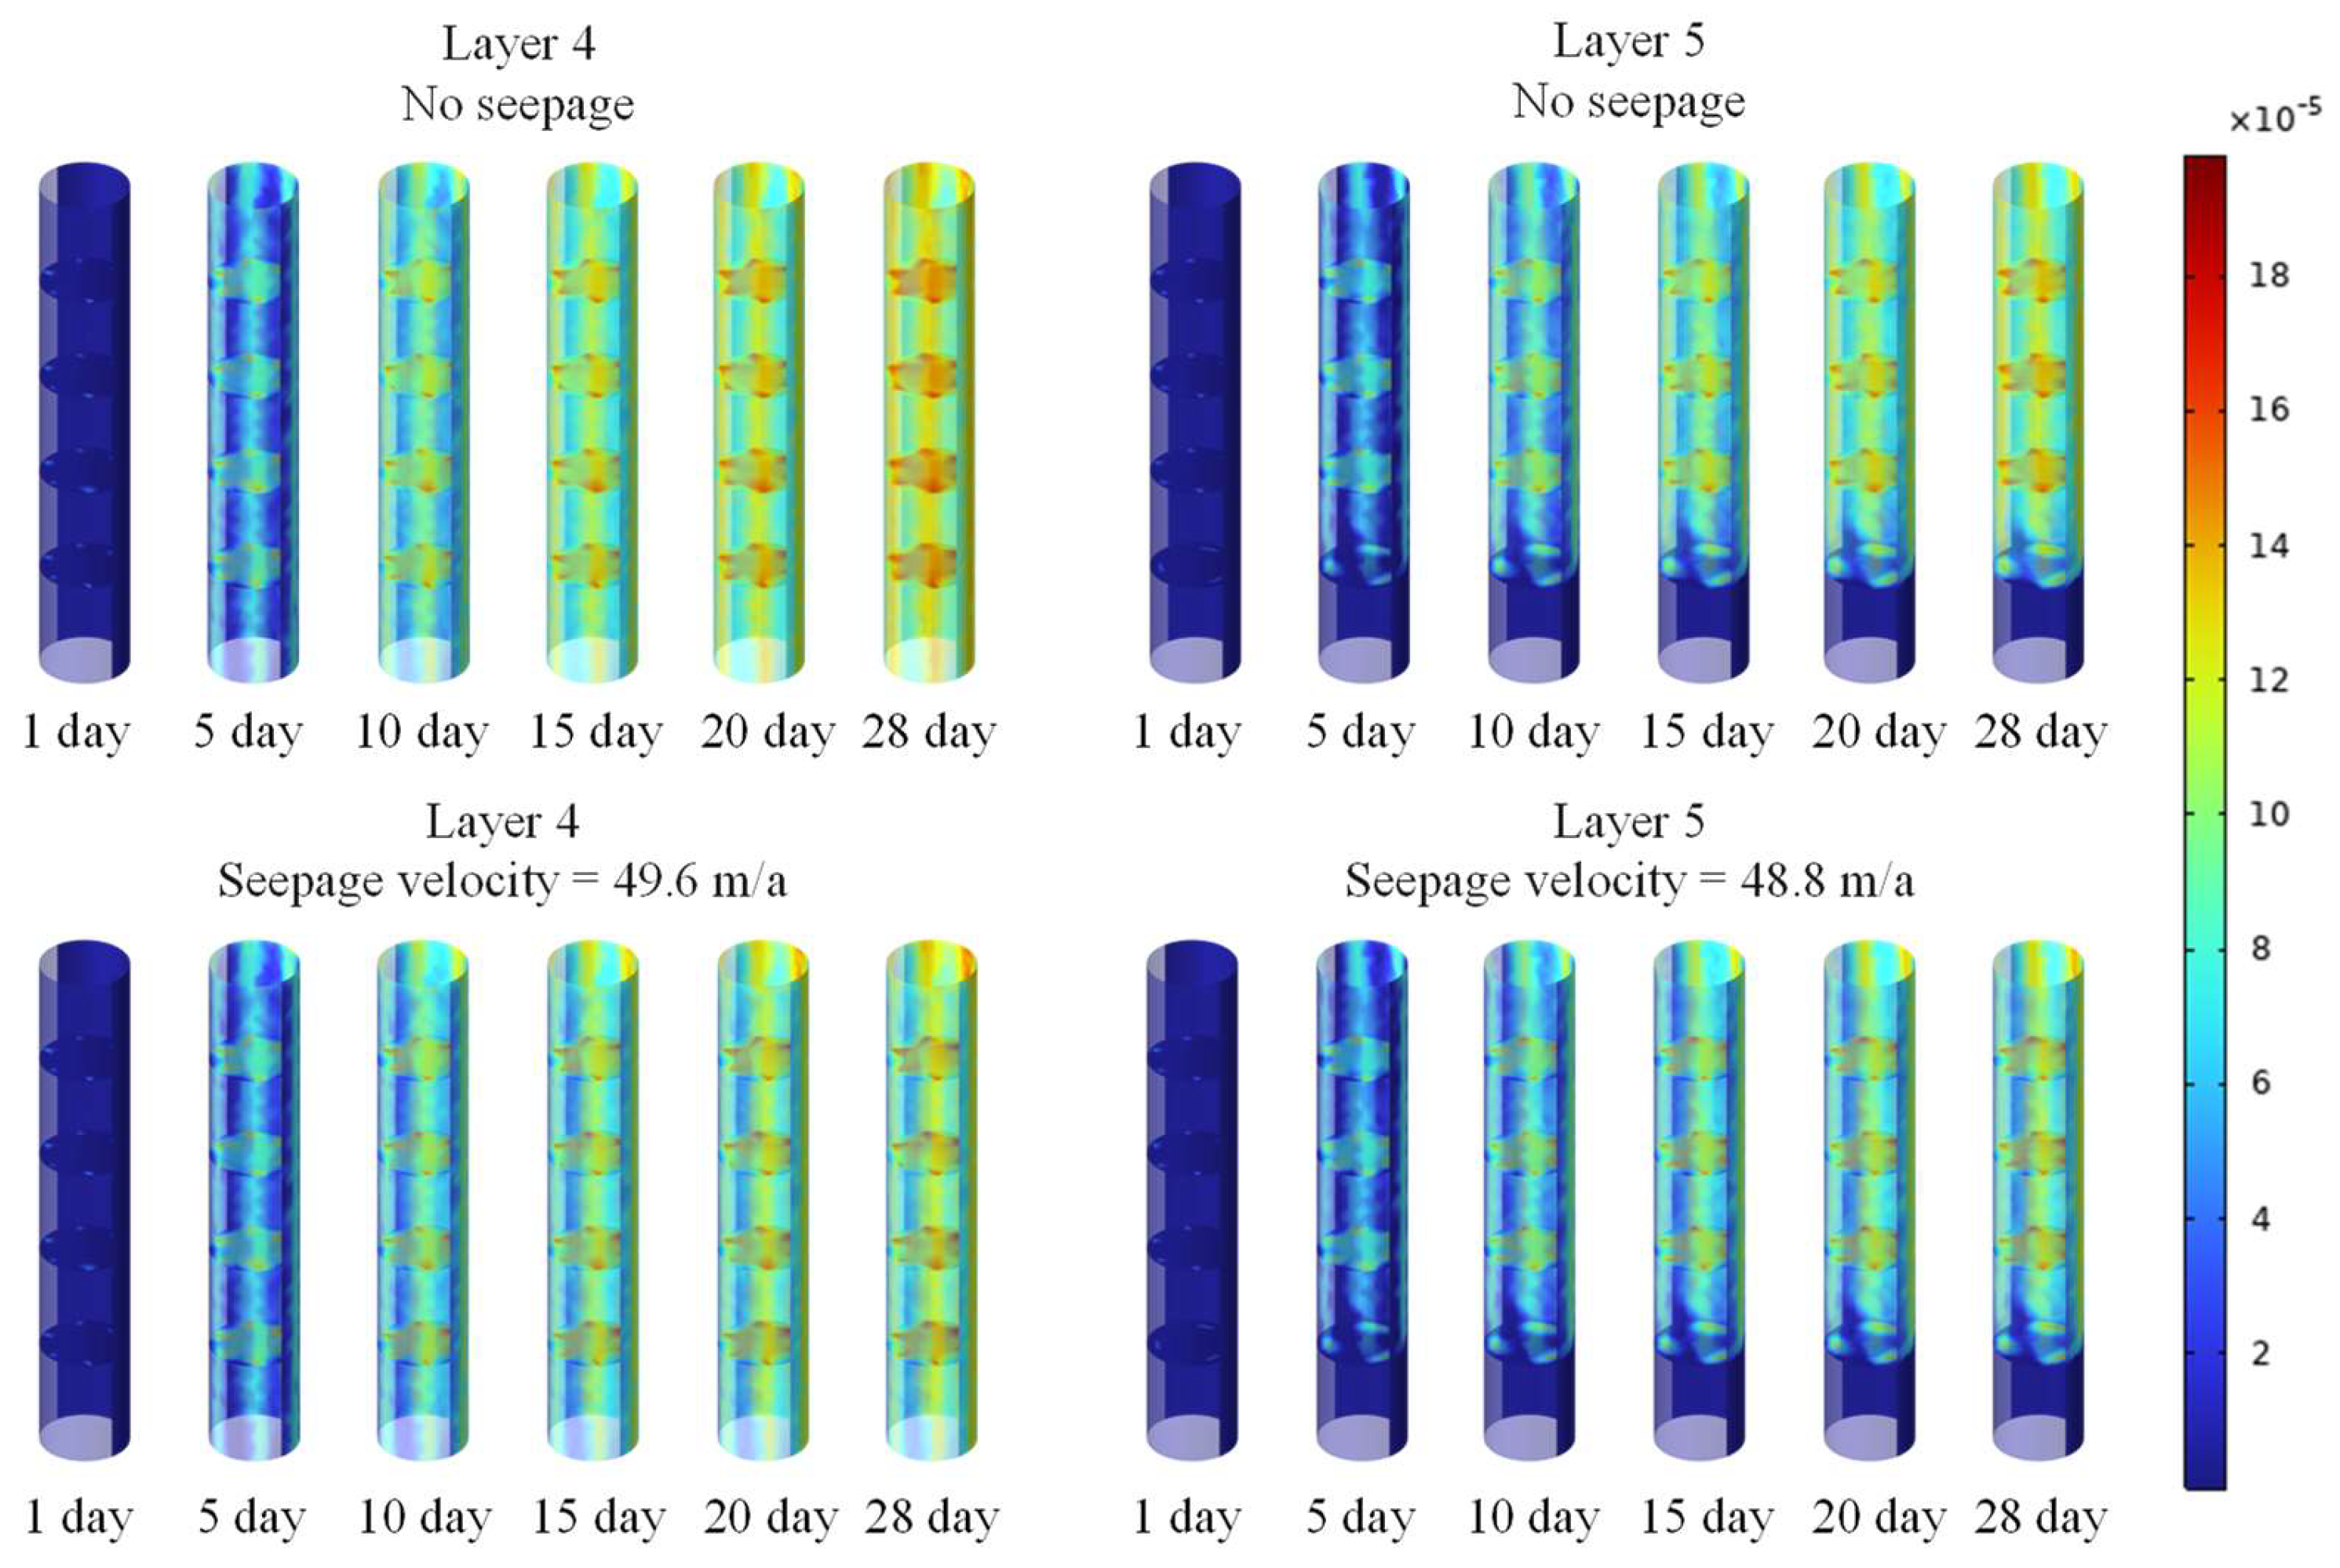
3.2. The Evolution of Temperature in Pile and Surrounding Soil

After the energy piles were operated for 28 d, the measured temperature values upstream of the seepage under the in situ test condition were 32.25, 34.81, 31.18, 29.43, 30.31, 19.68 and 19.75 °C in order from shallow to deep, and the measured temperature values downstream of the seepage were 36.00, 33.56, 35.02, 31.97, 34.81, 19.81 and 19.75 °C. The temperature change rates upstream and downstream of the seepage were 12%, −4%, 12%, 9%, 15%, 1% and 0% in order from shallow to deep. Under the numerical simulation condition, the temperature probe was used to extract the temperature values of the pile body, and the measured temperature values upstream of the seepage were 35.16, 34.72, 34.58, 31.30, 30.61, 20.00 and 20.00 °C from the shallow layer to the deep layer, and the measured temperature values downstream of the seepage were 35.87, 35.32, 35.07, 34.24, 33.45, 20.00 and 20.00 °C from the shallow layer to the deep layer, respectively. The temperature change rates upstream and downstream of the seepage under simulated conditions were 2%, 2%, 1%, 9%, 9%, 9%, 0% and 0% in order from shallow to deep. A comparison of the temperature change rates shows that the temperature values on the upstream side of the pile under seepage are usually smaller than those on the downstream side, and the temperature change rate with time in the seepage stratum is larger than that in the non-seepage stratum, which is consistent with the conclusion that seepage can enhance the heat transfer performance of energy piles.
The temperature change curves with time at different locations from the heat exchanger pipe in the seepage layer are shown in Figure 9, and there is an obvious difference between the upstream and downstream temperature trends of the soil around the pile as the energy pile runs with seepage. It can be seen from Figure 9, when there is no groundwater seepage, that the temperature field of the soil body around the pile is symmetrically distributed with the energy pile as the center, and the temperature of the soil body around the pile gradually increases with the increase in the running time of the energy pile, and the range of thermal influence increases. After 30 d of continuous operation, the thermal influence range of both upstream and downstream is 2.1 m. When the seepage rate is 50 m/a, the upstream thermal influence range is 1.1 m, which is a reduction of 47.61% compared to no seepage, and the downstream thermal influence range is 3.4 m, which is an increase of 61.90% compared to no seepage. When the seepage rate is 100 m/a, the upstream thermal influence range is 0.7 m, which is a reduction of 66.66% compared to no seepage, and the downstream thermal influence range is 4.6 m, which is an increase of 119.04% compared to no seepage.
It can be seen from the above results that when there is seepage, the heat accumulation area downstream of the energy pile is not fixed. Specifically, as the seepage velocity increases, the heat accumulation area decreases, because the larger seepage velocity takes away more heat. Moreover, with the increase in operation time, it keeps moving downward to the seepage direction, and the heat influence range perpendicular to the seepage direction keeps decreasing, so the seepage can dissipate heat from the upstream soil region and effectively reduce the heat accumulation problem of the upstream soil.
It can be seen from the above results that when there is seepage, the heat accumulation area downstream of the energy pile is not fixed. Specifically, as the seepage velocity increases, the heat accumulation area decreases, because the larger seepage velocity takes away more heat. Moreover, with the increase of the operation time, it keeps moving downward to the seepage direction, and the heat influence range perpendicular to the seepage direction keeps decreasing, so the seepage can dissipate heat from the upstream soil region and effectively reduce the heat accumulation problem of the upstream soil.
Figure 10 shows the temperature change curve of the outer side of the pile body of the upstream and downstream energy piles with depth during 30 d of continuous operation. From the curve in Figure 10, it can be seen that with the increase in burial depth, the temperature value of the pile–soil interface first rises rapidly and then decreases in segments. The temperature first rises because the ground temperature of the shallow layer is affected by the outside air. Moreover, the temperature change amplitude is relatively small. As the depth of the burial increases, the heat carried in the heat exchanger tube becomes less, and thus the ground temperature of the stratum gradually decreases. In addition, because of the differences in thermal physical parameters such as thermal conductivity of different strata, the temperature at the junction position of different strata will have obvious faults. Since the thermal conductivity of the pile concrete is larger than that of the soil surrounding the pile and the constant pressure heat capacity is smaller than that of the soil surrounding the pile, the temperature fluctuation at the pile–soil interface is significantly larger than that of the soil’s interior. When the depth reaches the seepage stratum, the temperature at the upstream interface of the pile–soil decreases by about 1 °C with drastic changes, and the temperature at the downstream interface decreases by about 0.3 °C with smaller changes. The temperature of the soil around the pile in the seepage stratum has a different trend from that of the pile–soil interface, with the temperature downstream of 1 m from the energy pile increasing by about 0.4 °C, and that downstream of 3 m from the energy pile increasing by about 0.6 °C. This is because the heat capacity of the soil is greater than that of the concrete, and seepage carries the heat from the upstream energy piles and the soil to the downstream, which accumulates in the soil in large quantities and increases the temperature of the soil, whereas the energy piles are relatively small, so the temperature change is not obvious.

3.3. The Evolution of Axial Strain in Pile

Positive values of the measured temperature strains indicate that the pile has expanded in the axial direction after being heated, and it can be seen from Figure 10 that the temperature strains induced by the pile body upstream of the seepage flow are smaller than those downstream, and the bottom of the energy pile does not undergo any temperature change due to the lack of temperature change.
Figure 11 shows the horizontal section of axial additional temperature strain at different operating times and depths of energy piles under simulated working conditions. With the operation of energy pile, the maximum strain at the buried depth of 1.5 m increases from 159.94 to 183.18 με, with a change rate of 14.53%. The maximum strain at 15.5 m increases from 153.35 to 185.45 με, with a change rate of 20.93%. The maximum strain at 22.5 m increases from 150.32 to 183.61 με, with a change rate of 22.14%. The maximum strain at 29.5 m increases from 144.86 to 181.37 με, with a change rate of 25.20%. The maximum strain at 36.5 m increases from 138.72 to 177.97 με, with a change rate of 28.29%. The rate of change of axial additional temperature strain of the pile body gradually increases with the increase in burial depth.
Figure 12 shows the distribution of the additional axial temperature strain of the pile body under seepage and non–seepage. As can be seen from Figure 12, the axial temperature strain of the specific point of the energy pile under seepage and non–seepage both increase gradually with operation time. In the operation process from 1 d to 28 d, when the seepage velocity of the fourth layer (fine sand layer) is 49.6 m/a, the maximum value of the upstream temperature strain increases from 114.70 to 160.88 με, which is 40.26%, and the maximum value of the downstream temperature strain increases from 114.72 to 166.65 με, which is 45.26%. The upstream maximum value increases from 115.09 to 165.08 με, which is 43.43% higher under the non–seepage effect when the seepage velocity is 0 in layer 4. The downstream maximum increases from 114.71 to 164.66 με, and is elevated by 43.54%.
When the seepage velocity of the five–layer fine sand layer is 48.8 m/a, the upstream temperature strain maximum increases from 111.64 to 150.74 με, being elevated by 35.02%, and the downstream temperature strain maximum increases from 113.54 to 162.99 με, being elevated by 43.55%. Under the non–seepage effect, i.e., when the seepage velocity is 0 in layer 5, the upstream maximum value increases from 112.16 to 158.83 με, being elevated by 41.61%, and the downstream maximum value increases from 113.43 to 159.50 με, being elevated by 40.61%.
From the above results, it can be seen that the groundwater seepage can reduce the additional temperature strain of the upstream pile body while increasing the magnitude of the temperature strain of the downstream pile body. This is because seepage will bring the heat from the upstream pile body to the downstream, which makes the temperature of the downstream pile body higher than that of the upstream, and the additional temperature strain of the pile body being positively correlated with the temperature.
Figure 13 shows the axial additional temperature strain on the outside of the energy pile body (run continuously for 30 d). It can be seen from the figure that there is an obvious fault in the temperature strain at the junction of strata layers, which is because the elastic modulus and thermal expansion coefficient of different strata are different, resulting in different temperature strains due to different constraints. In addition, the heat because of groundwater seepage was taken downstream, with the upstream temperature in relation to the pile lateral strain being far lower than for the downstream. At the same time, when there is no seepage, the temperature strain variation trend is the same on both sides of the energy pile, so the heat exchange tube should be in a symmetrical arrangement in the energy pile as far as possible in the actual project.

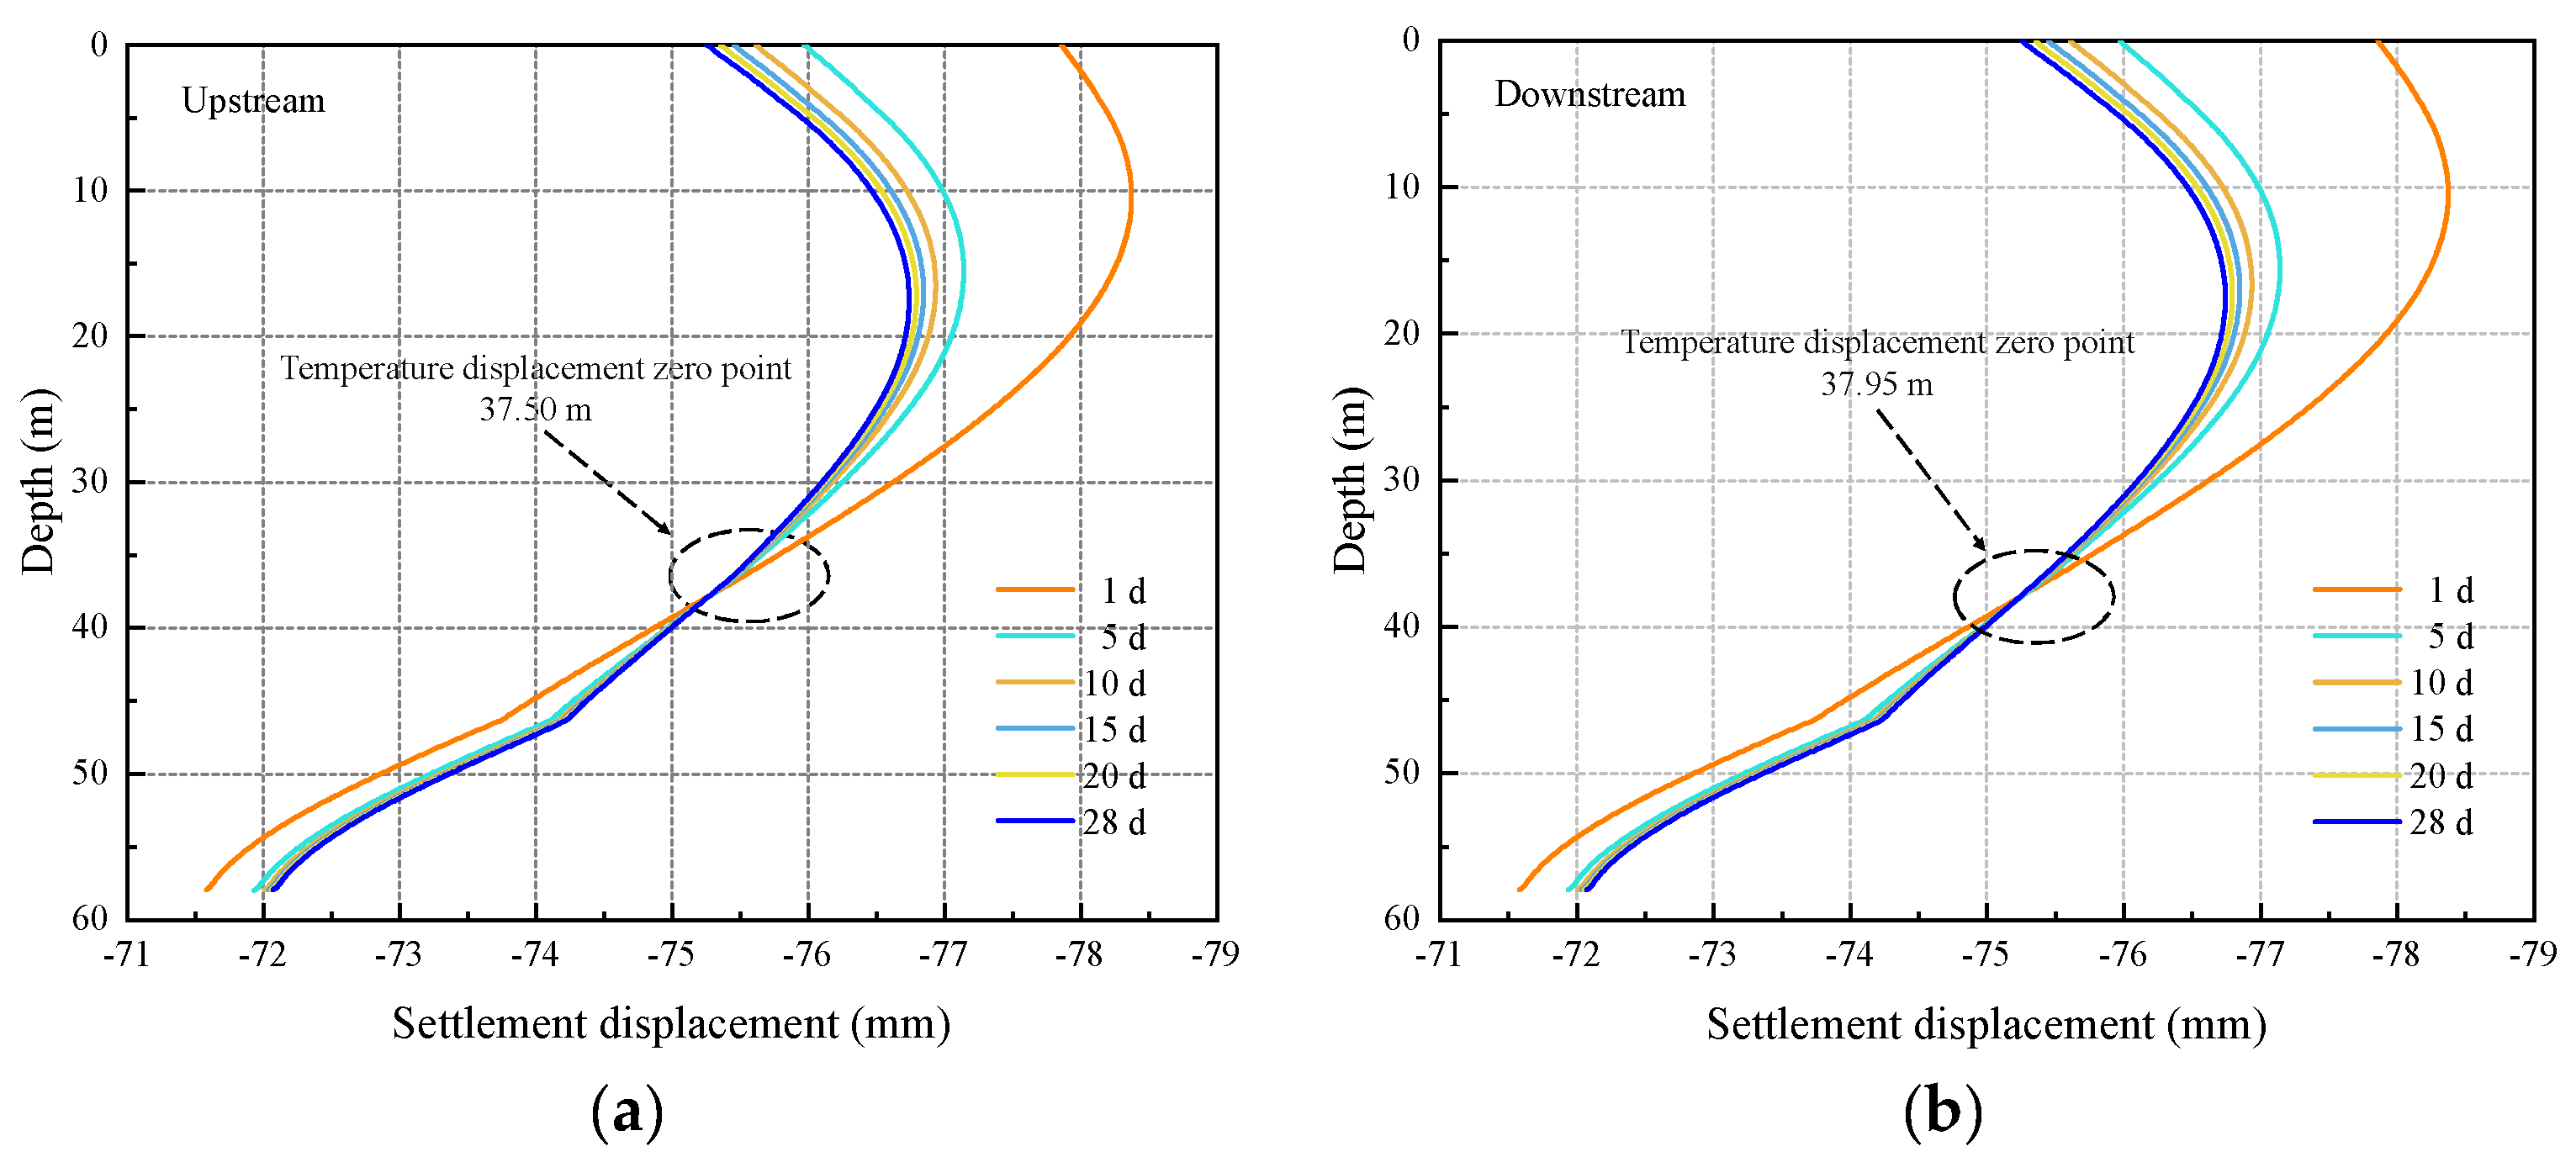
3.4. The Evolution of Pile Settlement

Through the numerical model of the heat–fluid–force coupling of the energy pile, the neutral point of the energy pile is identified, and the settlement characteristics of energy pile are studied. Figure 14 shows that the side settlement displacement of the upstream and downstream energy pile changes with the buried depth. It can be seen from the figure that the additional temperature displacement of the upper and lower reaches of the energy pile at 37.50 m and 37.95 m, respectively, is 0, which is the neutral point. The energy pile expands or contracts to both ends of the pile with the neutral point as the boundary. Temperature has no effect on the properties of the contact surface, and the lateral friction resistance of the pile at the neutral point does not change. As the running time of energy pile increases, when the buried depth is less than the neutral point—and the additional temperature displacement is positive—the settlement displacement decreases. When the buried depth is greater than the neutral point, the additional temperature displacement is negative, that is, the settlement displacement increases.

3.5. Softening Shear Model of Pile–Soil Contact Surface under Large Shear Displacement Conditions

3.5.1. Constitutive Equation

For ultra-long piles, when the relative displacement of the pile–soil contact surface is larger than the ultimate displacement of the soil body around the pile, the pile–soil contact surface will slip, and its shear strength is reduced from the peak strength to the residual strength, and the softening phenomenon occurs. Through the previous analysis of the deformation mechanism of the energy pile, it can be found that there is a situation in which the pile–soil displacement becomes larger under the heating condition, which indicates that it is necessary to adopt the softening load transfer function to reflect the change characteristics of the pile–soil contact surface friction. In this paper, according to the mechanical characteristics of energy piles, a segmented softening function is proposed, which can consider the unloading process of energy piles in the upper part of the pile in the heat dissipation process and in the lower part of the pile in the heat extraction process. Moreover, the unloading process adopts the linear elasticity equation, and the slopes of the equations are equal to the initial slopes of the function. Figure 15 shows the curve of the softening shear model for pile–soil contact surface.
τ = τ p s ( a + c s ) ( a + b s ) 2 ( 0 s s r ) τ r ( s > s r )
In the equation, τ is the shear stress, τp is the peak strength and τr is the residual strength at the pile–soil contact surface, kPa. s is the shear displacement, sp is the displacement corresponding to the peak strength and sr is the displacement corresponding to the residual strength, mm. a, b and c are the fitting parameters.

3.5.2. Model Parameters and Physical Meaning

According to the characteristics of the softening feature and the model function, the softening function needs to satisfy the following three conditions:
τ ( s p ) = τ p τ ( s p ) = 0 τ ( s r ) = τ r
By performing a substitution into Equation (10), the following solution is obtained:
a = s u 1 4 c = s u 1 4 [ 2 α β ( α + 1 ) ] 2 α 1 β 4 β ( α 1 )
b = 1 4 + [ 2 α β ( α + 1 ) ] 2 α 1 β 4 β ( α 1 )
c = [ 2 α β ( α + 1 ) ] 2 α 1 β 4 β ( α 1 )
In the equation, α represents the ratio of the shear displacement sr at which the residual strength is reached to the shear displacement sp corresponding to the peak strength. β represents the ratio of the residual strength τr to the peak strength τp.
From the above analysis, this softening function can be determined by sp, τp, α, and β, which are the four physical parameters. The peak strength of the pile–soil contact surface can be expressed with the Mohr–Coulomb strength criterion as follows:
τ p = σ r tan ( δ p ) + c p
In the equation, σn indicates the normal effective stress corresponding to the peak shear stress at the contact surface, kPa. δp is the effective friction angle corresponding to the peak shear stress at the contact surface, °. cp indicates the effective cohesion of the contact surface, kPa.
Peak strength is directly proportional to the normal effective stress; therefore, the model not only characterizes the shear displacement relationship under the condition of constant normal stress, but also considers the change in normal stress during the shear process.
The peak stress at the pile–soil contact surface corresponds to a shear displacement sp, which is linearly related to lg(σn/Pa). The relationship can be written as follows:
s p = k p lg ( σ n / p a ) + b p
Rn is the roughness of the pile–soil contact surface. Dr is the compactness of the soil. Pa is the reference pressure which is equal to 101.325 kPa.

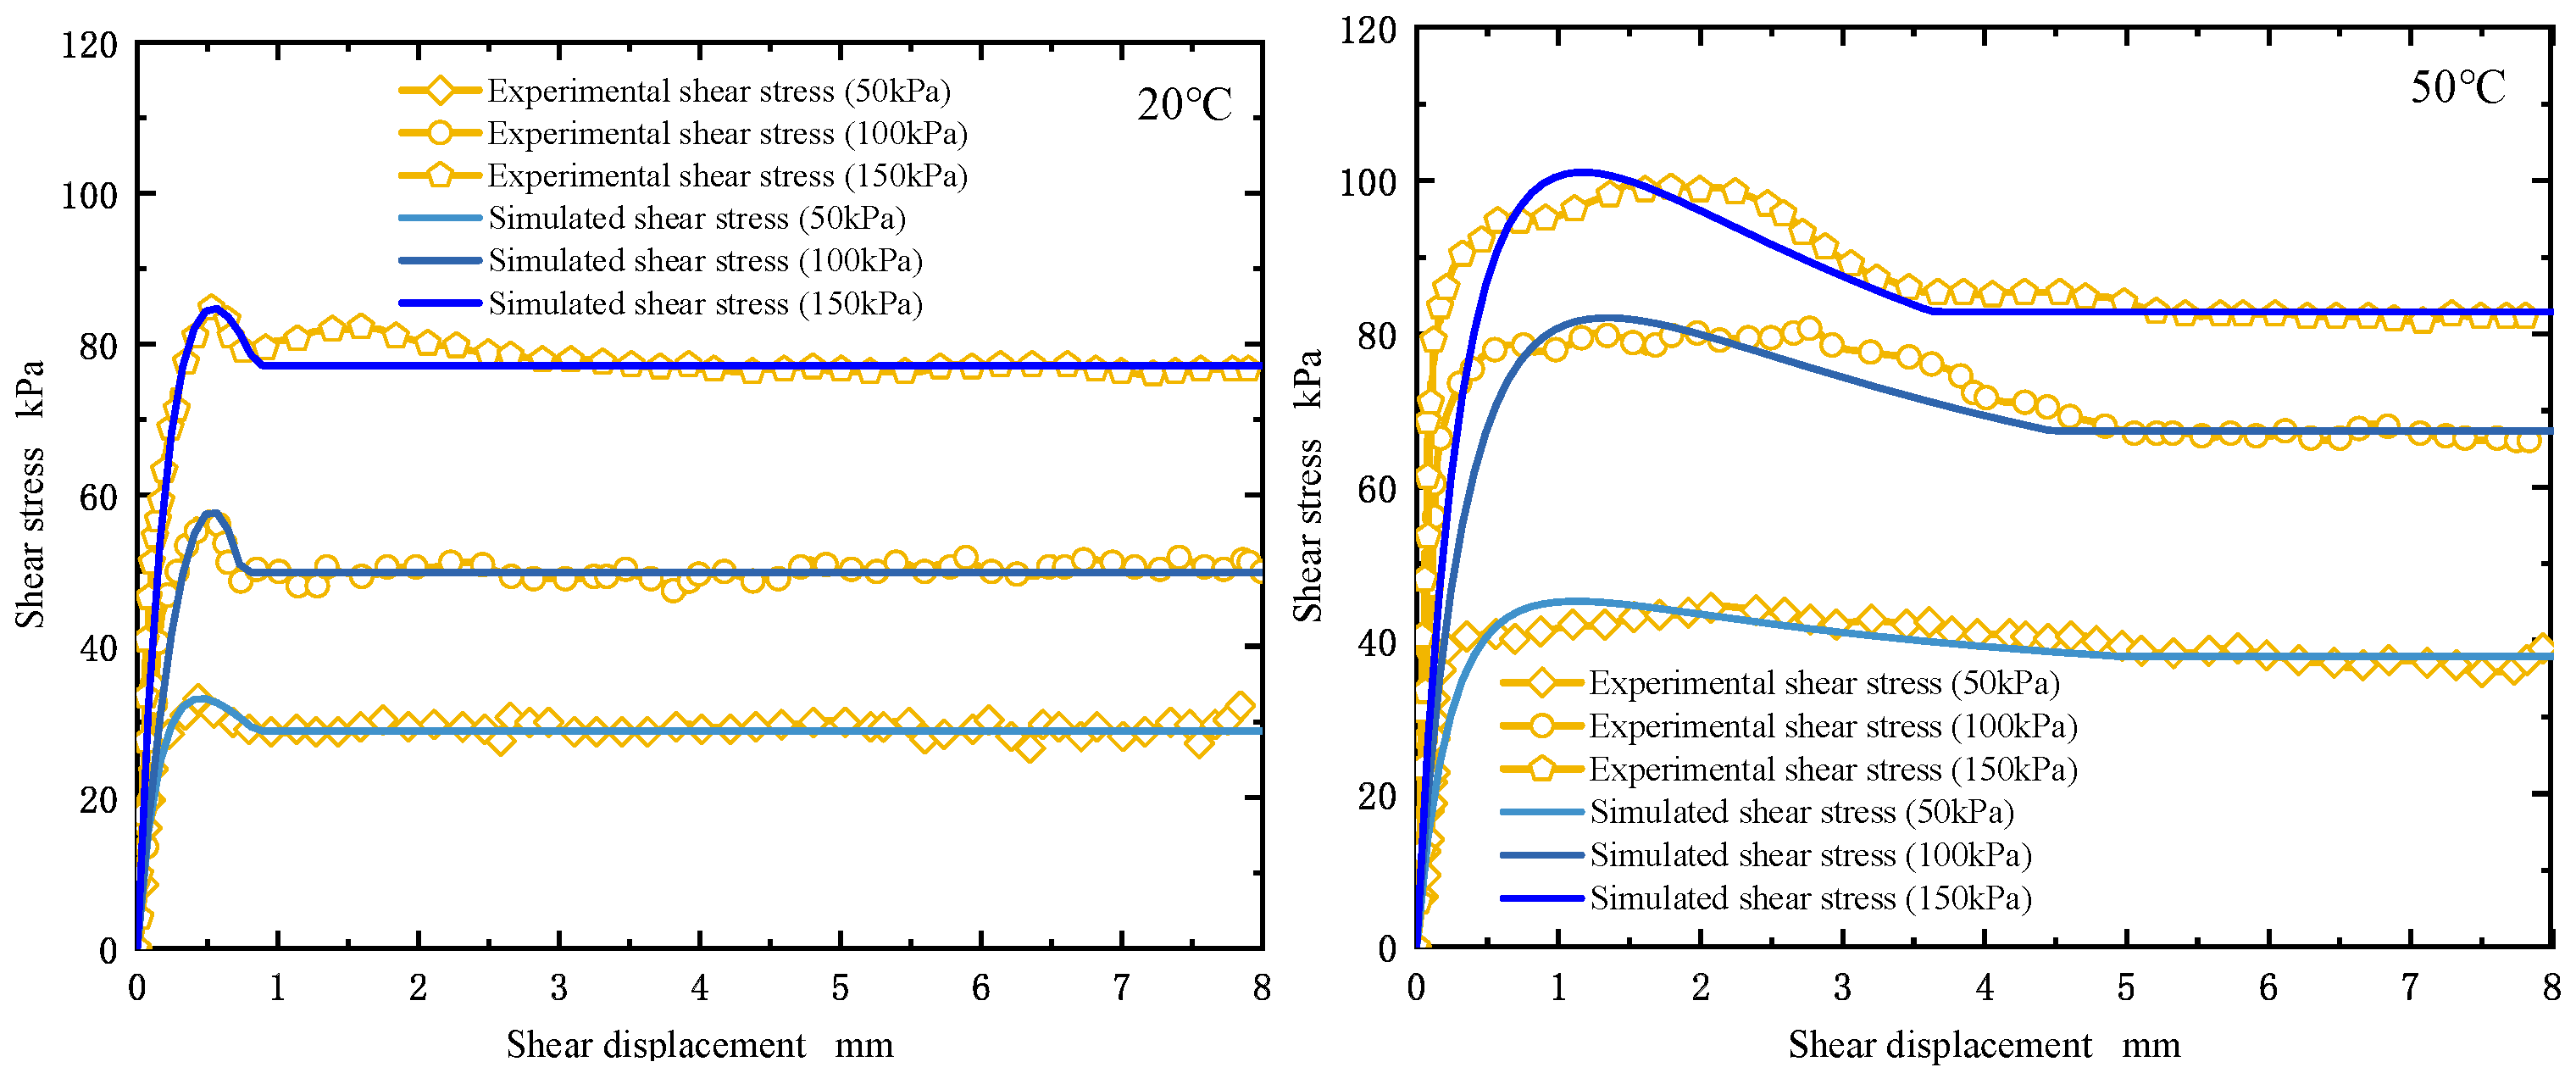
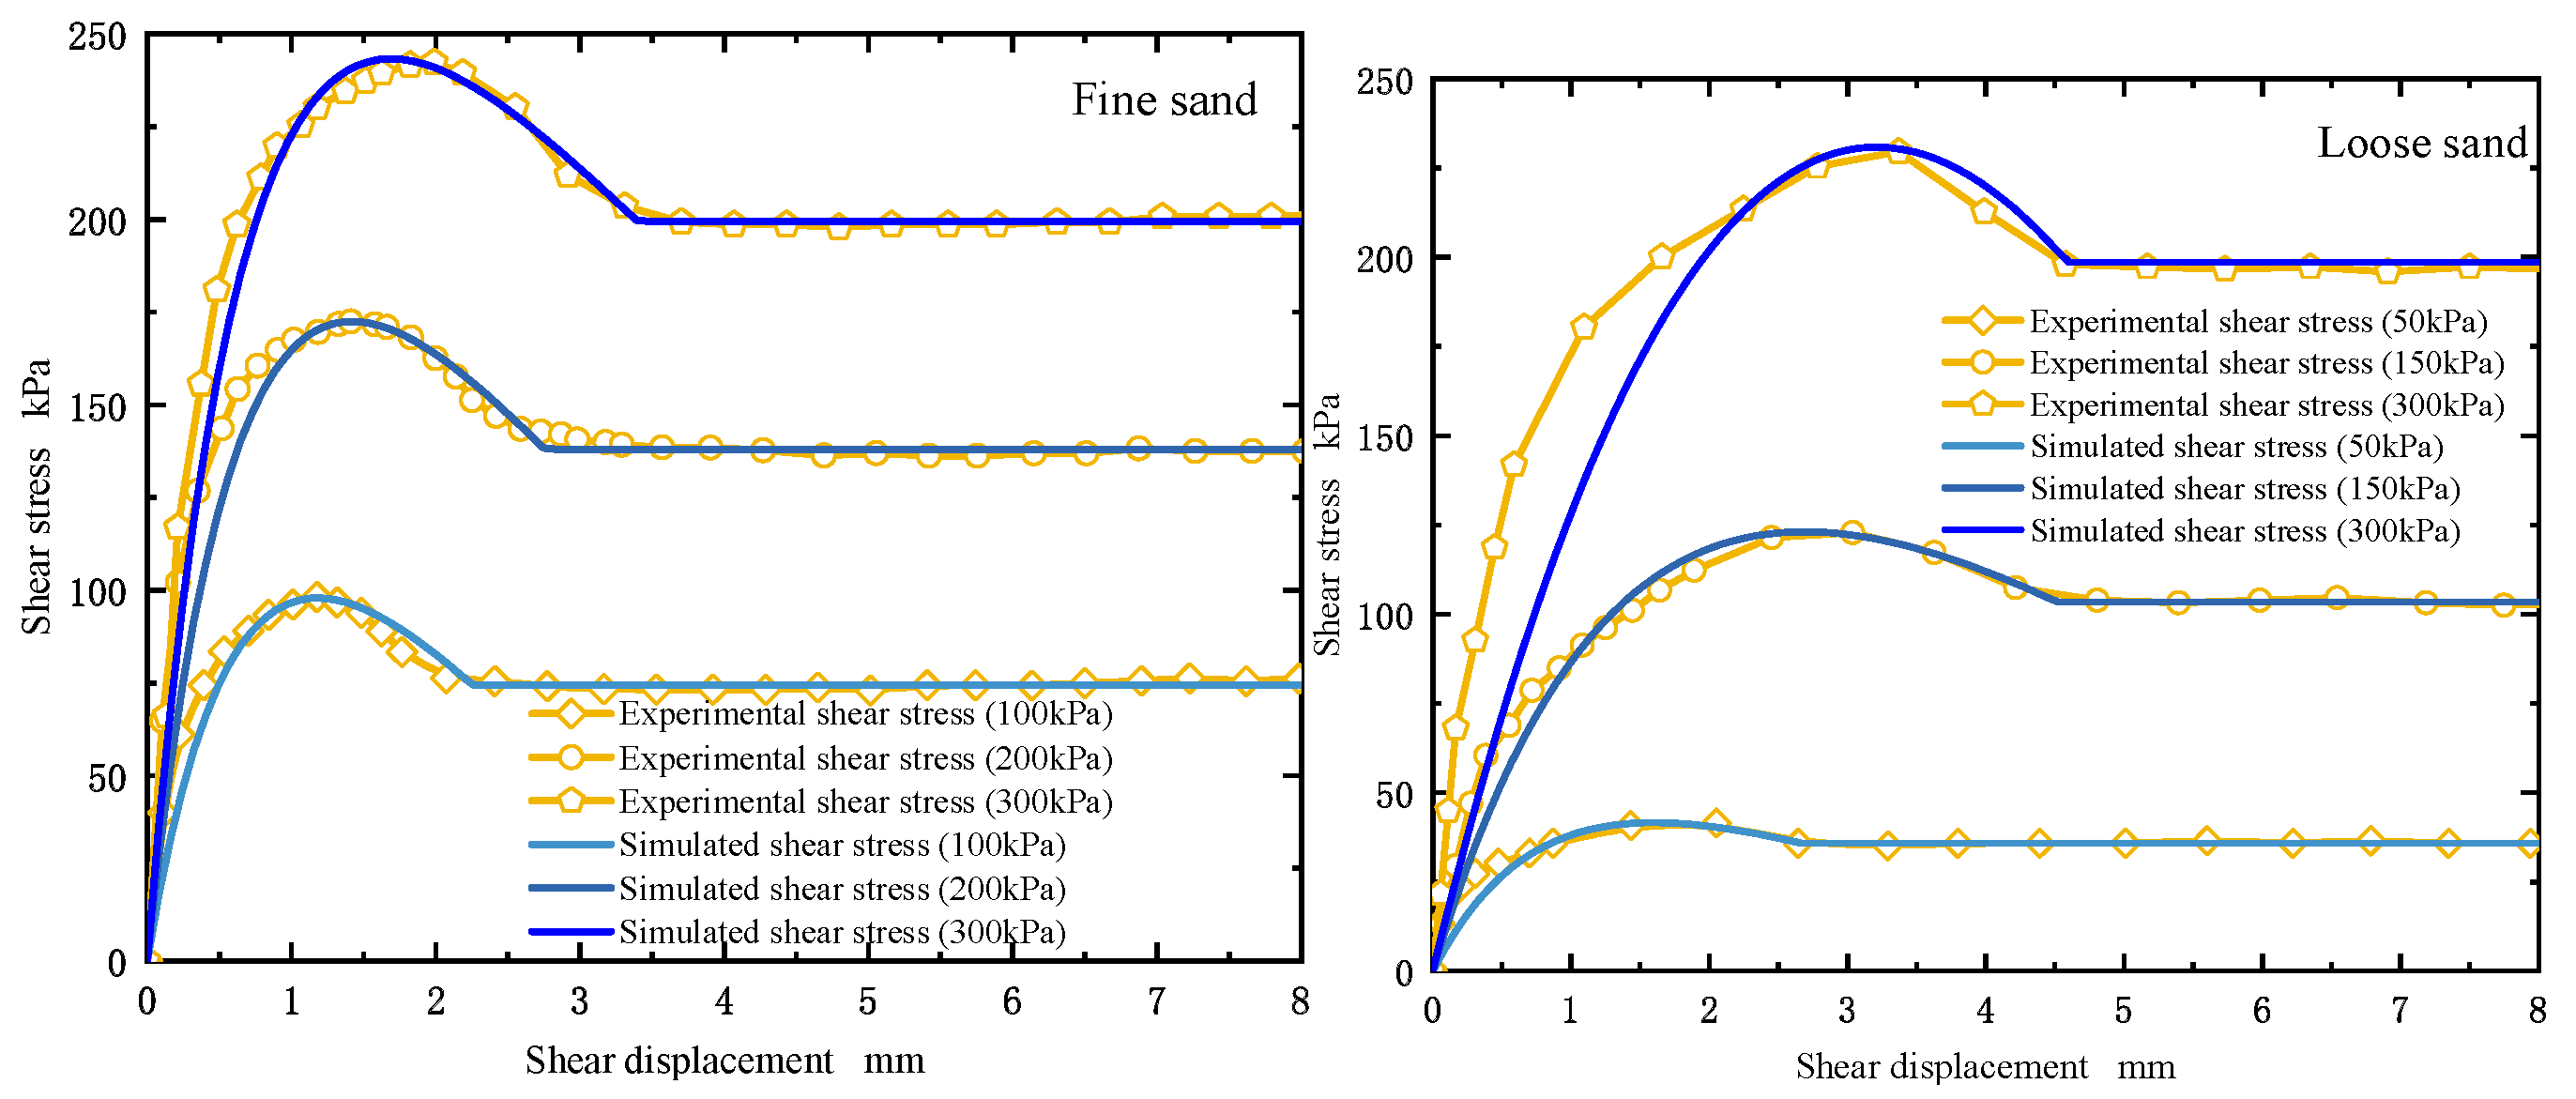
3.5.3. Validation of Pile–Soil Interface Model Simulation Capability

To verify the validity of the softening model, the indoor shear test data of Ghinonna [29] and Donna [30] were used for a comparison of the simulation. These test systems can reflect the effects of key factors, such as soil type, contact surface roughness (Rn), relative density (Dr), normal effective stress (σn), temperature, etc., on the softening characteristics, and the specific test conditions and parameters are shown in Table 3.
Figure 16, Figure 17 and Figure 18 show the test and simulation results of the shear stress–shear displacement of the contact surface of clay–concrete, sand–concrete and sand–aluminum plate, respectively. Through the data comparison, it is found that the simulated values are in good agreement with the experimental values, which indicates that the softening model proposed in this paper can simulate the relationship between the shear stress-shear displacement of the contact surface in different conditions well and calculate the softening characteristics of the contact surface with a relatively accurate quantitative calculation. Meanwhile, it can be found that the roughness of the contact surface, the compactness of the soil and the normal stress have some effects on the softening characteristics and the softening characteristics of the contact surface.

4. Conclusions

(1)
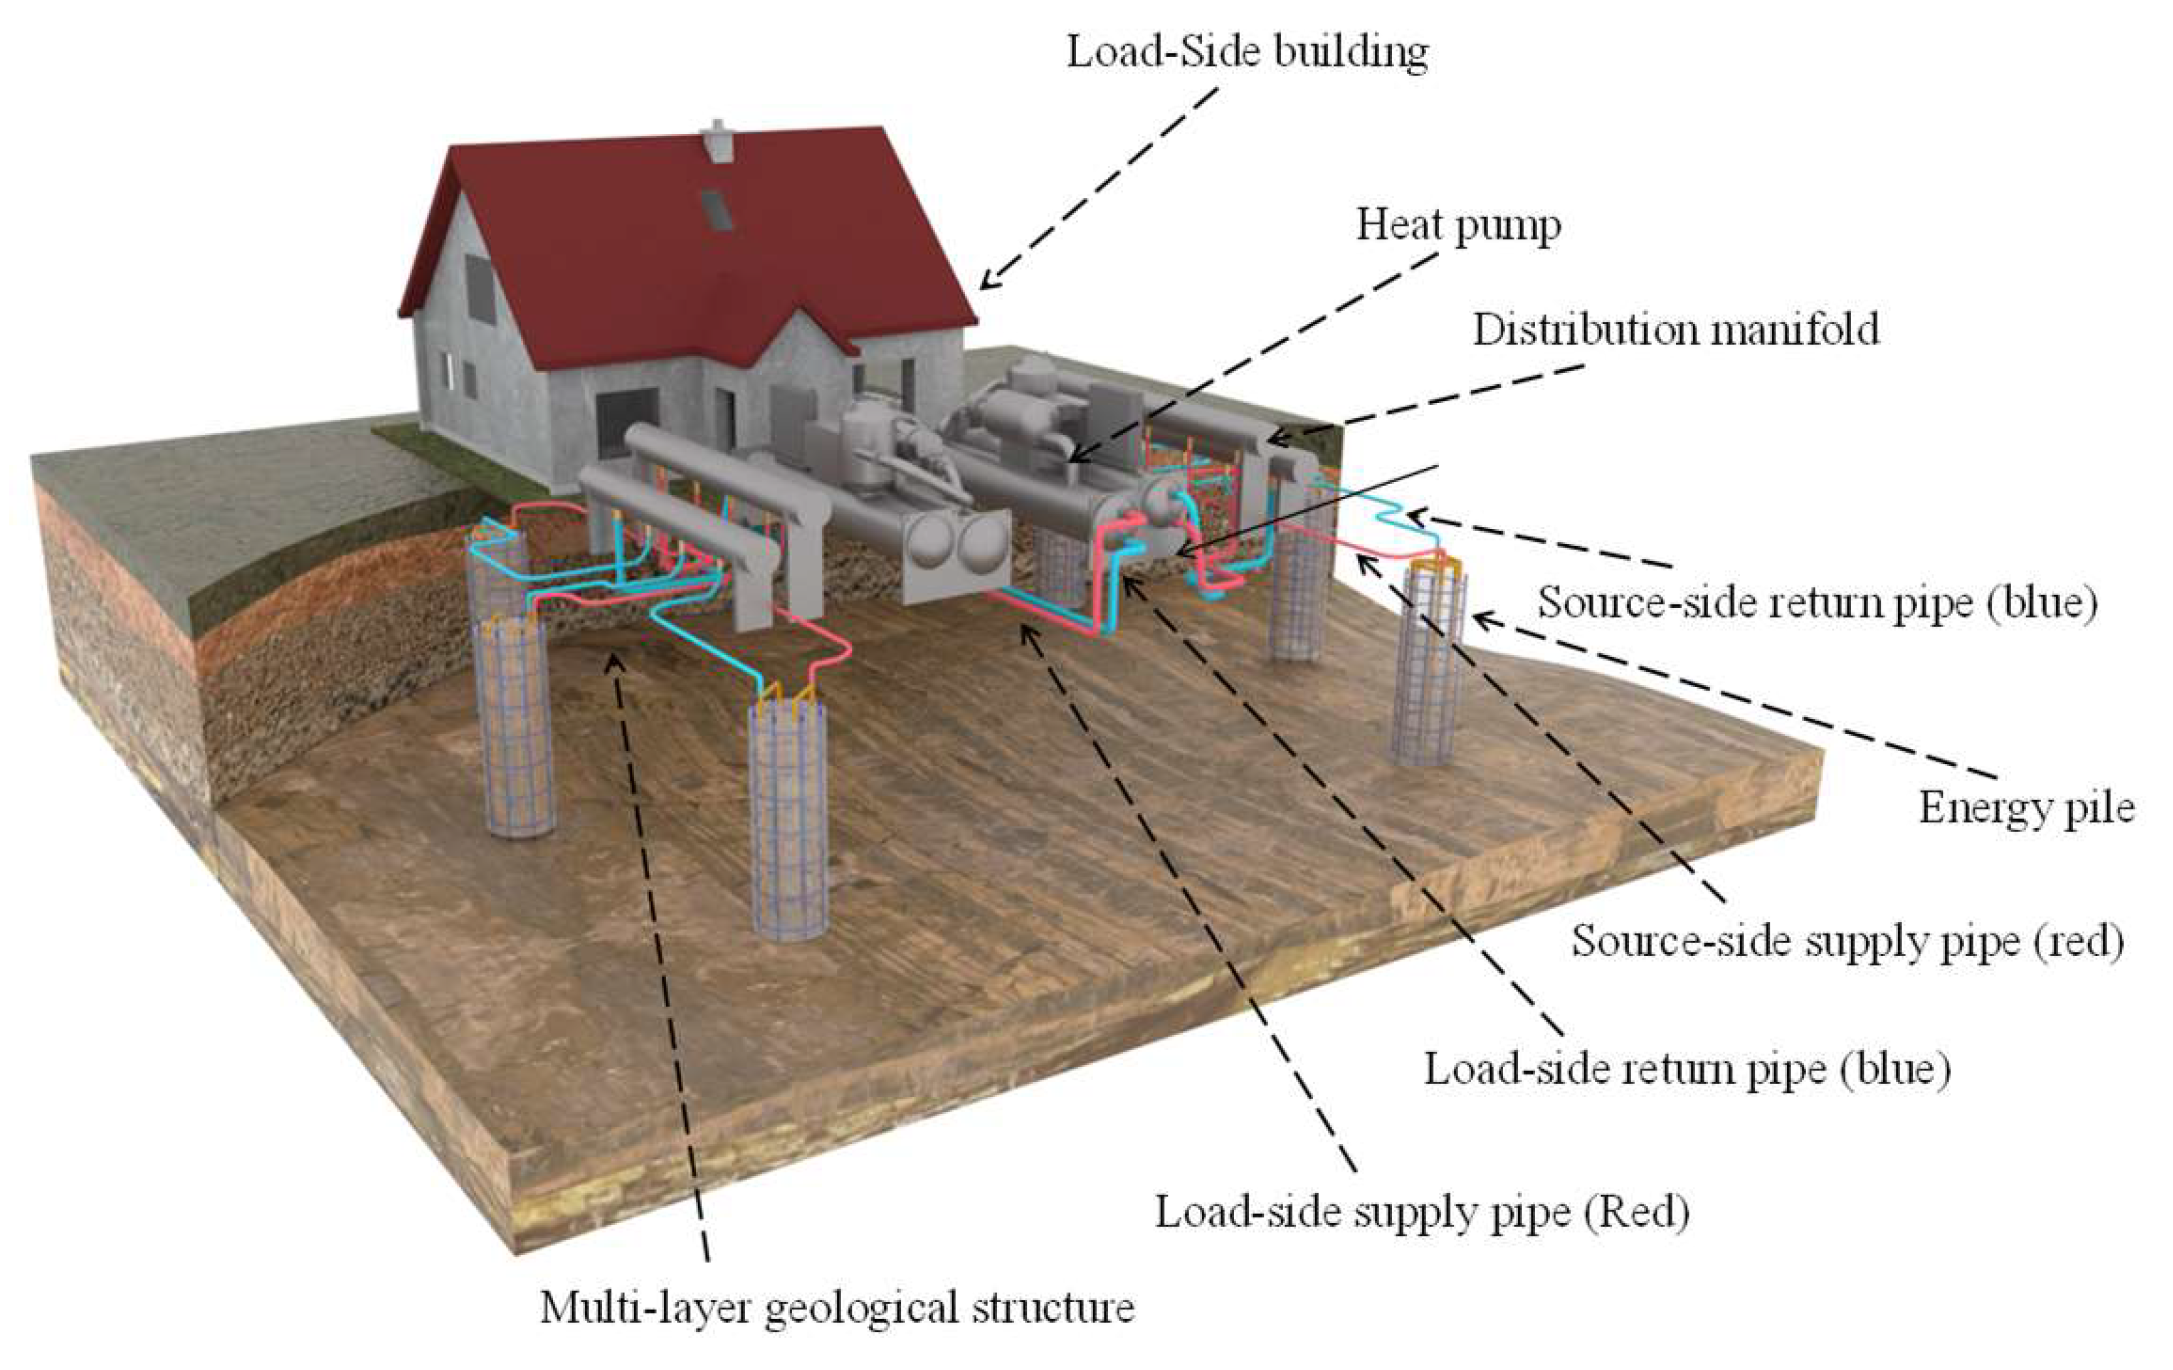
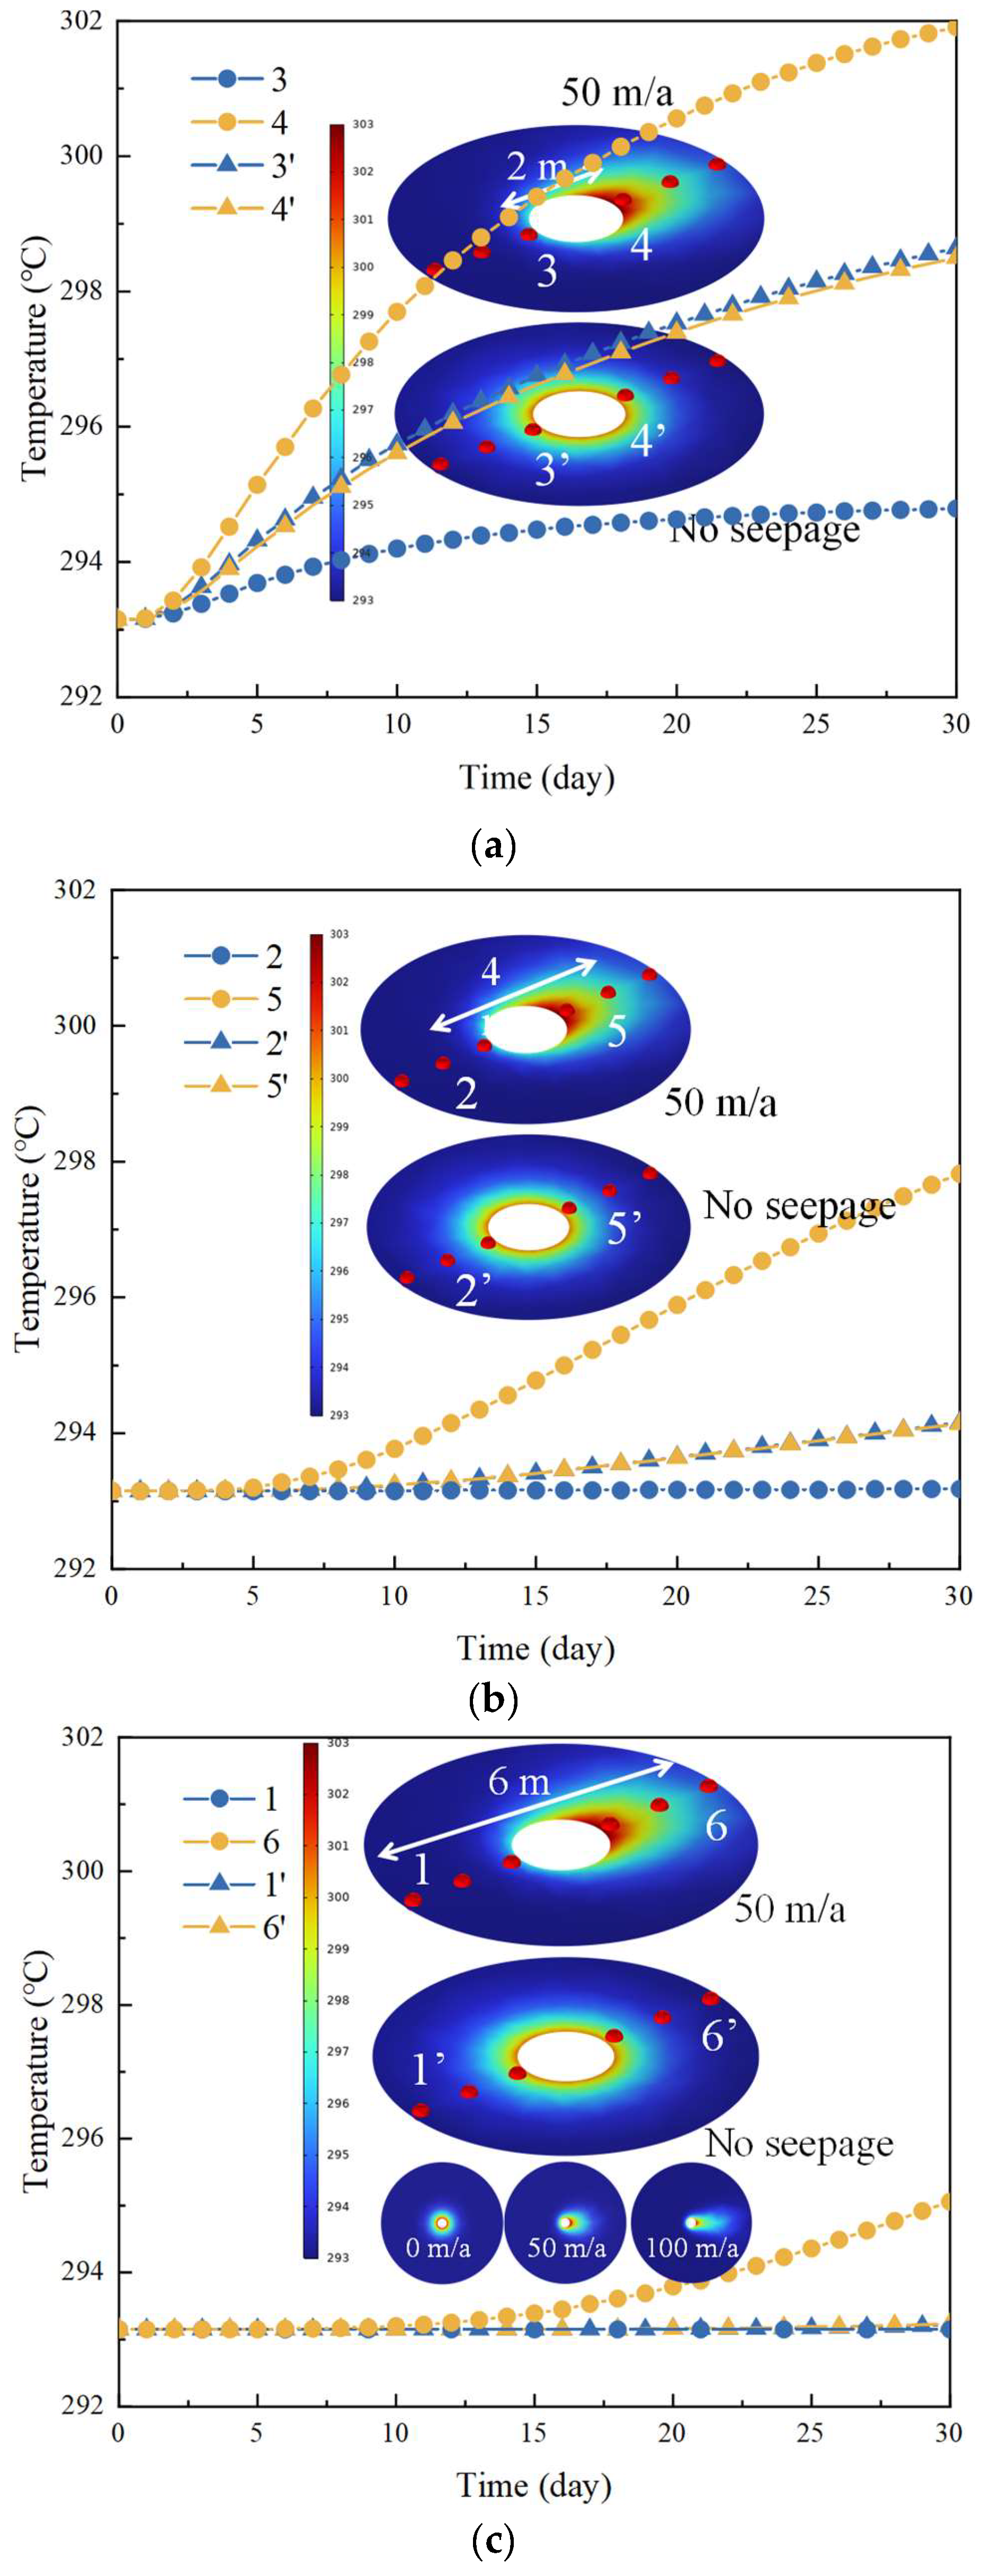
Groundwater seepage enhances convective heat transfer within the soil, increasing the heat transfer temperature difference between the heat transfer tubes and thus increasing the amount of heat transferred. The seepage dissipates heat from the upstream soil zone, effectively minimizing heat buildup in the upstream soil.
(2)
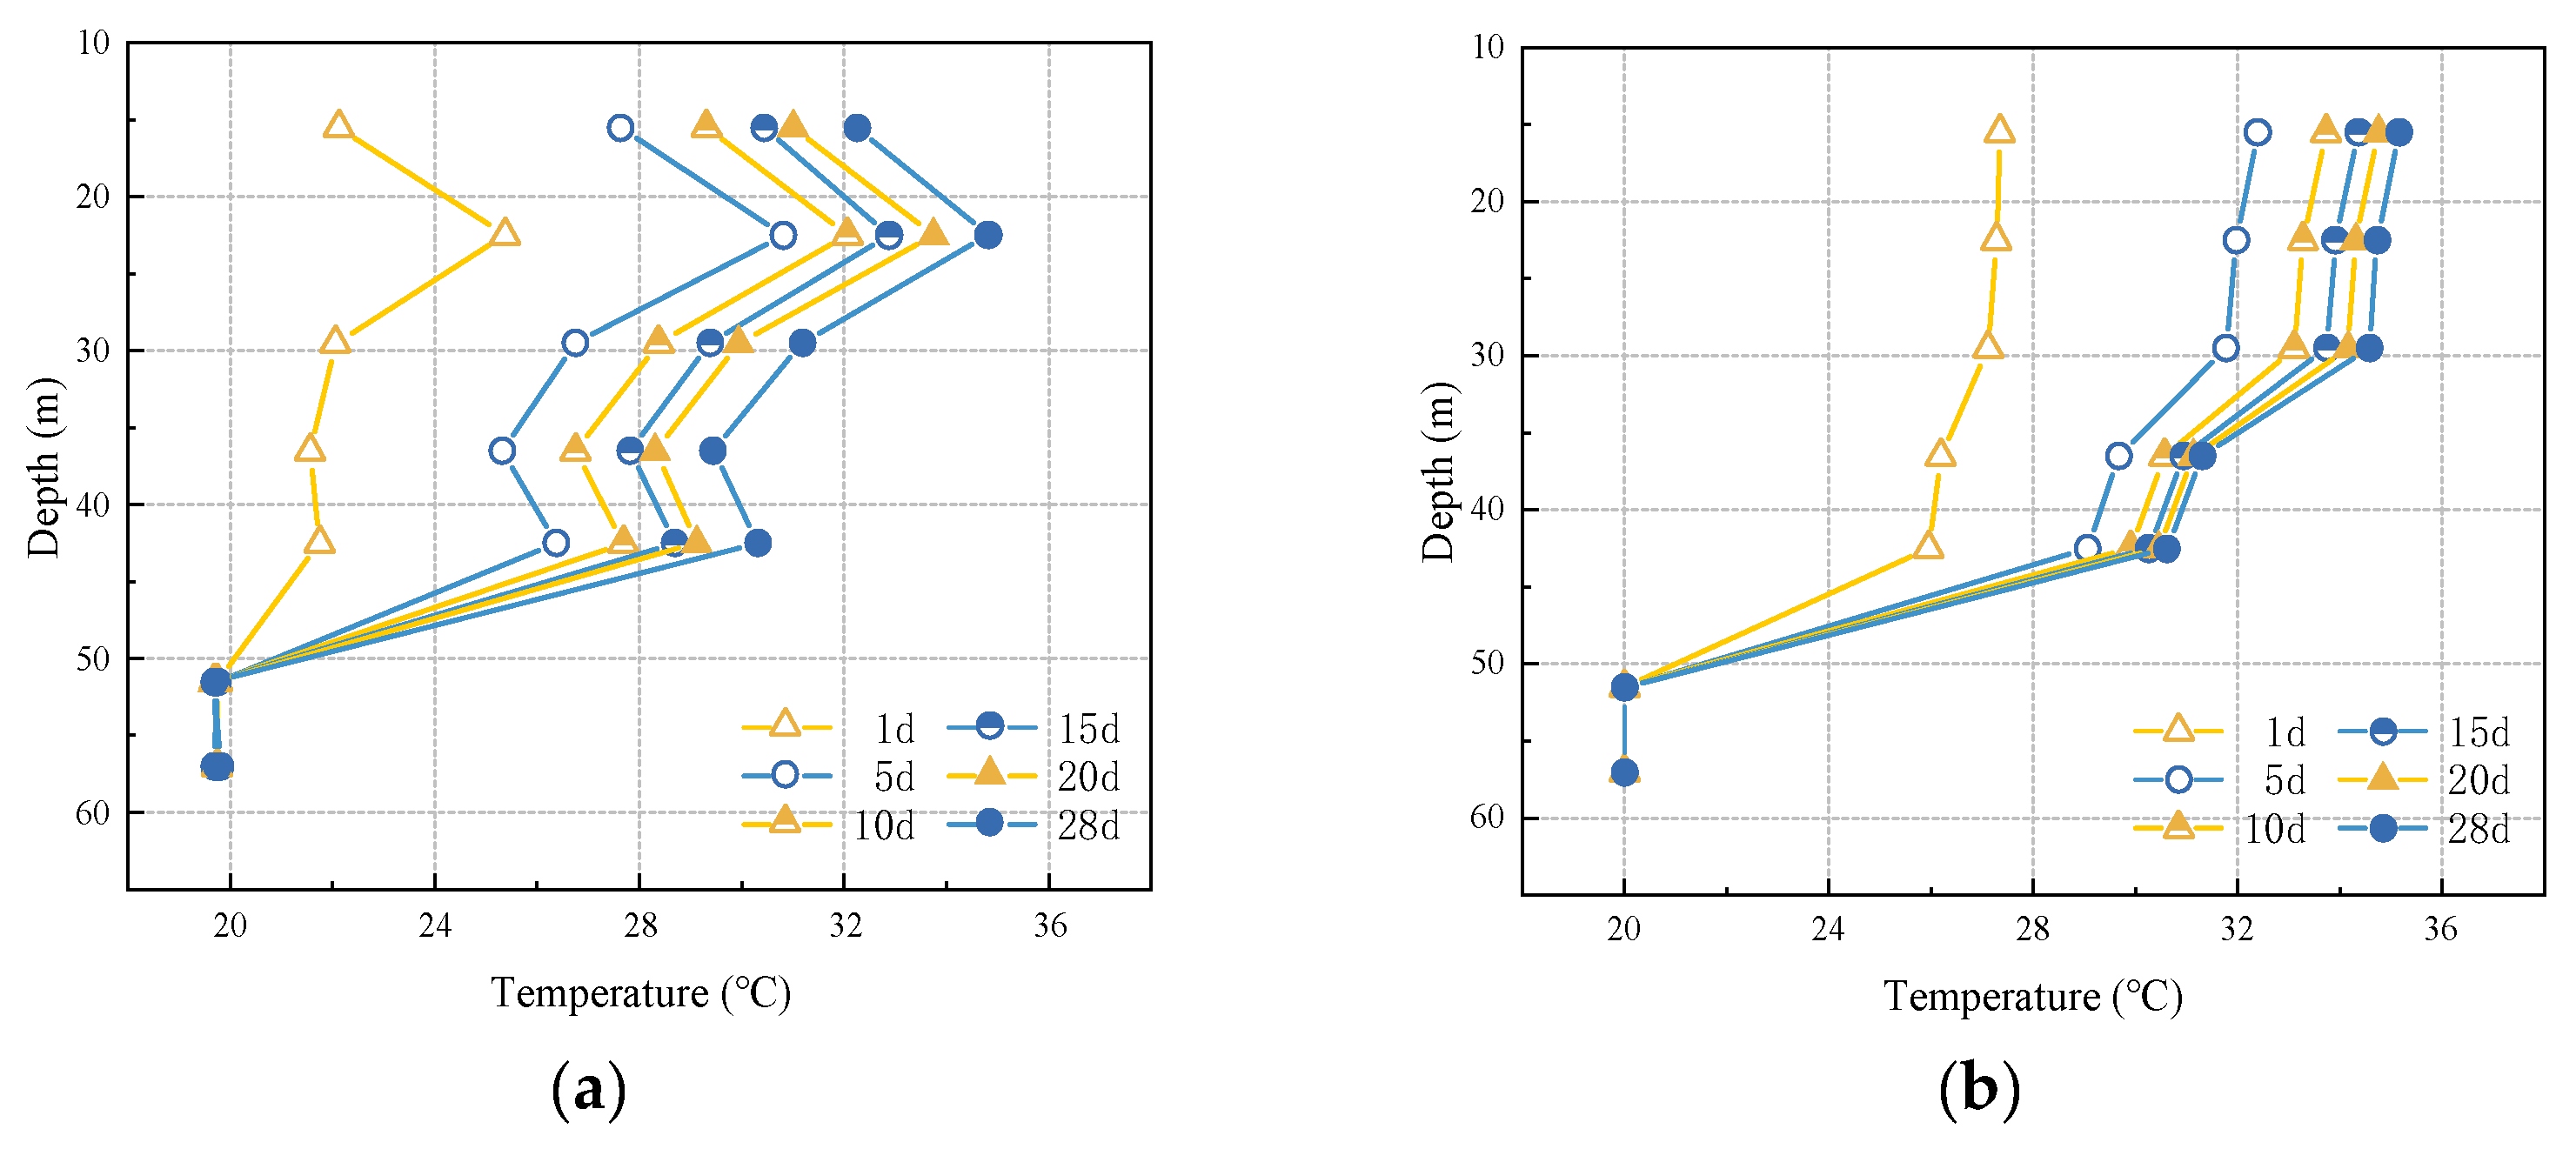
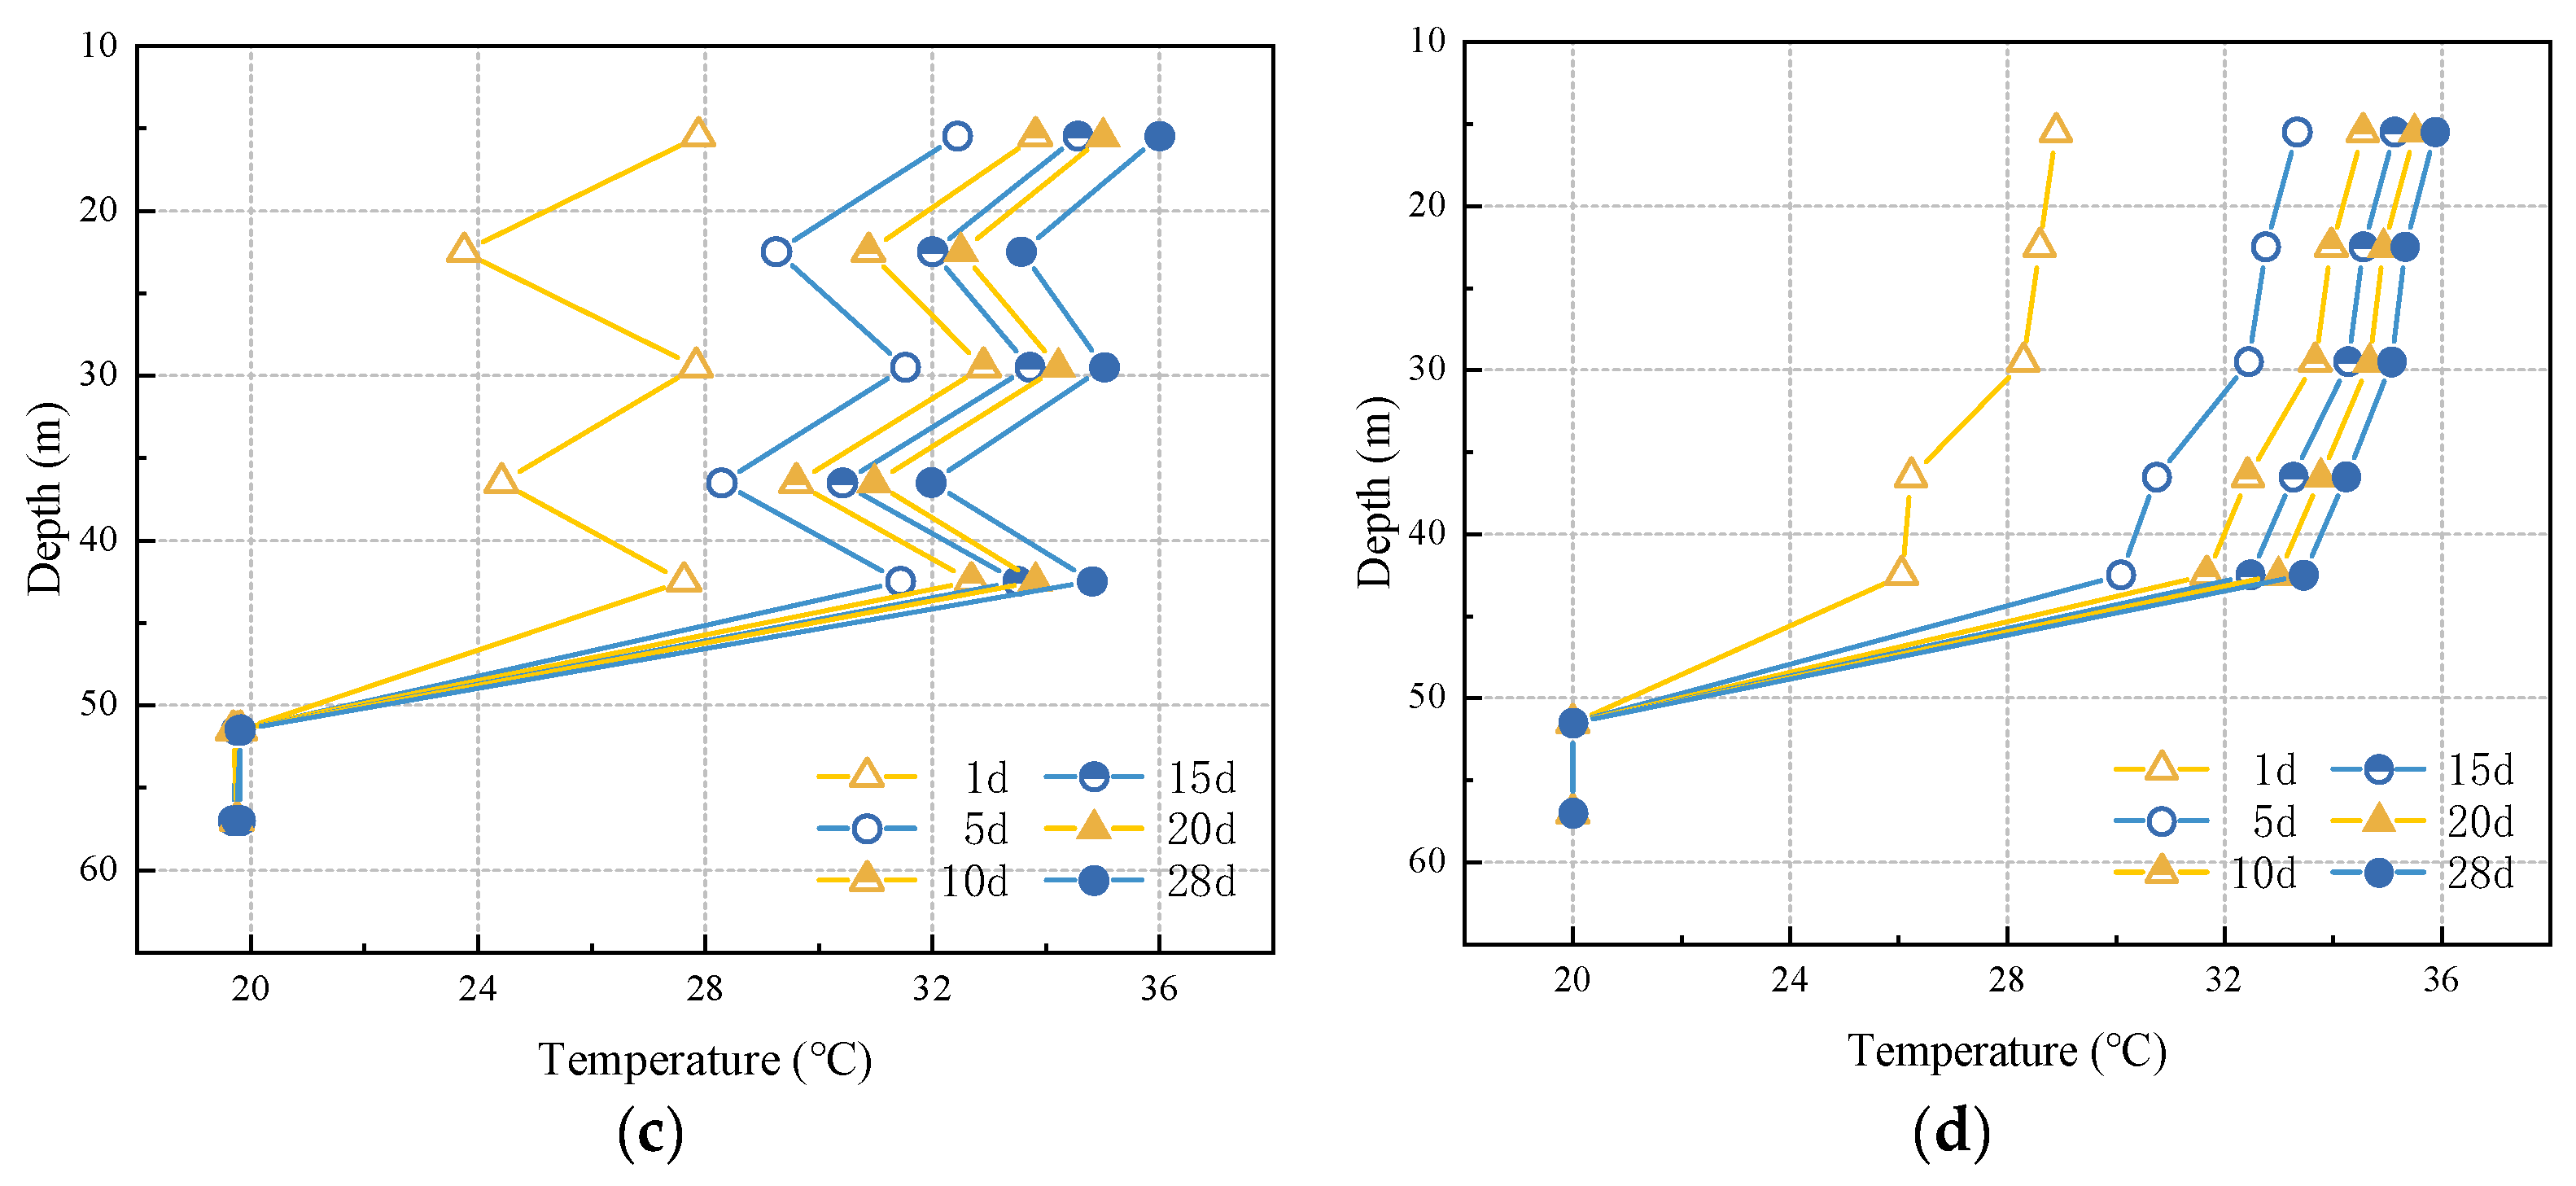
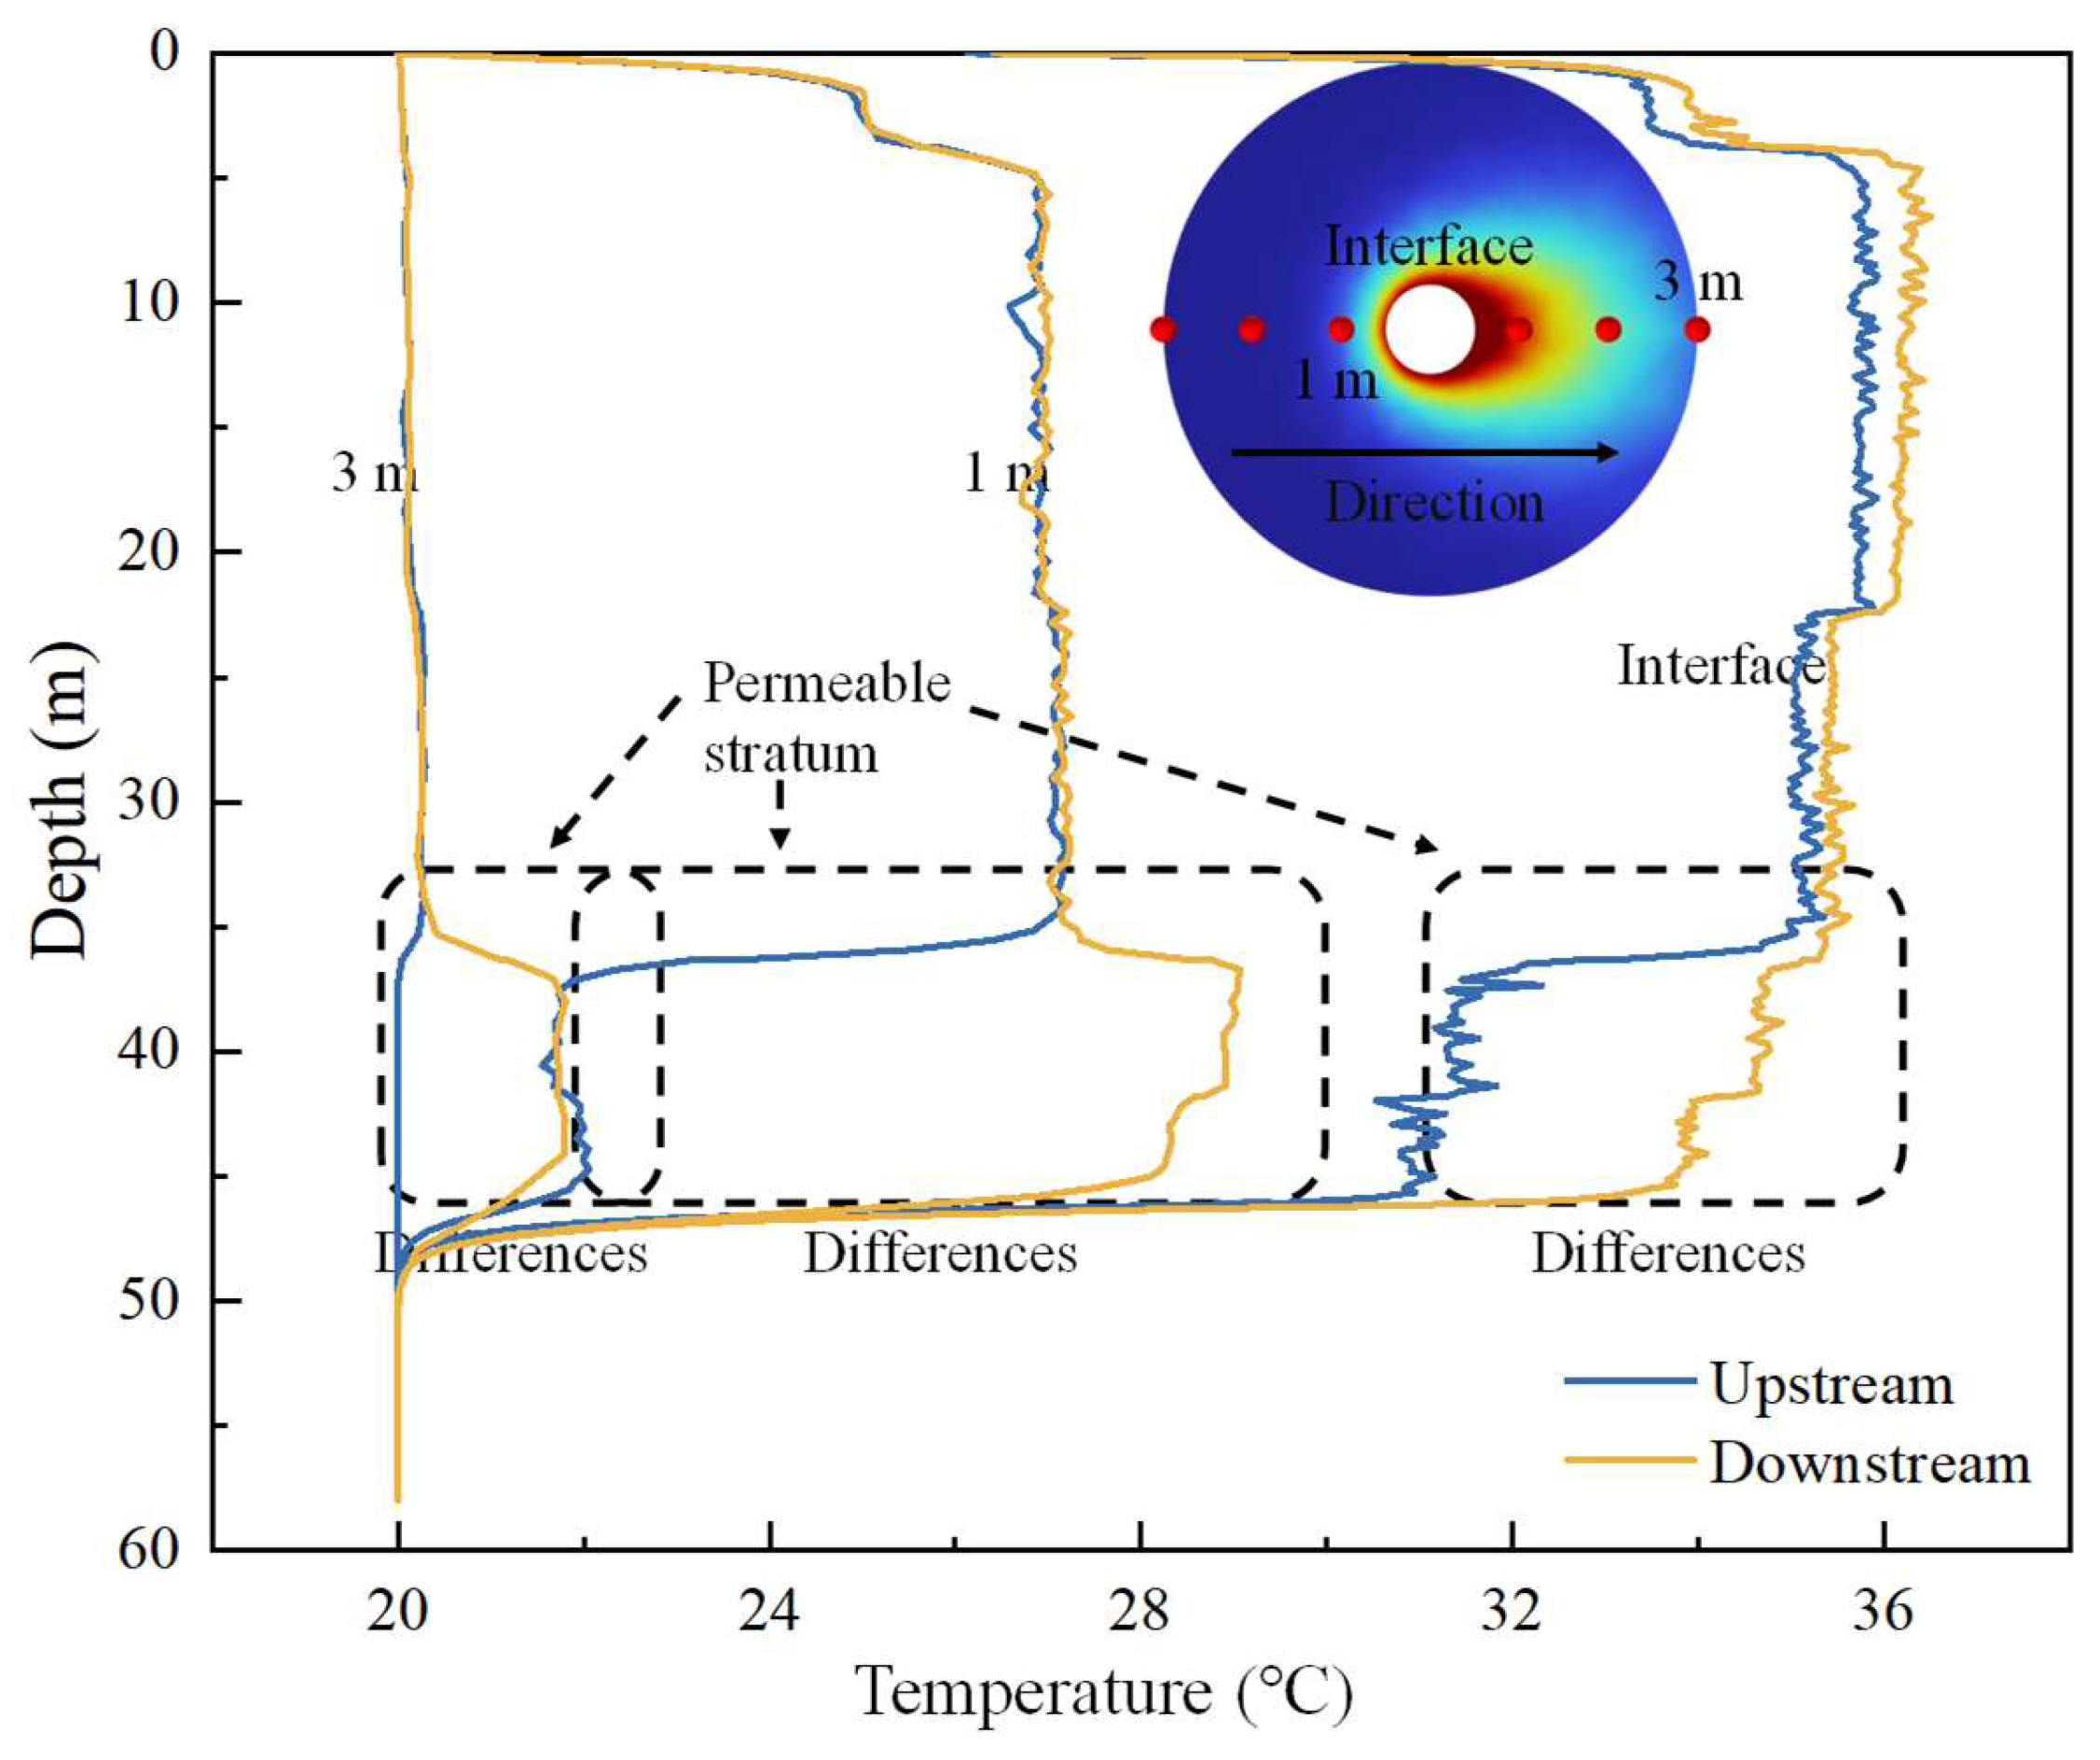
The temperature values at the pile–soil interface increase rapidly and then decrease in segments as the burial depth increases. In addition, the temperature at the junction location of different strata will cause an obvious fault to appear. The fluctuation of temperature along the burial depth at the pile–soil interface is significantly larger than the temperature change along the burial depth inside the soil body.
(3)
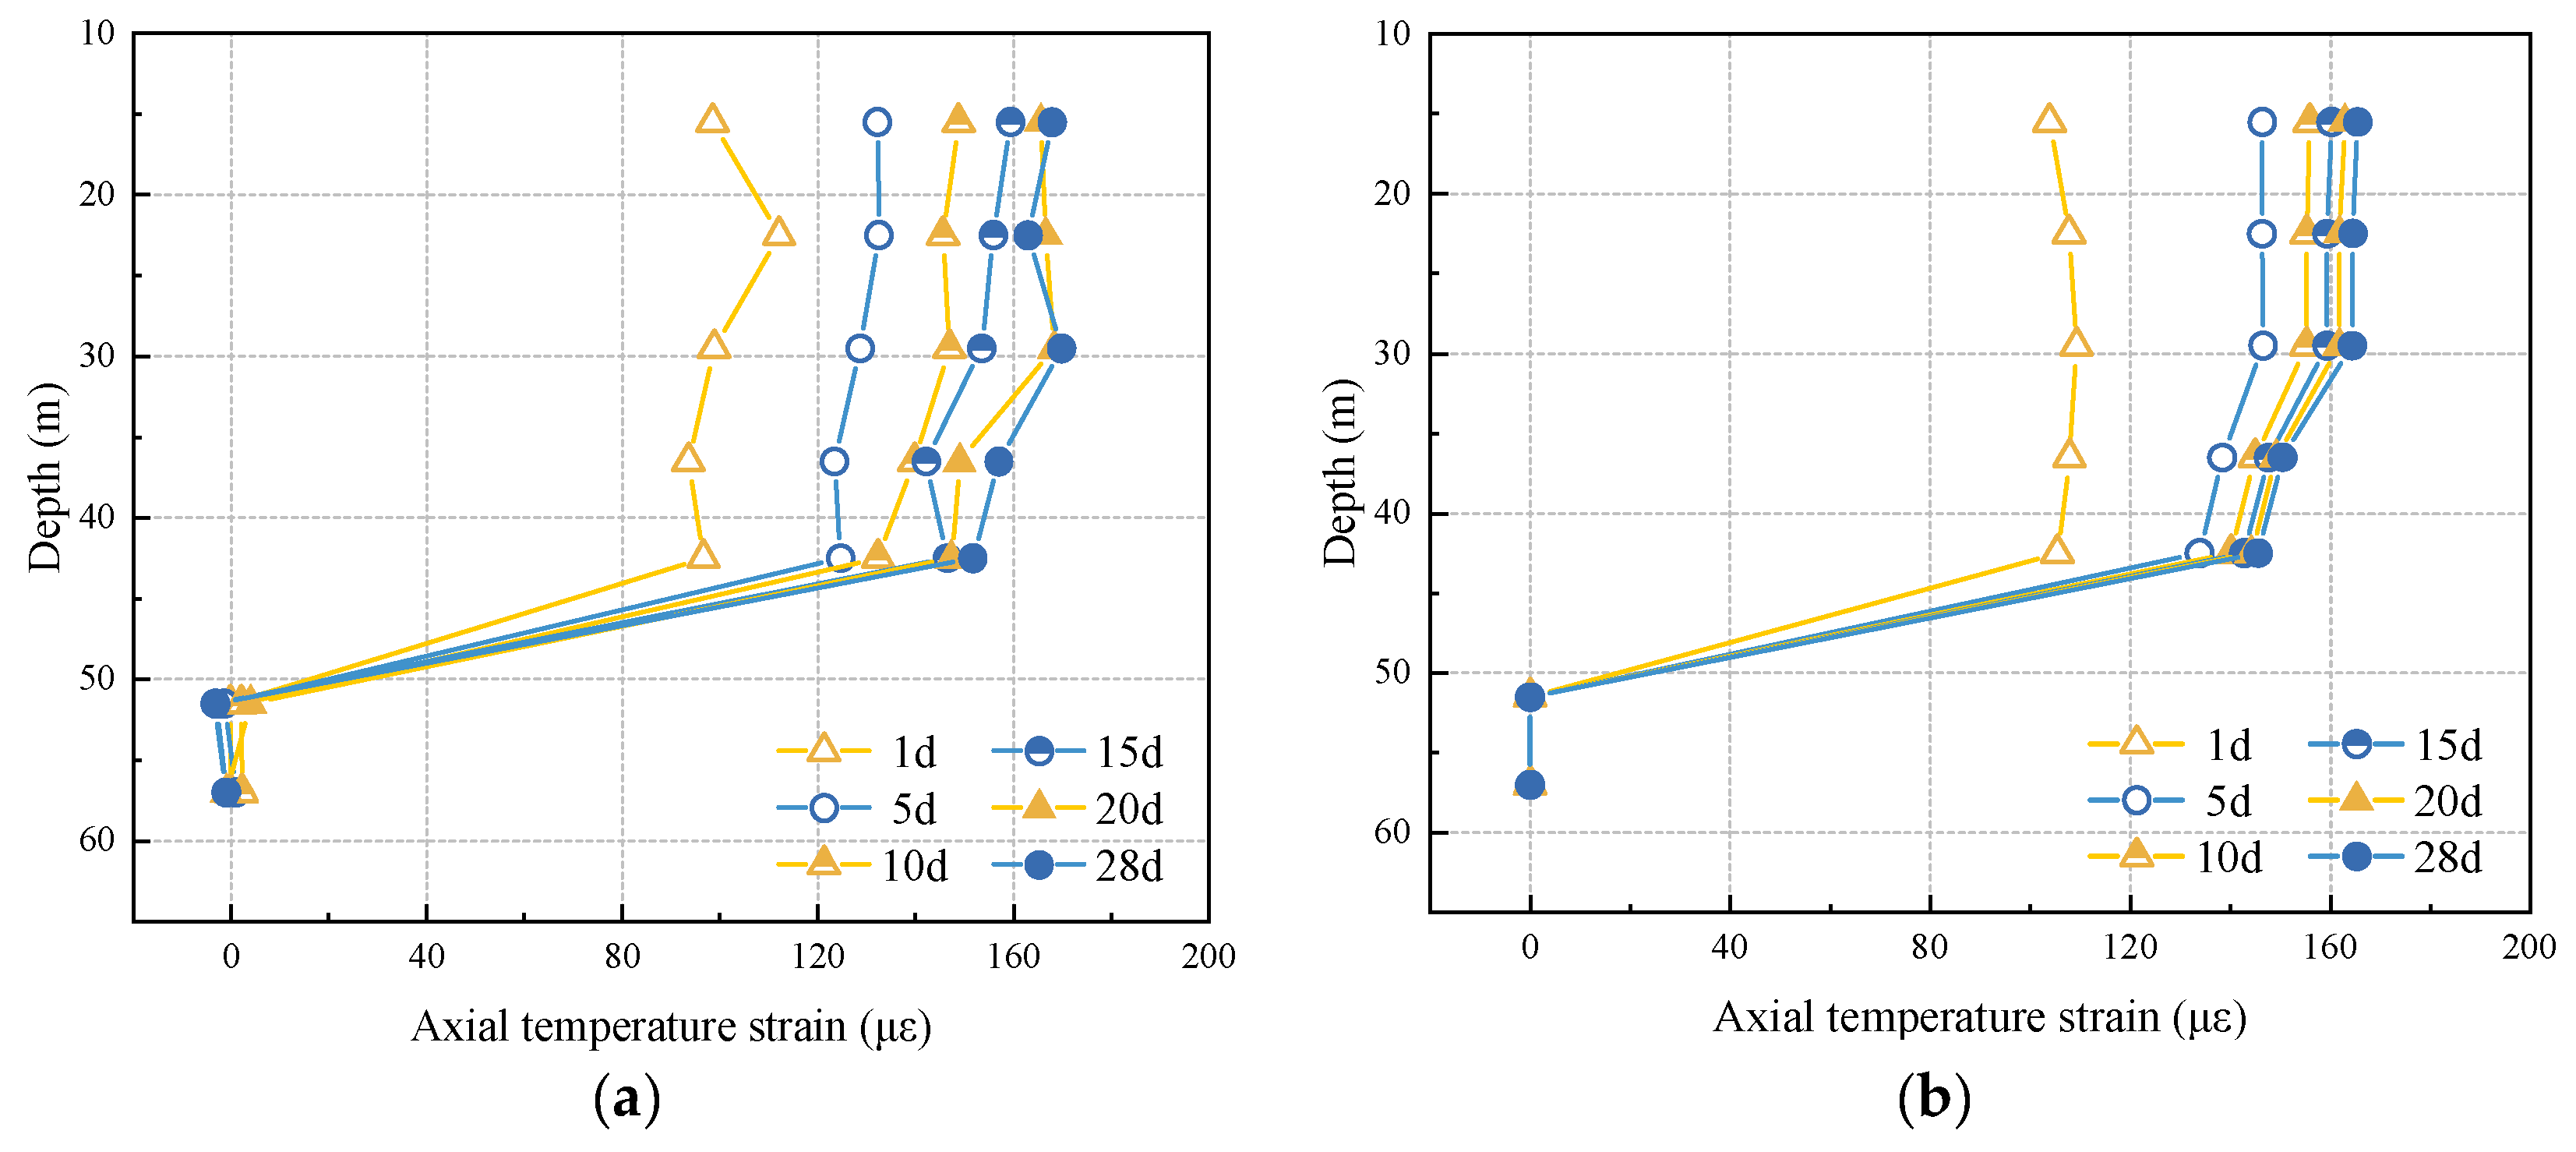
The rate of change of the axial additional temperature strain of the pile body is gradually increases with the increase in burial depth. The temperature stress induced by different strata is not the same, and the magnitude of temperature stress is not only related to the deformation modulus of the surrounding rocks, but also related to the axial constraint, which mainly comes from the constraints of the superstructure at the end of the pile and the holding layer at the bottom of the pile.
(4)
According to the mechanical characteristics of energy piles, this paper proposes a segmented softening function, which can consider the unloading process of energy piles in the upper part of the pile in the heat dissipation process and in the lower part of the pile in the heat extraction process; simulate the relationship between the contact surface shear stress and shear displacement in different conditions; and calculate the softening characteristics of the contact surface in a relatively accurate and quantitative manner.

Author Contributions

Conceptualization, H.W. and P.Z.; methodology, P.Z.; validation, X.L.; formal analysis, X.W.; writing—original draft preparation, H.W.; writing—review and editing, X.B. All authors have read and agreed to the published version of the manuscript.

Funding

Supported by the Science and Technology Project of Xuzhou, China (KC22036); the Yunlong Lake Laboratory of Deep Underground Science and Engineering Project (104023004); the National Natural Science Foundation of China (42202299); the double innovation talent plan of Jiangsu, China (JSSCBS20221533); the Key R&D Program of Jiangsu, China (BE2022156); and the Project of Henan Provincial Bureau of Geology and Mineral Exploration and Development ([2022]1).

Institutional Review Board Statement

Not applicable.

Informed Consent Statement

Not applicable.

Data Availability Statement

The original contributions presented in the study are included in the article, further inquiries can be directed to the corresponding authors.

Conflicts of Interest

The authors declare no conflicts of interest.

References

  1. Loveridge, F.A.; McCartney, J.S.; Narsilio, G.A.; Sánchez, M. Energy geostructures: A review of analysis approaches, in situ testing and model scale experiments. Geomech. Energy Environ. 2020, 22, 100173. [Google Scholar] [CrossRef]
  2. Mohamad, Z.; Fardoun, F.; Meftah, F. A review on energy piles design, evaluation, and optimization. J. Clean. Prod. 2021, 292, 125802. [Google Scholar] [CrossRef]
  3. Gao, J.; Zhang, X.; Liu, J.; Li, K.; Yang, J. Numerical and experimental assessment of thermal performance of vertical energy piles: An application. Appl. Energy 2008, 85, 901–910. [Google Scholar] [CrossRef]
  4. Liu, H.; Song, E.; Ling, H.I. Constitutive modeling of soil-structure interface through the concept of critical state soil mechanics. Mech. Res. Commun. 2006, 33, 515–531. [Google Scholar] [CrossRef]
  5. Feligha, M.; Hammoud, F.; Belachia, M.; Nouaouria, M.S. Experimental Investigation of Frictional Behavior Between Cohesive Soils and Solid Materials Using Direct Shear Apparatus. Geotech. Geol. Eng. 2016, 34, 567–578. [Google Scholar] [CrossRef]
  6. Pincus, H.J.; Tabucanon, J.; Airey, D.W.; Poulos, H.G. Pile Skin Friction in Sands from Constant Normal Stiffness Tests. Geotech. Test. J. 1995, 18, 350–364. [Google Scholar] [CrossRef]
  7. Bian, X.; Gao, Z.; Zhao, P.; Li, X. Quantitative analysis of low carbon effect of urban underground space in Xinjiekou district of Nanjing city, China. Tunn. Undergr. Space Technol. 2024, 143, 105502. [Google Scholar] [CrossRef]
  8. Conte, E.; Pugliese, L.; Troncone, A.; Vena, M. A Simple Approach for Evaluating the Bearing Capacity of Piles Subjected to Inclined Loads. Int. J. Geomech. 2021, 21, 04021224. [Google Scholar] [CrossRef]
  9. Hamidou, H.; Koichi, I.; Satoru, O. End bearing capacity of a single incompletely end-supported pile based on the rigid plastic finite element method with non-linear strength property against confining stress. Soils Found. 2022, 62, 101182. [Google Scholar] [CrossRef]
  10. Laloui, L.; Nuth, M.; Vulliet, L. Experimental and Numerical Investigations of the Behavior of a Heat Exchanger Pile. In Ground Improvement Case Histories; Indraratna, B., Chu, J., Eds.; Butterworth-Heinemann: Oxford, UK, 2015; pp. 515–535. [Google Scholar] [CrossRef]
  11. Yazdani, S.; Helwany, S.; Olgun, C.G. Influence of temperature on soil–pile interface shear strength. Geomech. Energy Environ. 2019, 18, 69–78. [Google Scholar] [CrossRef]
  12. Xiao, S.; Suleiman, M.T.; Al-Khawaja, M. Investigation of effects of temperature cycles on soil-concrete interface behavior using direct shear tests. Soils Found. 2019, 59, 1213–1227. [Google Scholar] [CrossRef]
  13. Yin, K.; Vasilescu, R. Effect of thermal cycles on volumetric and shear behavior of sand-concrete interface. Geomech. Energy Environ. 2023, 36, 100503. [Google Scholar] [CrossRef]
  14. Suryatriyastuti, M.E.; Mroueh, H.; Burlon, S. A load transfer approach for studying the cyclic behavior of thermo-active piles. Comput. Geotech. 2014, 55, 378–391. [Google Scholar] [CrossRef]
  15. Pasten, C.; Carlos Santamarina, J. Thermally Induced Long-Term Displacement of Thermoactive Piles. J. Geotech. Geoenviron. Eng. 2014, 140, 06014003. [Google Scholar] [CrossRef]
  16. Troncone, A.; Pugliese, L.; Parise, A.; Conte, E. A simple method to reduce mesh dependency in modelling landslides involving brittle soils. Géotechnique Lett. 2022, 12, 167–173. [Google Scholar] [CrossRef]
  17. Baek, J.; Schlinkman, R.; Beckwith, F. A deformation-dependent coupled Lagrangian/semi-Lagrangian meshfree hydromechanical formulation for landslide modeling. Adv. Model. Simul. Eng. Sci. 2022, 9, 20. [Google Scholar] [CrossRef]
  18. Loria, A.F.; Vadrot, A.; Laloui, L. Effect of non-linear soil deformation on the interaction among energy piles. Comput. Geotech. 2017, 86, 9–20. [Google Scholar] [CrossRef]
  19. Loria, A.F.; Laloui, L. Displacement interaction among energy piles bearing on stiff soil strata. Comput. Geotech. 2017, 90, 144–154. [Google Scholar] [CrossRef]
  20. Nghiem, H.M.; Chang, N.Y. Pile under torque in nonlinear soils and soil-pile interfaces. Soils Found. 2019, 59, 1845–1859. [Google Scholar] [CrossRef]
  21. Knellwolf, C.; Péron, H.; Laloui, L. Geotechnical Analysis of Heat Exchanger Piles. J. Geotech. Geoenviron. Eng. 2011, 137, 890–902. [Google Scholar] [CrossRef]
  22. Yavari, N.; Tang, A.M.; Pereira, J.; Hassen, G. Effect of temperature on the shear strength of soils and the soil–structure interface. Can. Geotech. J. 2016, 53, 1186–1194. [Google Scholar] [CrossRef]
  23. Jie, L.; Ken-neng, Z. Analysis of pile load-transfer under pile-side softening. J. Cent. South Univ. Technol. 2003, 10, 231–236. [Google Scholar] [CrossRef]
  24. Zhao, M.; Yang, M.; Zou, X. Vertical bearing capacity of pile based on load transfer model. J. Cent. South Univ. Technol. 2005, 12, 488–493. [Google Scholar] [CrossRef]
  25. Xia, Z.; Zou, J. Simplified Approach for Settlement Analysis of Vertically Loaded Pile. J. Eng. Mech. 2017, 143, 04017124. [Google Scholar] [CrossRef]
  26. Ni, P.; Song, L.; Mei, G.; Zhao, Y. Generalized Nonlinear Softening Load-Transfer Model for Axially Loaded Piles. Int. J. Geomech. 2017, 17, 04017019. [Google Scholar] [CrossRef]
  27. Donna, A.D.; Ferrari, A.; Laloui, L. Experimental investigations of the soil-concrete interface: Physical mechanisms, cyclic mobilisation and behaviour at different temperatures. Can. Geotech. J. 2016, 53, 659–672. [Google Scholar] [CrossRef]
  28. Jiang, J.; Chen, Q.; Ou, X.; Chen, H.; Chen, C. Analysis of thermal response of energy piles considering softening of pile-side soil. Chin. J. Rock Mech. Eng. 2023, 42, 2295–2305. [Google Scholar]
  29. Ghionna, V.N.; Mortara, G. An elastoplastic model for sand–structure interface behaviour. Geotechnique 2002, 52, 41–50. [Google Scholar] [CrossRef]
  30. Donna, A.D. Thermo-Mechanical Aspects of Energy Piles; EPFL: Lausanne, Switzerland, 2014. [Google Scholar] [CrossRef]
Figure 1. Energy pile heat exchange system.
Applsci 14 01072 g001
Figure 2. Common heat exchanger tube arrangements for energy piles.
Applsci 14 01072 g002
Figure 3. Energy pile geometry model, meshing and boundary condition.
Applsci 14 01072 g003
Figure 4. Sensor field mounting location and test devices.
Applsci 14 01072 g004
Figure 5. Heat exchanger supply and return temperature.
Applsci 14 01072 g005
Figure 6. Temperature at different buried depths. (a) In situ test of seepage upstream. (b) Numerical simulation of seepage upstream. (c) In situ test of seepage downstream. (d) Numerical simulation of seepage downstream.
Applsci 14 01072 g006aApplsci 14 01072 g006b
Figure 7. Additional temperature strain in pile. (a) In situ test of upstream seepage. (b) Simulation of upstream seepage. (c) In situ test of downstream seepage. (d) Simulation of downstream seepage.
Applsci 14 01072 g007aApplsci 14 01072 g007b
Figure 8. Temperature additional pressure on pile side.
Applsci 14 01072 g008
Figure 9. Temperature at measurement point. (a) 1 m. (b) 2 m. (c) 3 m.
Applsci 14 01072 g009
Figure 10. Upstream and downstream temperature in pile.
Applsci 14 01072 g010
Figure 11. Horizontal section of axial additional temperature strain.
Applsci 14 01072 g011
Figure 12. Cloud diagram of axial additional temperature strain distribution.
Applsci 14 01072 g012
Figure 13. Axial additional temperature strain.
Applsci 14 01072 g013
Figure 14. Pile settlement displacement. (a) Upstream seepage. (b) Downstream seepage.
Applsci 14 01072 g014
Figure 15. Softening shear model for pile–soil contact surface.
Applsci 14 01072 g015
Figure 16. Clay–concrete contact surface shear stress–shear displacement.
Applsci 14 01072 g016
Figure 17. Sand–concrete contact surface shear stress–shear displacement.
Applsci 14 01072 g017
Figure 18. Shear displacement–shear stress at sand–aluminum plate contact surface.
Applsci 14 01072 g018
Table 1. Basic characteristics of the test site.
Soil LayerNameThickness (m)Density (kg/m3)Condition
Miscellaneous fill3.81750Loose
Silty soft clay18.71770Flow plasticity
Silty clay13.81790Local flow plasticity
Silty fine sand5.51920Sand
Silty fine sand10.01930Sand
Coarse sand mixed gravel17.21917Gravel
Table 2. Energy pile model thermophysical parameters.
MaterialsDensity (kg/m3)Thermal Conductivity (W/(m∙K))Specific Heat J/(kg∙K)
HDPE11000.421465
Concrete27501.80800
Table 3. Contact surface properties and test conditions.
TypeRnDr (%)σn (kPa)Temperature (°C)
Clay-Concrete30 50, 100, 15020 °C, 50 °C
Sand-Concrete0.12 50, 100, 15020 °C, 60 °C
Sand-Aluminum Plate0.25085100, 200, 300Indoor temperature
0.1253550, 150, 300Indoor temperature
Disclaimer/Publisher’s Note: The statements, opinions and data contained in all publications are solely those of the individual author(s) and contributor(s) and not of MDPI and/or the editor(s). MDPI and/or the editor(s) disclaim responsibility for any injury to people or property resulting from any ideas, methods, instructions or products referred to in the content.

