Article

Investigating the Effect of Patient-Related Factors on Computed Tomography Radiation Dose Using Regression and Correlation Analysis

1
Biomedical Engineering Graduate Program, American University of Sharjah, Sharjah P.O. Box 26666, United Arab Emirates
2
Department of Computer Science and Engineering, American University of Sharjah, Sharjah P.O. Box 26666, United Arab Emirates
3
HQ Diagnostic Imaging Department, Dubai Academic Health Corporation, Dubai P.O. Box 4545, United Arab Emirates
4
College of Medicine, Mohammed Bin Rashid University, Dubai P.O. Box 505055, United Arab Emirates
*
Author to whom correspondence should be addressed.
Appl. Sci. 2024, 14(3), 1071; https://doi.org/10.3390/app14031071
Submission received: 31 December 2023 / Revised: 21 January 2024 / Accepted: 22 January 2024 / Published: 26 January 2024

Abstract

:
Computed tomography (CT) is a widely utilized diagnostic imaging modality in medicine. However, the potential risks associated with radiation exposure necessitate investigating CT exams to minimize unnecessary radiation. The objective of this study is to evaluate how patient-related parameters impact the CT dose indices for different CT exams. In this study, a dataset containing CT dose information for a cohort of 333 patients categorized into four CT exams, chest, cardiac angiogram, cardiac calcium score and abdomen/pelvis, was collected and retrospectively analyzed. Regression analysis and Pearson correlation were applied to estimate the relationships between patient-related factors, namely body mass index (BMI), weight and age as input variables, and CT dose indices, namely the volume CT dose index (CTDIvol), dose length product (DLP), patient effective dose (ED) and size-specific dose estimate (SSDE), as output variables. Moreover, the study investigated the correlation between the different CT dose indices. Using linear regression models and Pearson correlation, the study found that all CT dose indices correlate with BMI and weight in all CT exams with varying degrees as opposed to age, which did not demonstrate any significant correlation with any of the CT dose indices across all CT exams. Moreover, it was found that using multiple regression models where multiple input variables are considered resulted in a higher correlation with the output variables than when simple regression was used. Investigating the relationships between the different dose indices, statistically significant relationships were found between all dose indices. A stronger linear relationship was noticed between CTDIvol and DLP compared to the relationships between each pair of the other dose indices. The findings of this study contribute to understanding the relationships between patient-related parameters and CT dose indices, aiding in the development of optimized CT exams that ensure patient safety while maintaining the diagnostic efficacy of CT imaging.

1. Introduction

X-rays, a form of energy similar to radio waves and light waves, have the ability to penetrate bone, tissue and organs unlike light and radio waves [1,2]. This characteristic allows X-rays to be used for medical imaging, including computed tomography (CT). However, the absorbed radiation during a CT scan contributes to the patient’s radiation dose, raising concerns about potential health risks [3,4]. The number of CT scans performed annually in the United States was projected to increase from 75 million to 84 million by 2022 [5], highlighting the need to understand and mitigate radiation-related risks.
Dose indices vary between various X-ray-based imaging modalities such as mammography [6] and CT [7,8]. For instance, the volume CT dose index (CTDIvol) and dose length product (DLP) are two commonly used dose indices in CT [7].
CTDIvol provides information about the dose intensity in a specific slice, while DLP quantity accounts for the scan length coverage by roughly multiplying CTDIvol with the scan length. In contrast, the effective dose (ED) integrates the dose contributions from various exposed organs or tissues, providing a comprehensive measure of radiation impact [9]. ED is used to assess the radiation absorbed by the patient’s body. It is calculated as the sum of the organ-equivalent doses multiplied by the organ-weighting factors proposed by the International Commission on Radiological Protection (ICRP) [10]. ED takes into account the varying sensitivities of different tissues and organs to radiation, recognizing that the absorption during, for instance, an abdomen CT scan differs from that during a head CT scan [11]. Clinical scientists, radiologists and CT technologists consider these indices to optimize CT exams, striking a balance between dose and image quality while minimizing risks [12]. The correlation between CTDIvol, DLP and ED depends on factors such as scan acquisition parameters, patient characteristics and dosimetric models used for calculation [12]. The SSDE index is another dose index that indicates that patient size (i.e., weight) was taken into consideration, unlike the CT dose index of CTDIvol, resulting generally in more accurate dose estimates [13]. For more detail, the reader is referred to the American Association of Physicists in Medicine (AAPM) task group report no. 204 [14]. CTDIvol is affected by patient size and tissue composition; hence, high CTDIvol values are associated with obese patients, body parts made of more dense material like the bone, implemented metal and some types of pathologies [15].
While CT scans carry a potential risk that is associated with increasing cancer incidence, their medical benefits outweigh these risks by aiding in disease diagnosis, guiding procedures and evaluating injuries without invasive techniques [16]. Nonetheless, concerns about public health necessitate understanding the correlation between radiation dose indices and patient dose to develop strategies for dose optimization [17]. This study aims to investigate the impact of patient-related parameters, namely body mass index (BMI), weight and age as input variables, and reported CT dose indices, namely CTDIvol, DLP, ED and SSDE as output variables, while considering different CT exams. Regression and correlation are suitable methods to achieve the aim of this study. Moreover, regression and correlation analysis are utilized in this work in accordance with similar studies found in the literature that investigated the relationship between patient-related parameters and different dose indices.

2. Materials and Methods

In this section, the study design is introduced in Section 2.1. A detailed description of the dataset is provided in Section 2.2. Section 2.3 discusses the regression analysis approach used in this work and the evaluation metrics.

2.1. Study Design

This study was performed retrospectively using CT data acquired from the University Hospital Sharjah, UAE, investigating the use of CT and the factors affecting radiation dose. This study was approved by the Ethics and Research Committee of the University Hospital Sharjah on 19 June 2017 (Ref. UHS-HERC-030-07062017). From all of the CT exams collected, the radiology team specified the images by the exam type and the patient gender. Each CT exam contains a set of information regarding the CT modality technical parameters, patient-related parameters and dose estimation parameters. From all of them, we were interested in extracting the parameters of CTDIvol, DLP, ED, SSDE, BMI, weight and age. These parameters comprise the dataset used. Patients with missing data or outliers were excluded, which is a necessary step to make future results more reliable and robust. After that, Pearson correlation and linear regression were implemented to investigate the relationships between patient-related parameters and the different CT dose indices, aiming to answer the following research questions:
Q1. How much does each patient-related parameter impact each of the dose indices?
Q2. How do the relationships found in Q1 differ for different CT exams?

2.2. Dataset Description

The dataset consists of a total of 333 CT scans acquired from patients subjected to CT chest, CT cardiac angiogram, CT cardiac calcium score and CT abdomen/pelvis between June 2017 and April 2019. Seven pediatric cases were observed in the dataset and were excluded, leaving us with 326 CT scans available for analysis. The dataset was divided into 4 groups based on the performed CT exam, with 68 of them in the group of chest, 91 in the cardiac angiogram group, 94 in the cardiac calcium score group and the last 73 in the abdomen/pelvis group. In the present study, we considered the CT exams that could benefit from CT protocol optimization. Chest, abdomen and pelvis body part composition and thickness considerably vary across patient cohorts, which calls for kV and mAs modulation, i.e., CT protocol amendments. Table 1 lists the four groups of CT exams and provides patient-related information such as the patients’ genders and their average (and range) age, weight and BMI.

2.3. Regression Analysis

The data in this study were analyzed using simple and multiple linear regression models. Regression analysis models the relationship between one output (dependent) variable and one or more input (independent) variable(s). Thus, linear regression is a technique that finds a line that best fits a dataset [18]. Simple linear regression model has one input feature as in (1):
y ^ = a + b 1 X 1
where y ^ is the predicted output variable, X 1 is the input variable, a is a scaler and b 1 is the slope of the line. Multiple linear regression model has multiple input variables X 1 X m as in (2):
y ^ = a + b 1 X 1 + b 2 X 2 + + b m X m
In this study, linear regression analysis was performed between each patient-related parameter (BMI, weight and age) as input variables and each CT dose measure (CTDIvol, DLP, ED and SSDE as output variables) for each of the four CT exams. In addition, multiple linear regression analysis was performed on all input variables X i altogether with each output variable separately.
In the evaluation process, several evaluation metrics are used to evaluate the resulting regression models, namely the coefficient of determination ( R 2 ), mean square error (MSE), mean absolute error (MAE) and mean absolute percentage error (MAPE). These metrics give an intuition of how much the line of a model fits the data [19]. Moreover, the Pearson correlation coefficient ( r ) and the two-tailed p-value are calculated to assess the strength of the correlation between the input and output variables. The metrics R 2 , R M S E , M A E , M A P E and r are calculated as in the following Formulas (3)–(7) [19]:
R 2 = 1 i = 1 n y i y ^ i 2 i = 1 n y i y ¯ 2 ,
R M S E = i = 1 n y i y ^ i 2 n ,
M A E = i = 1 n y i y ^ i n ,
M A P E = i = 1 n y i y ^ i y i n ,
where y i is the true value of the output variable, y ^ i is the predicted value of the output variable, y ¯ is the mean of y i values and n is the number of data points.
r = i = 1 n x i x ¯ y i y ¯ i = 1 n x i x ¯ 2 · i = 1 n y i y ¯ 2
where x i is the input variable sample and x ¯ is the mean of x i values.

3. Experimental Results

This study investigates the relationship between patient-related parameters (BMI, weight and age) and CT dose indices CTDIvol, DLP, ED and SSDE using regression and correlation analysis. Table 2 displays the mean values and ranges within two standard deviations of each of CTDIvol, DLP, ED and SSDE for each CT exam considered in the study. The table also provides the number of statistical outlier cases, defined as cases outside two standard deviations, with a maximum of seven outliers for each of the CT exams. The variation in mean dose indices is primarily influenced by the CT exam parameters and the relatively small size of the dataset.
In this study, linear regression and Pearson correlation analysis were utilized to analyze the relationship between BMI, weight and age (as input variables) and each of CTDIvol, DLP, ED and SSDE (as output variables). Additionally, multiple linear regression and correlation analysis models were employed to examine the relationship between all patient parameters as input variables and each of the dose indices. The evaluation results for each of the dose indices CTDIvol, DLP, ED and SSDE are summarized in Section 3.1, Section 3.2, Section 3.3 and Section 3.4, respectively. Section 3.5 presents the plots for the linear regression models generated. Section 3.6 includes the regression and correlation analysis evaluation for each pair of the dose indices.
It is worth mentioning that polynomial regression models were investigated. However, it was found that the linear regression models outperformed the polynomial models. Therefore, the results from the polynomial regression analysis were not included in this study.

3.1. Computed Tomography Dose Index Volume (CTDIvol) Correlations

The dataset includes CTDIvol values ranging from 1.1 mGy to 60.2 mGy. As shown in Table 3, linear and multiple linear regression and the Pearson correlation analysis were performed to analyze the relationship between CTDIvol and the patient parameters BMI, weight and age after removing a maximum of seven outliers.
A significant correlation was seen between patient weight, BMI and CTDIvol across all investigated CT exams. As can be seen in Table 3, there was a significant (p < 0.05) strong linear relationship between CTDIvol and BMI and weight, especially in the cardiac angiogram and cardiac calcium score exams, as indicated by the r and p-value. Age did not demonstrate any linear relationship with CTDIvol across all CT exams.
Using multiple regression resulted in a higher correlation with the output variables than when using simple regression in chest and abdomen/pelvis CT exams. This increase was evident when comparing the R2, MAPE and r values of the multiple linear regression models with their values in the best respective simple linear regression models. The multiple linear regression models in cardiac angiogram and cardiac calcium score exams exhibited correlation values similar to those of the best respective simple linear regression models.

3.2. Dose Length Product (DLP) Correlations

The dataset includes DLP values ranging from 16 mGy.cm to 2498 mGy.cm. As shown in Table 4, linear and multiple linear regression models were used to examine the relationship between DLP as an output variable and BMI, weight and age as input variables after excluding up to five outliers.
As can be seen in Table 4, among the CT exams, the cardiac calcium score exam exhibited a significant (p-value < 0.05) strong linear relationship between DLP and BMI. The cardiac angiogram exam showed a significant moderate linear relationship between DLP and BMI, while the other exams showed poor correlations. The patient’s weight seems to have a significant (p-value < 0.05) relationship with DLP in all CT exams, especially in the cardiac calcium score exam. Similarly, as observed before, the patient’s age did not display any linear relationship with DLP across all four CT exams.
Using multiple regression resulted in a higher correlation with the output variables than when using simple regression in the abdomen/pelvis exam. This enhancement was evident when comparing the R2, MAPE and r values of the multiple linear regression models with the highest values among the respective simple linear regression models. The multiple linear regression models in the rest of the CT exams showed correlation values similar to those of the best respective simple linear regression models.

3.3. Effective Dose (ED) Correlations

The dataset includes ED values ranging from 0.8 mSv to 24.7 mSv. As shown in Table 5, linear and multiple linear regression models were used to investigate the relationship between ED as an output variable and BMI, weight and age as input variables after excluding up to three outliers.
In terms of BMI, ED exhibited a positive linear relationship across the given exams as indicated by the evaluation metrics (p-value less than 0.05). The relationship between ED and weight mirrored that of BMI. As observed earlier, age did not show any linear relationship with ED in any of the given exams.
Using multiple regression models resulted in a higher correlation with the output variables than when using simple regression in both CT exams. This increase was demonstrated by comparing the R2, MAPE and r values of the multiple linear regression models with those of the respective best simple linear regression models.

3.4. Size-Specific Dose Estimate (SSDE) Correlations

In this section, linear and multiple linear regression is performed to investigate the relationship between SSDE as an output variable and BMI, weight and age as input variables. Table 6 shows the results of the regression and correlation analysis.
As can be seen in Table 6, for both BMI and weight, SSDE exhibited a positive linear relationship across the given exams as indicated by the evaluation metrics (the p-value < 0.05). As observed with the other dose indices, age did not show any linear relationship with SSDE in any of the given exams.
Using multiple regression models resulted in a higher correlation with the output variables than when using simple regression in both CT exams. This increase is noticed in the resulting R2, MAPE and r values of the multiple linear regression models compared to those of the respective best simple linear regression models.

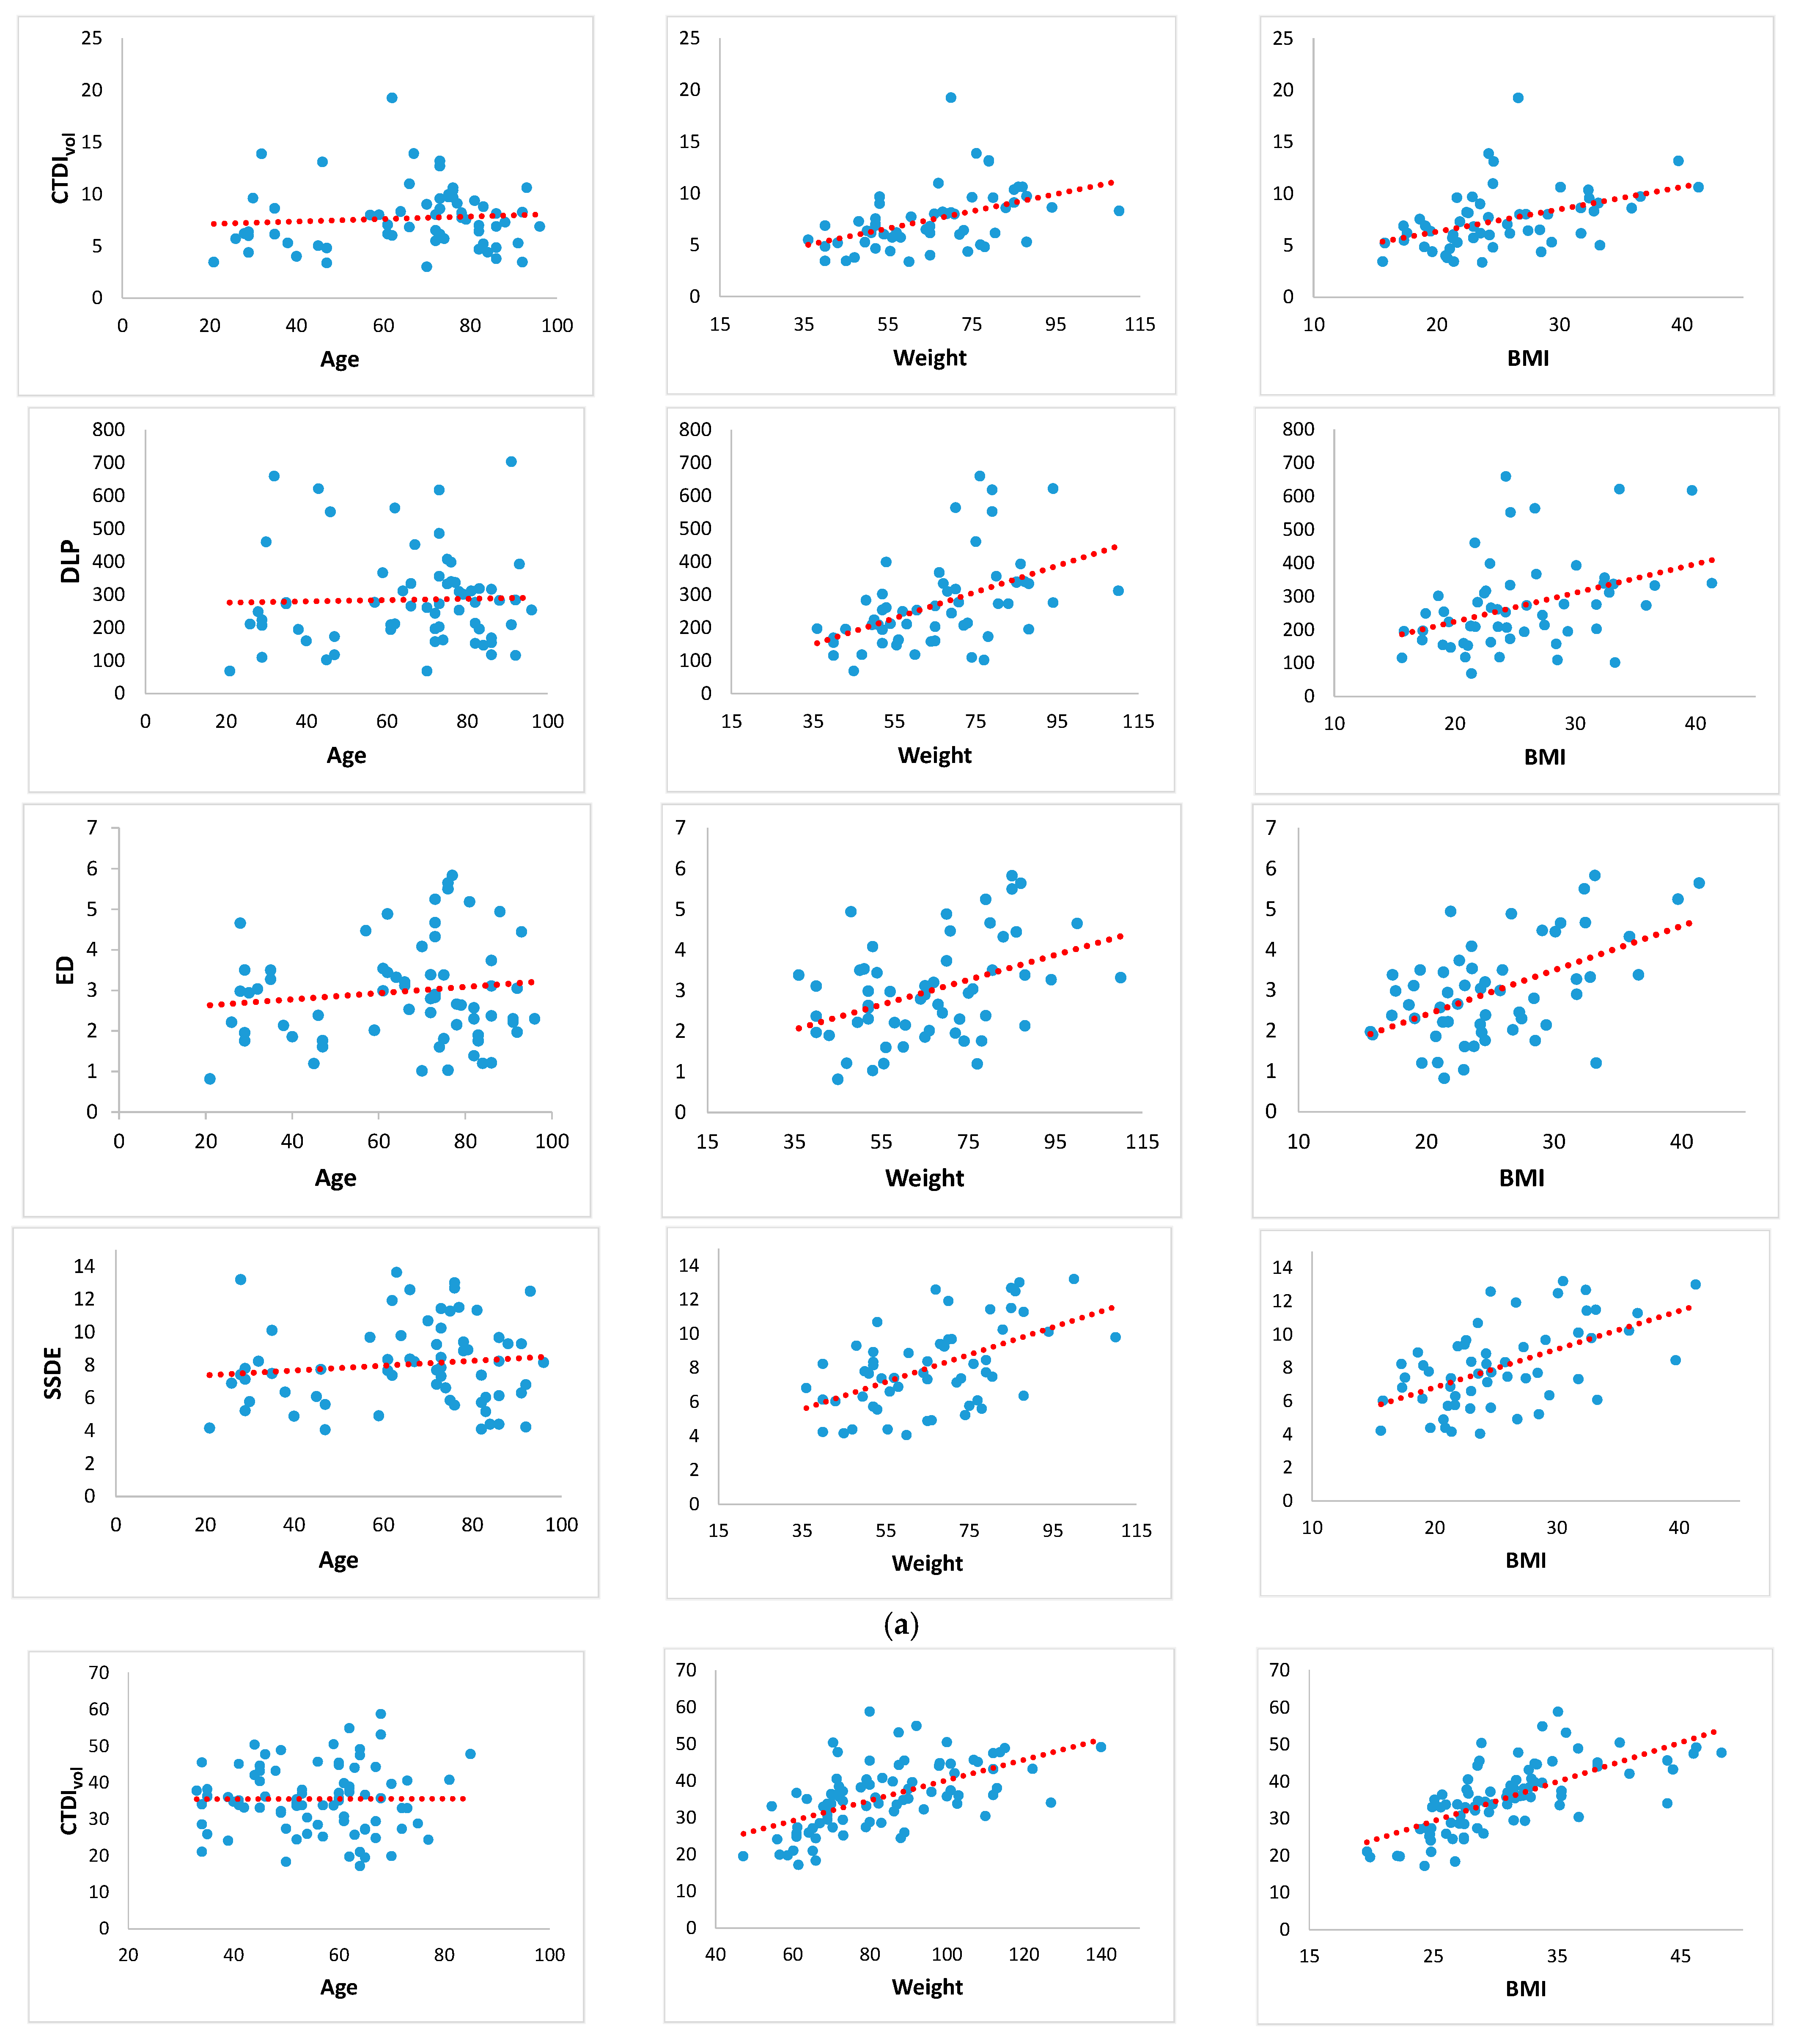
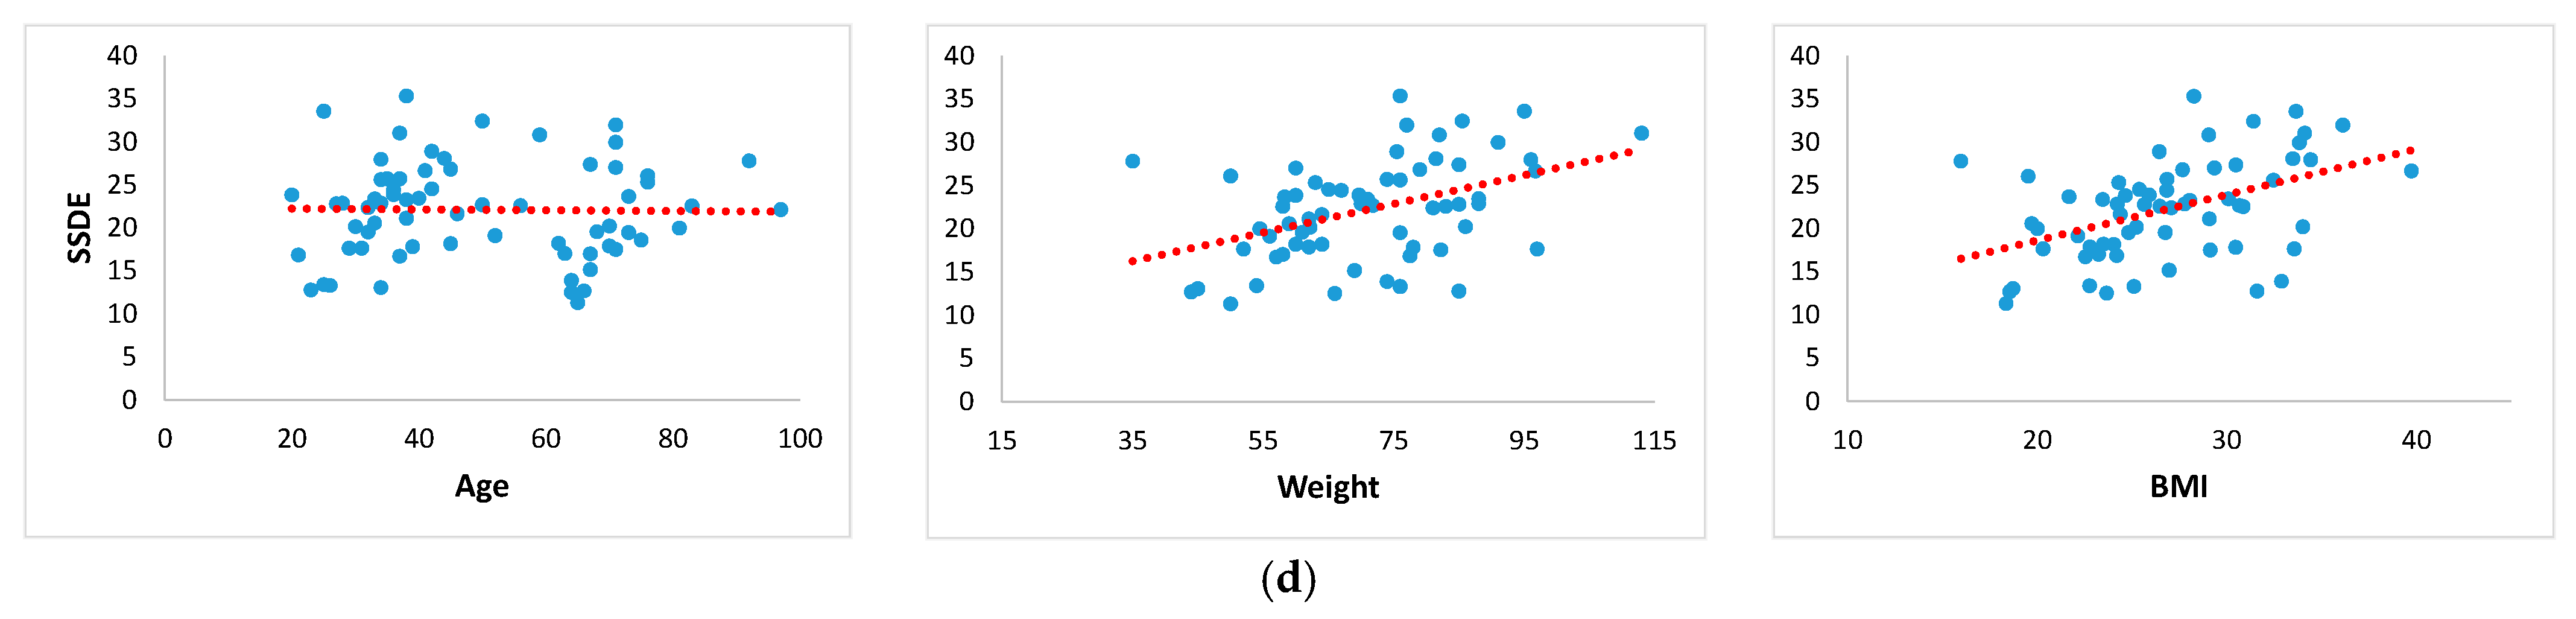
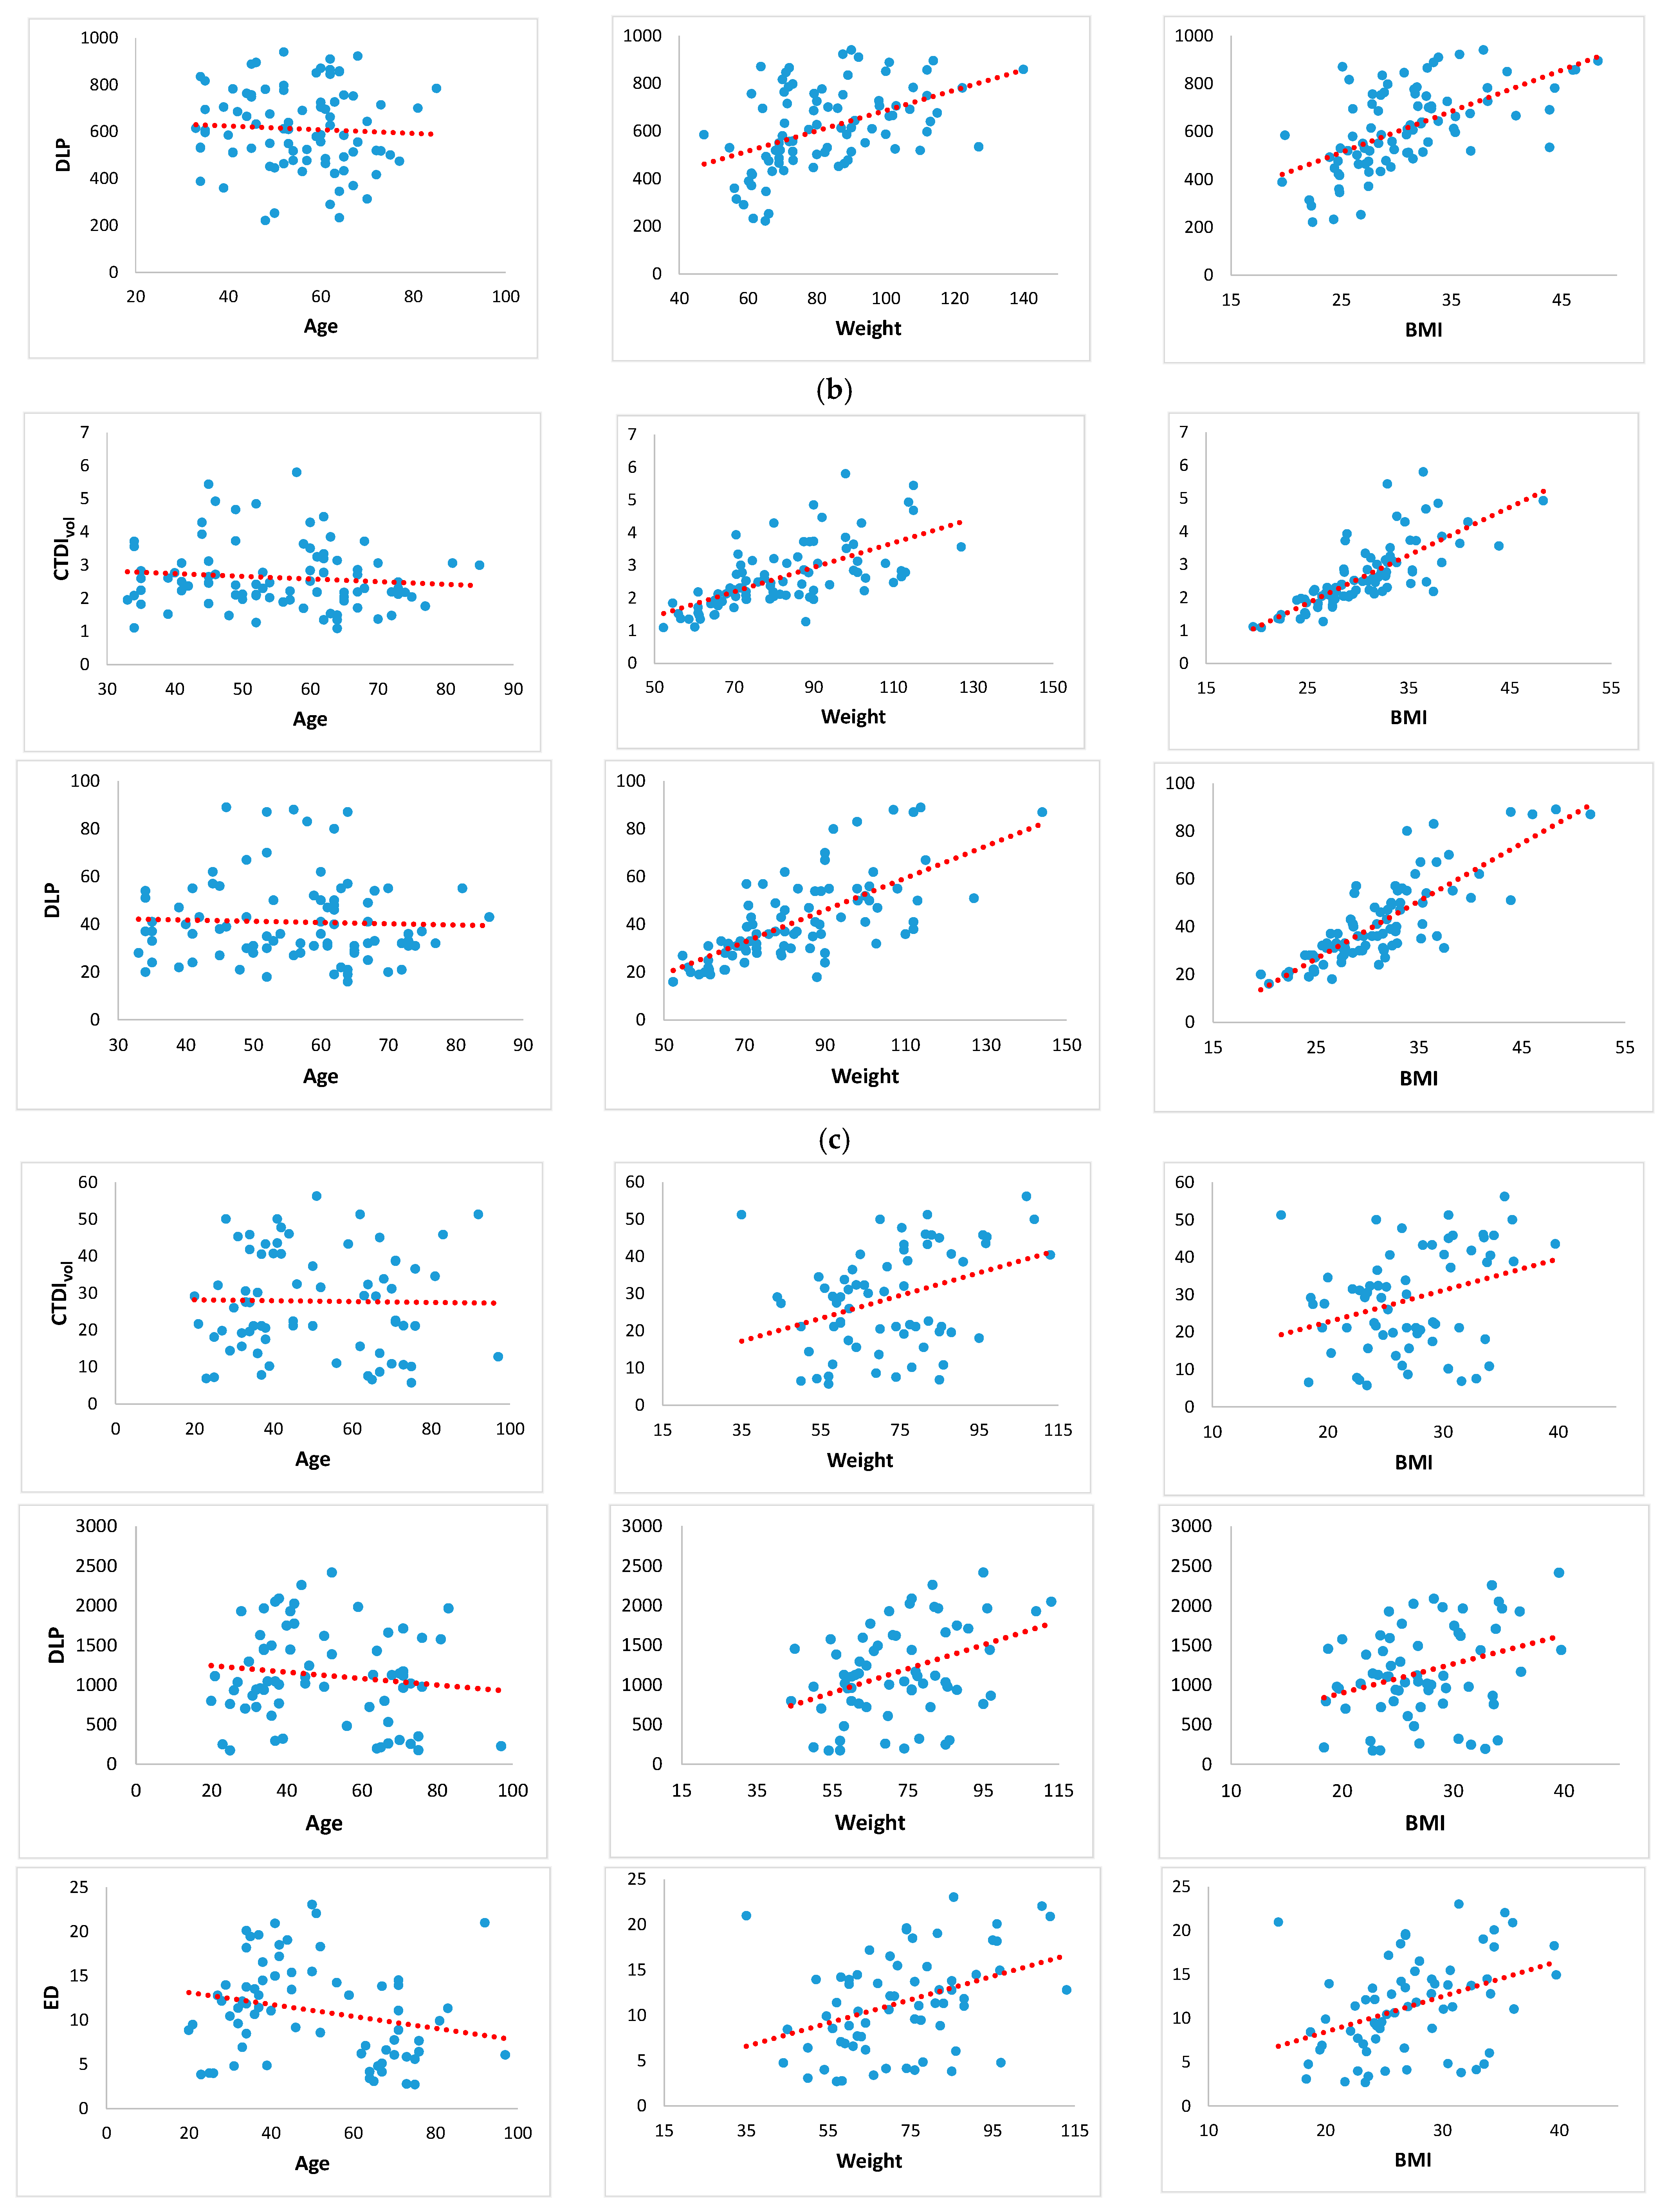
3.5. Plots of Linear Regression Models

In this section, plots of linear regression models are provided for each exam, considering BMI, weight and age as input variables and each of CTDIvol, DLP, ED and SSDE as output variables. Figure 1 presents the plots of linear regression models for (a) the chest CT exam, (b) the cardiac angiogram CT exam, (c) the cardiac calcium score CT exam and (d) the abdomen/pelvis CT exam. As can be seen in Figure 1, the plots reflect the relationships found in Section 3.1, Section 3.2, Section 3.3 and Section 3.4.

3.6. Correlations between the CT Dose Indices

In addition, this study examined the relationship between the CT dose indices using linear regression models. Table 7 provides a summary of the correlation results between these indices.
In all CT exams, statistically significant relationships were apparent between all dose indices as indicated by the evaluation metrics (p-value < 0.05). The relationship between CTDIvol and DLP was found to be the most significant (r > 0.85 in all exams) compared to the relationships between each pair of the other dose indices. A relatively strong relationship between ED and SSDE was also noticed in the chest and abdomen/pelvis CT exams (r = 0.82 and r = 0.73, respectively).

4. Discussion

Several studies have investigated factors influencing CT radiation dose. Smith-Bindman et al. [20] conducted a study to determine patient, vendor and institutional factors that influence CT radiation dose. They employed linear regression and modified Poisson regression to identify the parameters contributing to dose variability. The authors found that CT dose varies within and across medical centers. Moreover, they found that patient size, institutional-specific protocols and multiphase scanning were the most important predictors of dose followed by manufacturer and iterative reconstruction.
The relationship between CTDIvol and patient parameters has been explored in the literature. Lange et al. [21] proposed a study to find associations between different CT dose estimates, namely CTDIvol, DLP and SSDE, and patient age, BMI, scan length and technical parameters such as tube current, tube voltage, pitch, noise level and level of iterative reconstruction. It was found all dose estimates in all imaging protocols were affected by tube current. Garcia-Sanchez et al. [22] utilized machine learning techniques to predict CT radiation dose and discovered a relationship between the diagnostic reference level (DRL) and BMI, with increasing CTDIvol as BMI rises. As demonstrated in Section 3, it can be noted that our results are in agreement with the results found in [22]. Additionally, Christner et al. [23] conducted linear regression analysis on a dataset of 500 adult CT examinations and found a linear increase in CTDIvol with patient size, while SSDE remained independent of size.
With respect to DLP, McLaughlin et al. [24] investigated the relationship between radiation exposure and compositions of the abdominal cavity. They found that abdominal adipose tissue is the strongest contributor to DLP in abdominopelvic CT, followed by muscle volume. In [25], multivariate logistic regression analysis was performed to determine the factors affecting the radiation dose index (DLP) in pulmonary angiogram CT examinations. It was found that patients with high BMI and intensive care unit (ICU) referrals are associated with high CT radiation doses. These results are in agreement with our results, where the patient’s BMI was found to correlate with the patient’s DLP.
Factors affecting patient ED have also been studied in the literature. Cooper et al. [26] focused on factors increasing patient ED while undergoing CT exams, including gender, age, obesity (higher BMI), and multiphase/repeat scanning using Spearman correlation coefficients and penalized quantile regression on abdomen/pelvis CT scans of patients under 16 years. It was found that older age, female gender, obesity, and multiphase or repeat scanning are all associated with increased effective doses from abdomen/pelvis CT. In another study by Lee et al. [27], Pearson correlation analysis was conducted to explore the relationship between ED and the patient’s BMI and abdominal fat in liver CT scans. A strong positive correlation between ED and both BMI (r = 0.715; p-value < 0.001) and TFA was found (r = 0.792; p-value < 0.001). The results above are in agreement with our results with respect to the patient’s BMI, which was found to correlate with the patient’s ED.
Several studies have explored the relationship between SSDE and patient parameters. Boos et al. [17] investigated the relationship between SSDE and patient related parameters, namely height, weight, effective diameter (Deff) and BMI, using linear regression models on a dataset of 400 thoracoabdominal CT adult examinations. Significant correlations were found between Deff, BMI and weight as surrogates for calculating SSDE. Their results are in agreement with our results with respect to patient BMI and weight, which were found to be correlated with the SSDE. Furthermore, O’Neill et al. [28] explored the potential of using BMI as a size-related metric alternative to the mid-slice effective diameter to estimate SSDE in abdominal CT using linear regression. It was found that there is a correlation between patient BMI and mid-slice effective diameter; thus, patient BMI can be used to accurately estimate mid-slice effective diameter, which is necessary for calculating SSDE for abdominal CT. Moreover, Svahn et al. [29] evaluated the effect of patient size on absorbed dose for ultra-low-dose and standard CT. They noted an inverse relationship between patient size and ultra-low-dose CT, while SSDE increased with larger patient size due to higher abdominal fatty tissue percentage. In [30], a study was proposed to analyze the correlation between patient weight, BMI and water-equivalent diameter and SSDE for chest and abdomen–pelvic CT examinations. Using linear regression analysis, it was found that both patient weight and BMI can be used to calculate SSDE in the chest and abdomen–pelvis CT exams. Similar results were found in [31], where higher BMI contributed to increased radiation dose and SSDE in patients who had undergone chest or abdomen–pelvis CT examination. The results of the aforementioned studies are in accordance with our results, where patient BMI and weight were found to be correlated with SSDE.
The relationship between several dose indices has been studied in the literature. In a study proposed by Binta et al. [12], the relationship between SSDE and both CTDIvol and DLP in chest CT exams was investigated. It was found that the CTDIvol value depends on the lateral diameter of the patient’s body. The CTDIvol value varied as the lateral body diameter of each patient varied, which also resulted in greater variation in SSDE. Moreover, their results showed that different SSDE values were seen for patients with different BMI values. Garcia-Sanchez et al. [22] observed a high linear correlation between CTDIvol and SSDE. Similar results could be obtained using clustering algorithms [32] and numerical methods [33]. Sebelego et al. [34] proposed a study aiming to determine the factors that impact SSDE for chest–abdomen–pelvis and abdomen–pelvis CT exams. It was found that SSDE increased as the CTDIvol and patient BMI increased, respectively. The results of the aforementioned studies are in accordance with our findings, where statistically significant relationships were found between each pair of the CT dose indices (p-value < 0.05).
As discussed in this section, several studies have explored the relationships between patient parameters and CT dose indices and between the pair indices themselves. Other studies have been proposed in the literature for other purposes related to CT dose estimation and prediction. For example, the work in [35] explored deriving SSDE from BMI. Moreover, artificial neural networks (ANNs) were used to estimate the DLP in chest CT examinations [36], while convolutional neural networks (CNNs) were used to estimate SSDE in CT medical examinations [37]. In [22], several regression predictive models were used to predict the patient’s CT dose in various CT protocols.
All in all, this study found that all CT dose indices correlated with BMI and weight in all CT exams with varying degrees. Age did not display any significant correlation with CT dose indices across all CT exams. All of the CT exams considered in the present study were either in the chest, abdomen, or pelvis area. Body thickness and composition in the body part mentioned were not affected by age, unlike the brain body part, which is affected by age, especially in the pediatric population. This explains the rationale behind the different age band groups to establish the diagnostic reference levels (DRLs) for pediatric CT brains. Our observation supports the recommendation of international commission on radiological protection (ICRP) Report 135 [38], which suggests DRLs to be established using weight criteria for both adult and pediatric populations.
The work presented in this paper investigated the correlation between different CT dose indices and patient-related parameters. One of the limitations of this work is the limited sample size. Moreover, the fact that the dataset was retrieved from a single CT machine and from a single institute does not address the different protocol setups between the different radiology departments. One cannot neglect the fact that CT detector configuration also varies across vendors, which could also contribute to CT exposure. The pediatric population is at more risk with the increased demand for requested CT. Our dataset was exclusively investigating adults. As a future work, this study can be applied to a larger dataset captured from a population with different age groups and collected from different institutions using different CT machines with different configurations.

5. Conclusions

This study investigated the correlations between different CT dose indices, namely CTDIvol, DLP, ED and SSDE as output variables, and patient-related parameters, namely BMI, weight and age as input variables. Simple and multiple linear regression models and statistical tests were utilized to explore potential correlations. The study also examined the correlations between the CT dose indices themselves in different CT exams.
Using linear regression models, the study found that all CT dose indices correlated with BMI and weight in all CT exams with varying degrees. Age did not display any significant correlation with CT dose indices across all CT exams. Multiple linear regression models exhibited good relationships between input and output variables at least as much as the best respective simple linear regression models in all CT exams. Furthermore, the study investigated the relationships between the different CT indices and found that a strong linear relationship was apparent between CTDIvol and DLP compared to the relationships between each pair of the other dose indices. However, all dose indices exhibited statistically significant relationships. In conclusion, this study helps in better understanding how patient-specific parameters impact the reported CT dose indices and individuals’ absorbed doses. Moreover, our observations are instrumental in the radiology field of medicine, as every radiology department is dedicated to optimizing radiation exposure while obtaining an adequate diagnosable image quality.

Author Contributions

Conceptualization, S.D. and E.D.; data curation, E.D.; formal analysis, M.A. and S.D.; investigation, M.A., S.E.H., S.D. and E.D.; methodology, S.D.; project administration, S.D.; resources, S.D. and E.D.; software, M.A., S.E.H. and A.C.; supervision, S.D.; validation, M.A., S.E.H. and A.C.; visualization, M.A. and S.E.H.; writing—original draft, M.A. and S.E.H.; writing—review and editing, M.A., S.D. and E.D. All authors have read and agreed to the published version of the manuscript.

Funding

The work in this paper was supported, in part, by the Open Access Program from the American University of Sharjah [Award #: OAPCEN-1410-E00274]. This paper represents the opinions of the authors and does not mean to represent the position or opinions of the American University of Sharjah.

Institutional Review Board Statement

The retrospective study was approved by the Ethics and Research Committee of the University Hospital Sharjah on 19 June 2017 (Ref. UHS-HERC-030-07062017).

Informed Consent Statement

Not applicable.

Data Availability Statement

Data is contained within the article.

Acknowledgments

M.A. and S.E.H. would like to thank the Biomedical Engineering Graduate Program at the American University of Sharjah (AUS) for funding their graduate studies.

Conflicts of Interest

The authors declare no conflict of interest.

References

  1. Power, S.P.; Moloney, F.; Twomey, M.; James, K.; O’Connor, O.J.; Maher, M.M. Computed Tomography and Patient Risk: Facts, Perceptions and Uncertainties. World J. Radiol. 2016, 8, 902. [Google Scholar] [CrossRef]
  2. Withers, P.J.; Bouman, C.; Carmignato, S.; Cnudde, V.; Grimaldi, D.; Hagen, C.K.; Maire, E.; Manley, M.; Du Plessis, A.; Stock, S.R. X-Ray Computed Tomography. Nat. Rev. Methods Primers 2021, 1, 18. [Google Scholar] [CrossRef]
  3. Shubayr, N.; Alashban, Y. Estimation of Radiation Doses and Lifetime Attributable Risk of Radiation-Induced Cancer in the Uterus and Prostate from Abdomen Pelvis CT Examinations. Front. Public Health 2023, 10, 1094328. [Google Scholar] [CrossRef] [PubMed]
  4. Mohmoudi, G.; Bahrami, A.; Rostampour, N.; Maskani, R.; Joukar, F.; Hosseinzadeh, A. Evaluation of Cancer Risk Induced by Radiation Exposure from Normal Head CT Scans. Front. Biomed. Technol. 2023, 10, 259–267. [Google Scholar] [CrossRef]
  5. Over 75 Million CT Scans Are Performed Each Year and Growing Despite Radiation Concerns—iData Research. Available online: https://idataresearch.com/over-75-million-ct-scans-are-performed-each-year-and-growing-despite-radiation-concerns/ (accessed on 20 January 2024).
  6. Dhou, S.; Dalah, E.; AlGhafeer, R.; Hamidu, A.; Obaideen, A. Regression Analysis between the Different Breast Dose Quantities Reported in Digital Mammography and Patient Age, Breast Thickness, and Acquisition Parameters. J. Imaging 2022, 8, 211. [Google Scholar] [CrossRef] [PubMed]
  7. Dalah, E.Z.; Dhou, S.; Mudalige, T.; Amin, F.; Obaideen, A. Challenges Estimating Patient Organs Doses Undergoing Enhanced Chest CT Examination: Exploratory Study. Biomed. Phys. Eng. Express 2021, 7, 025019. [Google Scholar] [CrossRef]
  8. Dalah, E.Z.; Alsuwaidi, J.S.; AlKtebi, R.S.; AlMulla, M.A.A.; Gupta, P. Establishing Protocol-Based Dose Metrics for Common Abdomen and Pelvis Computed Tomography Protocol. Curr. Med. Imaging 2024, 20, e220523217204. [Google Scholar] [CrossRef]
  9. Huda, W.; Ogden, K.M.; Khorasani, M.R. Converting Dose-Length Product to Effective Dose at CT. Radiology 2008, 248, 995–1003. [Google Scholar] [CrossRef]
  10. Valentin, J. Relative Biological Effectiveness (RBE), Quality Factor (Q), and Radiation Weighting Factor (wR): ICRP Publication 92. Ann. ICRP 2003, 33, 1–121. [Google Scholar] [CrossRef]
  11. Lee, C. How to Estimate Effective Dose for CT Patients. Eur. Radiol. 2020, 30, 1825–1827. [Google Scholar] [CrossRef]
  12. Binta, Y.I.; Suryani, S.; Abdullah, B. The Comparison of Size-Specific Dose Estimate (SSDE) in Chest CT Examination Calculated Based on Volumetric CT Dose Index (CTDIvol) Reference Phantom and Dose Length Product (DLP). J. Phys. Conf. Ser. 2021, 1763, 012065. [Google Scholar] [CrossRef]
  13. Satharasinghe, D.M.; Jeyasugiththan, J.; Wanninayake, W.M.N.M.B.; Pallewatte, A.S. Size-Specific Dose Estimates (SSDEs) for Computed Tomography and Influencing Factors on It: A Systematic Review. J. Radiol. Prot. 2021, 41, R108. [Google Scholar] [CrossRef] [PubMed]
  14. AAPM Reports—Size-Specific Dose Estimates (SSDE) in Pediatric and Adult Body CT Examinations. Available online: https://www.aapm.org/pubs/reports/detail.asp?docid=143 (accessed on 20 January 2024).
  15. Rajaraman, V.; Ponnusamy, M.; Halanaik, D. Size Specific Dose Estimate (SSDE) for Estimating Patient Dose from CT Used in Myocardial Perfusion SPECT/CT. Asia Ocean J. Nucl. Med. Biol. 2020, 8, 58–63. [Google Scholar] [CrossRef] [PubMed]
  16. Vano, E.; Frija, G.; Loose, R.; Paulo, G.; Efstathopoulos, E.; Granata, C.; Andersson, J.; the European Society of Radiology (ESR). Dosimetric Quantities and Effective Dose in Medical Imaging: A Summary for Medical Doctors. Insights Imaging 2021, 12, 99. [Google Scholar] [CrossRef] [PubMed]
  17. Boos, J.; Lanzman, R.S.; Heusch, P.; Aissa, J.; Schleich, C.; Thomas, C.; Sawicki, L.M.; Antoch, G.; Kröpil, P. Does Body Mass Index Outperform Body Weight as a Surrogate Parameter in the Calculation of Size-Specific Dose Estimates in Adult Body CT? Br. J. Radiol. 2016, 89, 20150734. [Google Scholar] [CrossRef] [PubMed]
  18. Draper, N.R.; Smith, H. Applied Regression Analysis; John Wiley & Sons: Hoboken, NJ, USA, 1998. [Google Scholar]
  19. Chicco, D.; Warrens, M.J.; Jurman, G. The Coefficient of Determination R-Squared Is More Informative than SMAPE, MAE, MAPE, MSE and RMSE in Regression Analysis Evaluation. PeerJ Comput. Sci. 2021, 7, e623. [Google Scholar] [CrossRef] [PubMed]
  20. Smith-Bindman, R.; Wang, Y.; Nelson, T.R.; Moghadassi, M.; Wilson, N.; Gould, R.; Seibert, A.; Boone, J.M.; Krishnam, M.; Lamba, R.; et al. Predictors of CT Radiation Dose and Their Effect on Patient Care: A Comprehensive Analysis Using Automated Data. Radiology 2017, 282, 182–193. [Google Scholar] [CrossRef] [PubMed]
  21. Lange, I.; Alikhani, B.; Wacker, F.; Raatschen, H.-J. Intraindividual Variation of Dose Parameters in Oncologic CT Imaging. PLoS ONE 2021, 16, e0250490. [Google Scholar] [CrossRef] [PubMed]
  22. Garcia-Sanchez, A.-J.; Garcia Angosto, E.; Llor, J.L.; Serna Berna, A.; Ramos, D. Machine Learning Techniques Applied to Dose Prediction in Computed Tomography Tests. Sensors 2019, 19, 5116. [Google Scholar] [CrossRef]
  23. Christner, J.A.; Braun, N.N.; Jacobsen, M.C.; Carter, R.E.; Kofler, J.M.; McCollough, C.H. Size-Specific Dose Estimates for Adult Patients at CT of the Torso. Radiology 2012, 265, 841–847. [Google Scholar] [CrossRef]
  24. McLaughlin, P.D.; Chawke, L.; Twomey, M.; Murphy, K.P.; O’Neill, S.B.; McWilliams, S.R.; James, K.; Kavanagh, R.G.; Sullivan, C.; Chan, F.E.; et al. Body Composition Determinants of Radiation Dose during Abdominopelvic CT. Insights Imaging 2018, 9, 9–16. [Google Scholar] [CrossRef] [PubMed]
  25. Nagpal, P.; Priya, S.; Eskandari, A.; Mullan, A.; Aggarwal, T.; Narayanasamy, S.; Parashar, K.; Bhat, A.P.; Sieren, J.C. Factors Affecting Radiation Dose in Computed Tomography Angiograms for Pulmonary Embolism: A Retrospective Cohort Study. J. Clin. Imaging Sci. 2020, 10, 74. [Google Scholar] [CrossRef]
  26. Cooper, J.N.; Lodwick, D.L.; Adler, B.; Lee, C.; Minneci, P.C.; Deans, K.J. Patient Characteristics Associated with Differences in Radiation Exposure from Pediatric Abdomen-Pelvis CT Scans: A Quantile Regression Analysis. Comput. Biol. Med. 2017, 85, 7–12. [Google Scholar] [CrossRef] [PubMed]
  27. Lee, S.; Kim, K.W.; Kwon, H.-J.; Lee, J.; Koo, K.; Song, G.-W.; Lee, S.-G. Relationship of Body Mass Index and Abdominal Fat with Radiation Dose Received during Preoperative Liver CT in Potential Living Liver Donors: A Cross-Sectional Study. Quant. Imaging Med. Surg. 2022, 12, 2206–2212. [Google Scholar] [CrossRef]
  28. O’Neill, S.; Kavanagh, R.G.; Carey, B.W.; Moore, N.; Maher, M.; O’Connor, O.J. Using Body Mass Index to Estimate Individualised Patient Radiation Dose in Abdominal Computed Tomography. Eur. Radiol. Exp. 2018, 2, 38. [Google Scholar] [CrossRef]
  29. Svahn, T.M.; Sjöberg, T.; Ast, J.C. Dose Estimation of Ultra-Low-Dose Chest CT to Different Sized Adult Patients. Eur. Radiol. 2019, 29, 4315–4323. [Google Scholar] [CrossRef]
  30. Xu, J.; Wang, X.; Yang, P.; Luo, K.; He, X. Size-Specific Dose Estimates of Radiation Based on Body Weight and Body Mass Index for Chest and Abdomen-Pelvic CTs. BioMed Res. Int. 2020, 2020, e6046501. [Google Scholar] [CrossRef]
  31. Deevband, M.R.; Nasab, S.M.B.H.; Mohammadi, H.; Salimi, Y.; Mostaar, A.; Deravi, N.; Fathi, M.; Vakili, K.; Yaghoobpoor, S.; Ghorbani, M. Body-Mass Index-Based Effective Dose Determination in Commonly Performed Computed Tomography Examinations in Adults. Front. Biomed. Technol. 2022, 9, 316–322. [Google Scholar] [CrossRef]
  32. Al-Jarrah, M.A.; Al-Jarrah, A.; Jarrah, A.; AlShurbaji, M.; Magableh, S.K.; Al-Tamimi, A.-K.; Bzoor, N.; Al-Shamali, M.O. Accurate Reader Identification for the Arabic Holy Quran Recitations Based on an Enhanced VQ Algorithm. Rev. D’intelligence Artif. 2022, 36, 815–823. [Google Scholar] [CrossRef]
  33. AlShurbaji, M.; Kader, L.A.; Hannan, H.; Mortula, M.; Husseini, G.A. Comprehensive Study of a Diabetes Mellitus Mathematical Model Using Numerical Methods with Stability and Parametric Analysis. Int. J. Environ. Res. Public Health 2023, 20, 939. [Google Scholar] [CrossRef] [PubMed]
  34. Sebelego, I.-K.; Acho, S.; van der Merwe, B.; Rae, W.I.D. Factors Influencing Size-Specific Dose Estimates of Selected Computed Tomography Protocols at Two Clinical Practices in South Africa. Radiat. Prot. Dosim. 2023, 199, 588–602. [Google Scholar] [CrossRef] [PubMed]
  35. Steiniger, B.; Klippel, C.; Teichgräber, U.; Reichenbach, J.R.; Fiebich, M. Can The Size-Specific Dose Estimate Be Derived From The Body Mass Index? A Feasibility Study. Radiat. Prot. Dosim. 2022, 198, 325–333. [Google Scholar] [CrossRef] [PubMed]
  36. Tekin, H.O.; Almisned, F.; Erguzel, T.T.; Abuzaid, M.M.; Elshami, W.; Ene, A.; Issa, S.A.M.; Zakaly, H.M.H. Prediction of Dose Length Product for Chest CT Examinations Using Artificial Neural Networks (ANN). 2022, preprint. [CrossRef]
  37. Juszczyk, J.; Badura, P.; Czajkowska, J.; Wijata, A.; Andrzejewski, J.; Bozek, P.; Smolinski, M.; Biesok, M.; Sage, A.; Rudzki, M.; et al. Automated Size-Specific Dose Estimates Using Deep Learning Image Processing. Med. Image Anal. 2021, 68, 101898. [Google Scholar] [CrossRef]
  38. Vañó, E.; Miller, D.L.; Martin, C.J.; Rehani, M.M.; Kang, K.; Rosenstein, M.; Ortiz-López, P.; Mattsson, S.; Padovani, R.; Rogers, A. ICRP Publication 135: Diagnostic Reference Levels in Medical Imaging. Ann. ICRP 2017, 46, 1–144. [Google Scholar] [CrossRef]
Figure 1. Plots of the simple linear regression models for (a) the chest CT exam, (b) the cardiac angiogram CT exam, (c) the cardiac calcium score CT exam and (d) the abdomen/pelvis CT exam. The blue points represent the samples and the red dotted line represents the linear regression line.
Applsci 14 01071 g001aApplsci 14 01071 g001bApplsci 14 01071 g001c
Table 1. Population statistics of the dataset according to the groups of protocols.
CT ExamNo. of Patients (Male, Female)Average Age (Range)Average Weight (Range)Average BMI (Range)
Chest68 (37, 31)65.3 (21–96)66.4 (36–110)25.5 (15.6–41.4)
Cardiac Angiogram91 (49, 42)55.7 (33–85)83.8 (47–144)31.2 (19.6–51.6)
Cardiac Calcium Score94 (48, 46)56.1 (33–85)83.9 (52–144)31.5 (19.6–51.6)
Abdomen/Pelvis73 (31, 42)48.4 (20–92)72.9 (35–113)27.4 (16–39.7)
Table 2. Dose indices’ parameter range for each CT exam.
CT ExamStatisticsDLP
(in mGy.cm)
CTDIvol
(in mGy)
ED
(in mSv)
SSDE
(in mGy)
ChestMean316.76 9.033.328.53
Range69–10133.01–28.730.82–15.053.59–25.3
Std.197.165.422.123.7
Number of Outliers3422
Cardiac AngiogramMean654.1 37.1 --
Range222–149413.4–71.8--
Std.241.111.5--
Number of Outliers57--
Cardiac Calcium ScoreMean44.52.93 --
Range16–1211.1–7.8--
Std.22.621.44--
Number of Outliers57--
Abdomen/PelvisMean1156.427.5 11.5322.71
Range58–27502.96–65.512.7–32.729.9–43.72
Std.660.514.396.237.2
Number of Outliers3135
Table 3. Regression and correlation analysis between CTDIvol as output variable and BMI, weight and age as input variables.
CTDIvol (mGy)
CT ExamEvaluation MetricLinearMultiple Linear
X1: BMIX1: WeightX1: AgeAll Parameters
(X1: BMI, X2: Weight, X3: Age)
ChestR20.190.200.010.23
RMSE18.6059.7561.472.58
MAE17.8257.8858.041.76
MAPE70.1393.8186.8723.57
Eq. y ^ = 0.87 X1 + 18.80 y ^ = 2.44 X1 + 47.13 y ^ = 0.52 X1 + 61.73 y ^ = 0.81 + 0.09 * X1 + 0.05 X2 + 0.01 X3
r0.430.450.080.48
p-value9.38 × 10−45.56 × 10−45.46 × 10−11.80 × 10⁻⁴
Cardiac AngiogramR20.490.330.000.49
RMSE7.9650.0125.096.43
MAE6.1247.5620.734.92
MAPE19.9956.6534.5514.09
Eq. y ^ = 0.46 X1 + 14.60 y ^ = 1.20 X1 + 40.30 y ^ = 0.00 X1 + 55.25 y ^ = −0.14 + 1 X1 + 0.02 X2 + 0.05 X3
r0.700.580.000.70
p-value1.70 × 10−139.08 × 10−99.78 × 10−11.27 × 10⁻¹³
Cardiac Calcium ScoreR20.580.410.010.59
RMSE28.1780.5954.400.62
MAE27.8278.9652.920.42
MAPE91.5696.8194.9815.12
Eq. y ^ = 0.15 X1 −1.80 y ^ = 0.04 X1 −0.43 y ^ = −0.01 X1 + 3.07 y ^ = −1.86 + 0.12 X1 + 0.01 X2 + 0 X3
r0.760.64−0.100.77
p-value1.24 × 10−171.83 × 10−113.40 × 10−14.22 × 10−18
Abdomen/PelvisR20.100.130.000.17
RMSE13.0146.9032.4412.34
MAE11.1144.2625.4610.61
MAPE42.2260.7946.1837.92
Eq. y ^ = 0.12 X1 + 23.83 y ^ = 0.42 X1 + 60.38 y ^ = −0.02 X1 + 50.66 y ^ = −3.27 + −0.19 X1 + 0.4 X2 + 0.17 X3
r0.320.36−0.020.42
p-value8.69 × 10−32.52 × 10−38.86 × 10−13.85 × 10⁻⁴
Table 4. Regression and correlation analysis between DLP as output variable and BMI, weight and age as input variables.
DLP (mGy.cm)
CT ExamEvaluation MetricLinearMultiple Linear
X1: BMIX1: WeightX1: AgeAll Parameters
(X1: BMI, X2: Weight, X3: Age)
ChestR20.150.240.000.24
RMSE278.74241.19261.54115.94
MAE246.12205.70219.1782.71
MAPE977.52312.39392.0329.60
Eq. y ^ = 0.02 X1 + 20.74 y ^ = 0.06 X1 + 49.76 y ^ = 0.00 X1 + 64.59 y ^ = −2.48 −0.62 X1 + 4.11 X2 + 0.32 X3
r0.390.490.030.49
p-value3.27 × 10−31.48 × 10−48.22 × 10−11.22 × 10⁻⁴
Cardiac AngiogramR20.350.210.000.35
RMSE605.98554.89583.90138.45
MAE582.00529.96557.57108.57
MAPE1895.46653.771075.7118.39
Eq. y ^ = 0.02 X1 + 18.26 y ^ = 0.05 X1 + 52.01 y ^ = 0.00 X1 + 57.64 y ^ = 114 + 19.48 X1 −0.91 X2 −0.46 X3
r0.590.46−0.060.59
p-value1.86 × 10−97.33 × 10−66.08 × 10−11.53 × 10⁻⁹
Cardiac Calcium ScoreR20.680.480.000.68
RMSE16.3143.7926.179.76
MAE11.4541.5622.497.22
MAPE34.0451.2177.5217.26
Eq. y ^ = 2.42 X1 −33.91 y ^ = 0.67 X1 −14.26 y ^ = −0.05 X1 −33.91 y ^ = −37.36 + 2.19 X1 + 0.09 X2 + 0.05 X3
r0.820.69−0.040.83
p-value3.39 × 10−235.01 × 10−147.26 × 10−12.28 × 10−23
Abdomen/PelvisR20.110.160.020.17
RMSE1278.411236.021226.73521.47
MAE1143.781098.391074.49420.42
MAPE4200.921515.992551.5536.68
Eq. y ^ = 0.00 X1 + 24.04 y ^ = 0.01 X1 + 60.48 y ^ = 0.00 X1 + 53.77 y ^ = −93.35 −9.31 X1 + 17.99 X2 + 4.3 X3
r0.320.40−0.130.41
p-value7.76 × 10−39.25 × 10−42.92 × 10−15.49 × 10⁻⁴
Table 5. Regression and correlation analysis between ED as output variable and BMI, weight and age as input variables.
ED (mSv)
CT ExamEvaluation MetricLinearMultiple Linear
X1: BMIX1: WeightX1: AgeAll Parameters
(X1: BMI, X2: Weight, X3: Age)
ChestR20.280.170.010.30
RMSE23.0164.9766.441.03
MAE22.3962.9763.640.86
MAPE88.1495.3594.9028.79
Eq. y ^ = 2.51 X1 + 17.88 y ^ = 5.48 X1 + 49.58 y ^ = 1.85 X1 + 60.15 y ^ = 0.18 + 0.12 X1 − 0.01 X2 + 0 X3
r0.520.410.120.54
p-value3.28 × 10−51.70 × 10−33.40 × 10−11.48 × 10⁻⁵
Abdomen/PelvisR20.160.150.060.17
RMSE16.9062.7644.544.90
MAE16.0160.9739.323.82
MAPE58.9683.9674.0235.87
Eq. y ^ = 0.39 X1 + 22.79 y ^ = 1.15 X1 + 59.23 y ^ = −0.83 X1 + 59.59 y ^ = 1.17 + 0.32 X1 + 0.03 X2 −0.02 X3
r0.400.38−0.240.42
p-value9.22 × 10−41.42 × 10−34.83 × 10−24.91 × 10⁻⁴
Table 6. Regression and correlation analysis between SSDE as output variable and BMI, weight and age as input variables.
SSDE (mGy)
CT ExamEvaluation MetricLinearMultiple Linear
X1: BMIX1: WeightX1: AgeAll Parameters
(X1: BMI, X2: Weight, X3: Age)
Chest R20.300.280.010.40
RMSE18.0259.8860.941.92
MAE17.3257.9157.361.63
MAPE67.7987.4986.0120.35
Eq. y ^ = 1.30 X1 + 14.87 y ^ = 3.55 X1 + 37.38 y ^ = 0.98 X1 + 57.49 y ^ = 0.7 + 0.12 X1 + 0.04 X2 + 0.02 X3
r0.550.530.120.63
p-value1.23 × 10−52.30 × 10−53.40 × 10−11.57 × 10⁻⁷
Abdomen/PelvisR20.210.190.000.23
RMSE7.2851.0734.054.99
MAE5.7649.2527.833.98
MAPE21.4768.0649.6817.97
Eq. y ^ = 0.40 X1 + 18.04 y ^ = 1.15 X1 + 46.01 y ^ = −0.05 X1 + 50.71 y ^ = 6.25 + 0.32 X1 + 0.08 X2 + 0.03 X3
r0.460.44−0.010.48
p-value1.33 × 10−43.20 × 10−49.04 × 10−15.23 × 10⁻⁵
Table 7. Regression and correlation analysis between the different CT dose indices.
CTDIVol as Output Variable ( y ^ ) withDLP as Output Variable ( y ^ ) with ED as Output Variable ( y ^ ) with
CT ExamEvaluation MetricX1: DLPX1: EDX1: SSDEX1: EDX1: SSDEX1: SSDE
ChestR20.850.260.370.190.190.68
RMSE294.945.472.44300.25295.555.17
MAE268.434.831.94273.25268.324.94
MAPE97.06193.5925.8998.8496.8063.28
Eq. y ^ = 38.50 X1 − 22.14 y ^ = 0.21 X1 + 1.30 y ^ = 0.49 X1 + 4.08 y ^ = 45.05 X1 + 144.52 y ^ = 22.91 X1 + 96.15 y ^ = 1.61 X1 + 3.15
r0.920.510.610.440.440.82
p-value4.86 × 10−262.17 × 10−51.55 × 10−73.52 × 10−43.66 × 10−42.77 × 10⁻¹⁶
Cardiac AngiogramR20.74-----
RMSE593.64-----
MAE572.96-----
MAPE94.13-----
Eq. y ^ = 0.04 X1 + 7.83-----
r0.86-----
p-value1.26 × 10−24-----
Cardiac Calcium ScoreR20.90-----
RMSE39.48-----
MAE36.77-----
MAPE93.31-----
Eq. y ^ = 15.60 X1 − 1.03-----
r0.95-----
p-value3.07 × 10−44-----
Abdomen/PelvisR20.830.170.270.310.330.54
RMSE1199.7719.6711.931217.961208.0111.65
MAE1070.0516.2410.181086.031074.9911.04
MAPE97.39192.2449.8398.8197.2552.41
Eq. y ^ = 40.03 X1 + 32.66 y ^ = 0.16 X1 + 6.29 y ^ = 0.21 X1 + 15.95 y ^ = 62.26 X1 + 436.46 y ^ = 61.14 X1 − 226.39 y ^ = 0.77 X1 + 13.43
r0.910.410.520.560.580.73
p-value8.48 × 10−266.20 × 10−41.08 × 10−51.58 × 10−65.05 × 10−73.91 × 10⁻¹²
Disclaimer/Publisher’s Note: The statements, opinions and data contained in all publications are solely those of the individual author(s) and contributor(s) and not of MDPI and/or the editor(s). MDPI and/or the editor(s) disclaim responsibility for any injury to people or property resulting from any ideas, methods, instructions or products referred to in the content.

