
Temperature Relaxation in Glass-Forming Materials under Local Fast Laser Excitations during Laser-Induced Microstructuring


Abstract
Featured Application
Abstract
1. Introduction
2. Heat Equation with Dynamic Heat Capacity
2.1. Dynamic Heat Capacity of Glass-Forming Materials
2.2. Analytical Solution of the Heat Equation with Dynamic Heat Capacity
3. Temperature Distribution in Glasses under Local Thermal Perturbations
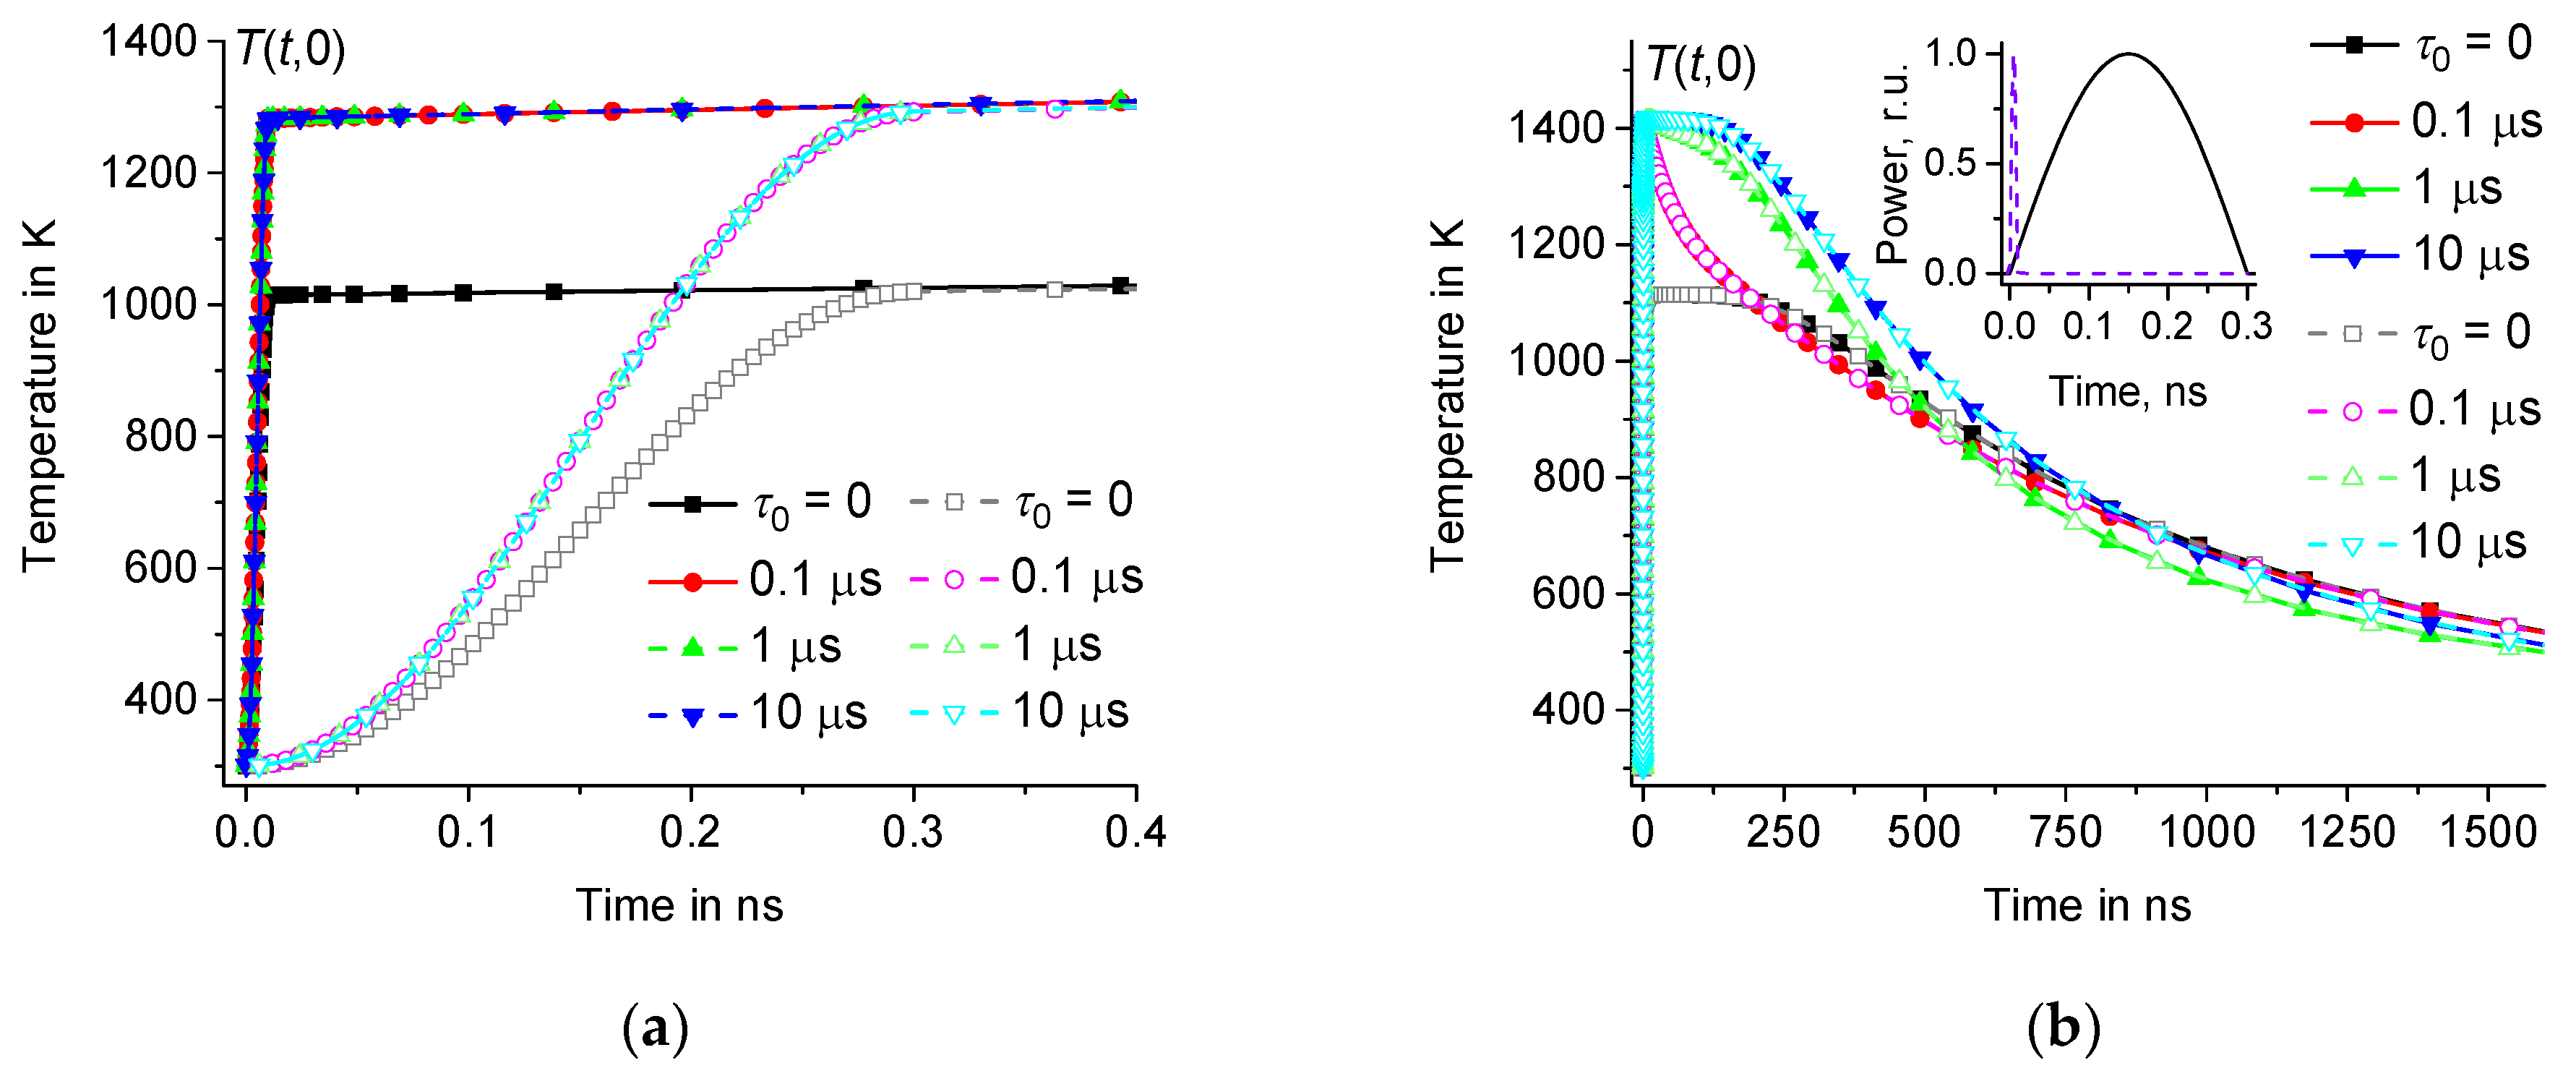
3.1. Influence of the Shape and Duration of Heating Pulses on
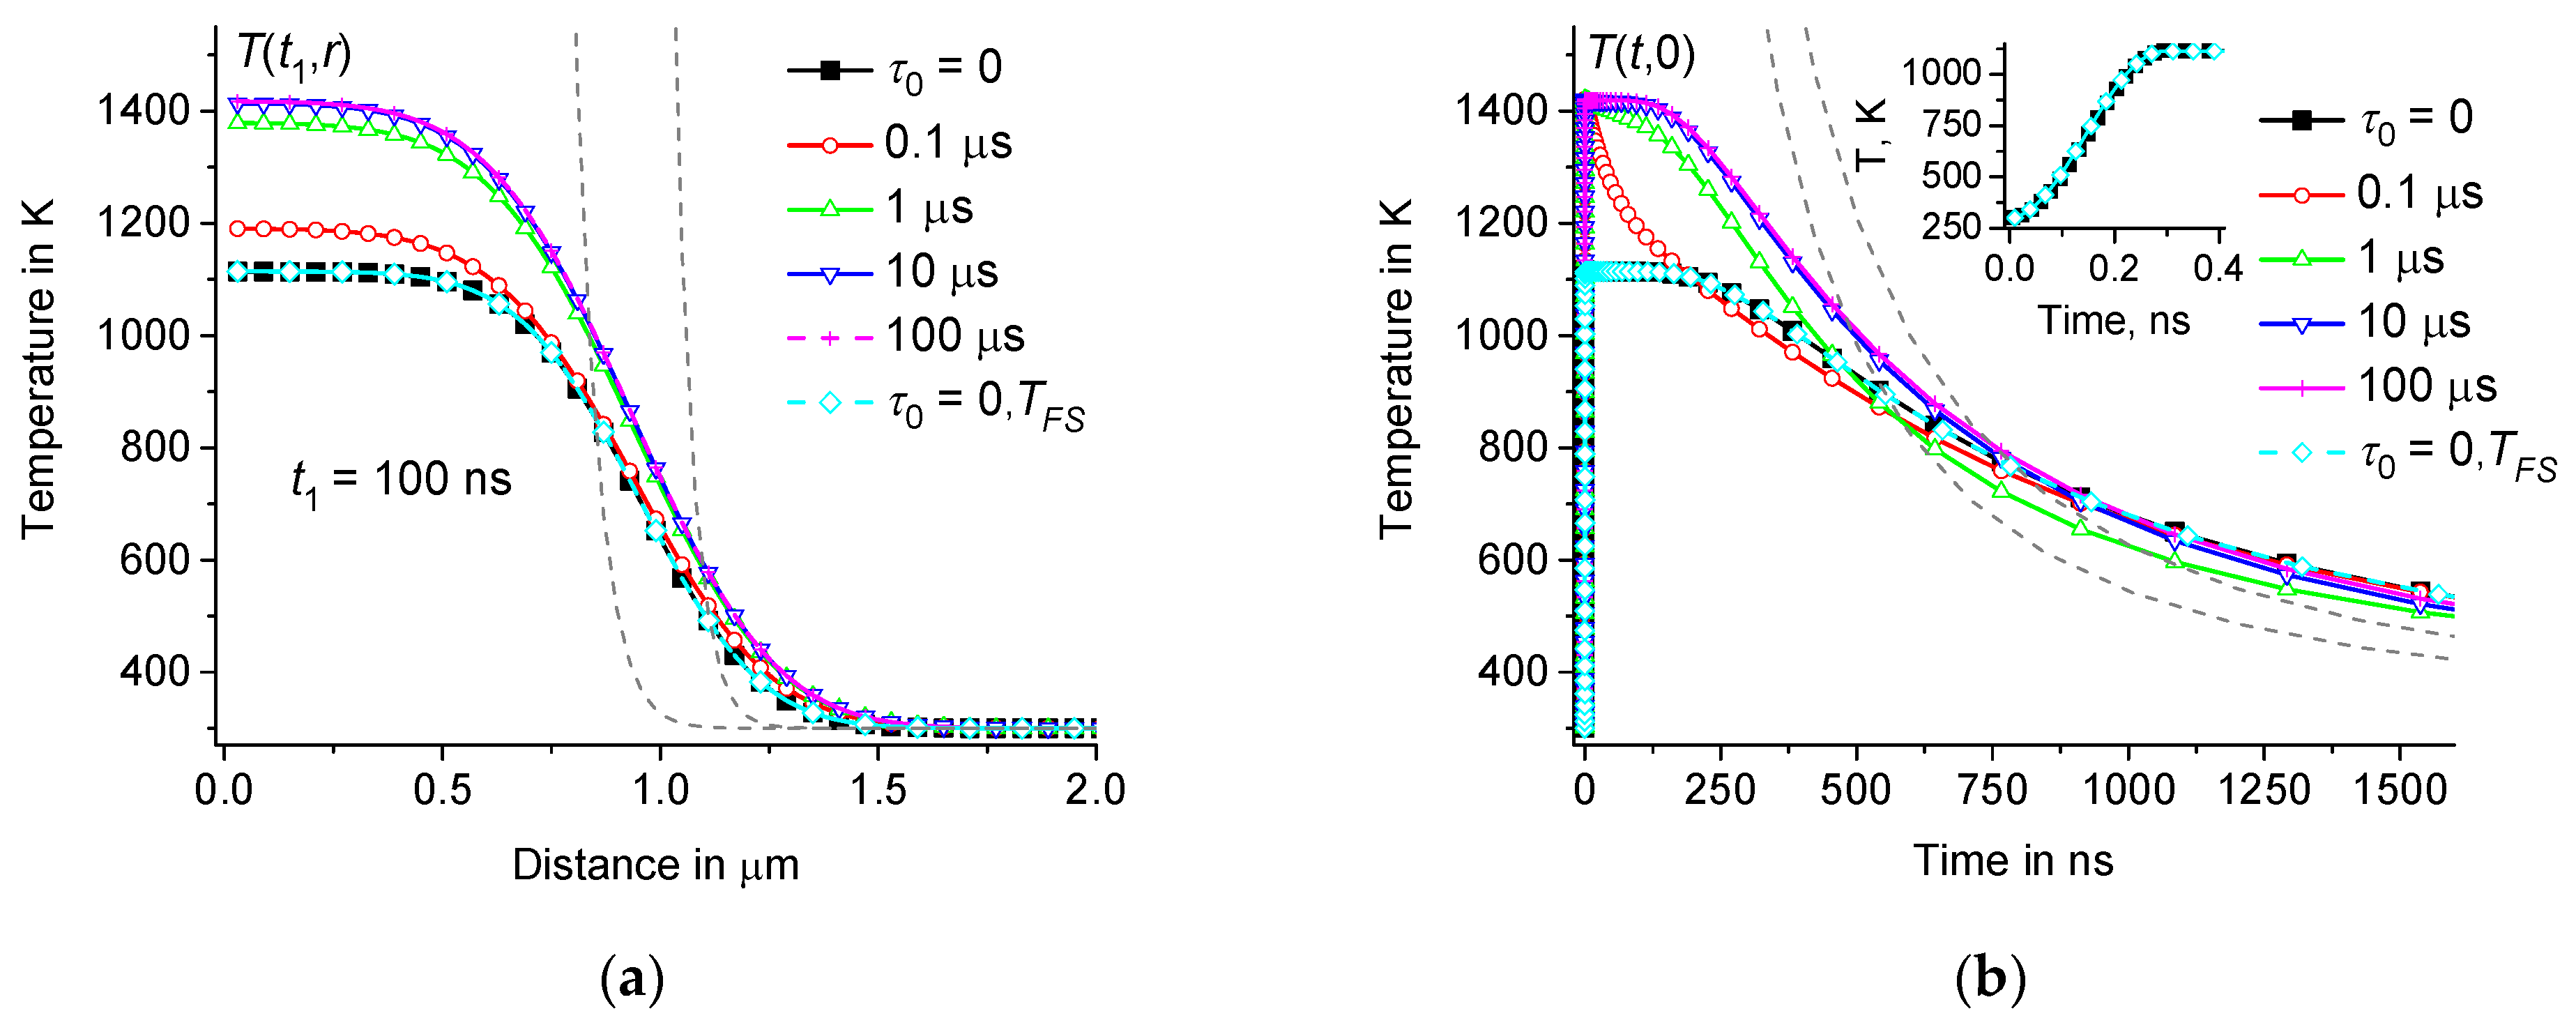
3.2. Comparison with the Fundamental Solution of the Classical Problem

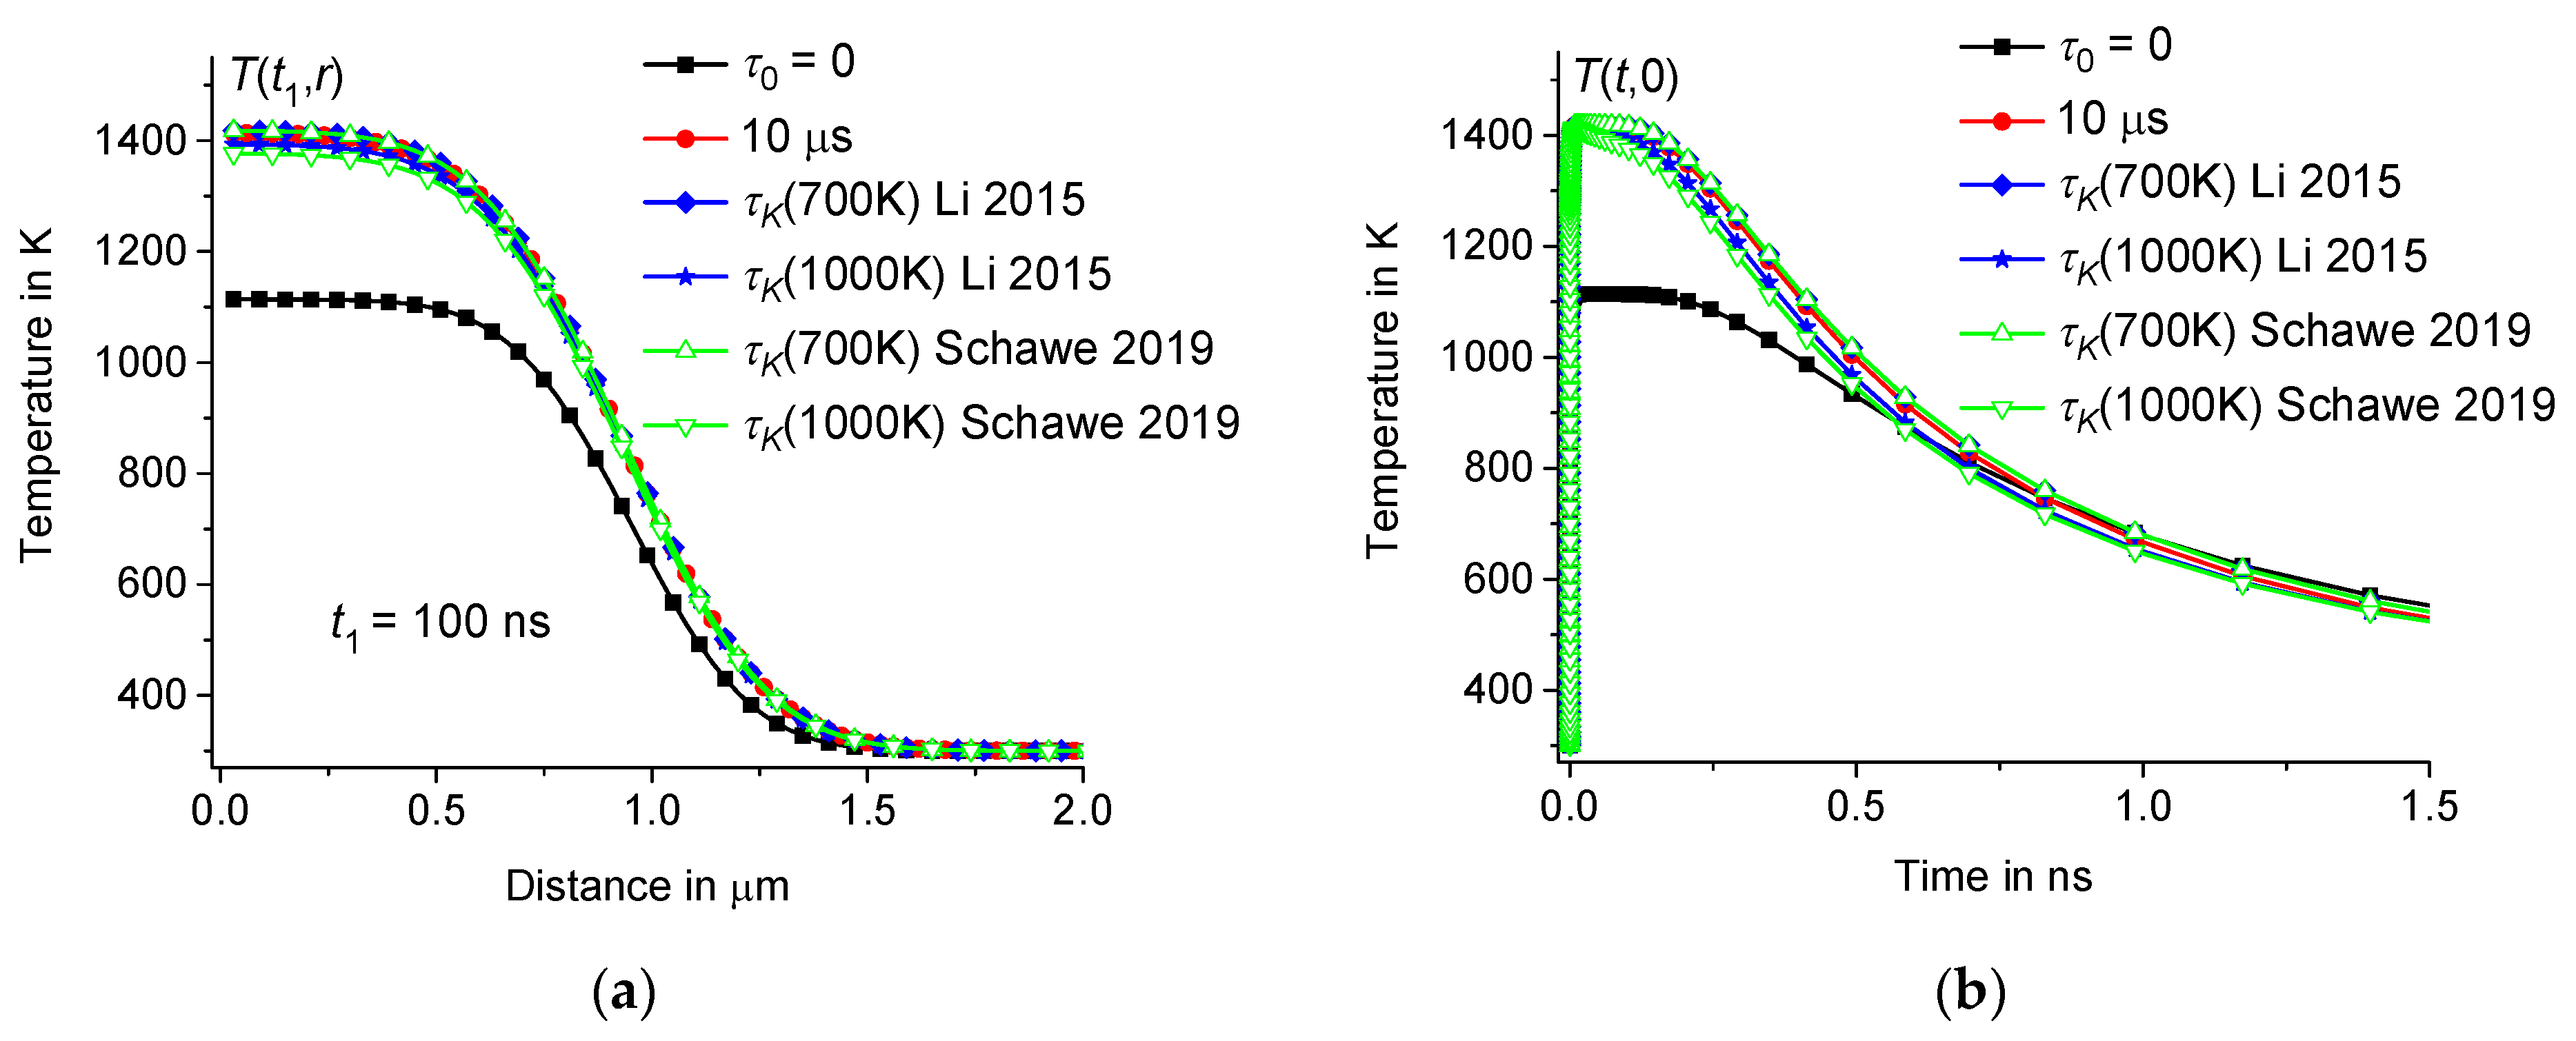
3.3. Dependence of on the Distribution of Relaxation Times


| Substance | Hz | K | K |
|---|---|---|---|
| Borosilicate glass | 5·1017 | 1.9·104 | 392 |
| Sodium-lime-magnesium-silicate glass | 1·1014 | 1.1·104 | 480 |
| Sodium-silicate glass | 1.24·1014 | 1.29·104 | 407 |
3.4. Dependence of on the Size of the Heating Zone
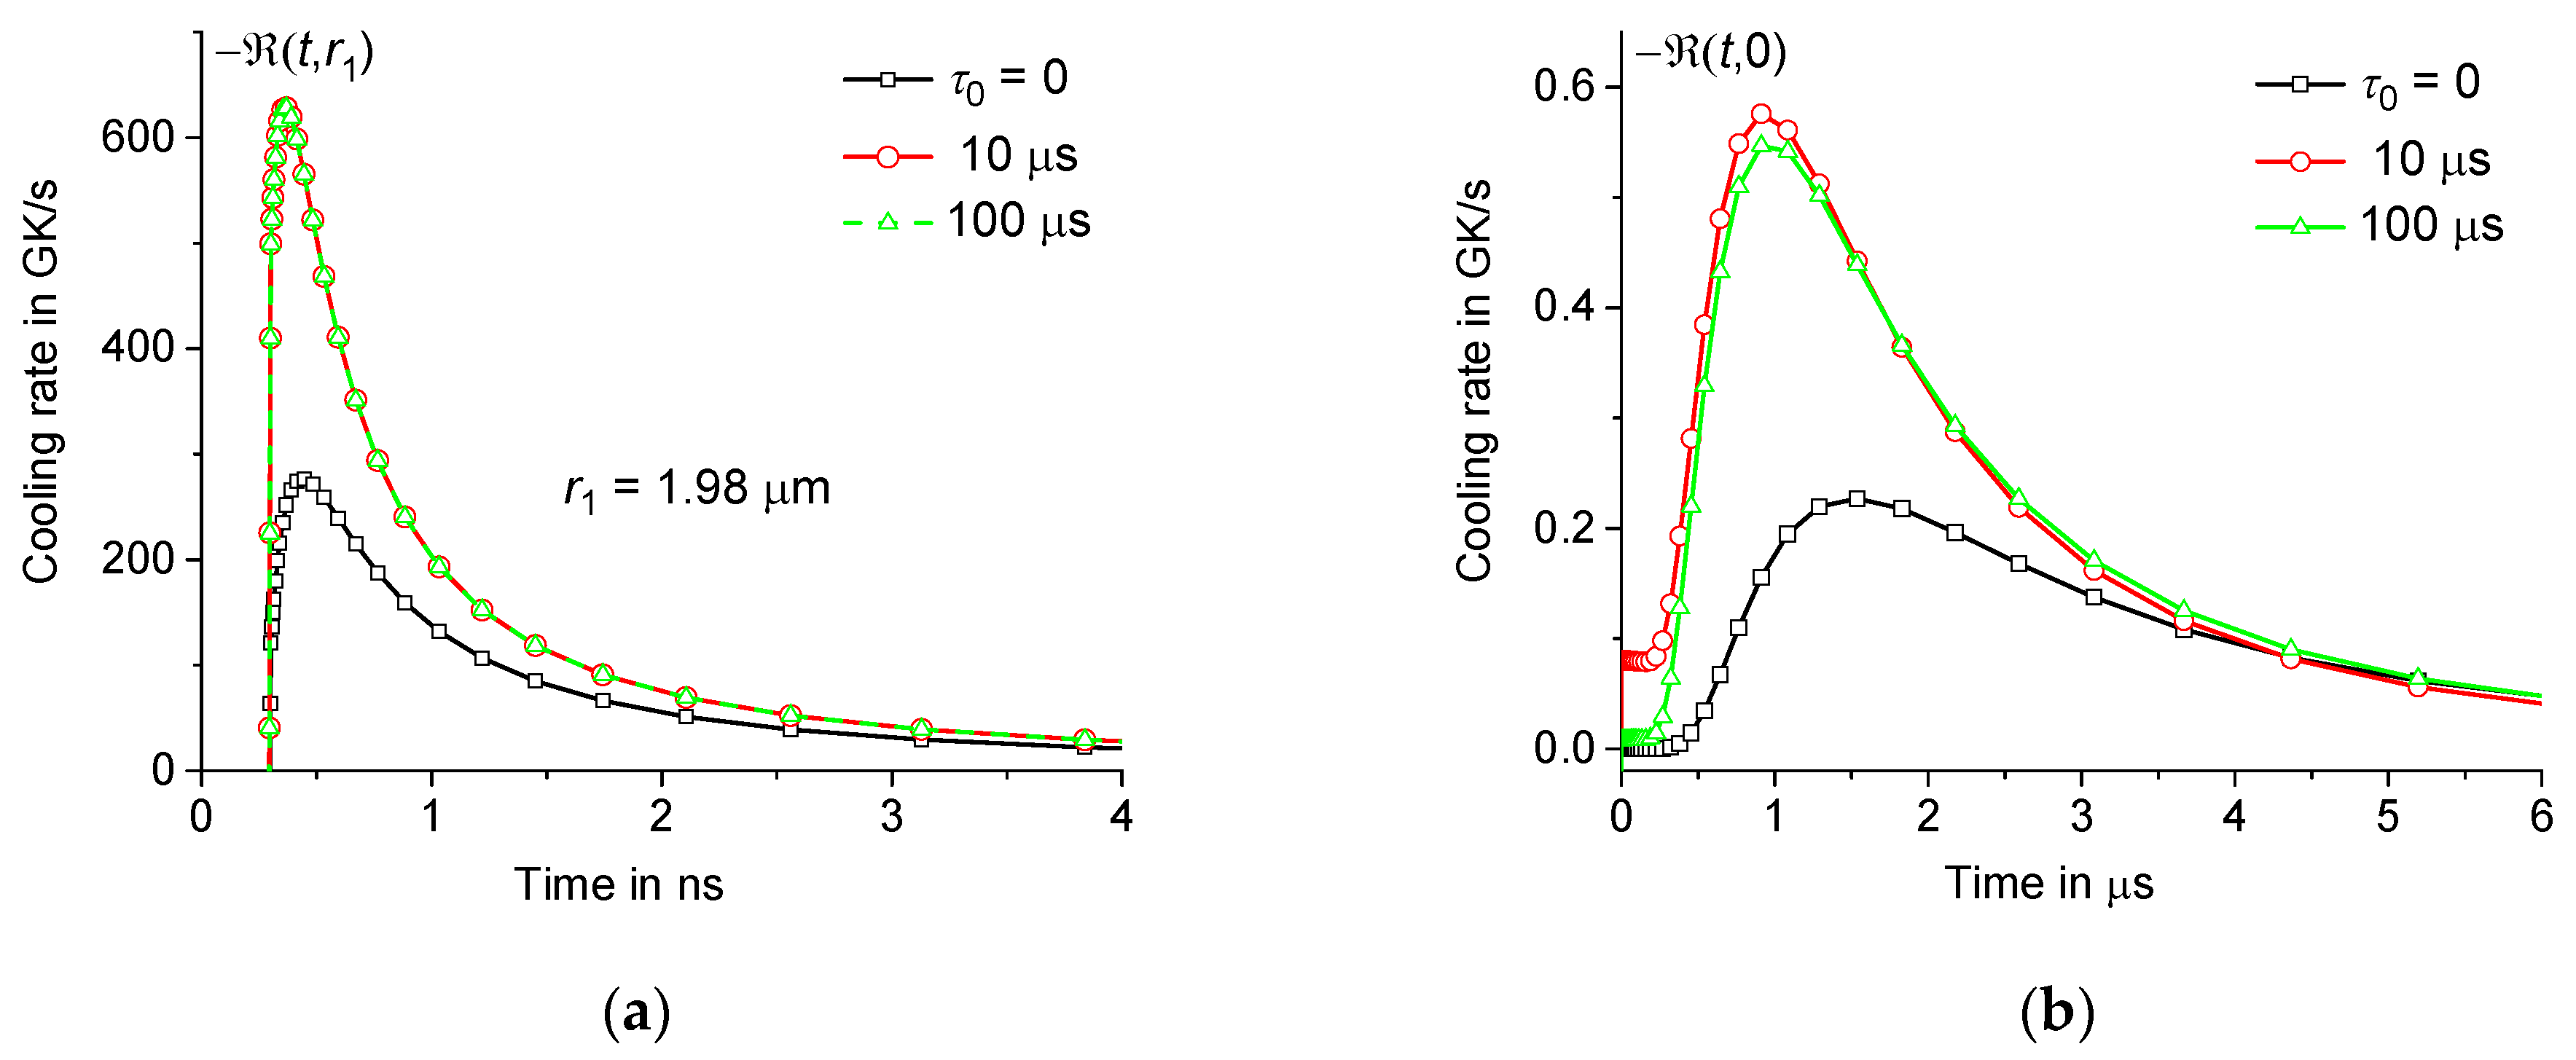
4. Cooling Rate Distribution and Its Influence on Microstructuring Processes of Glasses
5. Discussion
6. Conclusions
Author Contributions
Funding
Institutional Review Board Statement
Informed Consent Statement
Data Availability Statement
Acknowledgments
Conflicts of Interest
Nomenclature
| Latin Symbols | |
| and | Parameters of the VFTH equation (K) |
| Heat capacity of the solid material (J·kg−1·K−1) | |
| Heat capacity of the liquid material (J·kg−1·K−1) | |
| , | Initial and equilibrium heat capacities (J·kg−1·K−1) |
| Dynamic heat capacity (J·kg−1·K−1) | |
| Thermal diffusivity (m2·s−1) | |
| Energy of laser pulse (nJ) | |
| Parameter of the VFTH equation (Hz) | |
| Time dependence of the pulse power (dimensionless) | |
| Fundamental solution of the Fourier heat equation (m−3) | |
| Distribution function (s−1) | |
| Bulk modulus (GPa) | |
| (K·s−1) | |
| Cooling rate (K·s−1) | |
| Parameter of the boundary value problem (μm) | |
| Heating zone radius (μm) | |
| Distance from the center of the hot zone (μm) | |
| Time (s) | |
| Temperature distribution obtained from fundamental solution (K) | |
| Local temperature distribution (K) | |
| (K) | |
| Glass transition temperature (K) | |
| Initial temperature (K) | |
| Intermediate temperature (K) | |
| (K) | |
| Heating zone volume (m3) | |
| Specific volume (m3·kg−1) | |
| Longitudinal speed of sound (m·s−1) | |
| Greek Symbols | |
| Linear thermal expansion (K−1) | |
| Volumetric thermal expansion coefficient (K−1) | |
| Parameter of the Kohlrausch relaxation law (dimensionless) | |
| Relaxation parameter (dimensionless) | |
| (dimensionless) | |
| Thermal conductivity (W·m−1·K−1) | |
| Relaxation parameter (dimensionless) | |
| Density (kg·m−3) | |
| Debye relaxation time (μs) | |
| Kohlrausch relaxation time (μs) | |
| Duration of laser pulse (fs) | |
| nth relaxation time (μs) | |
| Duration of heating pulse (ps) | |
| Volumetric heat flux density (W·m−3) | |
| Volumetric heat flux density (W·m−3) | |
| nth Fourier component (W·m−2) | |
| nth Fourier component (K·m) | |
| Temperature modulation frequency (rad·s−1) | |
Appendix A
References
- Zhang, B.; Wang, Z.; Tan, D.; Liu, X.; Xu, B.; Tong, L.; Kazansky, P.G.; Qiu, J. Ultrafast Laser Inducing Continuous Periodic Crystallization in the Glass Activated via Laser-Prepared Crystallite-Seeds. Adv. Optical Mater. 2021, 9, 2001962. [Google Scholar] [CrossRef]
- Osellame, R.; Hoekstra, H.J.W.M.; Cerullo, G.; Pollnau, M. Femtosecond laser microstructuring: An enabling tool for optofluidic lab-on-chips. Laser Photonics Rev. 2011, 5, 442–463. [Google Scholar] [CrossRef]
- Lei, Y.; Wang, H.; Shayeganrad, G.; Kazansky, P.G. Ultrafast laser nanostructuring in transparent materials for beam shaping and data storage. Opt. Mater. Express 2022, 12, 3327–3355. [Google Scholar] [CrossRef]
- Stoian, R.; Colombier, J.P. Advances in ultrafast laser structuring of materials at the nanoscale. Nanophotonics 2020, 9, 4665–4688. [Google Scholar] [CrossRef]
- Butkute, A.; Jonusauskas, L. 3D Manufacturing of Glass Microstructures Using Femtosecond Laser. Micromachines 2021, 12, 499. [Google Scholar] [CrossRef] [PubMed]
- Petit, Y.; Danto, S.; Guerineau, T.; Khalil, A.A.; Camus, A.; Fargin, E.; Duchateau, G.; Berube, J.P.; Vallee, R.; Messaddeq, Y.; et al. On the femtosecond laser-induced photochemistry in silver-containing oxide glasses: Mechanisms, related optical and physico-chemical properties, and technological applications. Adv. Opt. Technol. 2018, 7, 291–309. [Google Scholar] [CrossRef]
- Torun, G.; Yadav, A.; Richardson, K.A.; Bellouard, Y. Ultrafast Laser Direct-Writing of Self-Organized Microstructures in Ge-Sb-S Chalcogenide Glass. Front. Phys. 2022, 10, 883319. [Google Scholar] [CrossRef]
- Lipatiev, A.S.; Lotarev, S.V.; Lipateva, T.O.; Fedotov, S.S.; Lopatina, E.V.; Sigaev, V.N. Ultrafast-Laser-Induced Tailoring of Crystal-in-Glass Waveguides by Precision Partial Remelting. Micromachines 2023, 14, 801. [Google Scholar] [CrossRef]
- Lipatiev, A.; Lotarev, S.; Lipateva, T.; Okhrimchuk, A.; Fedotov, S.; Lotnyk, A.; Sigaev, V. Fabrication of single-mode hybrid crystal-glass waveguides by direct femtosecond laser writing and thermal annealing. Mater. Res. Bull. 2022, 152, 111840. [Google Scholar] [CrossRef]
- Beresna, M.; Gecevicius, M.; Kazansky, P.G. Ultrafast laser direct writing and nanostructuring in transparent materials. Adv. Opt. Photonics 2014, 6, 293–339. [Google Scholar] [CrossRef]
- Shakhgildyan, G.Y.; Lipatiev, A.S.; Fedotov, S.S.; Vetchinnikov, M.P.; Lotarev, S.V.; Sigaev, V.N. Microstructure and optical properties of tracks with precipitated silver nanoparticles and clusters inscribed by the laser irradiation in phosphate glass. Ceram. Int. 2021, 47, 14320–14329. [Google Scholar] [CrossRef]
- Jurgens, P.; Liewehr, B.; Kruse, B.; Peltz, C.; Witting, T.; Husakou, A.; Rouzee, A.; Ivanov, M.Y.; Fennel, T.; Vrakking, M.J.J.; et al. Characterization of laser-induced ionization dynamics in solid dielectrics. ACS Photonics 2022, 9, 233–240. [Google Scholar] [CrossRef]
- Seuthe, T.; Mermillod-Blondin, A.; Grehn, M.; Bonse, J.; Wondraczek, L.; Eberstein, M. Structural relaxation phenomena in silicate glasses modified by irradiation with femtosecond laser pulses. Sci. Rep. 2017, 7, 43815. [Google Scholar] [CrossRef] [PubMed]
- Bonse, J.; Seuthe, T.; Grehn, M.; Eberstein, M.; Rosenfeld, A.; Mermillod-Blondin, A. Time-resolved microscopy of fs-laser-induced heat flows in glasses. Appl. Phys. A 2018, 124, 60. [Google Scholar] [CrossRef]
- Meany, T.; Grafe, M.; Heilmann, R.; Perez-Leija, A.; Gross, S.; Steel, M.J.; Withford, M.J.; Szameit, A. Laser written circuits for quantum photonics. Laser Photonics Rev. 2015, 9, 363–384. [Google Scholar] [CrossRef]
- Nasu, Y.; Abe, M.; Kohtoku, M. Developments in laser processing for silica-based planar lightwave circuits. In Proceedings of the SPIE 6107, Laser-Based Micropackaging, San Jose, CA, USA, 23 February 2006; p. 61070B. [Google Scholar] [CrossRef]
- Tan, D.; Zhang, B.; Qiu, J. Ultrafast Laser Direct Writing in Glass: Thermal Accumulation Engineering and Applications. Laser Photonics Rev. 2021, 15, 2000455. [Google Scholar] [CrossRef]
- Lu, J.; Tian, J.; Poumellec, B.; Garcia-Caurel, E.; Ossikovski, R.; Zeng, X.; Lancry, M. Tailoring chiral optical properties by femtosecond laser direct writing in silica. Light Sci. Appl. 2023, 12, 46. [Google Scholar] [CrossRef]
- Juodkazis, S.; Horyama, M.; Miwa, M.; Watanabe, M.; Marcinkevicius, A.; Mizeikis, V.; Matsuo, S.; Misawa, H. Stereolithography and 3D microstructuring of transparent materials by femtosecond laser irradiation. Proc. SPIE 2002, 4644, 27–38. [Google Scholar] [CrossRef]
- Lencer, D.; Salinga, M.; Wuttig, M. Design Rules for Phase-Change Materials in Data Storage Applications. Adv. Mater. 2011, 23, 2030–2058. [Google Scholar] [CrossRef]
- Hong, J.; Li, J.; Chu, D. Modulation approach of arbitrary linear polarization states of optical fields using single-beam coding for next-generation optical storage in glass. Opt. Laser Technol. 2023, 164, 109539. [Google Scholar] [CrossRef]
- Lee, B.S.; Burr, G.W.; Shelby, R.M.; Raoux, S.; Rettner, C.T.; Bogle, S.N.; Darmawikarta, K.; Bishop, S.G.; Abelson, J.R. Observation of the role of subcritical nuclei in crystallization of a glassy solid. Science 2009, 326, 980–984. [Google Scholar] [CrossRef] [PubMed]
- Wang, Z.; Tan, D.; Qiu, J. Single-shot photon recording for three-dimensional memory with prospects of high capacity. Opt. Lett. 2020, 45, 6274–6277. [Google Scholar] [CrossRef]
- Huang, X.; Guo, Q.; Yang, D.; Xiao, X.; Liu, X.; Xia, Z.; Fan, F.; Qiu, J.; Dong, G. Reversible 3D laser printing of perovskite quantum dots inside a transparent medium. Nat. Photonics 2020, 14, 82–88. [Google Scholar] [CrossRef]
- Li, X.; Wu, Y.; Lin, H.; Chen, G.; Hao, Y.; Wang, P.; Lin, S.; Xu, J.; Cheng, Y.; Wang, Y. Photochromic 3D Optical Storage: Laser-Induced Regulation of Localized Optical Basicity of Glass. Laser Photonics Rev. 2023, 18, 2300744. [Google Scholar] [CrossRef]
- Jin, M.; Zhou, W.; Ma, W.; Wang, Q.; Liang, X.; Zhang, P.; Xiang, W. The inhibition of CsPbBr3 nanocrystals glass from self-crystallization with the assistance of ZnO modulation for rewritable data storage. Chem. Eng. J. 2022, 427, 129812. [Google Scholar] [CrossRef]
- Sun, S.; Cheng, Z.; Song, J.; Yan, C.; Man, T.; Dong, G.; Qian, B.; Qiu, J. Low-Power-Consumption, Reversible 3D Optical Storage Based on Selectively Laser-Induced Photoluminescence Degradation in CsPbBr3 Quantum Dots Doped Glass. Adv. Mater. Technol. 2022, 7, 2200470. [Google Scholar] [CrossRef]
- Wang, H.; Lei, Y.; Wang, L.; Sakakura, M.; Yu, Y.; Shayeganrad, G.; Kazansky, P.G. 100-Layer Error-Free 5D Optical Data Storage by Ultrafast Laser Nanostructuring in Glass. Laser Photonics Rev. 2022, 16, 2100563. [Google Scholar] [CrossRef]
- Fedotov, S.; Lipatiev, A.; Lipateva, T.; Lotarev, S.; Melnikov, E.; Sigaev, V. Femtosecond laser-induced birefringent microdomains in sodium-borate glass for highly secure data storage. J. Am. Ceram. Soc. 2021, 104, 4297–4303. [Google Scholar] [CrossRef]
- Su, Z.; Sun, S.; Dai, Y.; Liu, X.; Qiu, J. Femtosecond laser direct-writing of perovskite nanocrystals in glasses. J. Non-Cryst. Solids X 2023, 18, 100182. [Google Scholar] [CrossRef]
- Azkona, J.J.; Martinez-Calderon, M.; Granados, E.; Gomez-Aranzadi, M.; Rodriguez, A.; Olaizola, S.M. Femtosecond laser fabrication of volume-phase gratings in CdSxSe1−x doped borosilicate glass at a low repetition rate. Appl. Opt. 2019, 58, 4220–4226. [Google Scholar] [CrossRef]
- Lotarev, S.V.; Fedotov, S.S.; Pomigueva, A.I.; Lipatiev, A.S.; Sigaev, V.N. Effect of Pulse Repetition Rate on Ultrafast Laser-Induced Modification of Sodium Germanate Glass. Nanomaterials 2023, 13, 1208. [Google Scholar] [CrossRef]
- Vetchinnikov, M.P.; Lipatiev, A.S.; Shakhgildyan, G.Y.; Golubev, N.V.; Ignateva, E.S.; Fedotov, S.S.; Lipatieva, T.O.; Lotarev, S.V.; Vilkovisky, G.A.; Sigaev, V.N. Direct femtosecond laser-induced formation of CdS quantum dots inside silicate glass. Opt. Lett. 2018, 43, 2519–2522. [Google Scholar] [CrossRef]
- Bera, D.; Qian, L.; Tseng, T.K.; Holloway, P.H. Quantum Dots and Their Multimodal Applications: A Review. Materials 2010, 3, 2260–2345. [Google Scholar] [CrossRef]
- Lipatiev, A.S.; Shakhgildyan, G.Y.; Vetchinnikov, M.P.; Lotarev, S.V.; Lipatieva, T.O.; Sigaev, V.N. Laser writing of luminescent microdomains with CdS quantum dots in silicate glass. Glass Ceram. 2021, 77, 369–371. [Google Scholar] [CrossRef]
- Korkut, C.; Cınar, K.; Kabacelik, I.; Turan, R.; Kulakcı, M.; Bek, A. Laser Crystallization of Amorphous Ge Thin Films via a Nanosecond Pulsed Infrared Laser. Cryst. Growth Des. 2021, 21, 4632–4639. [Google Scholar] [CrossRef]
- Zhang, Y.; Liu, H.; Mo, J.; Wang, M.; Chen, Z.; He, Y.; Yang, W.; Tang, C. Atomic-level crystallization in selective laser melting fabricated Zr-based metallic glasses. Phys. Chem. Chem. Phys. 2019, 21, 12406–12413. [Google Scholar] [CrossRef] [PubMed]
- Phillips, K.C.; Gandhi, H.H.; Mazur, E.; Sundaram, S.K. Ultrafast laser processing of materials: A review. Adv. Opt. Photonics 2015, 7, 684–712. [Google Scholar] [CrossRef]
- Tan, D.; Sharafudeen, K.N.; Yue, Y.; Qiu, J. Femtosecond laser induced phenomena in transparent solid materials: Fundamentals and applications. Prog. Mater. Sci. 2016, 76, 154–228. [Google Scholar] [CrossRef]
- Ams, M.; Marshall, G.D.; Dekker, P.; Dubov, M.; Mezentsev, V.K.; Bennion, I.; Withford, M.J. Investigation of Ultrafast Laser–Photonic Material Interactions: Challenges for Directly Written Glass Photonics. IEEE J. Sel. Top. Quantum Electron. 2008, 14, 1370–1381. [Google Scholar] [CrossRef]
- Gamaly, E.G.; Juodkazis, S.; Nishimura, K.; Misawa, H.; Luther-Davies, B.; Hallo, L.; Nicolai, P.; Tikhonchuk, V.T. Laser-matter interaction in the bulk of a transparent solid: Confined microexplosion and void formation. Phys. Rev. B 2006, 73, 214101. [Google Scholar] [CrossRef]
- Schaffer, C.B.; Brodeur, A.; Mazur, E. Laser-induced breakdown and damage in bulk transparent materials induced by tightly focused femtosecond laser pulses. Meas. Sci. Technol. 2001, 12, 1784–1794. [Google Scholar] [CrossRef]
- Lancry, M.; Regnier, E.; Poumellec, B. Fictive temperature in silica-based glasses and its application to optical fiber manufacturing. Prog. Mater. Sci. 2012, 57, 63–94. [Google Scholar] [CrossRef]
- Debenedetti, P.; Stillinger, F. Supercooled liquids and the glass transition. Nature 2001, 410, 259–267. [Google Scholar] [CrossRef]
- Yoshino, T.; Ozeki, Y.; Matsumoto, M.; Itoh, K. In situ Micro-Raman Investigation of Spatio-Temporal Evolution of Heat in Ultrafast Laser Microprocessing of Glass. Jpn. J. Appl. Phys. 2012, 51, 102403. [Google Scholar] [CrossRef]
- Richter, S.; Hashimoto, F.; Zimmermann, F.; Ozeki, Y.; Itoh, K.; Tunnermann, A.; Nolte, S. Spatial and temporal temperature distribution of ultrashort pulse induced heat accumulation in glass. In Frontiers in Ultrafast Optics: Biomedical, Scientific, and Industrial Applications XV, Proceedings of the SPIE LASE, San Francisco, CA, USA, 7–12 February 2015; Heisterkamp, A., Herman, P.R., Meunier, M., Nolte, S., Eds.; SPIE: Bellingham, WA, USA, 2015; Volume 9355. [Google Scholar] [CrossRef]
- Richter, S.; Zimmermann, F.; Tunnermann, A.; Nolte, S. Laser welding of glasses at high repetition rates—Fundamentals and prospects. Opt. Laser Technol. 2016, 83, 59–66. [Google Scholar] [CrossRef]
- Shakhgildyan, G.Y.; Lipatiev, A.S.; Vetchinnikov, M.P.; Popova, V.V.; Lotarev, S.V.; Golubev, N.V.; Ignateva, E.S.; Presniakov, M.M.; Sigaev, V.N. One-step micro-modification of optical properties in silver-doped zinc phosphate glasses by femtosecond direct laser writing. J. Non-Cryst. Sol. 2018, 481, 634–642. [Google Scholar] [CrossRef]
- Kunwar, P.; Soman, P. Direct Laser Writing of Fluorescent Silver Nanoclusters: A Review of Methods and Applications. ACS Appl. Nano Mater. 2020, 3, 7325–7342. [Google Scholar] [CrossRef] [PubMed]
- Varkentina, N.; Cardinal, T.; Morote, F.; Mounaix, P.; Andre, P.; Deshayes, Y.; Canioni, L. Examination of femtosecond laser matter interaction in multipulse regime for surface nanopatterning of vitreous substrates. Opt. Express 2013, 21, 29090–29100. [Google Scholar] [CrossRef] [PubMed]
- Chen, L.; Guo, C.; Pan, M.; Lai, C.; Wang, Y.; Liao, G.; Ma, Z.; Zhang, F.; Suriyaprakash, J.; Guo, L.; et al. Sub-40 nm nanogratings self-organized in PVP-based polymer composite film by photoexcitation and two sequent splitting under femtosecond laser irradiation. Appl. Surf. Sci. 2023, 609, 155395. [Google Scholar] [CrossRef]
- Shimizu, M.; Sakakura, M.; Ohnishi, M.; Shimotsuma, Y.; Nakaya, T.; Miura, K.; Hirao, K. Mechanism of heat-modification inside a glass after irradiation with high-repetition rate femtosecond laser pulses. J. Appl. Phys. 2010, 108, 073533. [Google Scholar] [CrossRef]
- Sakakura, M.; Terazima, M. Initial temporal and spatial changes of the refractive index induced by focused femtosecond pulsed laser irradiation inside a glass. Phys. Rev. B 2005, 71, 024113. [Google Scholar] [CrossRef]
- Shimotsuma, Y.; Sakakura, M.; Miura, K.; Qiu, J.; Kazansky, P.G.; Fujita, K.; Hirao, K. Application of femtosecond-laser induced nanostructures in optical memory. J. Nanosci. Nanotechnol. 2007, 7, 94–104. [Google Scholar] [CrossRef]
- Macedo, G.N.B.M.; Sawamura, S.; Wondraczek, L. Lateral hardness and the scratch resistance of glasses in the Na2O-CaO-SiO2 system. J. Non-Cryst. Sol. 2018, 492, 94–101. [Google Scholar] [CrossRef]
- Gonzalez-Oliver, C.J.R.; James, P.F. Crystal nucleation and growth in a Crystal nucleation and growth in a Na2O·2CaO·3SiO2 glass. J. Non-Cryst. Sol. 1980, 38–39, 699–704. [Google Scholar] [CrossRef]
- Huang, J.; Gupta, P.K. Temperature dependence of the isostructural heat capacity of a soda lime silicate glass. J. Non-Cryst. Sol. 1992, 139, 239–247. [Google Scholar] [CrossRef]
- Liu, B.; Liu, Q.; Li, B.; Behrens, H.; Lange, R.A. Ultrasonic studies of alkali-rich hydrous silicate glasses: Elasticity, density, and implications for water dissolution mechanisms. Am. Mineral. 2023, 108, 744–753. [Google Scholar] [CrossRef]
- Wang, M.; Cheng, J.; Li, M.; He, F.; Deng, W. Viscosity and thermal expansion of soda-lime-silica glass doped with Gd2O3 and Y2O3. Solid State Sci. 2012, 14, 1233–1237. [Google Scholar] [CrossRef]
- Bouras, N.; Madjoubi, M.A.; Kolli, M.; Benterki, S.; Hamidouche, M. Thermal and mechanical characterization of borosilicate glass. Phys. Procedia 2009, 2, 1135–1140. [Google Scholar] [CrossRef]
- Wereszczak, A.A.; Anderson Jr, C.E. Borofloat and Starphire Float Glasses: A Comparison. Int. J. Appl. Glass Sci. 2014, 5, 334–344. [Google Scholar] [CrossRef]
- George, J.L.; Sugawara, T.; Ohira, T.; Kruger, A.A.; Vienna, J.D. Heat capacity of complex aluminoborosilicate glasses. Int. J. Appl. Glass Sci. 2022, 13, 576–590. [Google Scholar] [CrossRef]
- Moynihan, C.T.; Easteal, A.J.; De Bolt, M.A.; Tucker, J. Dependence of the Fictive Temperature of Glass on Cooling Rate. J. Am. Ceram. Soc. 1976, 59, 12–16. [Google Scholar] [CrossRef]
- Lide, D.R. CRC Handbook of Chemistry and Physics, 90th ed.; CRC Press: Boca Raton, FL, USA, 2009; ISBN 13:978-1420090840/ISBN 10:1420090844. [Google Scholar]
- Birge, N.O.; Nagel, S.R. Specific heat spectroscopy of the glass transition. Phys. Rev. Lett. 1985, 54, 2674–2677. [Google Scholar] [CrossRef]
- Korus, J.; Beiner, M.; Busse, K.; Kahle, S.; Unger, R.; Donth, E. Heat capacity spectroscopy at the glass transition in polymers. Thermochim. Acta 1997, 304–305, 99–110. [Google Scholar] [CrossRef]
- Chua, Y.Z.; Schulz, G.; Shoifet, E.; Huth, H.; Zorn, R.; Scmelzer, J.W.P.; Schick, C. Glass transition cooperativity from broad band heat capacity spectroscopy. Colloid Polym. Sci. 2014, 292, 1893–1904. [Google Scholar] [CrossRef]
- Minakov, A.; Schick, C. Nanometer scale thermal response of polymers to fast thermal perturbations. J. Chem. Phys. 2018, 149, 074503. [Google Scholar] [CrossRef]
- Minakov, A.; Schick, C. Integro-Differential Equation for the Non-Equilibrium Thermal Response of Glass-Forming Materials: Analytical Solutions. Symmetry 2021, 13, 256. [Google Scholar] [CrossRef]
- Minakov, A.; Schick, C. Thermal Perturbations at Crystal Nucleation in Glass-Forming Liquids. Energies 2022, 15, 9005. [Google Scholar] [CrossRef]
- Minakov, A.A.; Schick, C. Nanoscale Heat Conduction in CNT-polymer Nanocomposites at Fast Thermal Perturbations. Molecules 2019, 24, 2794. [Google Scholar] [CrossRef]
- Landau, L.D.; Lifshitz, E.M. Course of Theoretical Physics 5: Statistical Physics Part 1, 3rd ed.; Pergamon Press: Oxford, UK, 1980; ISBN 10:0750633727/ISBN 13:978-0750633727. [Google Scholar]
- Landau, L.D.; Lifshitz, E.M. Course of Theoretical Physics 8: Electrodynamics of Continuous Media, 2nd ed.; Pergamon Press: Oxford, UK, 2000; ISBN 10:0750626348/ISBN 13:978-0750626347. [Google Scholar]
- Schilling, R.L.; Song, R.; Vondracek, Z. Bernstein Functions: Theory and Applications; Hubert & Co: Berlin, Germany, 2010; ISBN 978-3-11-021530-4. [Google Scholar] [CrossRef]
- Johnston, D.C. Stretched exponential relaxation arising from a continuous sum of exponential decays. Phys. Rev. B 2006, 74, 184430. [Google Scholar] [CrossRef]
- Berberan-Santos, M.N.; Bodunov, E.N.; Valeur, B. Mathematical functions for the analysis of luminescence decays with underlying distributions 1: Kohlrausch decay function (stretched exponential). Chem. Phys. 2005, 315, 171–182. [Google Scholar] [CrossRef]
- Gupta, P.K.; Moynihan, C.T. Prigogine-Defay ratio for systems with more than one order parameter. J. Chem. Phys. 1976, 65, 4136–4140. [Google Scholar] [CrossRef]
- Sukenaga, S.; Endo, T.; Nishi, T.; Yamada, H.; Ohara, K.; Wakihara, T.; Inoue, K.; Kawanishi, S.; Ohta, H.; Shibata, H. Thermal Conductivity of Sodium Silicate Glasses and Melts: Contribution of Diffusive and Propagative Vibration Modes. Front. Mater. 2021, 8, 753746. [Google Scholar] [CrossRef]
- Kim, Y.; Morita, K. Thermal Conductivity of Molten B2O3, B2O3–SiO2, Na2O–B2O3, and Na2O–SiO2 Systems. J. Am. Ceram. Soc. 2015, 98, 1588–1595. [Google Scholar] [CrossRef]
- Shimizu, M.; Sakakura, M.; Ohnishi, M.; Yamaji, M.; Shimotsuma, Y.; Hirao, K.; Miura, K. Three-dimensional temperature distribution and modification mechanism in glass during ultrafast laser irradiation at high repetition rates. Opt. Express 2012, 20, 934–940. [Google Scholar] [CrossRef][Green Version]
- Sakakura, M.; Terazima, M.; Shimotsuma, Y.; Miura, K.; Hirao, K. Heating and rapid cooling of bulk glass after photoexcitation by a focused femtosecond laser pulse. Opt. Express 2007, 15, 16800–16807. [Google Scholar] [CrossRef]
- Vladimirov, V.S. A Collection of Problems on the Equations of Mathematical Physics; Springer: Berlin/Heidelberg, Germany, 1986; ISBN 978-3-662-05560-1. [Google Scholar] [CrossRef]
- Schawe, J.E.K.; Hess, K.U. The kinetics of the glass transition of silicate glass measured by fast scanning calorimetry. Thermochim. Acta 2019, 677, 85–90. [Google Scholar] [CrossRef]
- Li, Y.Z.; Zhao, L.Z.; Sun, Y.T.; Wen, P.; Bai, H.Y.; Wang, W.H. Effect of dynamical heterogeneity on heat capacity at glass transition in typical silicate glasses. J. Appl. Phys. 2015, 118, 244905. [Google Scholar] [CrossRef]
- Bellec, M.; Royon, A.; Bourhis, K.; Choi, J.; Bousquet, B.; Treguer, M.; Cardinal, T.; Videau, J.J.; Richardson, M.; Canioni, L. 3D Patterning at the Nanoscale of Fluorescent Emitters in Glass. J. Phys. Chem. C 2010, 114, 15584–15588. [Google Scholar] [CrossRef]
- Carrillo, A.J.; Isayev, A.I. Thermal Stresses and Birefringence in Quenched Tubes and Rods: Simulation and Experiment. Polym. Eng. Sci. 2011, 51, 179–200. [Google Scholar] [CrossRef]


| Substance | Density in Solid State g/cm3 | Specific Heat Capacity in the Solid State J/g·K | Volumetric Heat Capacity in Solid State J/m3K | Volumetric Heat Capacity in Liquid State J/m3K | Dynamic Heat Capacity Parameter | Thermal Conductivity W/mK |
|---|---|---|---|---|---|---|
| Sodium-lime-silicate glass | 2.8 | 1.14 | 3.2·106 | 4.4·106 | 0.273 | 1 |
| Borosilicate glass | 2.23 | 1.1 | 2.45·106 | 3.8·106 | 0.355 | 1 |
| Time ns | Distance μm | Cooling Rate GK/s |
|---|---|---|
| 0.5 | 0.985 | 410 |
| 1 | 0.98 | 170 |
| 5 | 0.94 | 31 |
| 10 | 0.92 | 16 |
| 50 | 0.80 | 4 |
| 100 | 0.70 | 2.3 |
Disclaimer/Publisher’s Note: The statements, opinions and data contained in all publications are solely those of the individual author(s) and contributor(s) and not of MDPI and/or the editor(s). MDPI and/or the editor(s) disclaim responsibility for any injury to people or property resulting from any ideas, methods, instructions or products referred to in the content. |
© 2024 by the authors. Licensee MDPI, Basel, Switzerland. This article is an open access article distributed under the terms and conditions of the Creative Commons Attribution (CC BY) license (https://creativecommons.org/licenses/by/4.0/).
Share and Cite
Minakov, A.; Schick, C. Temperature Relaxation in Glass-Forming Materials under Local Fast Laser Excitations during Laser-Induced Microstructuring. Appl. Sci. 2024, 14, 1076. https://doi.org/10.3390/app14031076
Minakov A, Schick C. Temperature Relaxation in Glass-Forming Materials under Local Fast Laser Excitations during Laser-Induced Microstructuring. Applied Sciences. 2024; 14(3):1076. https://doi.org/10.3390/app14031076
Chicago/Turabian StyleMinakov, Alexander, and Christoph Schick. 2024. "Temperature Relaxation in Glass-Forming Materials under Local Fast Laser Excitations during Laser-Induced Microstructuring" Applied Sciences 14, no. 3: 1076. https://doi.org/10.3390/app14031076
APA StyleMinakov, A., & Schick, C. (2024). Temperature Relaxation in Glass-Forming Materials under Local Fast Laser Excitations during Laser-Induced Microstructuring. Applied Sciences, 14(3), 1076. https://doi.org/10.3390/app14031076