Article

Dependence of the Preload on the Tightening Torque for Hydraulic Plugs

1
Faculty of Mechanical Engineering, University of Ljubljana, 1000 Ljubljana, Slovenia
2
Poclain Hydraulics d.o.o., 4226 Žiri, Slovenia
*
Author to whom correspondence should be addressed.
Appl. Sci. 2024, 14(24), 11920; https://doi.org/10.3390/app142411920
Submission received: 22 November 2024 / Revised: 13 December 2024 / Accepted: 17 December 2024 / Published: 19 December 2024
(This article belongs to the Special Issue Research Progress on Hydraulic Fluid and Hydraulic Systems)

Abstract

:
In hydraulics, threaded plugs are used to close various manufacturing holes and other fluid channels. They are preloaded to ensure sufficient sealing force. Since the range of recommended thread and underhead friction coefficients for preloaded threaded connections in the literature is very wide, they are not suitable for accurate determination of the preload–torque relationships of plug–valve connections. In the study, two non-standard plugs with metric threads were equipped with strain gauges and repeatedly tightened three times in valve housings under lubricated and unlubricated conditions. The preload and tightening torque were measured. (1) Although the plug–valve connections had a similar geometry with the same surface roughness of the contacting surfaces, the average overall friction coefficient (uniform thread and underhead friction coefficient) and torque coefficient differed between the two connections in the unlubricated and lubricated conditions by 16% and 18%, respectively. This indicates that even small geometrical differences can have a considerable influence on these coefficients. The overall friction and torque coefficients were between 8% and 17% higher in the unlubricated condition than in the lubricated condition (not statistically proven). (2) The overall friction and torque coefficients decreased with repeated tightening under lubricated conditions. This influence decreased with the number of tightening repetitions. (3) Consideration of the minimum and maximum thread and underhead friction coefficients given in VDI 2230 would lead to an error in the estimated preload of −15% to +86%. In conclusion, for accurate determination of the preload–torque relationship of the plug–valve connections, measurements considering repeated tightening are crucial. These should be performed for each type and size of plug–valve connection separately. To minimize the repeated tightening influence, it is recommended to re-tighten the connections several times before leaving production.

1. Introduction

In hydraulics, threaded plugs are used to close various manufacturing holes and other fluid channels and thus prevent external leakage of the fluid [1,2,3]. To ensure sufficient sealing force (clamping force), the plugs must be preloaded like bolts. Preloaded bolted connections are used in engineering applications (e.g., in [4,5]) to ensure sufficient clamping force and/or to achieve a higher fatigue strength [5] of the structure and are discussed in publications in the field of machine elements, e.g., in [6,7,8].
Preload is normally achieved by tightening the bolt or nut of the bolted connection. Given the relationship between the tightening torque and the preload, the preload in the bolt can be controlled with a torque wrench. In general, only 10% to 20% of the applied torque generates the preload in the bolt, while the rest of the torque is needed to overcome the friction in the bolted joint [9,10]. Therefore, friction plays an essential role in preload formation and its variations have a major influence on the preload [11]. For example, a 5% increase in the underhead or thread friction can reduce the preload by half [9].
For an accurate description of the preload–torque relationship in bolted connections, it is crucial to know the exact tribological conditions in the bolted connections [12,13] in addition to their geometric and material properties and the possible deformation mechanisms involved. An incorrect evaluation of the preload–torque relationship can lead to excessive or insufficient preload, where both may lead to failure of the bolted connection [11] and eventually to failure of the entire engineering structure [14,15]. This is especially important in applications where human safety is involved [16].
In general, the tightening torque must overcome the underhead friction between the bolt head and the connected parts, as well as the thread friction between the male and female threads [17], while the rest of the tightening torque generates the preload in the bolted connection [18]. The preload–torque relationship in preloaded bolts can be described by a constant K, known as the torque coefficient or the nut factor [8]:
T = K · F V · d
where T is the tightening torque [N m], F V the preload [N] and d the nominal thread diameter [m]. Bickford [8] provides some mean values of the torque coefficient for various combinations of joint materials and surface conditions. An approximate value of 0.2 has been given by various authors for typical unlubricated mid-size steel fasteners, while a value of 0.3 has been used by different authors for blind bolted connections [19].
A more advanced model of the preload–torque relationship was introduced by Motosh [17]. This model considers the torque necessary for raising the bolt threads with respect to the nut threads under preload ( T p , i.e., the stretch component), the torque to overcome the friction between the threads ( T t ) and the torque to overcome the underhead friction ( T u ):
T = T p + T t + T u
This preload–torque relationship has been implemented in some standards [20,21]. In VDI 2230 [20], the preload–torque relationship is specified in an extended form for threads with a 60 ° thread angle as follows:
T = F V · [ 0.16 · p + 0.58 · μ t · d 2 + 0.5 · μ u · d u ]
where p is the thread pitch [m], μ t the coefficient of friction between the male and female threads, d 2 the mean thread diameter ( d 2 = d 0.6459 · p ) [m], μ u the coefficient of friction between the bolt head and the flange surface and d u the mean underhead diameter [m].
The underhead friction coefficients μ u given in the literature for bolted connections vary from 0.2 to 0.45 [19] and the thread friction coefficients from vary 0.025 to 0.1 [22] and also vary depending on each application. Due to the complex contact and tribological conditions in bolted connections, especially between the threads (uneven pressure distribution, high pressures [23], deformation of the threads, etc. [8,24,25]), the coefficients of friction given in the literature are often inadequate and their ranges are given too wide for precise calculations of preload. Also, in the case of threaded plugs, which differ from ordinary bolts in their design, it turned out that the friction and torque coefficients given in the literature for bolts inaccurately described their preload–torque relationship. Thus, for a more accurate description of this relationship, the thread and underhead friction coefficients should be measured as standardized [20,21]. Since the measurement of both friction coefficients requires a demanding measurement setup, often only the overall friction coefficient μ m (uniform thread and underhead friction coefficient) is determined. In [16,18], for example, the tightening torque and preload were measured in different bolted joints of the front motorbike suspensions and the overall friction coefficients were calculated as follows [19]:
μ m = T / F V 0.16 · p 0.58 · d 2 + 0.5 · d u
The aim of these two studies was to provide an experimental methodology useful to determining the overall friction coefficients in bolted joints and to precisely relate the tightening torque to the preload. They found that surface finishing, lubrication, the interaction between these two parameters and the number of repeated tightenings were the most influential parameters on the overall friction coefficient.
Morgan and Henshall [26] investigated the effect of joint friction on wheel bolt preload in heavy commercial vehicles. They reported that repeated tightening caused up to a 50% reduction in preload, while a constant state was reached when the bolts were relubricated with engine oil. Güler and Gürsel [27] investigated the friction coefficients of fasteners used in preloaded zinc-coated bolted connections in vehicle chassis after repeated tightening. They emphasized the importance of friction coefficient accuracy for determining the preload–torque relationship of bolted connections. Likewise, as in [16,18], they found that the friction coefficients increased with repeated tightenings, which they attributed to the worn coating material. Cabrera et al. [19] investigated the relationship between tightening torque and preload in extended hollo-bolt blind bolted connections with concrete-filled steel hollow sections by experimental and numerical analyses. They found that the nut factor of these bolts was higher (K = 0.37) than the suggested typical value (K = 0.2) and determined the belonging friction coefficients ( μ t = 0.04 , μ u = 0.3 ).
Other studies investigated the preload–torque relationship of preloaded bolted connections (e.g., [11,25,28]), but none of them were performed on hydraulic plugs. The main aims of the present study were (1) to determine the preload–torque relationship of two non-standard threaded hydraulic plugs under lubricated and unlubricated conditions by determination of their overall friction coefficient μ m and torque coefficient K, (2) to analyze the influence of repeated tightening on these two coefficients and (3) to analyze the possible error made in the plug preload in case friction coefficients from the literature would be used for calculation of the necessary tightening torque.

2. Materials and Methods

Two non-standard plugs (steel 11SMn30, EN 10277:2018 [29]) with metric threads (M33 × 2.0 and M27 × 1.5, Poclain Hydraulics d.o.o., Žiri, Slovenia) were repeatedly tightened and loosened six times into hydraulic valves (cast iron GJS-400) up to the prescribed tightening torques (110 N m for M33 × 2.0 and 135 N m for M27 × 1.5). The first three tightenings were performed under lubricated conditions, while the following three were under unlubricated conditions. In order to measure the preload, the original plugs had to be modified (Figure 1). To gain space for the strain gauges, the studs of the plugs were extended, and bushings were added as extensions of the clamped parts. When tightened, these bushings rotated with the plugs. The surface of the bushings that came into contact with the valve housing had the same geometry and surface roughness as the underhead surface of the original plugs, thus the preload–torque relationship was the same as for the original plugs.
In the lubricated conditions, the contacting surfaces between the plugs and the valves were oiled with mineral hydraulic oil (ISO VG46, Olma, Ljubljana, Slovenia), while in the unlubricated conditions, these surfaces were precisely degreased with a brake cleaner (petroleum light distillate with 2-propanol, Adolf Würth GmbH & Co. KG, Künzelsau-gaisbach, Germany) in two steps: in the first step, the applied brake cleaner was wiped off with a clean paper towel, and after the second application of the brake cleaner, it was blown away with clean compressed air.
The preload in the plugs was measured using four strain gauges (FLAB-3-11-1LJB-F, Tokyo Measuring Instruments Lab. Co., Ltd., Shinagawa City, Tokyo, Japan, gauge factor k = 2.08, resistance of 120 ± 0.5 Ω) connected in a type III full bridge configuration [30]. Two of the strain gauges measured the axial strain of the studs and were attached to the extended studs, while the other two strain gauges, intended for temperature compensation, were attached to the plugs in their transverse/circular direction (Figure 1).
The tightening torque was controlled using a custom-made torque wrench (Figure 2a,b) equipped with four strain gauges (FLAB-03-11-1LJC-F, Tokyo Measuring Instruments Lab. Co., Ltd., gauge factor k = 2.29, resistance of 120 ± 0.5 Ω) connected in a type I full bridge configuration [30].
Since the reliability of the results depended on the accuracy of the plug and torque wrench sensors, they were cautiously designed and precisely calibrated (see Appendix A). Multiple preliminary variations of the sensors were made before the final design. Since all the sensors had a highly linear characteristic, they were calibrated at single fixed loads.
Before the measurements, the plugs were lightly screwed into the valve housings, so that the bushings of the plugs came into loose contact with the housings. Next, the jaw of the torque wrench was placed on the hexagonal head of the plug while the handle of the torque wrench was vertically supported (Figure 2b). To ensure a controlled tightening torque, the tightening force of the torque wrench was applied by screwing a threaded rod into a fixed nut (Figure 2b). To fit the torque wrench on both plugs, jaws of different sizes were used.
All sensors were connected to a data acquisition system (SCXI 1520, National Instruments Corporation, Austin, TX, USA) and a measurement station (NI PXIw-1062Q, National Instruments Corporation, Austin, TX, USA). The strain gauges were supplied with a DC voltage of 5 V. The output signal of all sensors was recorded at a frequency of 100 Hz and processed in LabView 16.0 (National Instruments Corporation, Austin, TX, USA). The sensors were calibrated before the measurements (Appendix A) and connected to the measurement system for at least 24 h before each measurement to achieve stable temperature conditions. Before the measurements, all sensors were set to zero. For clarity, the measuring procedure taken for each plug–valve connection is provided in steps:
  • Calibration of the torque wrench and force sensors of the plugs.
  • Lubrication of the threads.
  • Tightening of the plugs till loose contact with valve housing.
  • Placement of the torque wrench on the plug head.
  • Zeroing of the sensors.
  • Tightening and loosening of the plugs three times.
  • Removing the plugs.
  • Degreasing of plug and valve threads.
  • Repetition of steps from 3 to 7.

Data Processing

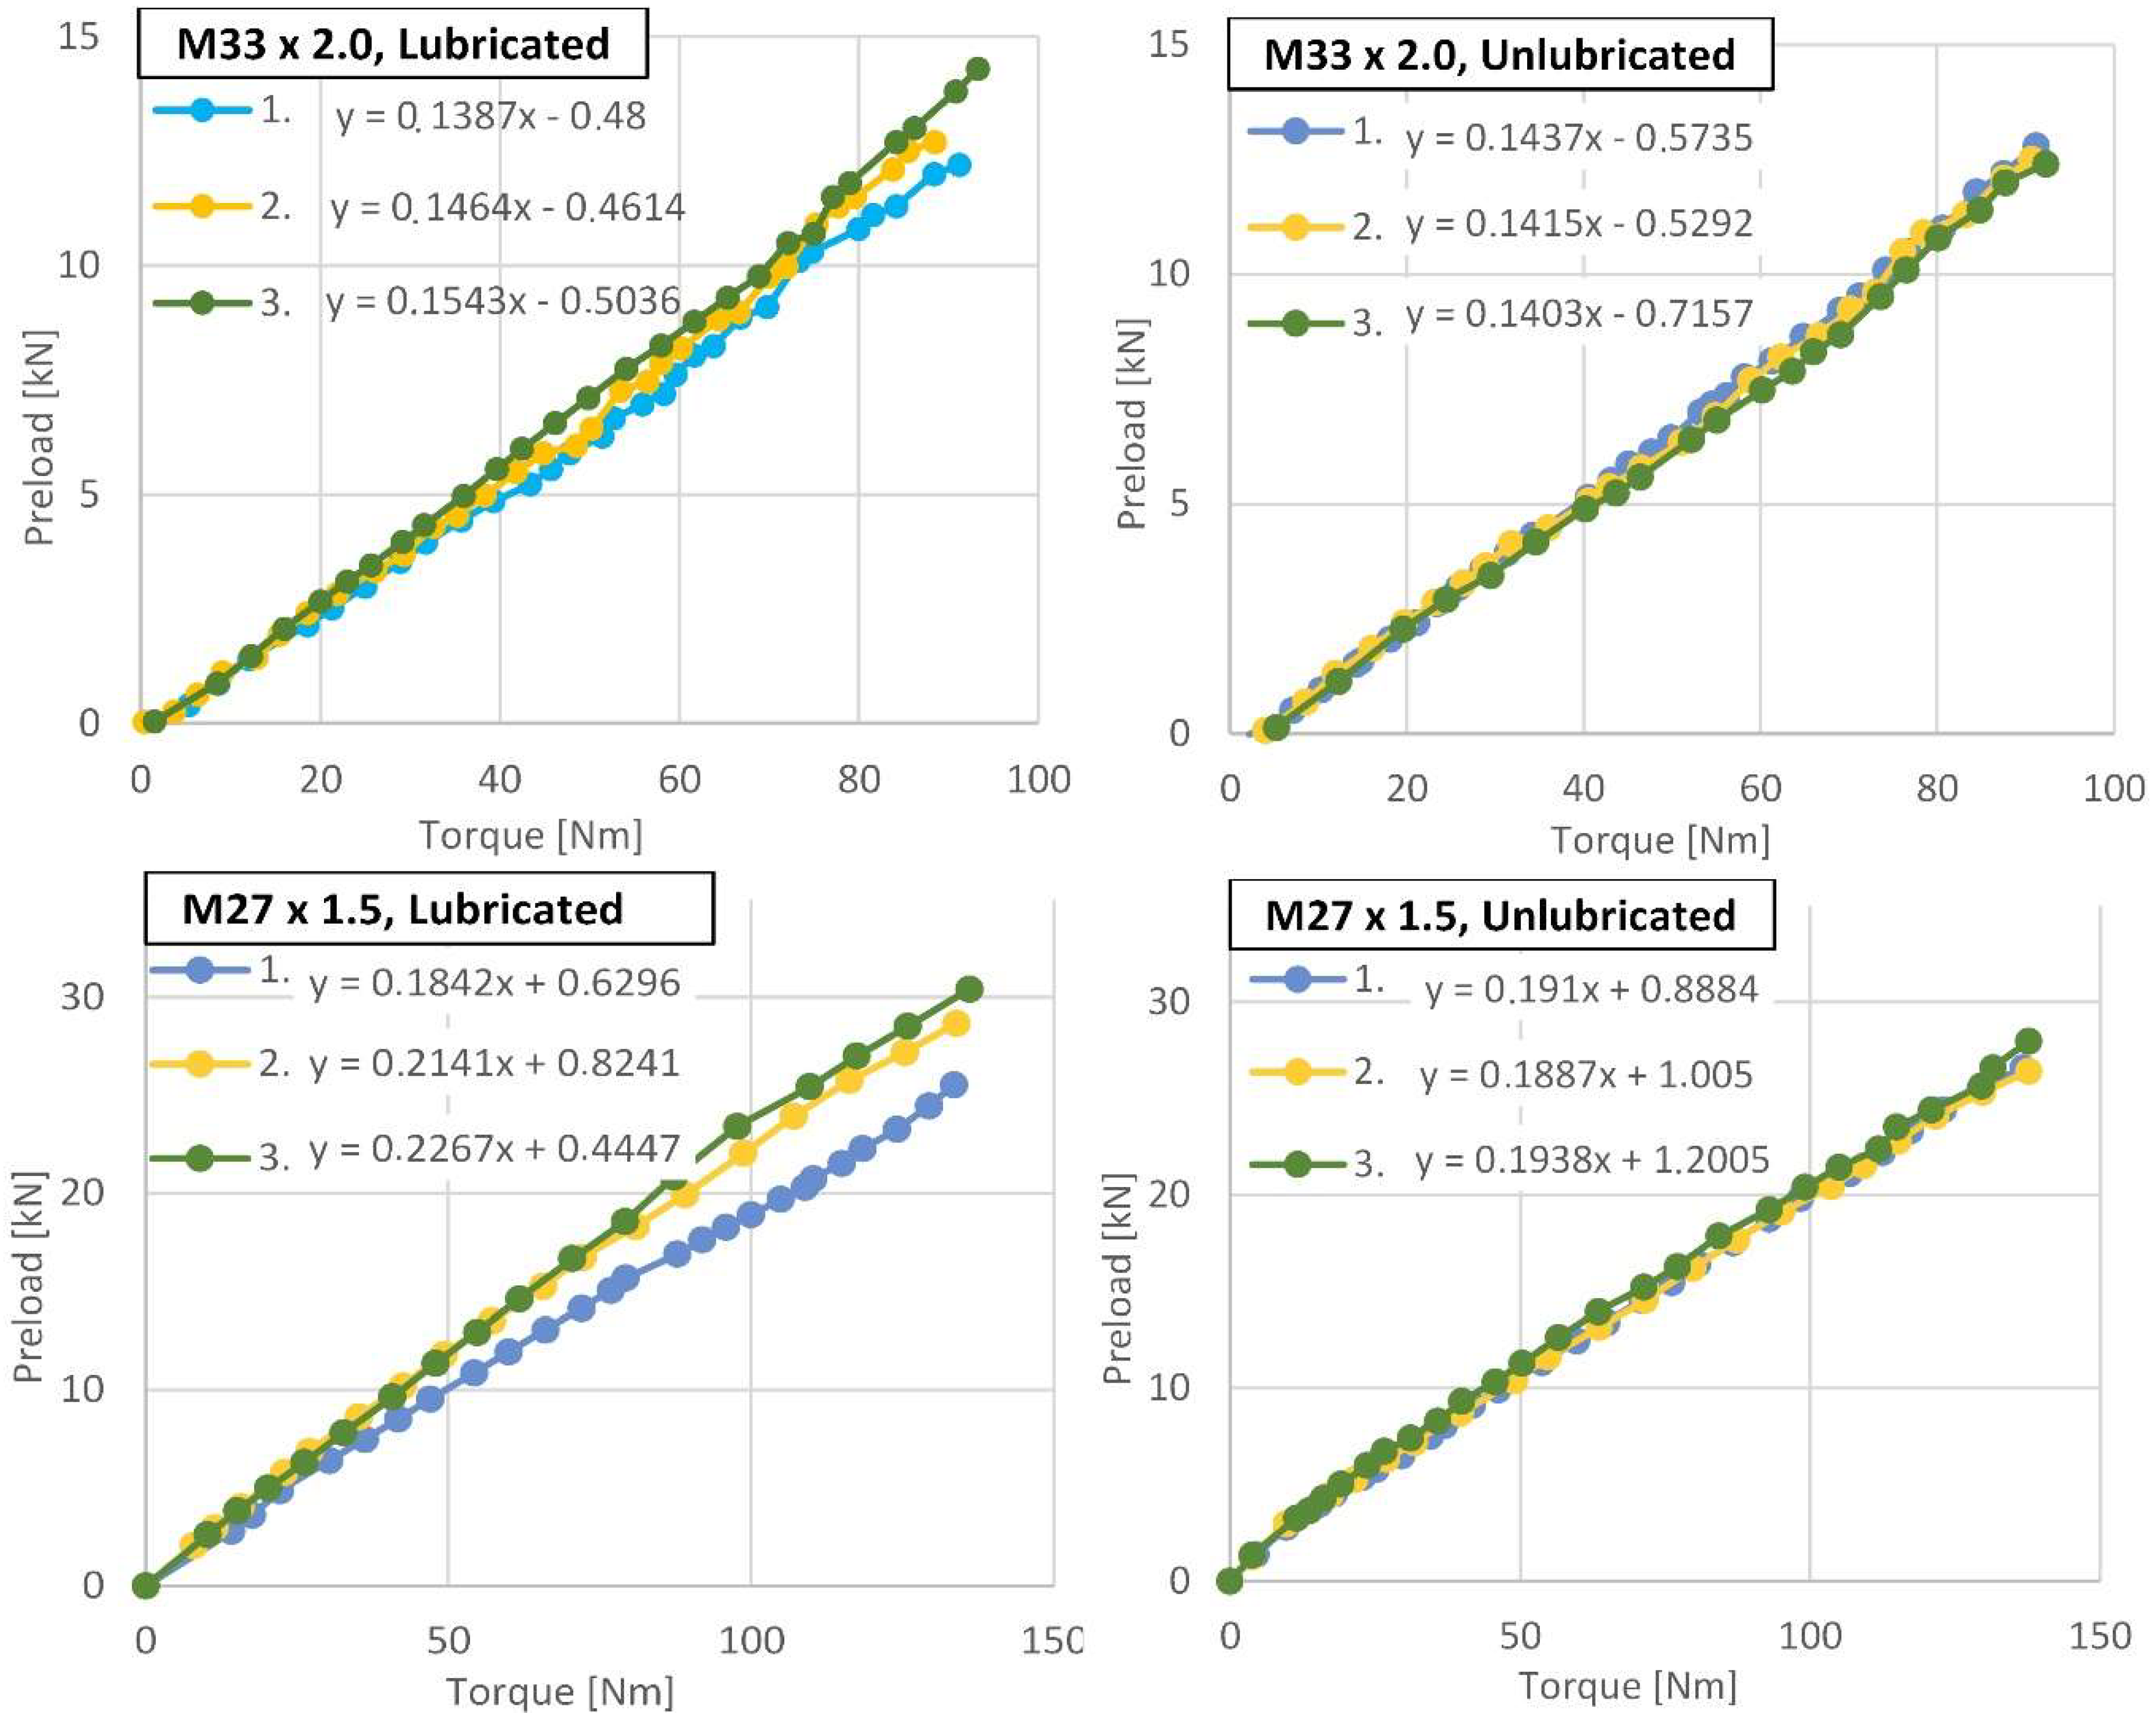
The measurement data were gathered in preload–torque curves. Only the tightening parts of the curves were extracted. Oscillations appeared especially at high torques under unlubricated conditions, due to the slip-stick effect. To exclude such data from the preload–torque curves, relevant points were manually extracted from the preload–torque curves and approximated by linear functions.
The mean values of the tightening test results were compared using two-tailed t-tests assuming equal variances in Excel (Microsoft Excel for Microsoft 365 MSO, Microsoft Corporation, Redmond, WA, USA) with a significance level of 0.05.

3. Results

Figure 3 shows the tightening parts of the preload–torque curves of three successive tightenings for the M33 × 2.0 and M27 × 1.5 plug–valve connections under lubricated and three tightenings under unlubricated conditions.
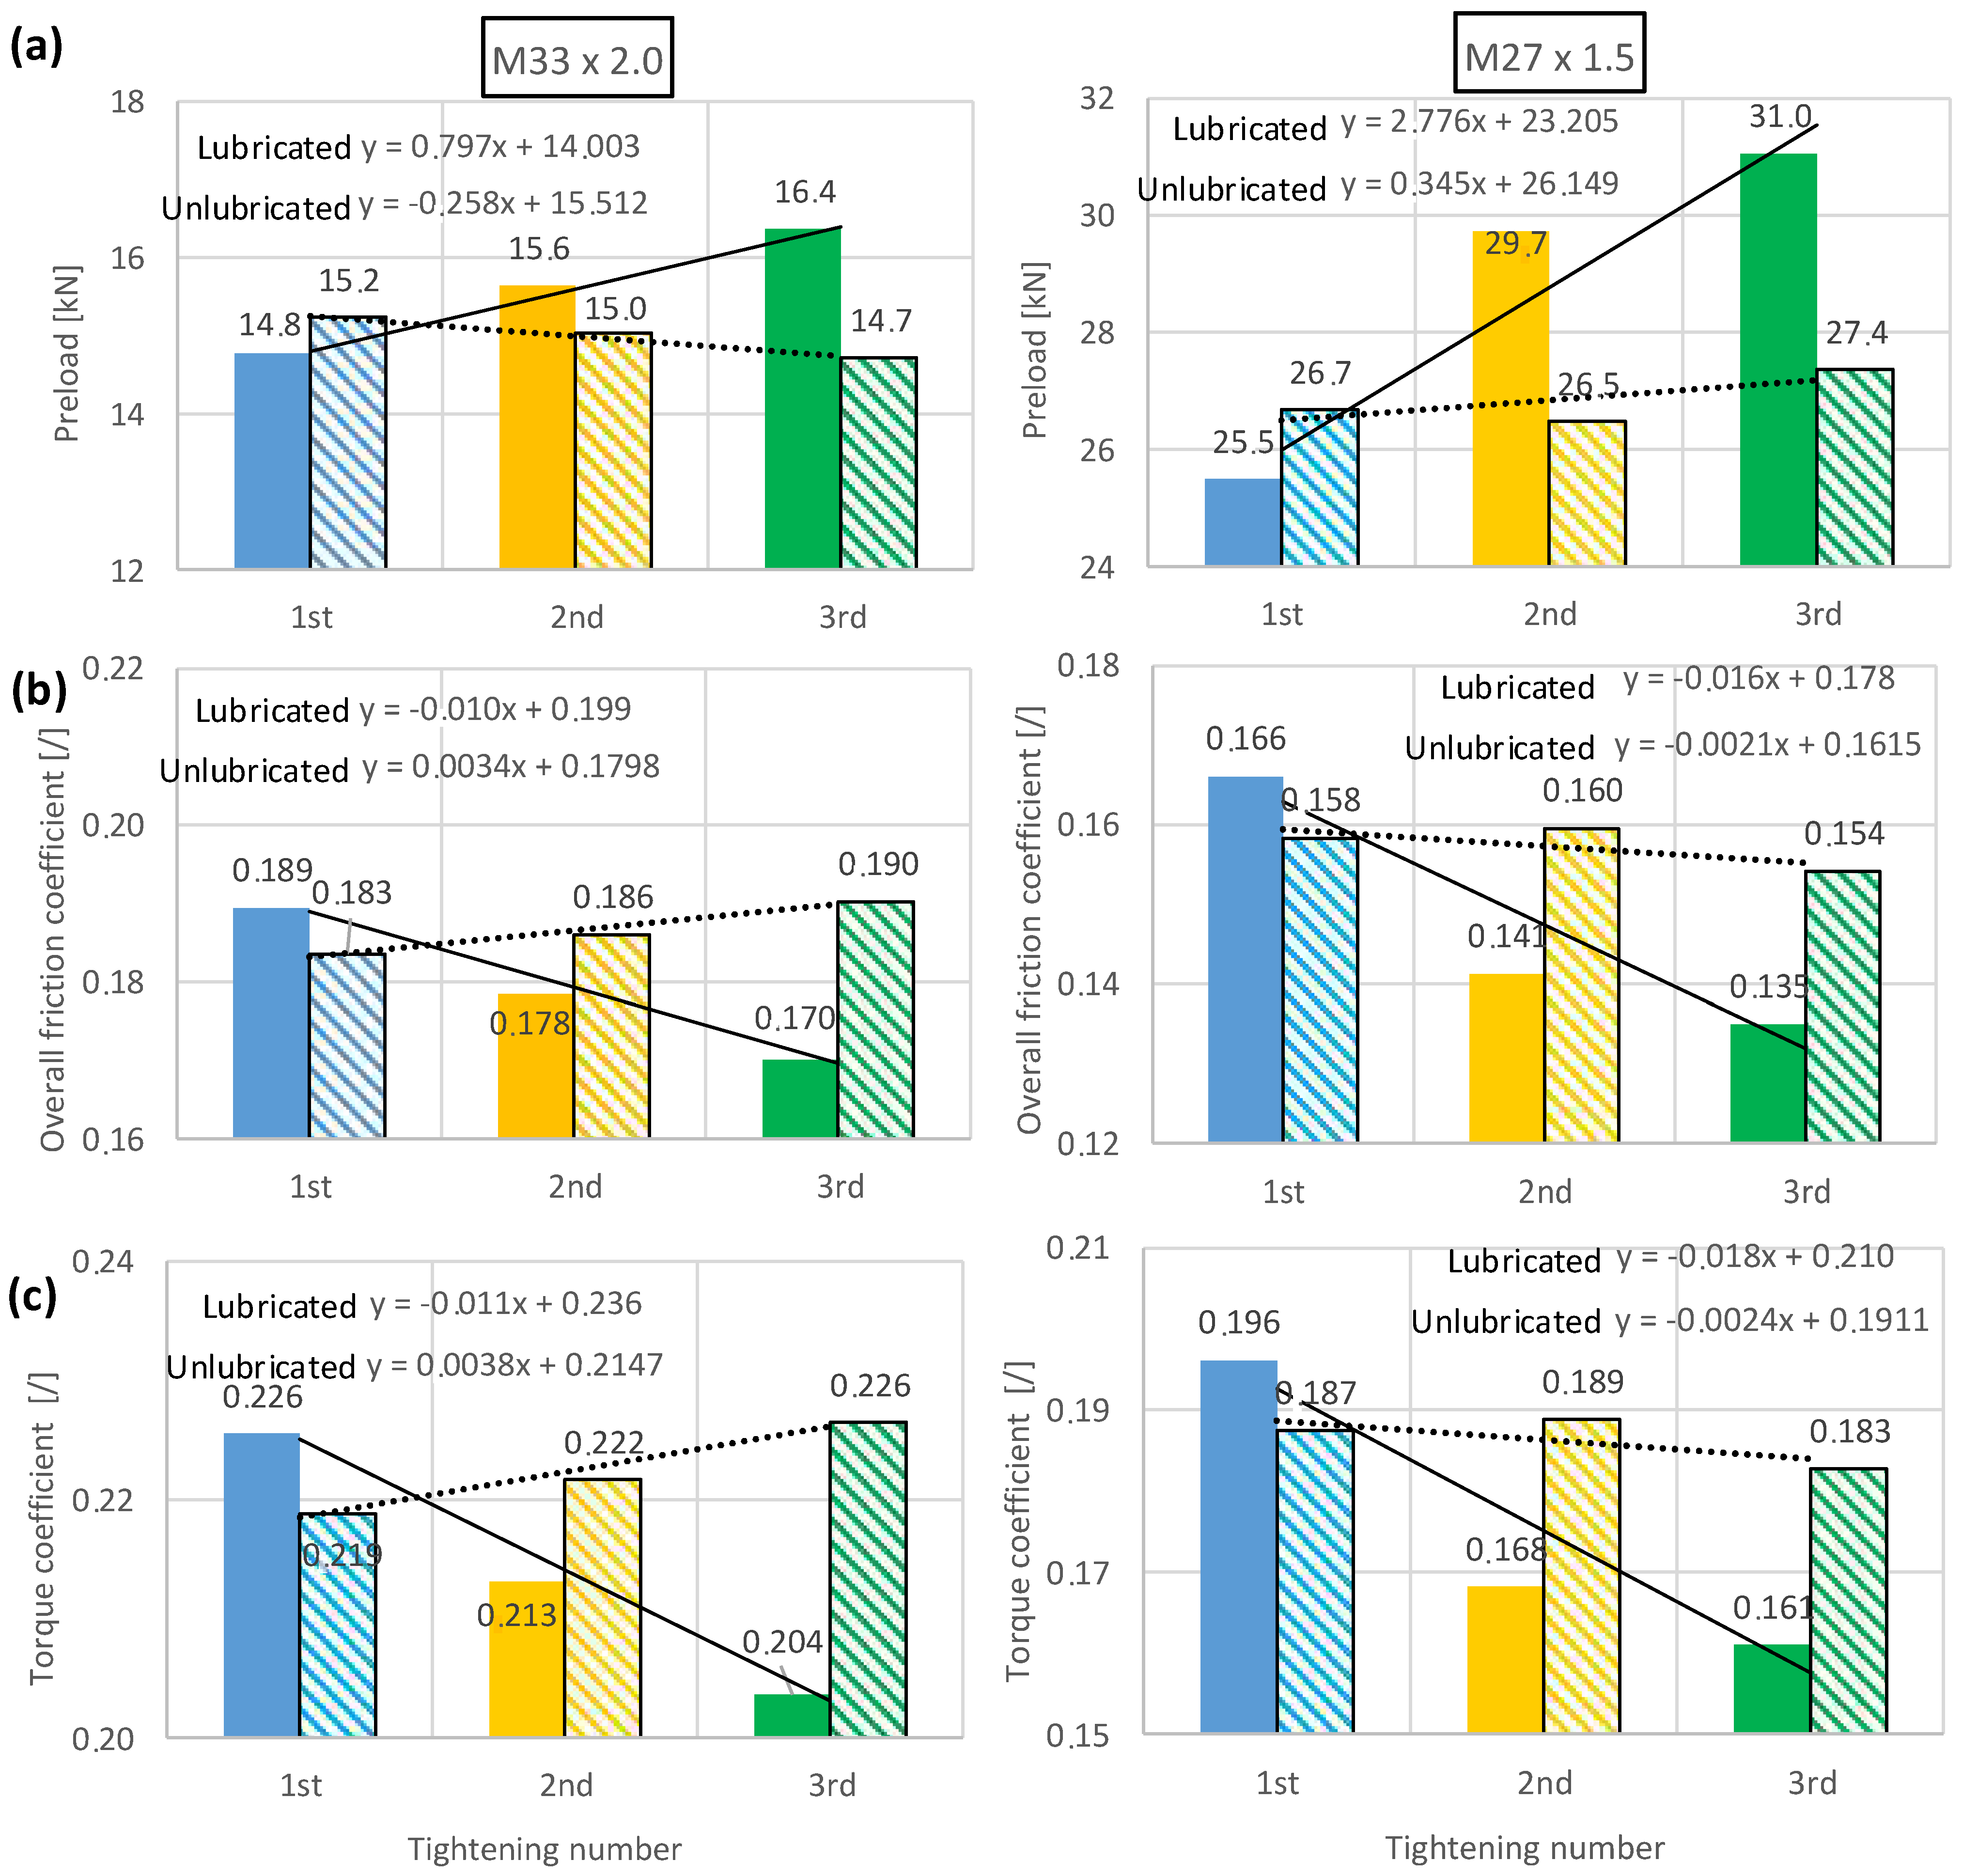
The preloads at the prescribed tightening torques (Figure 4a) were calculated by linear approximations of the preload–torque curves (Figure 3). These preloads were used in Equations (1) and (4) to calculate the torque coefficient and the overall friction coefficient (Figure 4b,c). The left-hand diagrams in Figure 4 refer to the M33 × 2.0 plug–valve connection, and the right-hand diagrams refer to the M27 × 1.5 plug–valve connection. The dependence of the preload, the torque coefficient and the overall friction coefficient from repeated tightening is represented by linear trend lines in Figure 4.
The average preloads, overall friction and torque coefficients, disregarding the tightening repetitions, under lubricated and unlubricated conditions are given in Table 1 for the M33 × 2.0 and M27 × 1.5 plug–valve connections including the statistical test results.

4. Discussion

4.1. Determination of the Preload–Torque Relationship Requires Measurements

Although the surface roughness of the contacting surfaces was the same for both plug–valve connections with similar geometry (some important relative plug dimensions are gathered in Table 2), the average overall friction coefficient and torque coefficient of the M33 × 2.0 plug–valve connection were 16% to 18% (Table 1) higher than that of the M27 × 1.5 plug–valve connection in the unlubricated and lubricated conditions, respectively. This indicates that even small geometry differences between the plug–valve connections may have a significant influence on the preload–torque relationship; therefore, the preload–torque relationship should be measured separately for each different type and size of the plug–valve connection. Moreover, other factors such as deformation of the thread, uneven pressure distribution along the thread, work hardening of the thread, etc. [8,23,24,25], were also recognized to have influence on the preload–torque relationship of bolted connections. Also, because all these factors influence the preload–torque relationship, but are not considered in Equation (4), measurement of the preload–torque relationship is necessary for its accurate determination [31].

4.2. Average Tightening Results and Influence of Lubrication

The plugs were tightened with different prescribed torques, thus different average preloads in the plugs were obtained as expected (Table 1). The average preloads, overall friction coefficients and torque coefficients, were statistically the same for the lubricated and unlubricated conditions of the same plug–valve connections (Table 1). The reason for such a result is that the measurements in the unlubricated conditions were carried out after the measurements in the lubricated conditions on the same plug–valve connections, and thus the influence of the repeated tightening was different for both conditions, which obviously neutralized the lubrication effect. To extract the influence of lubrication from the measurements, it is best to compare the results of the last lubricated tightening (3rd overall tightening) with the first unlubricated tightening (4th overall tightening) of the same plug–valve connection (Figure 4), which were similarly influenced by the repeated tightening, since these measurements were carried out directly one after the other, and moreover, the influence of repeated tightening decreased with tightening repetition (see Section 4.3). This comparison reveals that for the M33 × 2.0 plug–valve connection, the overall friction coefficient and torque coefficient were 7.8% and 7.5% greater in the unlubricated conditions. For the M27 × 1.5 plug–valve connection, these differences were 17.4% and 16.4%, respectively. However, these values are not statistically supported.
The overall friction and torque coefficients in the first lubricated tightening were surprisingly higher than in the first unlubricated tightening for both plug–valve connections, which were actually the fourth tightenings made on the plug–valve connections, while in the following tightenings they were expectedly lower than in the unlubricated tightenings (Figure 4b,c). This result indicates that the fourth tightening of the plugs reduced the overall friction and torque coefficients more than lubrication.

4.3. Repeated Tightening Influence

The influence of repeated tightening can be seen from the results of the individual tightening cases (Figure 4). Under lubricated conditions, a uniform increase in preload and a decrease in the overall friction and torque coefficient was observed for both plug–valve connections as the number of repeated tightenings increased (Figure 4, solid black trendlines). These trends were not consistent in the unlubricated conditions, where the trendlines were also less steep (Figure 4, dashed black trendlines). The reason for the more evident trends in the lubricated conditions is also due to the order of the measurements. In the first three tightenings, the influence of paving and smoothing of the threads, which reduced the overall friction coefficient and torque coefficient, was apparently more significant, while in the following three tightenings, when the unlubricated measurements were performed, this influence was less influential, similarly as reported in other studies [25,28]. The comparison of the standard deviations between the average lubricated and unlubricated results (Table 1) also indicates to stabilization of the results with repeated tightening.
From the trendlines of the lubricated cases (Figure 4, solid black trendlines), an average decrease of 5.3% and 4.9% of the overall friction coefficient and torque coefficient can be calculated per repeated tightening for the M33 × 2.0 plug–valve connection, while for the M27 × 1.5 plug–valve connection, these values yielded 9.9% and 9.4%, respectively. For the unlubricated results, these repeated tightening changes were not calculated because of the non-consistent behavior of the results.
Also, in other studies the influence of repeated tightening on the friction coefficient or overall friction coefficient was analyzed [11,16,25,27,28]. In [16,25,27], these coefficients increased with repeated tightening, which the authors attributed to increased peeling of the coating. The primary processes, recognized for causing the friction variations, were the ploughing effect of trapped wear particles and adhesion [25]. The plug–valve connections used in the present study had no coatings; therefore, this phenomenon was not present. In [28] and in [11], a similar increase in preload and decrease in the friction coefficients with repeated tightening was found as in the present study.

4.4. Minimization of Repeated Tightening Influence

To minimize the influence of repeated tightening on the preload–torque relationship of the plug–valve connections and thus not to exceed the desired preloads when re-tightening the same plugs, it is recommended (1) to repeatedly tighten and loosen the plug–valve connections a few times as part of their production or (2) to reduce the tightening torques appropriately during repeated tightening, i.e., for ~5% and ~10% for the second and third tightening of the M33 × 2.0 plug–valve connection and for ~9% and ~18% for the second and third tightening of the M27 × 1.5 plug–valve connection. These percentages were obtained upon the torque coefficient decrease calculated in the previous section.

4.5. Preload Error in Case of Usage of Friction Coefficients from the Literature

There is a broad range of friction coefficients reported in the literature for the thread [22] and underhead [19] friction coefficients for different cases of bolted connections. Considering the minimum and maximum thread and underhead friction coefficients given in VDI 2230 [20] ( μ t , m i n = μ u , m i n = 0.1, μ t , m a x = μ u , m a x = 0.18) for the cases investigated in this study, the estimated preload would be between 3% and 86% higher than the average actual preload of the first three tightenings for the M33 × 2.0 plug–valve connection and between −15% and 29% of the actual preload for the M27 × 1.5 plug–valve connection in the lubricated and unlubricated condition, respectively. These deviations support the finding that in order to accurately determine the preload–torque relationships of non-standard hydraulic plugs, they must be measured and not just calculated using friction or torque coefficients given in the literature.

4.6. Limitations and Future Studies

In this study, the results were gained upon two samples of the plug–valve connections, one sample per each size. From these results, conclusions and suggestions were generalized for all plug–valve connections of its size and type. For greater reliability of the results, a larger number of test specimens is suggested for future studies to minimize the possible mutual variances (geometrical, material, tribological and also sensorial) between plug–valve connections. Moreover, different plug–valve connections should be used for evaluation of the repeated tightening influence in lubricated and unlubricated conditions, since this influence can be investigated only on new plug–valve connections. To achieve a better insight into the topic, future analyses should also investigate other plug–valve sizes.
Nevertheless, since the calibration of the force and torque sensors was the same for the lubricated and unlubricated measurements, the possible error in results could only influence their absolute values, but not their mutual relationships.

5. Conclusions

The study investigated the preload–torque relationship of two non-standard threaded hydraulic plugs under lubricated and unlubricated conditions. The tightening torque and preload were measured, and the overall friction and torque coefficients were calculated. (1) Despite the plug–valve connections having a similar geometry with the same surface roughness of the contacting surfaces, the average overall friction coefficient and torque coefficient differed by 16% and 18% between the two plug–valve connections in the unlubricated and lubricated conditions, respectively, indicating that even small geometry differences between the plug–valve connections can have considerable influence on these coefficients. The overall friction and torque coefficients were from 8% to 17% higher in the unlubricated condition than in the lubricated condition but were not statistically supported. (2) The overall friction and torque coefficients decreased degressively with repeated tightening. (3) Consideration of the minimum and maximum thread and underhead friction coefficients given in the literature would result in a large error in the estimated preload (−15% to +86% of the actual preload).
This study has shown that the preload–torque relationships of non-typical bolted connections cannot be accurately determined from the friction coefficients given in the literature. Thus, for accurate determination of these relations, tightening torque and preload must be measured. The results also show that it is not possible to demonstrate a systematic relationship between the size of the plugs and the preload–torque relationship, which makes it necessary to treat the subsequent sizes and different types of plug–valve connections separately. To ensure stabile preload–torque relationships of the plug–valve connections, it is recommended to tighten and loosen the plugs a few times before they are placed on the market.

Author Contributions

Conceptualization, B.J., A.Č. and F.M.; methodology, B.J., A.Č., J.H. and F.M.; validation, B.J. and J.H.; analysis, B.J., J.H. and F.M.; investigation, B.J., J.H. and F.M.; resources, B.J., A.Č. and F.M.; data curation, B.J. and J.H.; writing—original draft preparation, J.H.; writing—review and editing, B.J., A.Č., J.H. and F.M.; supervision, B.J. and F.M.; project administration, B.J. and F.M.; funding acquisition, B.J. and F.M. All authors have read and agreed to the published version of the manuscript.

Funding

This work was supported by Poclain Hydraulics d.o.o., Slovenia, Žiri [grant numbers 20100109631, 2021].

Institutional Review Board Statement

Not applicable.

Informed Consent Statement

Not applicable.

Data Availability Statement

The original contributions presented in this study are included in the article. Further inquiries can be directed to the corresponding author.

Acknowledgments

The authors acknowledge Rok Jelovčan for providing help in the construction and assembly of the hydraulic test rig. The authors also acknowledge the financial support provided by the Slovenian Research and Innovation Agency (ARIS) for the open access publication of this scientific article.

Conflicts of Interest

Author Anže Čelik was employed by the company Poclain Hydraulics d.o.o. The remaining authors declare that the research was conducted in the absence of any commercial or financial relationships that could be construed as a potential conflict of interest. The sponsors had no role in the design, execution, interpretation, or writing of the study.

Correction Statement

This article has been republished with a minor correction to the Acknowledgments. This change does not affect the scientific content of the article.

Appendix A

Appendix A.1. Calibration of the Force Sensors
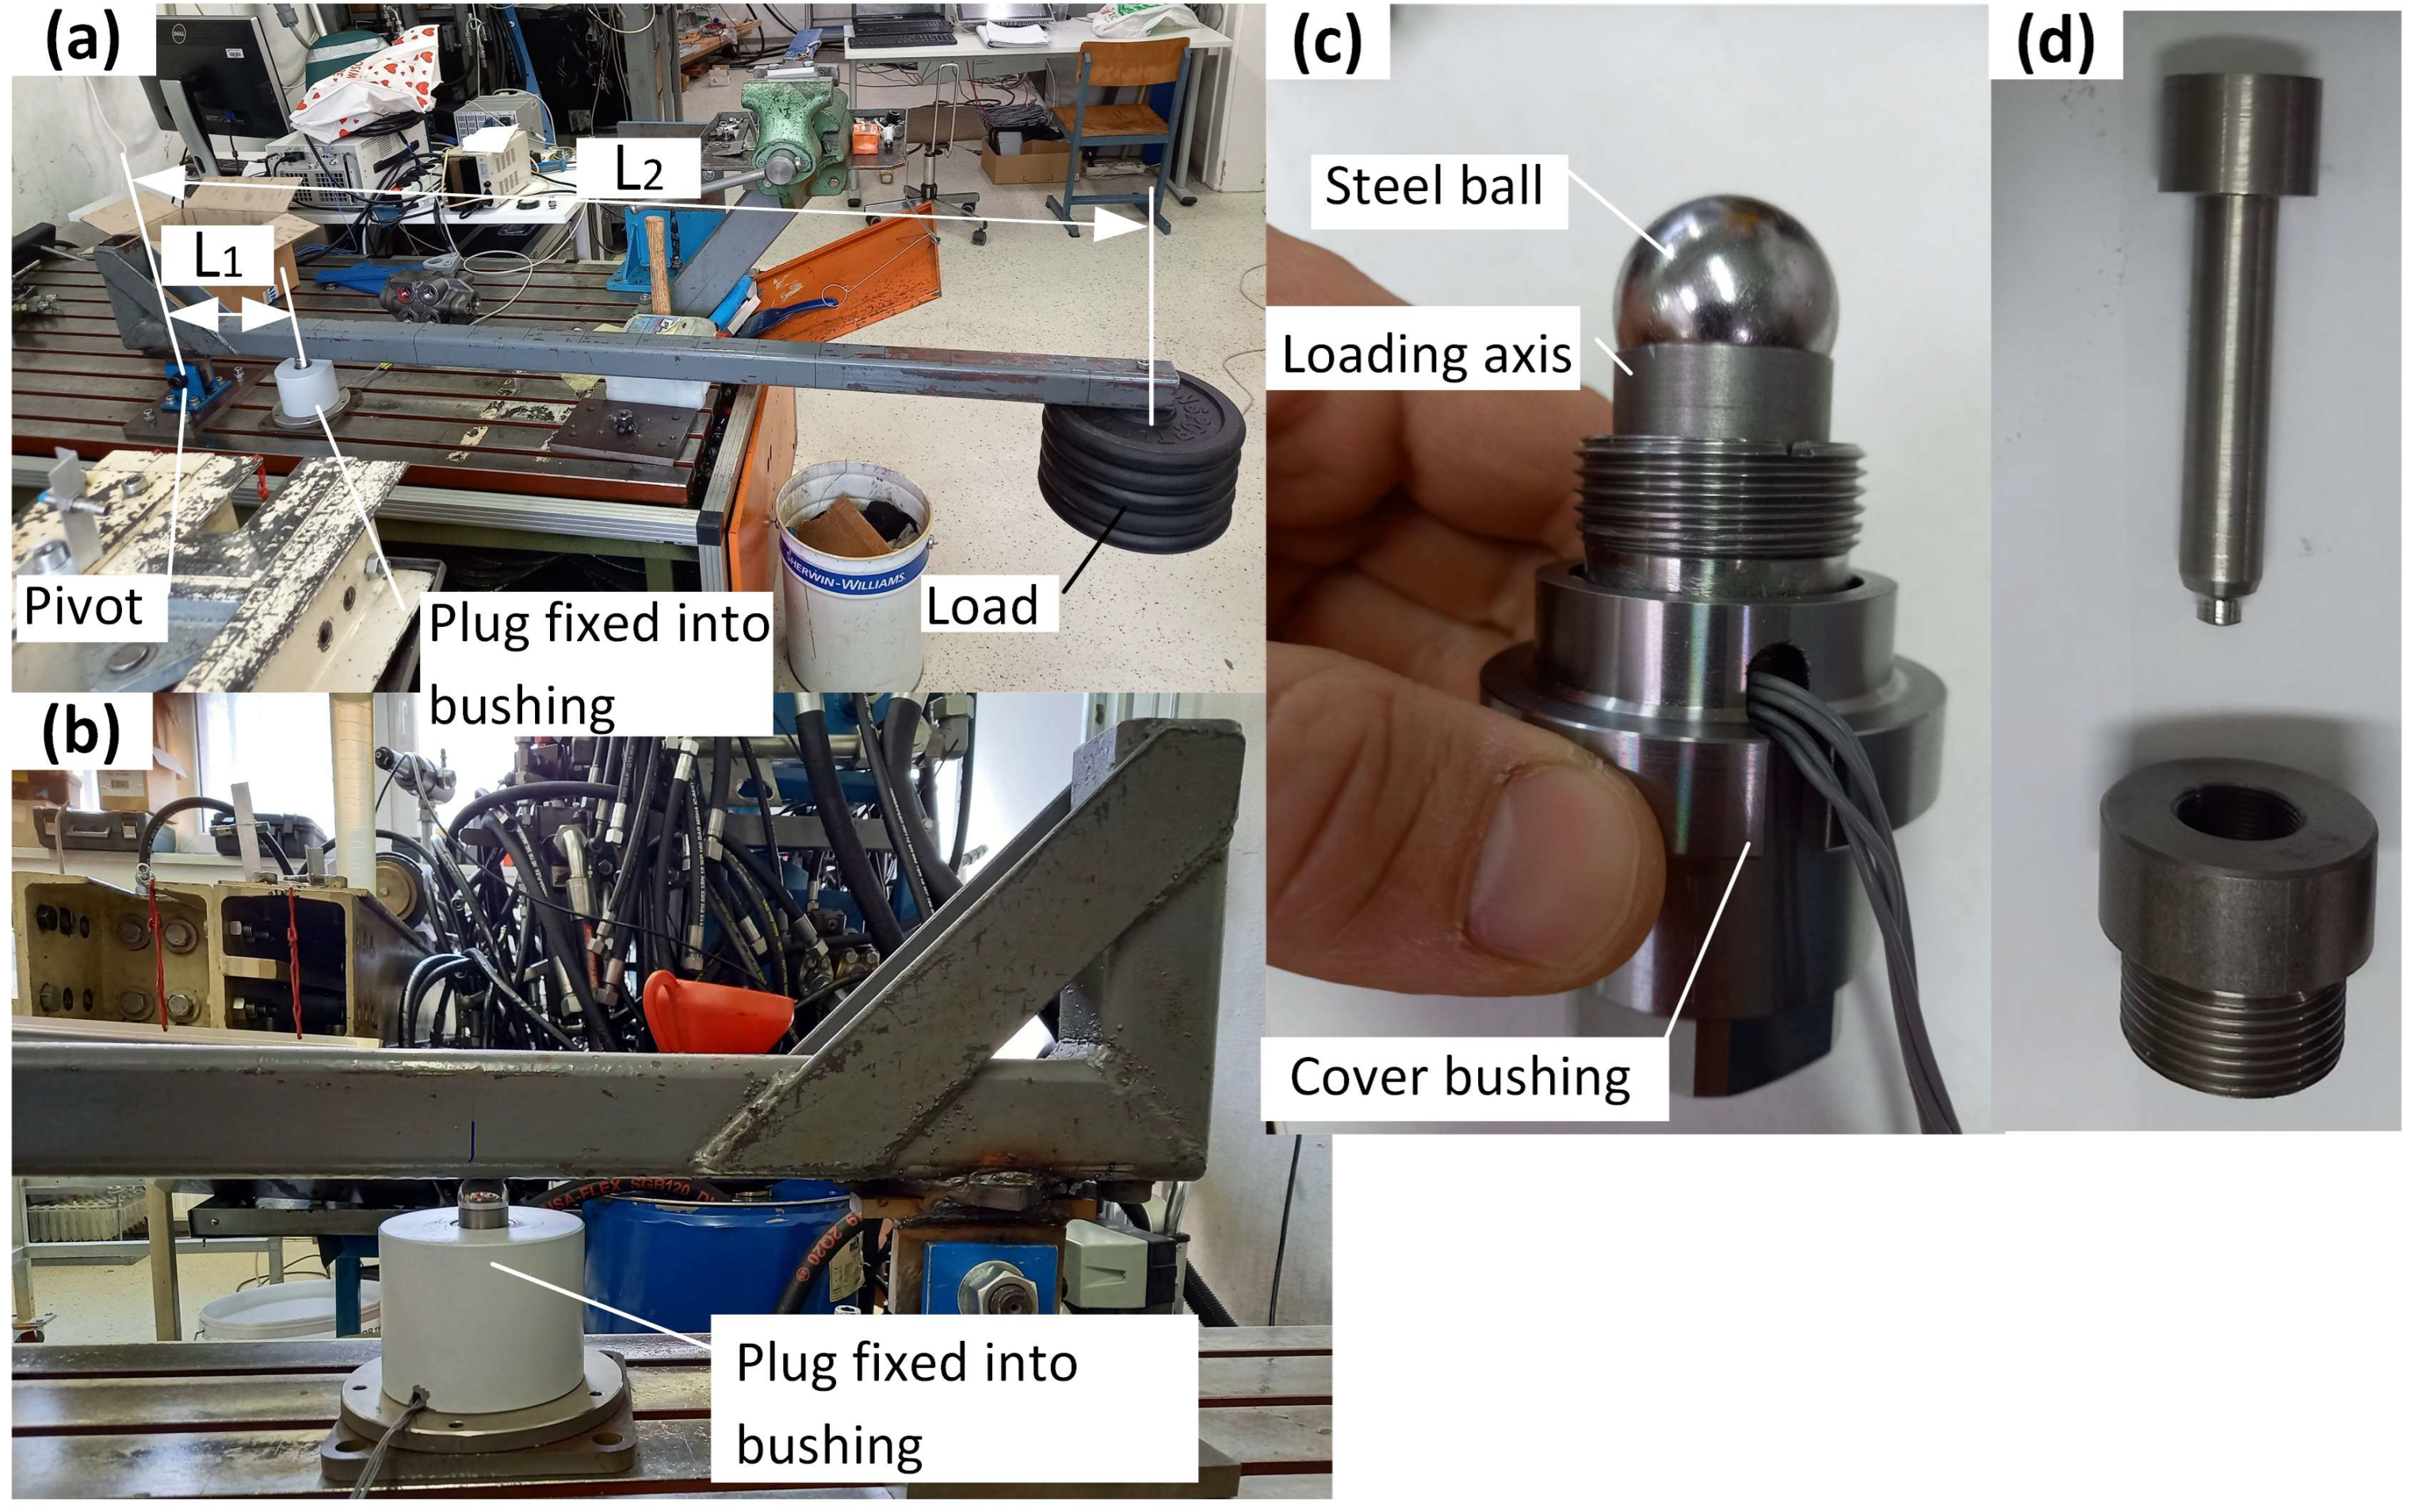
For calibration of the preload sensors on the plugs, a special system was created which enabled application of tensile axial load on the studs (Figure A1). This system consisted of a lever arm (Figure A1a) for load maximization and a bushing for fixation of the plugs (Figure A1b).
Figure A1. (a) System for plug force sensor calibration. (b) Close-up view of the bushing for plug fixation. (c) Modified M33 × 2.0 plug with cover bushing, loading axis and a steel ball for load application. (d) Loading axis and adapter for calibration of the M27 × 1.5 force sensor.
Applsci 14 11920 g0a1
The plugs were tightened into bushings (Figure A1b) with their hexagonal heads turned down and placed under the lever arm at a distance L1 from the pivot. At the end of the lever arm, at distance L2 from the pivot, a known load was applied. This load produced a L2/L1 times larger axial load on the studs of the plugs than the applied load at the end of the lever arm. To ensure that only an axial load was applied to the plugs, a lubricated loading axis with a steel ball was inserted into the plugs (Figure A1c,d). For fixation of the M27 × 1.5 plug, a special adapter was screwed into the fixation bushing and for appropriate load application, a thinner loading axis was used (Figure A1d).

Appendix A.2. Calibration of the Torque Wrench

The torque wrench was fixed at its head in a horizontal position and loaded with known weights at its other end. Since the lever arm at the load application was known, the relation between the loaded torque and the measured voltage change on the strain gauge sensors was obtained. Based on this calibration, the conversion factor from volts to newton meters was determined.

References

  1. Čelik, A.; Jerman, B.; Majdič, F. Design guidelines for non-standard plugs. In Proceedings of the International Conference Fluid Power 2023, Maribor, Slovenia, 20–21 September 2023. [Google Scholar]
  2. Lovrec, D.; Kalb, R.; Tic, V. Ionic Hydraulic Fluids and Seal-Material Compatibility. Appl. Sci. 2024, 14, 2187. [Google Scholar] [CrossRef]
  3. Lovrec, D.; Tic, V. Suitability of Test Procedures for Determining the Compatibility of Seal Materials with Ionic Hydraulic Fluids. Polymers 2024, 16, 2551. [Google Scholar] [CrossRef] [PubMed]
  4. Rodríguez-Pérez, A.M.; Pulido-Calvo, I. Analysis and viability of microturbines in hydraulic networks: A case study. J. Water Supply Res. Technol. AQUA 2019, 68, 474–482. [Google Scholar] [CrossRef]
  5. Okorn, I.; Nagode, M.; Klemenc, J.; Oman, S. Analysis of Additional Load and Fatigue Life of Preloaded Bolts in a Flange Joint Considering a Bolt Bending Load. Metals 2021, 11, 449. [Google Scholar] [CrossRef]
  6. Budynas, R.G.; Nisbett, J.K. Shigley’s Mechanical Engineering Design; McGrawHill: New York, NY, USA, 2011. [Google Scholar]
  7. Schmid, S.R.; Hamrock, B.J.; Jacobson, B.O. Fundamentals of Machine Elements; CRC Press: Boca Raton, FL, USA, 2014. [Google Scholar]
  8. Bickford, J. An Introduction to the Design and Behavior of Bolted Joints, 3rd ed.; Revised and Expanded; Taylor & Francis: New York, NY, USA, 1995. [Google Scholar]
  9. Drumheller, J. Fundamentals of Torque-Tension and Coefficient of Friction Testing; White Paper 21; PCB Piezotronics: Depew, NY, USA, 2021. [Google Scholar]
  10. Shoberg, R.S. Engineering Fundamentals of Threaded Fastener Design and Analysis. Fastening 2000, 6, 26–29. [Google Scholar]
  11. Alsardia, T. Bolt Preload Variations During Repeated Tightenings. Acta Polytech. Hung. 2024, 21, 133–150. [Google Scholar] [CrossRef]
  12. Nassar, S.A.; El-Khiamy, H.; Barber, G.C.; Zou, Q.; Sun, T.S. An experimental study of bearing and thread friction in fasteners. J. Tribol.-T Asme 2005, 127, 263–272. [Google Scholar] [CrossRef]
  13. Nassar, S.A.; Ganeshmurthy, S.; Ranganathan, R.M.; Barber, G.C. Effect of tightening speed on the torque-tension and wear pattern in bolted connections. J. Press Vess.-T Asme 2007, 129, 426–440. [Google Scholar] [CrossRef]
  14. Eliaz, N.; Gheorghiu, G.; Sheinkopf, H.; Levi, O.; Shemesh, G.; Ben-Mordechai, A.; Artzi, H. Failures of bolts in helicopter main rotor drive plate assembly due to improper application of lubricant. Eng. Fail. Anal. 2003, 10, 443–451. [Google Scholar] [CrossRef]
  15. Miao, R.S.; Shen, R.L.; Zhang, S.H.; Xue, S.L. A Review of Bolt Tightening Force Measurement and Loosening Detection. Sensors 2020, 20, 3165. [Google Scholar] [CrossRef]
  16. Croccolo, D.; De Agostinis, M.; Vincenzi, N. Failure analysis of bolted joints Effect of friction coefficients in torque-preloading relationship. Eng. Fail. Anal. 2011, 18, 364–373. [Google Scholar] [CrossRef]
  17. Motosh, N. Development of Design Charts for Bolts Preloaded up to Plastic Range. J. Eng. Ind.-T Asme 1976, 98, 849–851. [Google Scholar] [CrossRef]
  18. Croccolo, D.; De Agostinis, M.; Vincenzi, N. Experimental Analysis on the Tightening Torque—Preloading Force Relationship in Threaded Fasteners. Proc. Asme Int. Mech. Eng. Congr. Expo. 2012, 3 Pts A and B, 525–533. [Google Scholar]
  19. Cabrera, M.; Tizani, W.; Ninic, J.; Wang, F.Y. Experimental and numerical analysis of preload in Extended Hollo-Bolt blind bolts. J. Constr. Steel Res. 2021, 186, 106885. [Google Scholar] [CrossRef]
  20. VDI 2230; Systematic Calculation of High Duty Bolted Joints—Joints with One Cylindrical Bolt. Verein Deutscher Ingenieure (VDI): Düsseldorf, Germany, 2014.
  21. DIN EN ISO 16047:2005-10; Fasteners—Torque/Clamp Force Testing. Deutsches Institut für Normung: Berlin, Germany, 2005.
  22. Ganeshmurthy, S.; Nassar, S.A. Finite Element Simulation of Process Control for Bolt Tightening in Joints With Nonparallel Contact. J. Manuf. Sci. Eng.-T Asme 2014, 136, 021018. [Google Scholar] [CrossRef]
  23. Yazawa, S.; Hongo, K. Distribution of Load in the Screw Thread of a Bolt Nut Connection Subjected to Tangential Forces and Bending Moments. Jsme Int. J. I-Solid Mech. Strength Mater. 1988, 31, 174–180. [Google Scholar] [CrossRef]
  24. Yu, Q.M.; Zhou, H.L.; Wang, L.B. Finite element analysis of relationship between tightening torque and initial load of bolted connections. Adv. Mech. Eng. 2015, 7, 1687814015588477. [Google Scholar] [CrossRef]
  25. Eccles, W.; Sherrington, I.; Arnell, R.D. Frictional changes during repeated tightening of zinc plated threaded fasteners. Tribol. Int. 2010, 43, 700–707. [Google Scholar] [CrossRef]
  26. Morgan, R.C.; Henshall, J.L. The torque-tension behaviour of 22 × 1.5 mm bolts for fixing spigot-located wheels on heavy commercial vehicles. Proc. Inst. Mech. Eng. Part D J. Automob. Eng. 1996, 210, 209–214. [Google Scholar] [CrossRef]
  27. Güler, B.; Gürsel, K.T. Experimental analysis of the friction coefficient effect of the zinc-lamella coated fasteners on bolt preload and tightening momentExperimentelle Analyse der Wirkung des Reibungskoeffizienten von Zink-Lamelle beschichteten Befestigungselementen auf Schrauben-Vorspannkraft und-Anzugsmoment. Mater. Werkst 2019, 50, 696–705. [Google Scholar] [CrossRef]
  28. Zheng, M.P.; Liu, Z.F.; Yan, X.; Niu, N.N.; Zhang, T.; Li, Y. Initial losing behavior of pre-tightening force for threaded fastener during repeated tightening. Eng. Fail. Anal. 2022, 134, 106021. [Google Scholar] [CrossRef]
  29. EN 10277:2018; Bright Steel Products—Technical Delivery Conditions. European Committee for Standardization (CEN): Brussels, Belgium, 2018.
  30. Strain Gage Bridge Configurations. Available online: https://www.ni.com (accessed on 22 November 2024).
  31. Klöcker, M.; Westphal, S. Investigations of friction-relevant parameters to ensure reliable bolted joints. MATEC Web. Conf. 2017, 94, 04007. [Google Scholar] [CrossRef]
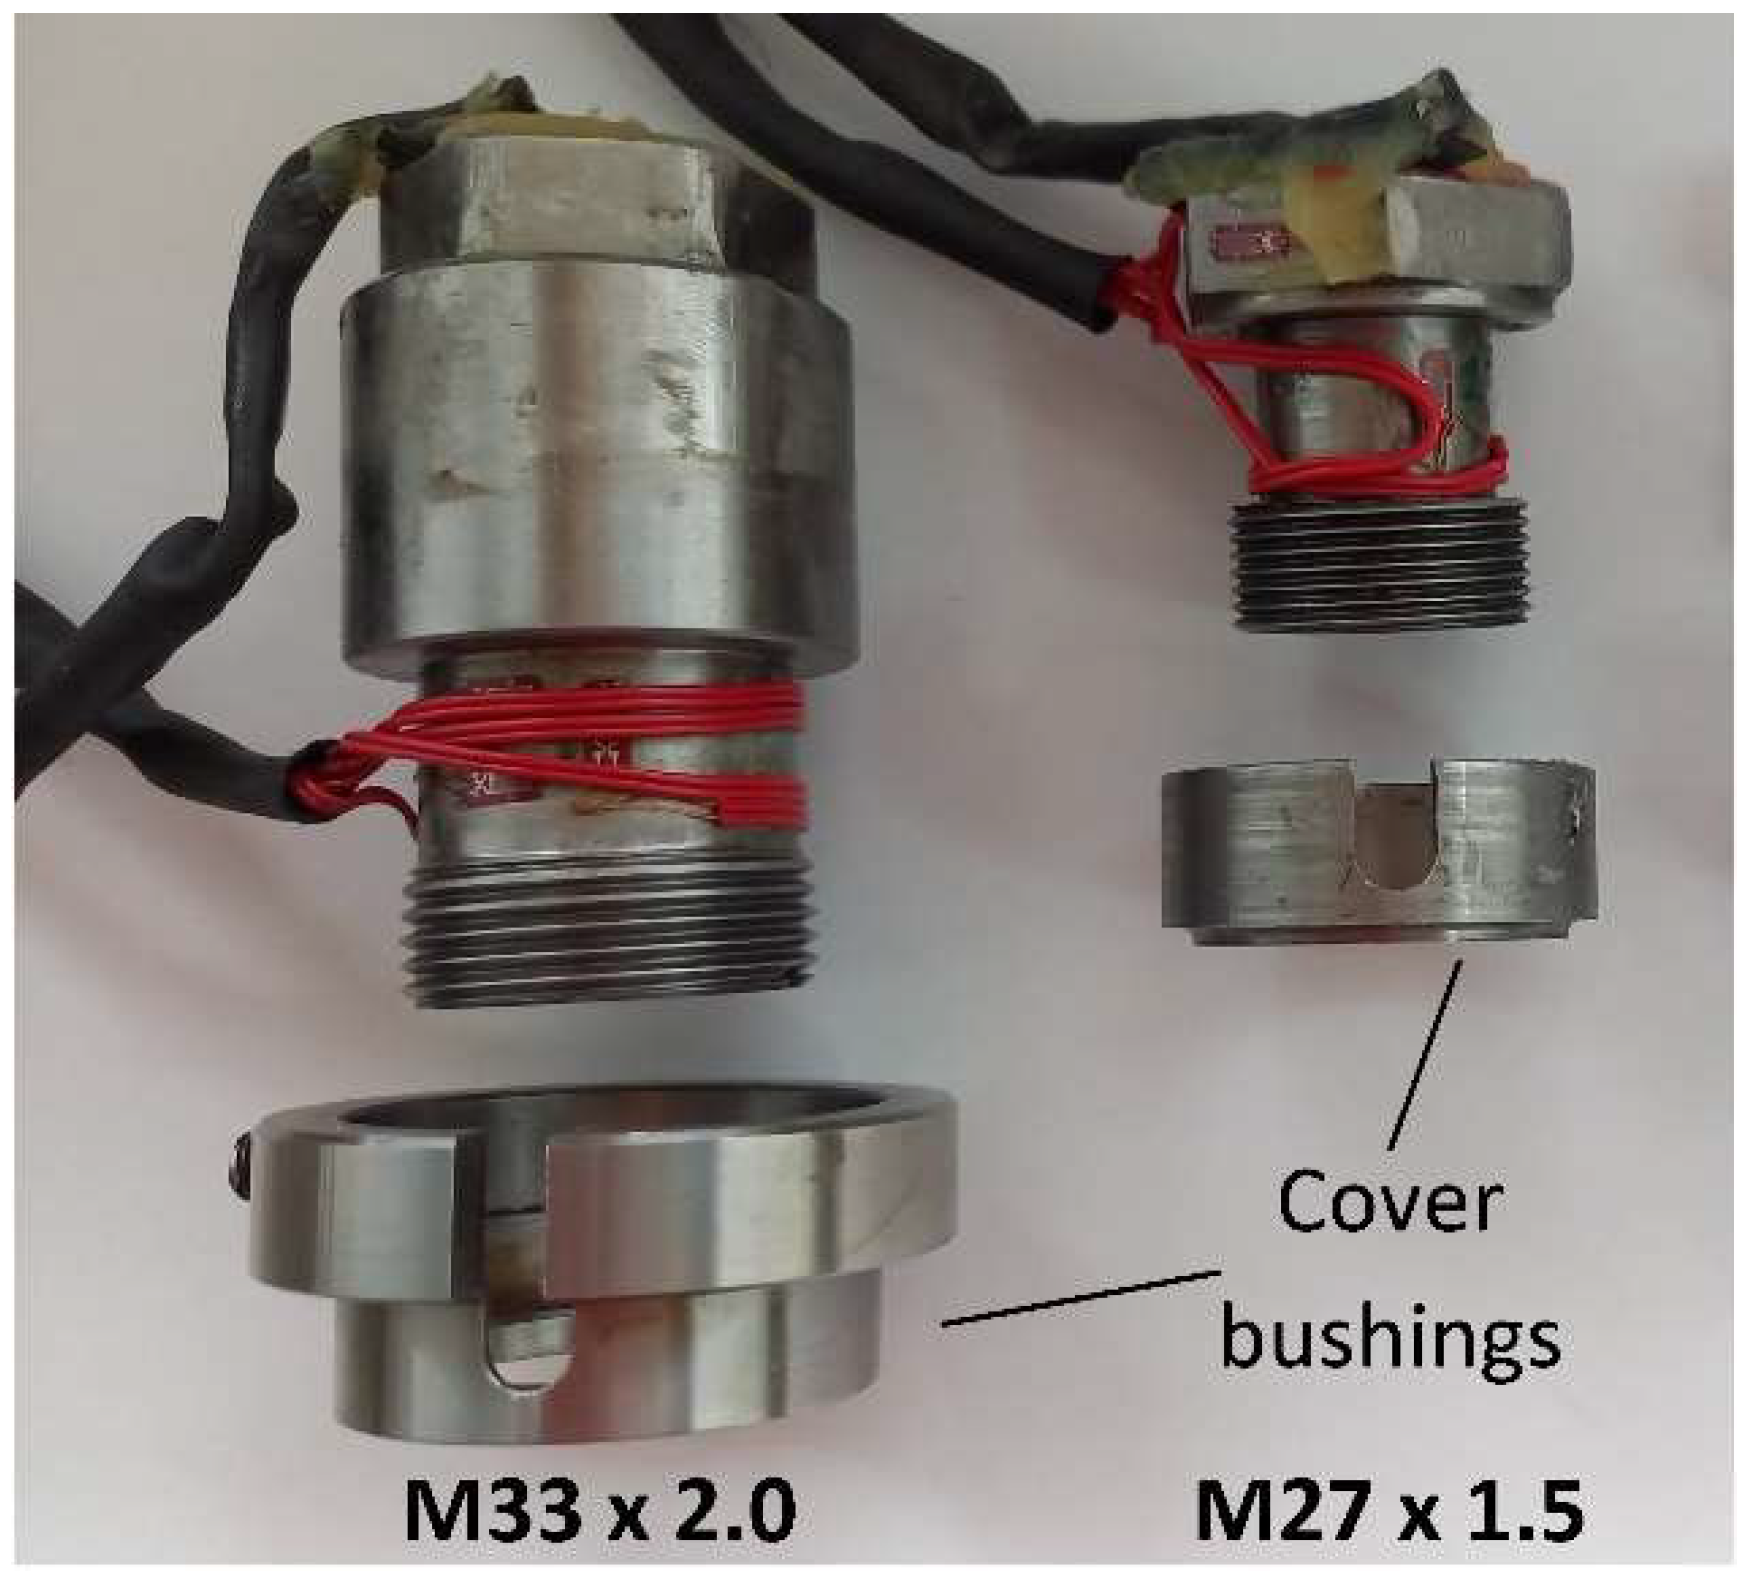
Figure 1. Modified non-standard hydraulic plugs equipped with strain gauges. The cover bushings were added as extensions of the clamped parts.
Applsci 14 11920 g001
Figure 2. (a) Close view of the head (jaw) of the torque wrench equipped with strain gauges (R1–R4). (b) Measuring setup for tightening the plugs.
Applsci 14 11920 g002
Figure 3. The tightening parts of the preload–torque curves of the M33 × 2.0 and M27 × 1.5 plug–valve connections under lubricated and unlubricated conditions for three successive tightenings including the corresponding linear approximation functions.
Applsci 14 11920 g003
Figure 4. (a) Preload, (b) overall friction coefficient and (c) torque coefficient of the M33 × 2.0 (left column) and M27 × 1.5 (right column) plug–valve connections for three successive tightenings under lubricated (solid fill) and unlubricated (dashed fill) conditions. Linear trendlines in dependence of repeated tightening are also shown (solid black lines for lubricated and dashed black lines for unlubricated conditions).
Applsci 14 11920 g004
Table 1. Average preload, overall friction coefficient and torque coefficient for the M33 × 2.0 and M27 × 1.5 plug–valve connection over three repeated tightenings under lubricated and unlubricated conditions.
Plug–Valve ConnectionConditionPreload [kN]Overall Friction Coefficient [/]Torque Coefficient [/]
M33 × 2.0Lubricated15.60 ± 0.65 b**0.18 ± 0.008 b*0.21 ± 0.009 b*
Unlubricated15.00 ± 0.21 b***0.19 ± 0.003 b***0.22 ± 0.003 b***
M27 × 1.5Lubricated28.76 ± 2.370.15 ± 0.0130.18 ± 0.015
Unlubricated26.84 ± 0.380.16 ± 0.0020.19 ± 0.003
b Statistically significant difference between plug data for lubricated or unlubricated conditions. Significance level: * p < 0.05, ** p < 0.01, and *** p < 0.001.
Table 2. Relative plug dimensions.
Relative DimensionM33 × 2.0M27 × 1.5Difference Relative to M33 [%]
d 2 / d u 0.830.85−2.4
p / d 0.0300.0286.7
H 1 / d 2 0.01640.009442.7
A u / A t 0.800.92−15.0
d 2 —mean thread diameter [m], d u —mean underhead diameter [m], p —thread pitch [m], d —nominal thread diameter [m], H 1 = 5 3 / 16 · p —bearing thread depth [m], A u —underhead contacting surface area [m2], and A t —thread contacting surface area [m2].
Disclaimer/Publisher’s Note: The statements, opinions and data contained in all publications are solely those of the individual author(s) and contributor(s) and not of MDPI and/or the editor(s). MDPI and/or the editor(s) disclaim responsibility for any injury to people or property resulting from any ideas, methods, instructions or products referred to in the content.