Article

Aqueous Waste Containing AOXs: Critical Issues in Analytical Methods and Assessment of Possible Inhibitory Effects on Mesophilic and Thermophilic Aerobic Biomasses

by
Maria Cristina Collivignarelli
1,2,
Stefano Bellazzi
1,*,
Giorgia Grecchi
1,
Marco Baldi
3 and
Alessandro Abbà
4
1
Department of Civil Engineering and Architecture, University of Pavia, Via Ferrata 3, 27100 Pavia, Italy
2
Interdepartmental Centre for Water Research, University of Pavia, Via Ferrata 3, 27100 Pavia, Italy
3
Department of Chemistry, University of Pavia, Viale Taramelli 12, 27100 Pavia, Italy
4
Department of Civil, Environmental, Architectural Engineering and Mathematics, University of Brescia, Via Branze 43, 25123 Brescia, Italy
*
Author to whom correspondence should be addressed.
Appl. Sci. 2024, 14(24), 11546; https://doi.org/10.3390/app142411546
Submission received: 2 September 2024 / Revised: 6 November 2024 / Accepted: 6 December 2024 / Published: 11 December 2024
(This article belongs to the Special Issue Advances in Bioprocess Monitoring and Control)

Abstract

:
This paper offers an in-depth review of adsorbable organic halogens (AOXs), a group of halogenated organic compounds that can be adsorbed from water onto activated carbon. AOXs are emerging contaminants derived from various industrial and household products containing active halogens. Significant concentrations of AOXs are commonly detected in wastewater originating from industries such as the paper and pulp, textile, tannery, chemical and pharmaceutical industries. The standard method for AOX determination is defined in UNI EN ISO 9562:2004. The technical literature indicates that the reliability of AOX measurements can be affected by various factors. This study investigated the possible toxicity of AOXs on wastewater treatment plants, an aspect that has received limited attention in terms of its impact on aerobic biological processes. To bridge this gap, respiratory tests were performed on different aerobic biomasses sourced from large-scale wastewater treatment facilities to evaluate potential inhibitory effects. The results underscore the importance of adopting a case-by-case approach when assessing the risks associated with these contaminants.

1. Introduction

AOX is the abbreviation for “adsorbable organic halogens”, in which the letter “A” stands for “adsorbable”, the “O” for “organic” and the “X” represents the halogens chlorine, bromine and iodine [1]. The AOX parameter was introduced in 1976 as a sum parameter to quickly determine the total amount of organic halogens [2]. It is described as the chloride substances that may be adsorbed from water onto activated carbon and represents an equivalent quantity of chlorine, bromine and iodine—but not fluorine—in organic compounds [3]. Hence, AOCl, AOBr and AOI are included in the AOX parameter. In order to evaluate the quality of water and wastewater, the AOX parameter measures the concentration of halogens that are organically bound in water samples [4].
The halogenated organics are emerging contaminants (ECs) from the industrial and household usage of different active halogen-containing products for several purposes [5]. High concentrations of AOXs—far greater than 1 mg L−1—can be found especially in bleaching wastewater from the pulp and paper industry [6,7], wastewaters from the textile industry [8], tanneries [9], the chemical industry [10], the pharmaceutical sector [11], hospitals [12] and landfill leachate [13].
Due to their physical and chemical properties, AOXs are highly recalcitrant contaminants and have high potential for accumulating in surface water organisms. Fish and zooplankton exposed to AOXs show toxic and carcinogenic effects including death [6]. AOXs may also pose a long-term risk to human health when they enter the body through the food chain [5].
According to the Stockholm Convention, 23 AOCl compounds are classified as POPs (Persistent Organic Pollutants) [14]. The AOX emission level associated with the best available techniques (BAT-AEL) for the treatment of water-based liquid waste is in the range 0.2–1 mg L−1, as described in the BAT conclusions [15]. However, there are no standard regulatory guidelines that specify what constitutes an acceptable AOX content.
UNI EN ISO 9562:2004 specifies the standard method for the determination of AOX levels [3]. Some studies have identified various factors affecting the reliability of AOX determination, including chlorinated sample preparation and pretreatment procedures [16,17]. Therefore, a standard-compliant preparation of the sample is a crucial aspect for a reliable AOX analysis. Other factors that may influence the result of the AOX measurement are the activated carbon properties [18,19], halide dosages [20,21], rinsing solutions [18,20] and coexisting compounds [22]. All the laboratories involved in this study applied the same analytical method, but they obtained very different values from each other.
Aerobic biological treatment involves the removal of biodegradable organic matter from wastewater through a biological oxidation process carried out by a microbial consortium [7]. The most widespread aerobic biological process is the activated sludge process (ASP). The ASP is only effective when the microorganisms grow in a healthy way, settle and compact in the secondary settling tank so that the return sludge concentration is high enough to maintain the mixed liquor suspended solid (MLSS) concentration at the required level [23]. Although AOX compounds have varying degrees of toxicity [7], there is little research on their impact on the operation of aerobic biological processes. Gupta et al., 2011, studied the impact of AOX compounds on the performance and microbial community structure in the ASP [7]. In the present work, the possible inhibitory effect of AOX-containing substrates on different types of aerobic biomasses (i.e., mesophilic and thermophilic) was evaluated by carrying out a substantial number of Oxygen Uptake Rate (OUR) tests. The analytical criticalities encountered had a high weight in the evaluation of the working point and starting AOX concentration using real aqueous waste.

2. Materials and Methods

2.1. AOX Analytical Method

The standard procedure for the determination of AOXs is specified in UNI EN ISO 9562:2004. The AOX measurement method consists of three steps [24,25,26]:
  • Enrichment of organic halogen compounds on activated carbon with contemporaneous isolation of unwanted organohalogen byproducts from acidified samples;
  • Use of a nitrate solution to wash the activated carbon in order to remove interfering inorganic halides;
  • High-temperature—at least 950 °C [1,4]—combustion in order to mineralize the adsorbed organic halogens; reaction gases are conveyed to a drier and then to the Ag-coulometric titration cell for the determination of released hydro-halogenides. Here the halogen content is calculated based on the number of electric charges using Faraday’s law. The result of the AOX analysis is expressed as µg(Cl) L−1.
UNI EN ISO 9562:2004 allows the use of two different operating modes:
  • In the column method, the sample is pressed over at least two interconnected columns filled with granular activated carbon (GAC) placed inside an adsorption column;
  • In the shaking (or batch) method, the sample is shaken, for a specific period, with powdered activated carbon (PAC), which is subsequently separated from the matrix to be analyzed using a polycarbonate filter.
Standard-compliant preparation of the sample is a key aspect for a reliable AOX analysis. There are many factors that can distort the results [4]:
  • A concentration of inorganic chloride ions above 1000 mg L−1, which may cause interference or false-high readings;
  • The presence of bacteria and algae containing chloride ions;
  • The presence of inorganic bromides and iodides;
  • A dissolved organic carbon (DOC) content that is too high, which can lead to an underestimation;
  • A poor affinity of the halogenated compounds for activated carbon.
Therefore, before the AOX analytical procedure starts, several parameters have to be inspected carefully. All the recommendations to be followed to meet all boundary conditions are listed in UNI EN ISO 9562:2004. Briefly,
  • The standard method is applicable to samples with concentrations of inorganic chloride ions of less than 1 g L−1; samples with higher concentrations should be diluted before enrichment on activated carbon.
  • The standard method is also applicable to samples containing insoluble halides, i.e., halogens that are adsorbed on suspended solids; filtration of the sample before the analysis allows for the separate estimation of dissolved and particulate AOXs.
  • The pH value for the adsorption of the sample should be ≤2 [4].
  • Oxidizing agents in the sample must be rendered ineffective by adding sodium sulfite [4].
In this work, in order to evaluate the presence of any critical issues in the measurement of AOXs, two samples containing different concentrations of AOXs were taken:
  • Sample S1, which was effluent from a thermophilic oxidative biological plant;
  • Sample S2, which was a mixture of aqueous waste in which the presence of organochlorine compounds was ascertained.
Sample S2 was expected to have a high concentration of AOXs, while sample S1 was expected to have a low concentration of AOXs because it was taken from downstream of a thermophilic oxidative biological treatment.
Then, four different laboratories—namely Lab-1, Lab-2, Lab-3 and Lab-4—were asked to measure the AOX content of the two samples according to UNI EN ISO 9562:2004.
The AOX concentration values reported in the tables and graphs for the OUR tests came from the measurements carried out by Lab-1.

2.2. Oxygen Uptake Rate Tests

The OUR test is used to measure the dissolved oxygen (DO) consumption over time by a microbial community in a given sample. Both endogenous and exogenous OURs were evaluated in this study. Since the endogenous OUR test measures the oxygen consumption rate of microorganisms in the absence of an external substrate, the endogenous OUR only represents the oxygen consumed by biomass respiration. The exogenous OUR test allows us to also quantify the additional fraction of oxygen consumed by microorganisms for the oxidation of the biodegradable organic matter or of the nitrogenous compounds in the presence of an external substrate.
The DO concentration was measured using a WTW Multi-parameter portable meter MultiLine® Multi 3510 IDS with WTW Optical IDS FDO® 925 dissolved oxygen sensors (Xylem Analytics Germany Sales GmbH & Co, Mainz, Germany) (called a DO probe in the next sections). The measured DO concentration was transferred to a PC via a USB connection and the MultiLab® Importer; for data acquisition, Excel® software (Microsoft Office 2024) was used.
In order to assess the actual biological treatability of substrates containing a rather high level of AOXs, in this study, both batch tests and continuous tests were carried out. Five different types of biomasses from different types of plants were tested:
  • Mesophilic biomass from a municipal WWTP (Wastewater Treatment Plant) with a capacity of 50,000 PE (Population Equivalent) that can receive industrial aqueous waste (B1);
  • Mesophilic biomass from a municipal WWTP with a capacity of 100,000 PE (B2);
  • Mesophilic biomass from a municipal WWTP with a capacity of 1500 PE (B3);
  • Mesophilic biomass from a municipal WWTP with a capacity of 15,000 PE (B4);
  • Thermophilic biomass from a WWTP with a capacity of 50,000 PE that treats industrial aqueous waste (B5).
More information about the tested biomasses is reported in Table 1.
It was decided to evaluate the exogenous OUR using the substrate as is, and with different dilution factors (DFs): 1:2 and 1:5. Since the results obtained with DFs 1:2 and DF 1:5 were similar, in some cases, the tests were carried out only with the aqueous waste that was diluted 1:5.
Temperature and pH were measured using a WTW-IDS Model SenTix® 940 probe (Xylem Analytics Germany Sales GmbH & Co, Mainz, Germany). All the OUR tests were conducted at atmospheric pressure and in a temperature range of approximately 12–20 °C. When the pH of the substrate was too high, it was decided to correct the pH of the solution by dosing it with hydrochloric acid (HCl) or sulfuric acid (H2SO4). Therefore, in Table 2 and Table 3, “NB” indicates a non-buffered sample, characterized by a pH of approximately 9 or 10, while “B” indicates a buffered sample, characterized by a pH of approximately 8.

2.2.1. Batch Tests

The immediate performance of the OUR tests in the batch mode, combined with the minimal instrumentation needed and the speed of execution, is a significant advantage [27,28]. The experimental apparatus employed in this study was similar to that used by Borzooei et al. [29] and Capodici et al. [30]. The components included a flask, a magnetic stirrer with a magnetic bar, a DO probe, a personal computer, a mechanical aerator, a porous stone and sealing film. The procedure is described below:
  • The volatile Suspended Solid (VSS) concentration (gVSS L−1) of the tested biomass was analyzed;
  • The biomass volume was put into a flask placed on a magnetic stirrer; the magnetic bar spinning at the bottom of the flask allowed the biomass (or the biomass–substrate mixture in the case of an exogenous test) to remain well mixed during the test;
  • The porous stone connected to the mechanical aerator was immersed in the biomass volume to increase the DO value, together with the probe to measure the DO value;
  • The biomass was aerated until saturation: when the DO value was stable, the aeration was interrupted;
  • Only in the case of an exogenous test, after turning off the aeration, the volume of substrate to be tested was poured into the flask together with the biomass;
  • Immediately after turning off the aeration, the flask was sealed with parafilm in order to isolate the volume and to avoid air exchange with the external environment;
  • Lasty, data transfer from the probe to the computer was started. The data were recorded in an Excel spreadsheet at 5 s intervals.
At the end of the test, the trend in the DO value over time was plotted in a scatter chart using the calculation program Excel. The slope of the linear regression line, which interpolates the measured data, was extrapolated from the scatter chart. Only the central section of the curve was considered at this stage. Then, the specific OUR (sOUR) value, expressed in mgDO gVSS−1 h−1, was calculated by dividing the slope of the DO utilization curve (mgDO L−1 h−1) by the VSS concentration in the batch reactor (gVSS L−1). The sOUR value indicates the oxygen consumption rate of the biomass with respect to the degradation of the organic matter contained in the substrate alone. In other terms, sOUR is the OUR value of endogenous aliquot.
If it was necessary, the non-specific OUR value was normalized for a temperature (T) of 20 °C using the following formula (valid for T values between 15 °C and 25 °C):
OUR(20 °C) = OUR ∙ θ(20 – T)
where θ is equal to 1.05 if T < 20 °C and to 1.07 if T > 20 °C.
The endogenous OUR tests were first conducted with 300 mL of biomass to study the endogenous respiration alone. In the exogenous OUR tests, 300 mL of biomass was aerated up to a DO concentration of 7.5–8.0 mg L−1, and then mixed with 300 mL of a substrate with a certain AOX concentration. At this point, the aeration was stopped and the laboratory scale batch reactor with a 600 mL mixture was hermetically closed to avoid oxygen exchange with the external environment. During the test, the DO concentration (mg L−1) was measured every 5 s. Each batch OUR test was stopped when the dissolved oxidation concentration was below 2 mg L−1, which lasted for approximately 10–20 min. Due to the limited duration, the batch OUR test allowed for immediate detection of possible short-term acute toxic effects of the tested substrate on the biomass.
In order to obtain more reliable results, each type of test (endogenous and exogenous with a certain biomass/substrate dilution ratio) was repeated at least a second time to be able to calculate an average value for different measurements carried out under the same experimental conditions. Finally, for each experimental condition, the standard deviation and the 95% confidence interval were calculated.
Table 2 and Table 3 show the types of biomass and the substrate characteristics for all the batch tests that were carried out. Both real aqueous wastes and halogen-rich solutions prepared in the laboratory were tested.
Some batch tests were conducted in order to evaluate the effect of the type of AOX, i.e., an AOX of natural origin (referred to as a “conventional AOX”) and an AOX of anthropogenic origin (referred to as a “bad AOX”). An example of an anthropogenic AOX is dichlorophenol, which is used as a germicide, antiseptic and seed disinfectant.

2.2.2. Continuous Tests

Continuous OUR tests allowed us to draw a curve, called a respirogram, for the OUR trend over time. The DO value was monitored in order to assess its consumption under both endogenous and exogenous conditions, following the addition of a carbonaceous substrate. It was decided to continue the test until the substrate was almost completely consumed, that is until the value of the exogenous sOUR was equal to the endogenous one. The purpose of the continuous OUR test was to assess the following:
  • Possible medium–long-term toxic effects caused by the tested substrate on the biomass;
  • The AOX removal by measuring the AOX concentration in the settled effluent at the end of the test.
The continuous OUR tests were carried out with a laboratory-scale reactor containing 250 (or 400 or 500) mL of biomass and 250 (or 400 or 500) mL of substrate. The reactor was isolated to avoid oxygen exchange with the surrounding atmosphere and loss of volume by evaporation. The aeration was always kept in the 2–5 mg L−1 range for the mesophilic biomass and in the 1–3 mg L−1 range for the thermophilic biomass thanks to the connection of the aeration system to an electric mechanism that guaranteed the connection and detachment of the aeration. The electrical mechanism was regulated by software installed on the PC and through the DO concentration measured by the DO probe. The latter was also connected to the PC. The data acquisition system was crucial in enabling the PC to obtain the DO data that was measured in the reactor. These tests lasted approximately 8 h. At the end of the test, a series of decreasing curves (DO consumption curves) were acquired, showing the reactor’s alternating aeration and non-aeration phases. Using the same process as that described for the batch tests, the final sOUR values (mgDO gVSS−1 h−1) were calculated. Lastly, the respirogram was drawn.

3. Results

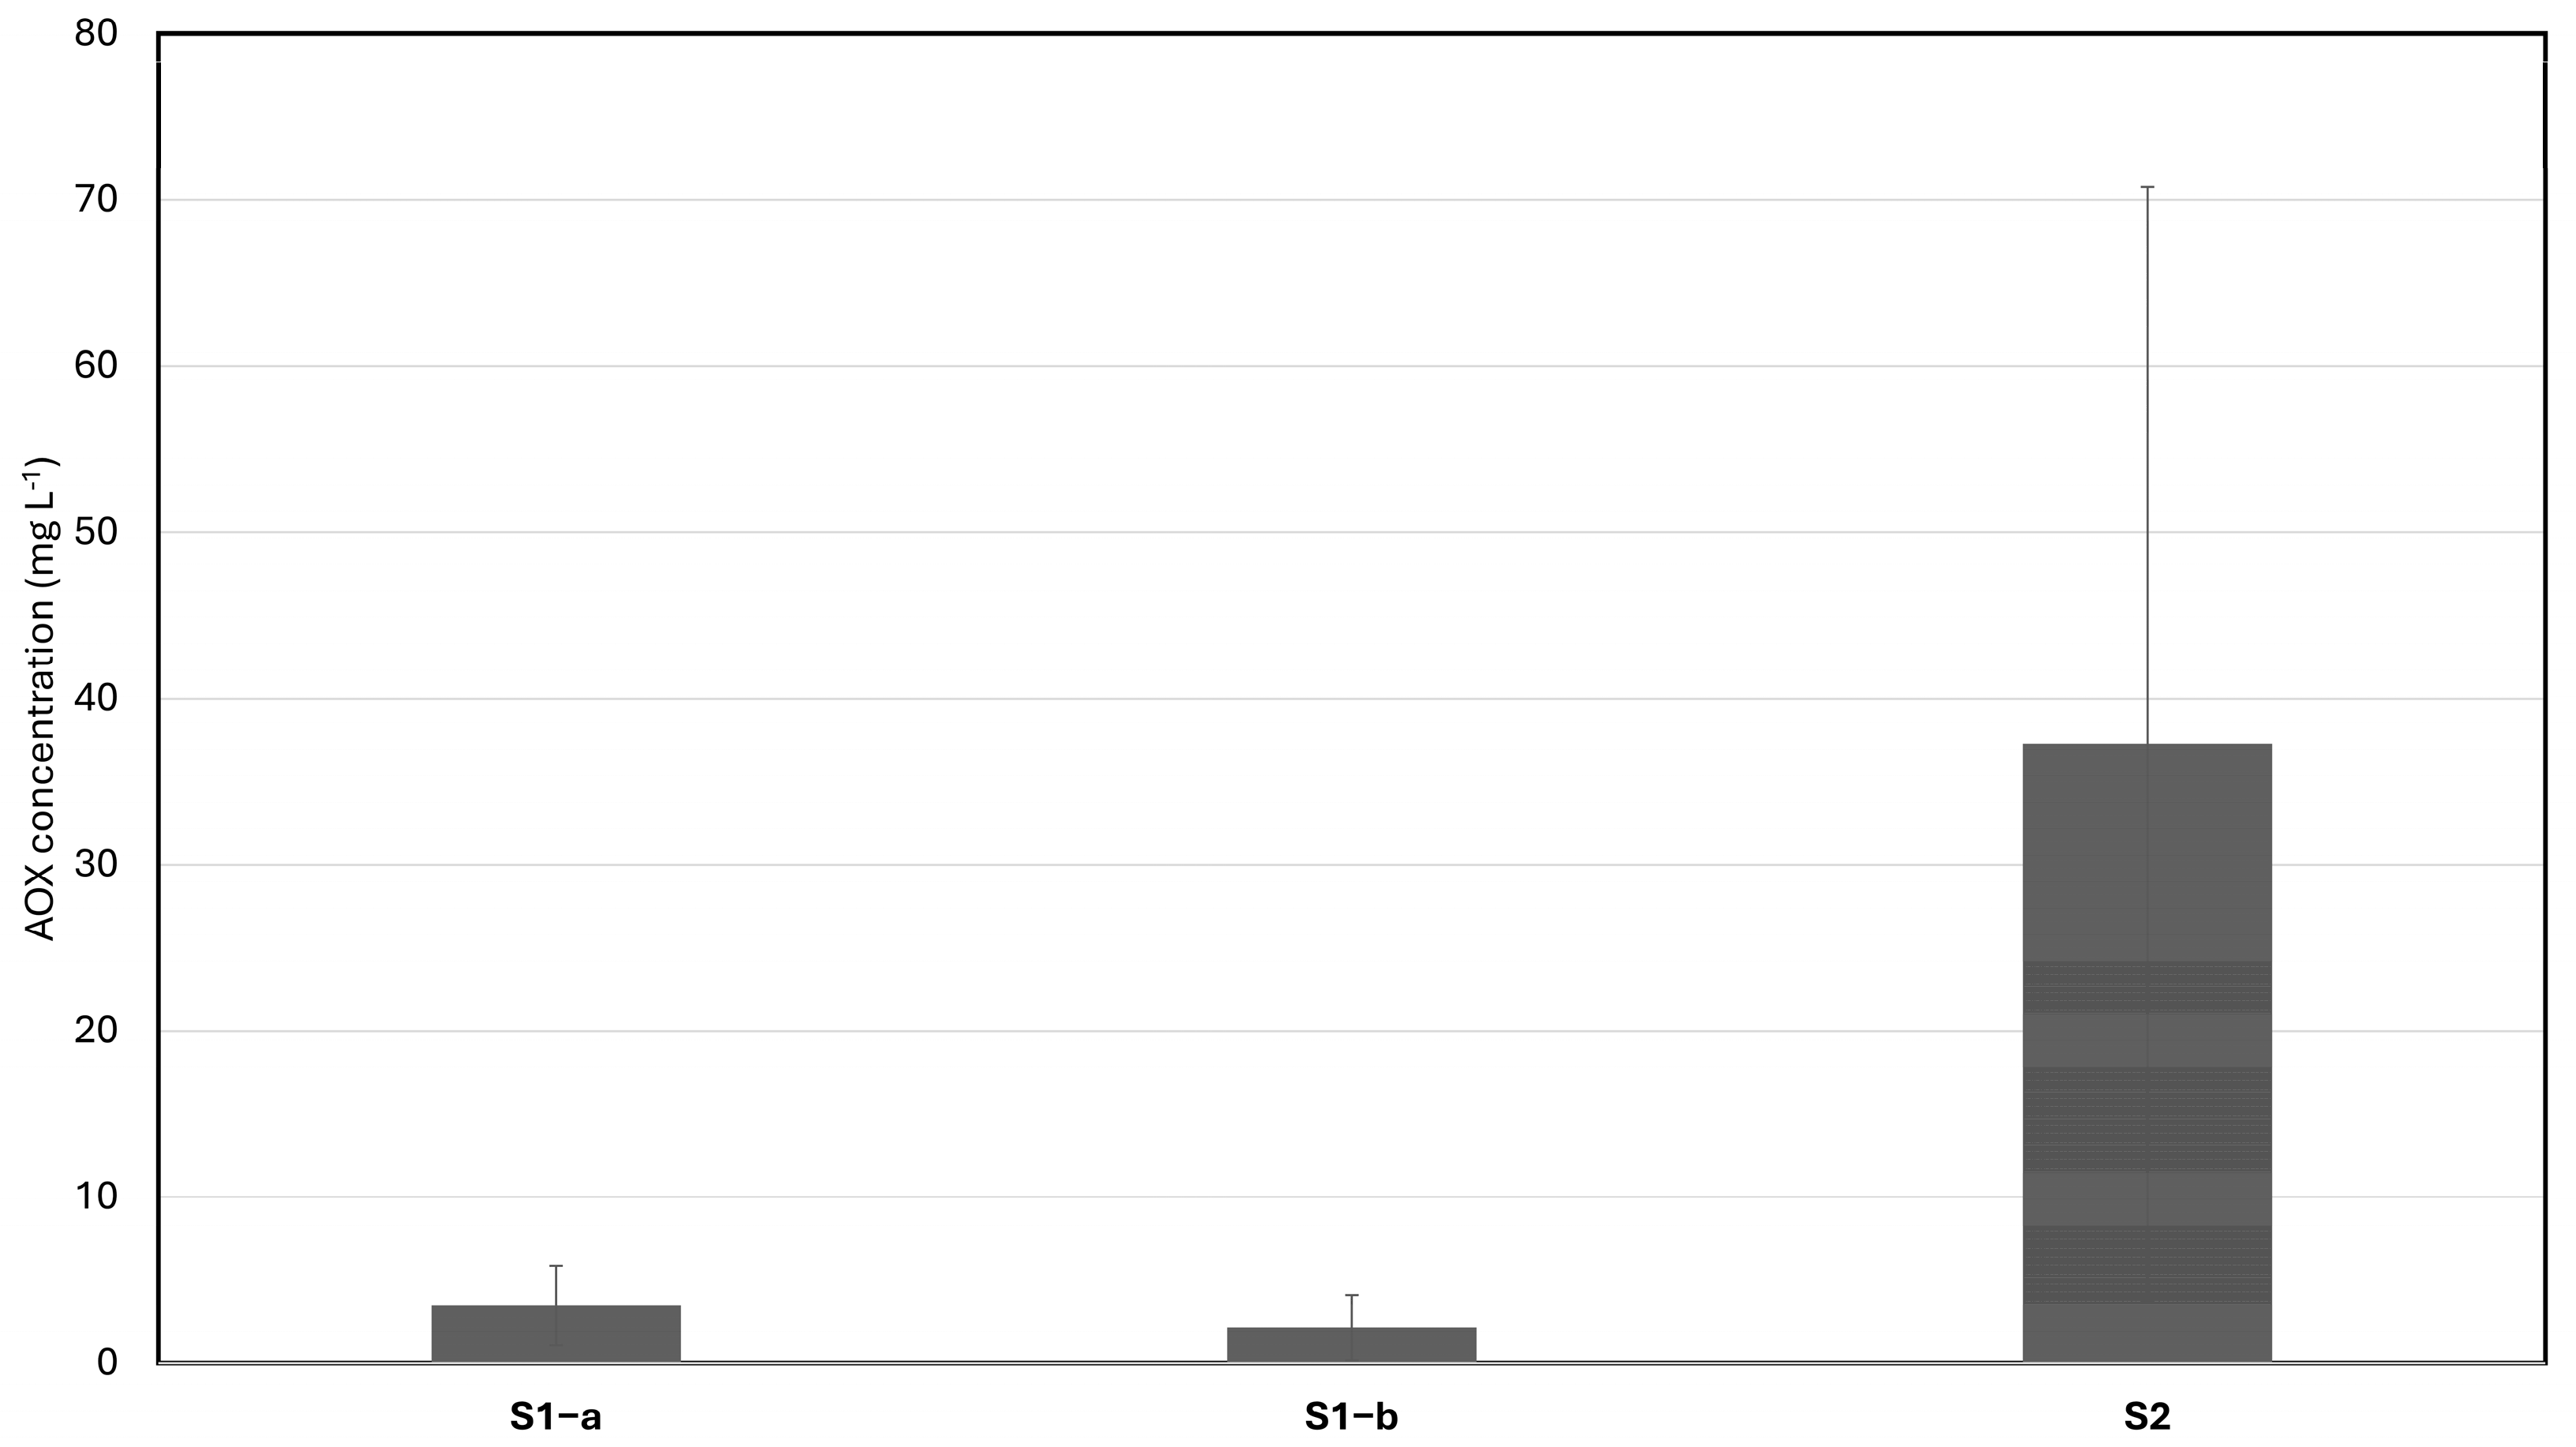
3.1. AOX Analytical Method

Table 4 shows the results obtained by the four laboratories for the AOX content assessment of samples S1 and S2.
Although all the laboratories applied the same analytical method, i.e., UNI EN ISO 9562:2004, they obtained very different values from each other. The marked differences—at least one order of magnitude—for samples with a high concentration, i.e., sample S2, led us to more deeply explore the topic by asking all the laboratories to provide the sensitive data necessary to calculate the AOX concentration, namely
  • The adopted adsorption method;
  • The amount of activated carbon;
  • The sample volume;
  • The volume of ultra-pure water used for washing before combustion;
  • Any other data used for the quantification of AOXs in the sample.
Lab-1 and Lab-2 adopted the shaking method, while Lab-3 and Lab-4 employed the column method.
Lab-1 and Lab-2 used 50 mg of activated carbon. Lab-3 used two columns—provided by Analytik Jena—per sample, each one containing approximately 50 mg of activated car-bon. Lab-4 also used the columns provided by Analytik Jena, but claimed that the activated carbon mass was not indicated, and it would be about 50–200 mg.
The third question allowed us to verify that all laboratories operated in the optimal range for the AOX assessment (0.01–0.3 mg L−1 of Cl) and that they tested 100 mL of sample—as is or after diluting it—in the adsorption process on activated carbon. The results showed that all the laboratories followed the standard method and therefore, they used 100 mL of the diluted samples. However, the samples were diluted with different DFs. Lab-1 used a DF of 1:2500, obtaining a concentration of 12 µg L−1 and certifying the concentration as 30.8 mg L−1. Lab-2 used a DF of 1:1000, obtaining a concentration of 86.5 µg L−1 (average value of the two tests, both using a DF of 1:1000) and certifying the concentration as 86.5 mg L−1. Lab-3 used a DF of 1:200, obtaining a concentration of 119 µg L−1 and certifying the concentration as 23.8 mg L−1. Lastly, Lab-4 used a DF of 1:100, obtaining a concentration of 80 µg L−1 and certifying the concentration as 8 mg L−1. It can be noticed that the certified value increased as the dilution ratio increased, except for Lab-1. In order to verify whether this cause/effect relationship actually exists, Lab-1 was commissioned to carry out the AOX quantification using four different DFs. The results were as follows: a DF of 1:2000 gave a value of 30.0 mg L−1, a DF of 1:1000 gave 25.4 mg L−1, a DF of 1:500 gave 27.3 mg L−1 and a DF of 1:200 gave 27.1 mg L−1. Thus, it can be stated that the result was not influenced by the different dilution ratios. Moreover, the measurement uncertainty was higher for Lab-4 with respect to the other laboratories.
The volume of ultra-pure water used for washing before combustion was different for all laboratories. Lab-1 employed 25 mL of a NaNO3 wash solution. Lab-2 used 5–10 mL of a washing solution, which was obtained by diluting a nitrate solution (Na-NO3 + HNO3) 1:20 with ultra-pure water to clean any remaining carbon from the flask and another 5 mL was used to rinse the walls of the flask. Lab-3 reported that the instrument washes the columns with a solution of sodium nitrate and nitric acid (according to the provider/method specifications) after adsorption. Lab-4 added 5 mL of a stock solution—a diluted solution of NaNO3 and HNO3—to the acidified sample and after adsorption, it was washed with 25 mL of a washing solution, a solution that was prepared by diluting the stock solution.
Lab-4 also reported that, in addition to the initial sample volume of 100 mL, in some cases, it was necessary to dilute the sample and therefore the DF may need to be taken into account. Their instrument provides the final µg L−1 value of Cl given the sample volume and the DF.
In any case, the key question was, which laboratory provided the most accurate data? Even though they all operated with automatic instrumentation and therefore with a limited amount of human error, it is impossible to establish which of the obtained datasets had a greater accuracy. Figure 1 shows the average value of the AOX content and the normal 95% confidence for the measurements performed by the abovementioned labs on three samples (S1a, S1b and S2). Samples S1a and S1b (S1 samples that were sampled at different times) had AOX concentrations lower than 7 mg L−1, while S2 had a concentration higher than 7 mg L−1. The results shown in Figure 1 show a concordant trend in the normalized data, which could argue in favor of a systematic problem. Therefore, further investigations will be necessary.
The wide variability in AOX measurements found in this study, from accredited chemical analysis laboratories, may affect regulatory compliance and may raise doubts about the actual efficiency of the analytical method used.
Table 5 presents additional information gathered from the laboratories to compare the measurement methods across the different analysis centers. Although the aspects investigated adhered to the expected regulations, variations between the laboratories were observed. This highlights that, despite regulatory compliance, the specific approaches and details may differ from one laboratory to another. In the study carried out by Yankovych et al., 2023 [31], the standards for AOX determination, such as ISO 9562 and EPA 9020B, and various alternative techniques were discussed. The EPA 1997 method, developed to monitor waters from hypochlorite bleaching in the paper industry, was performance in a single laboratory. This process produces chlorophenols with varying levels of halogenation, which is more stable than mixed industrial effluents, which are more complex. Errors of up to 50% are common, as noted in points 10 and 11 of the EPA 1997 method.

3.2. Oxygen Uptake Rate Tests
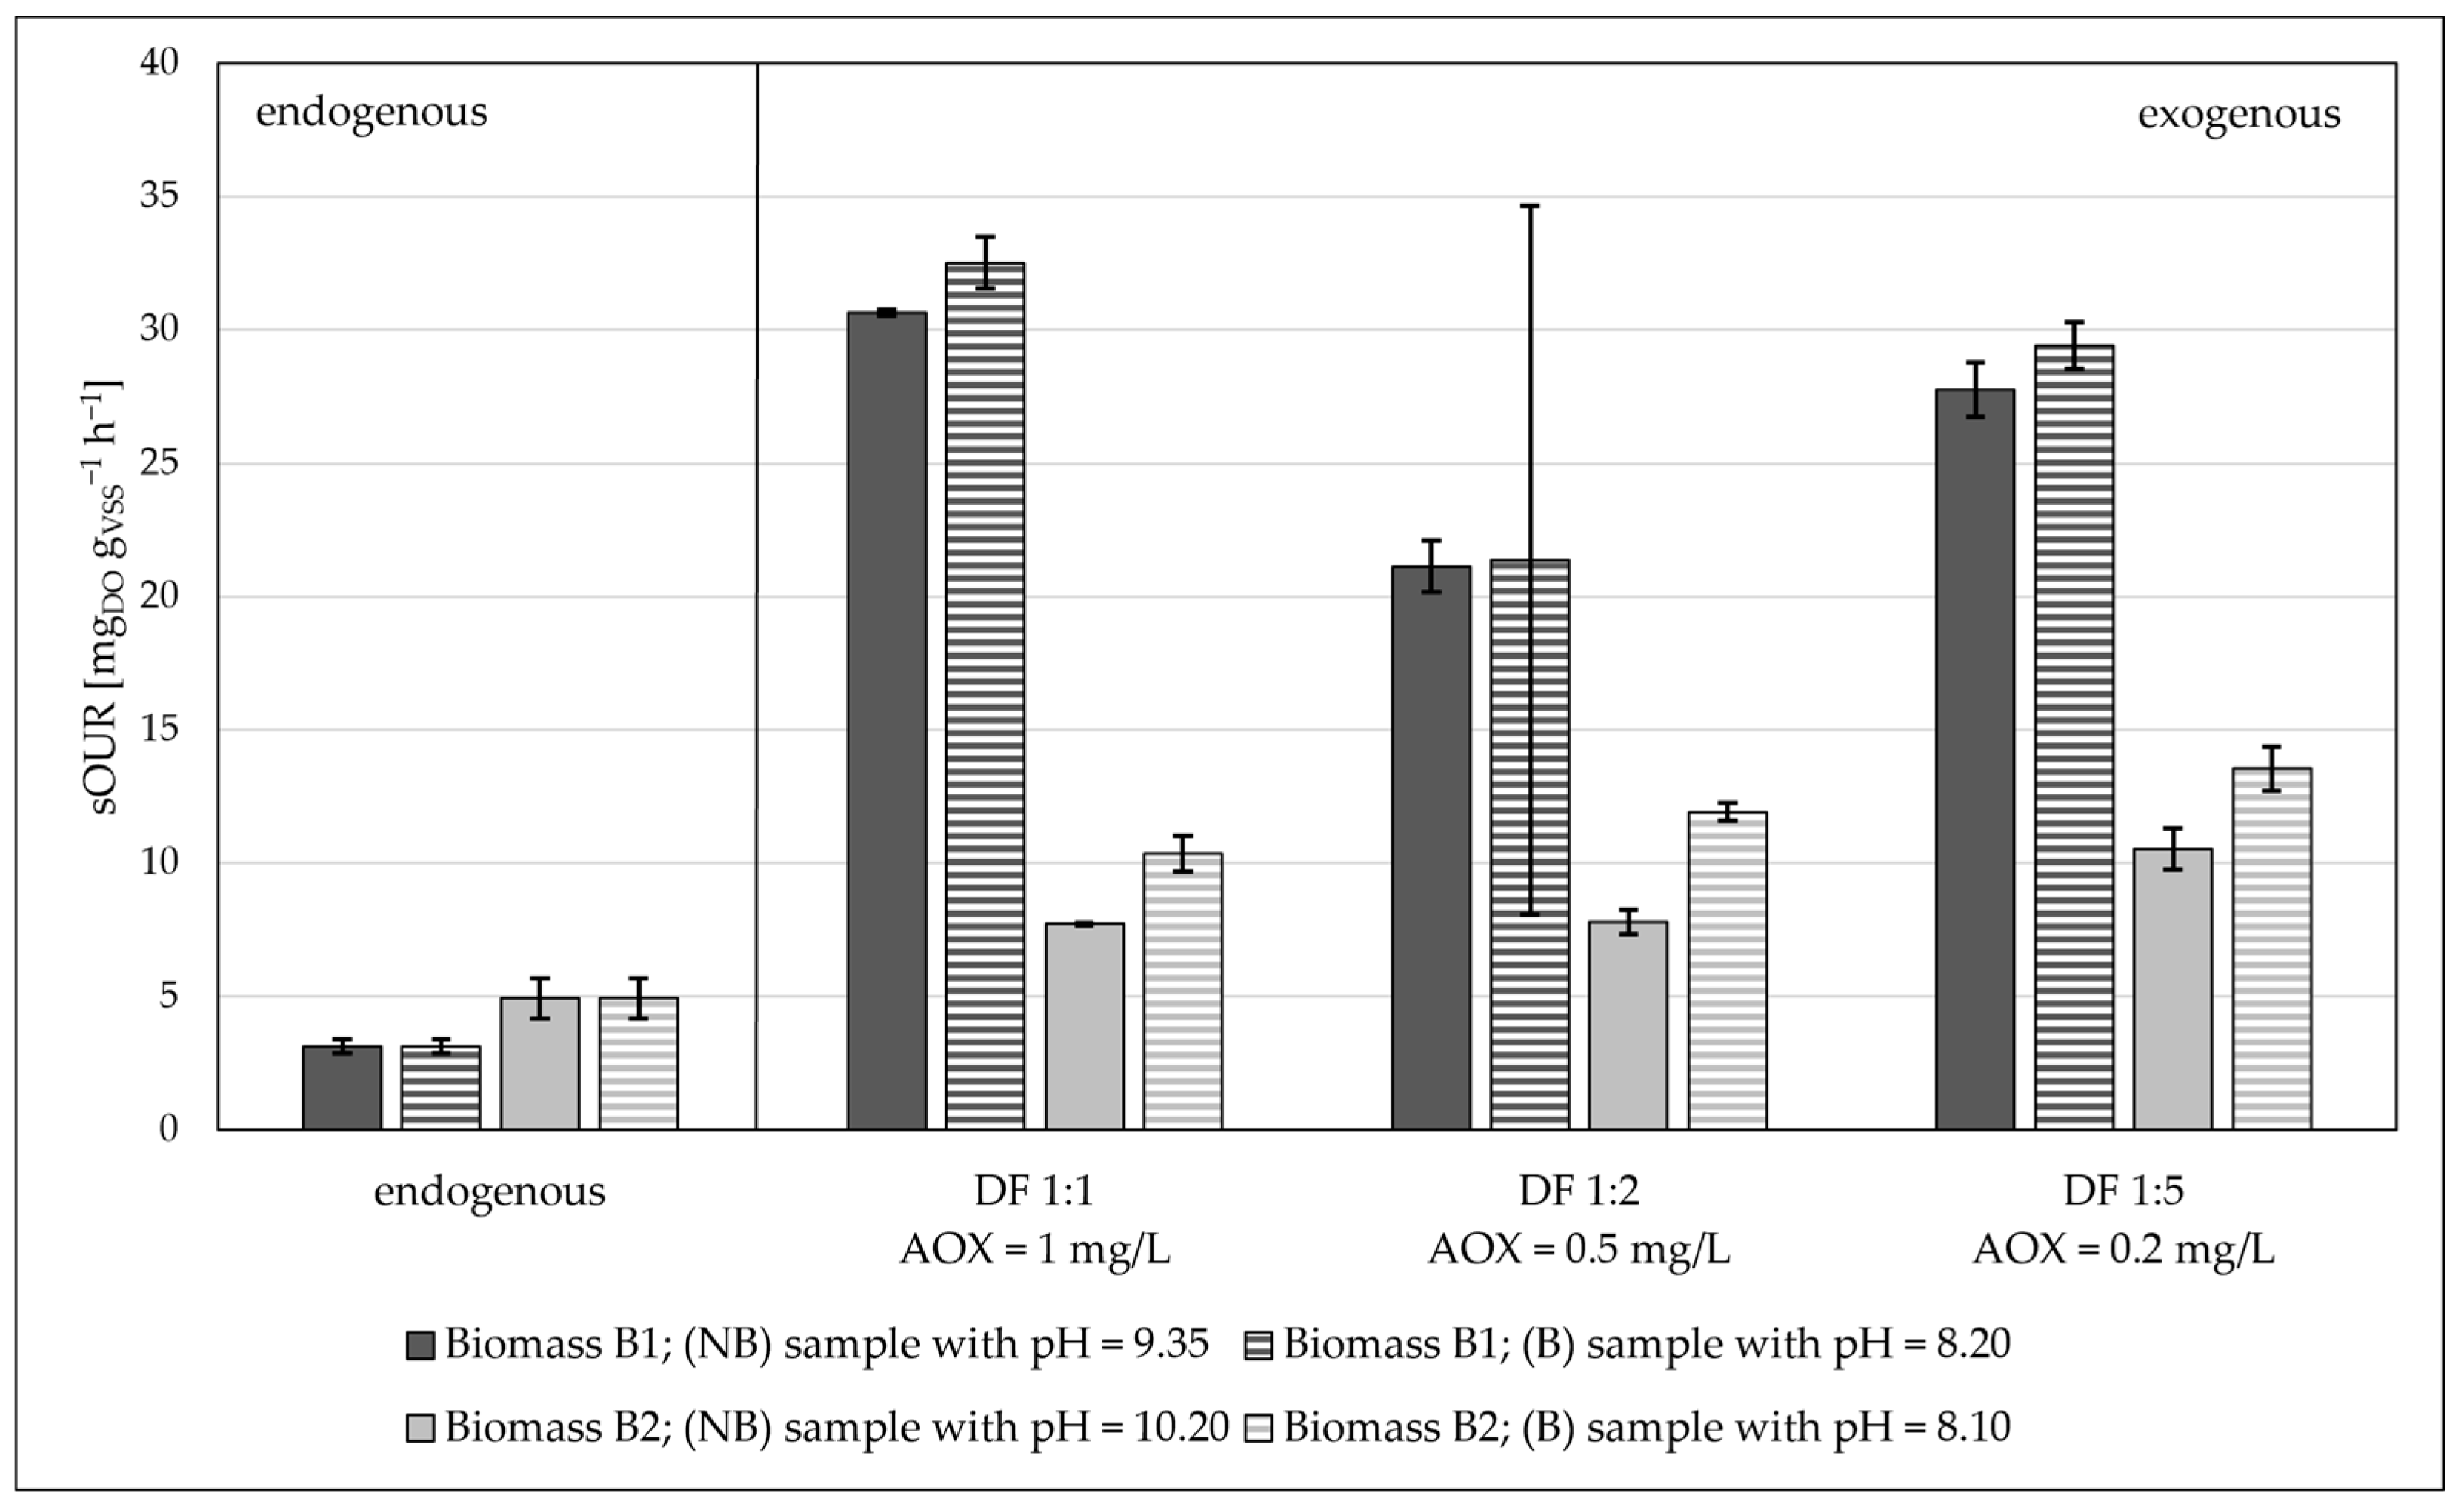
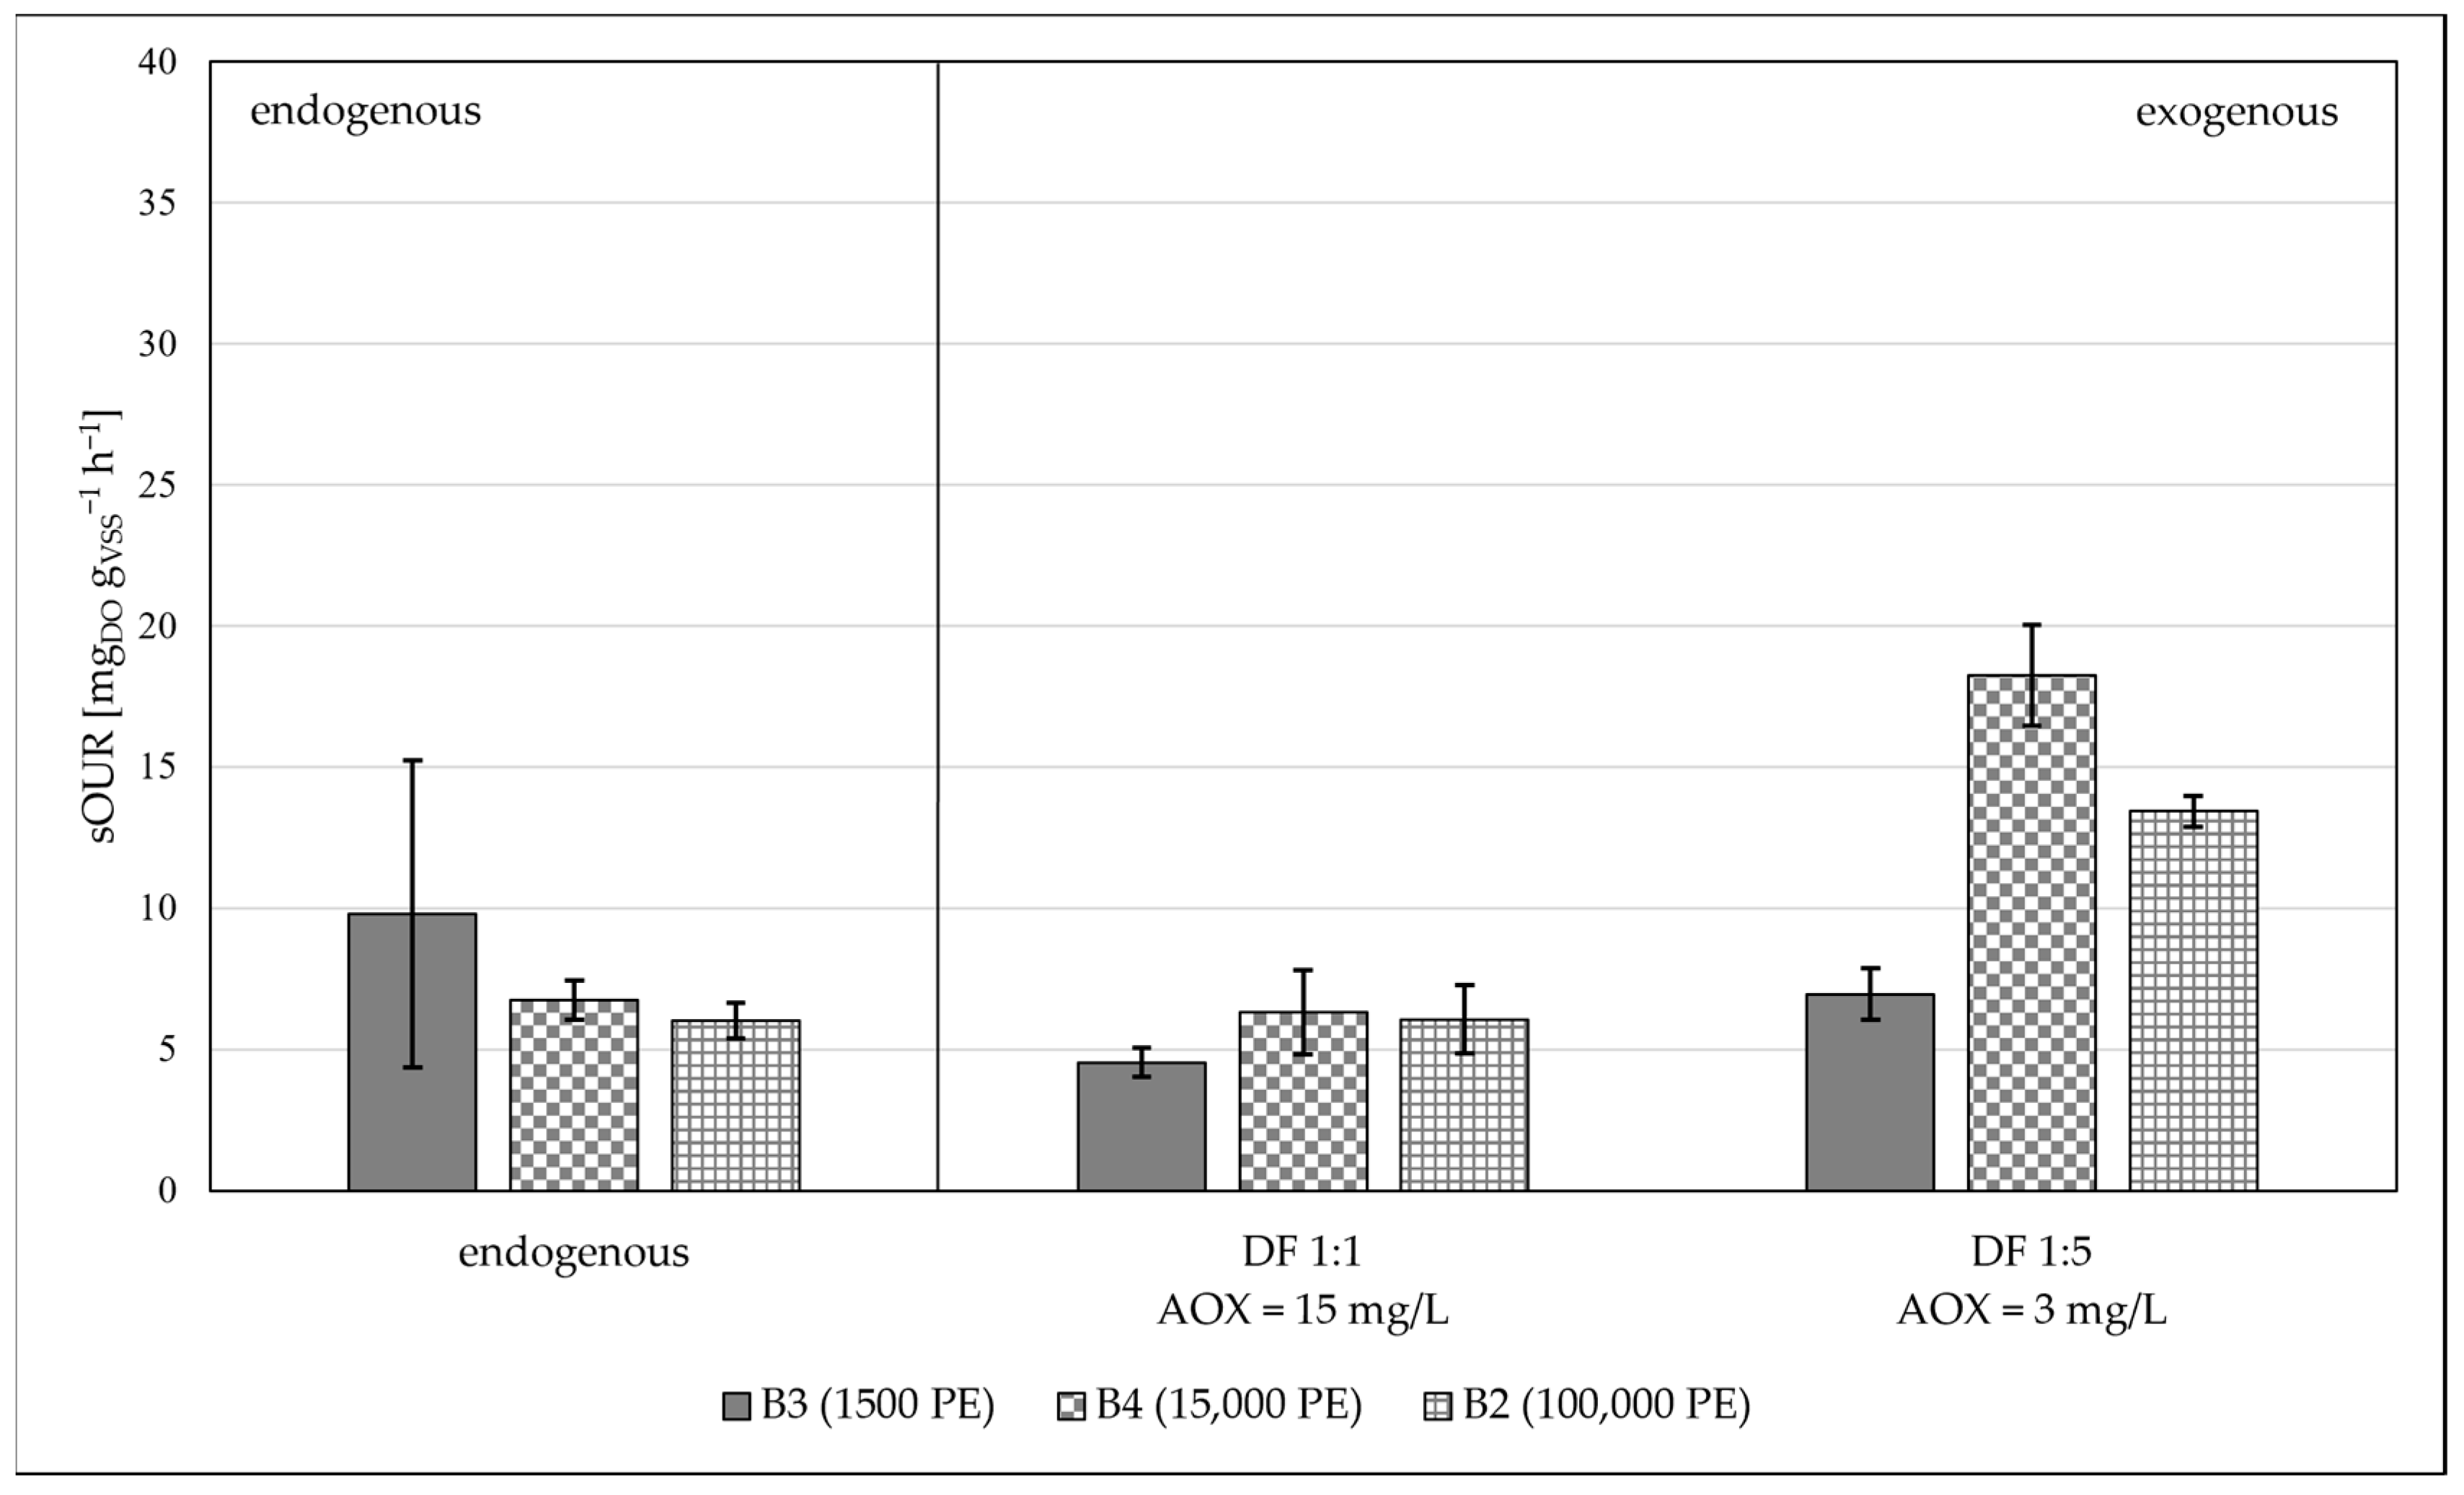
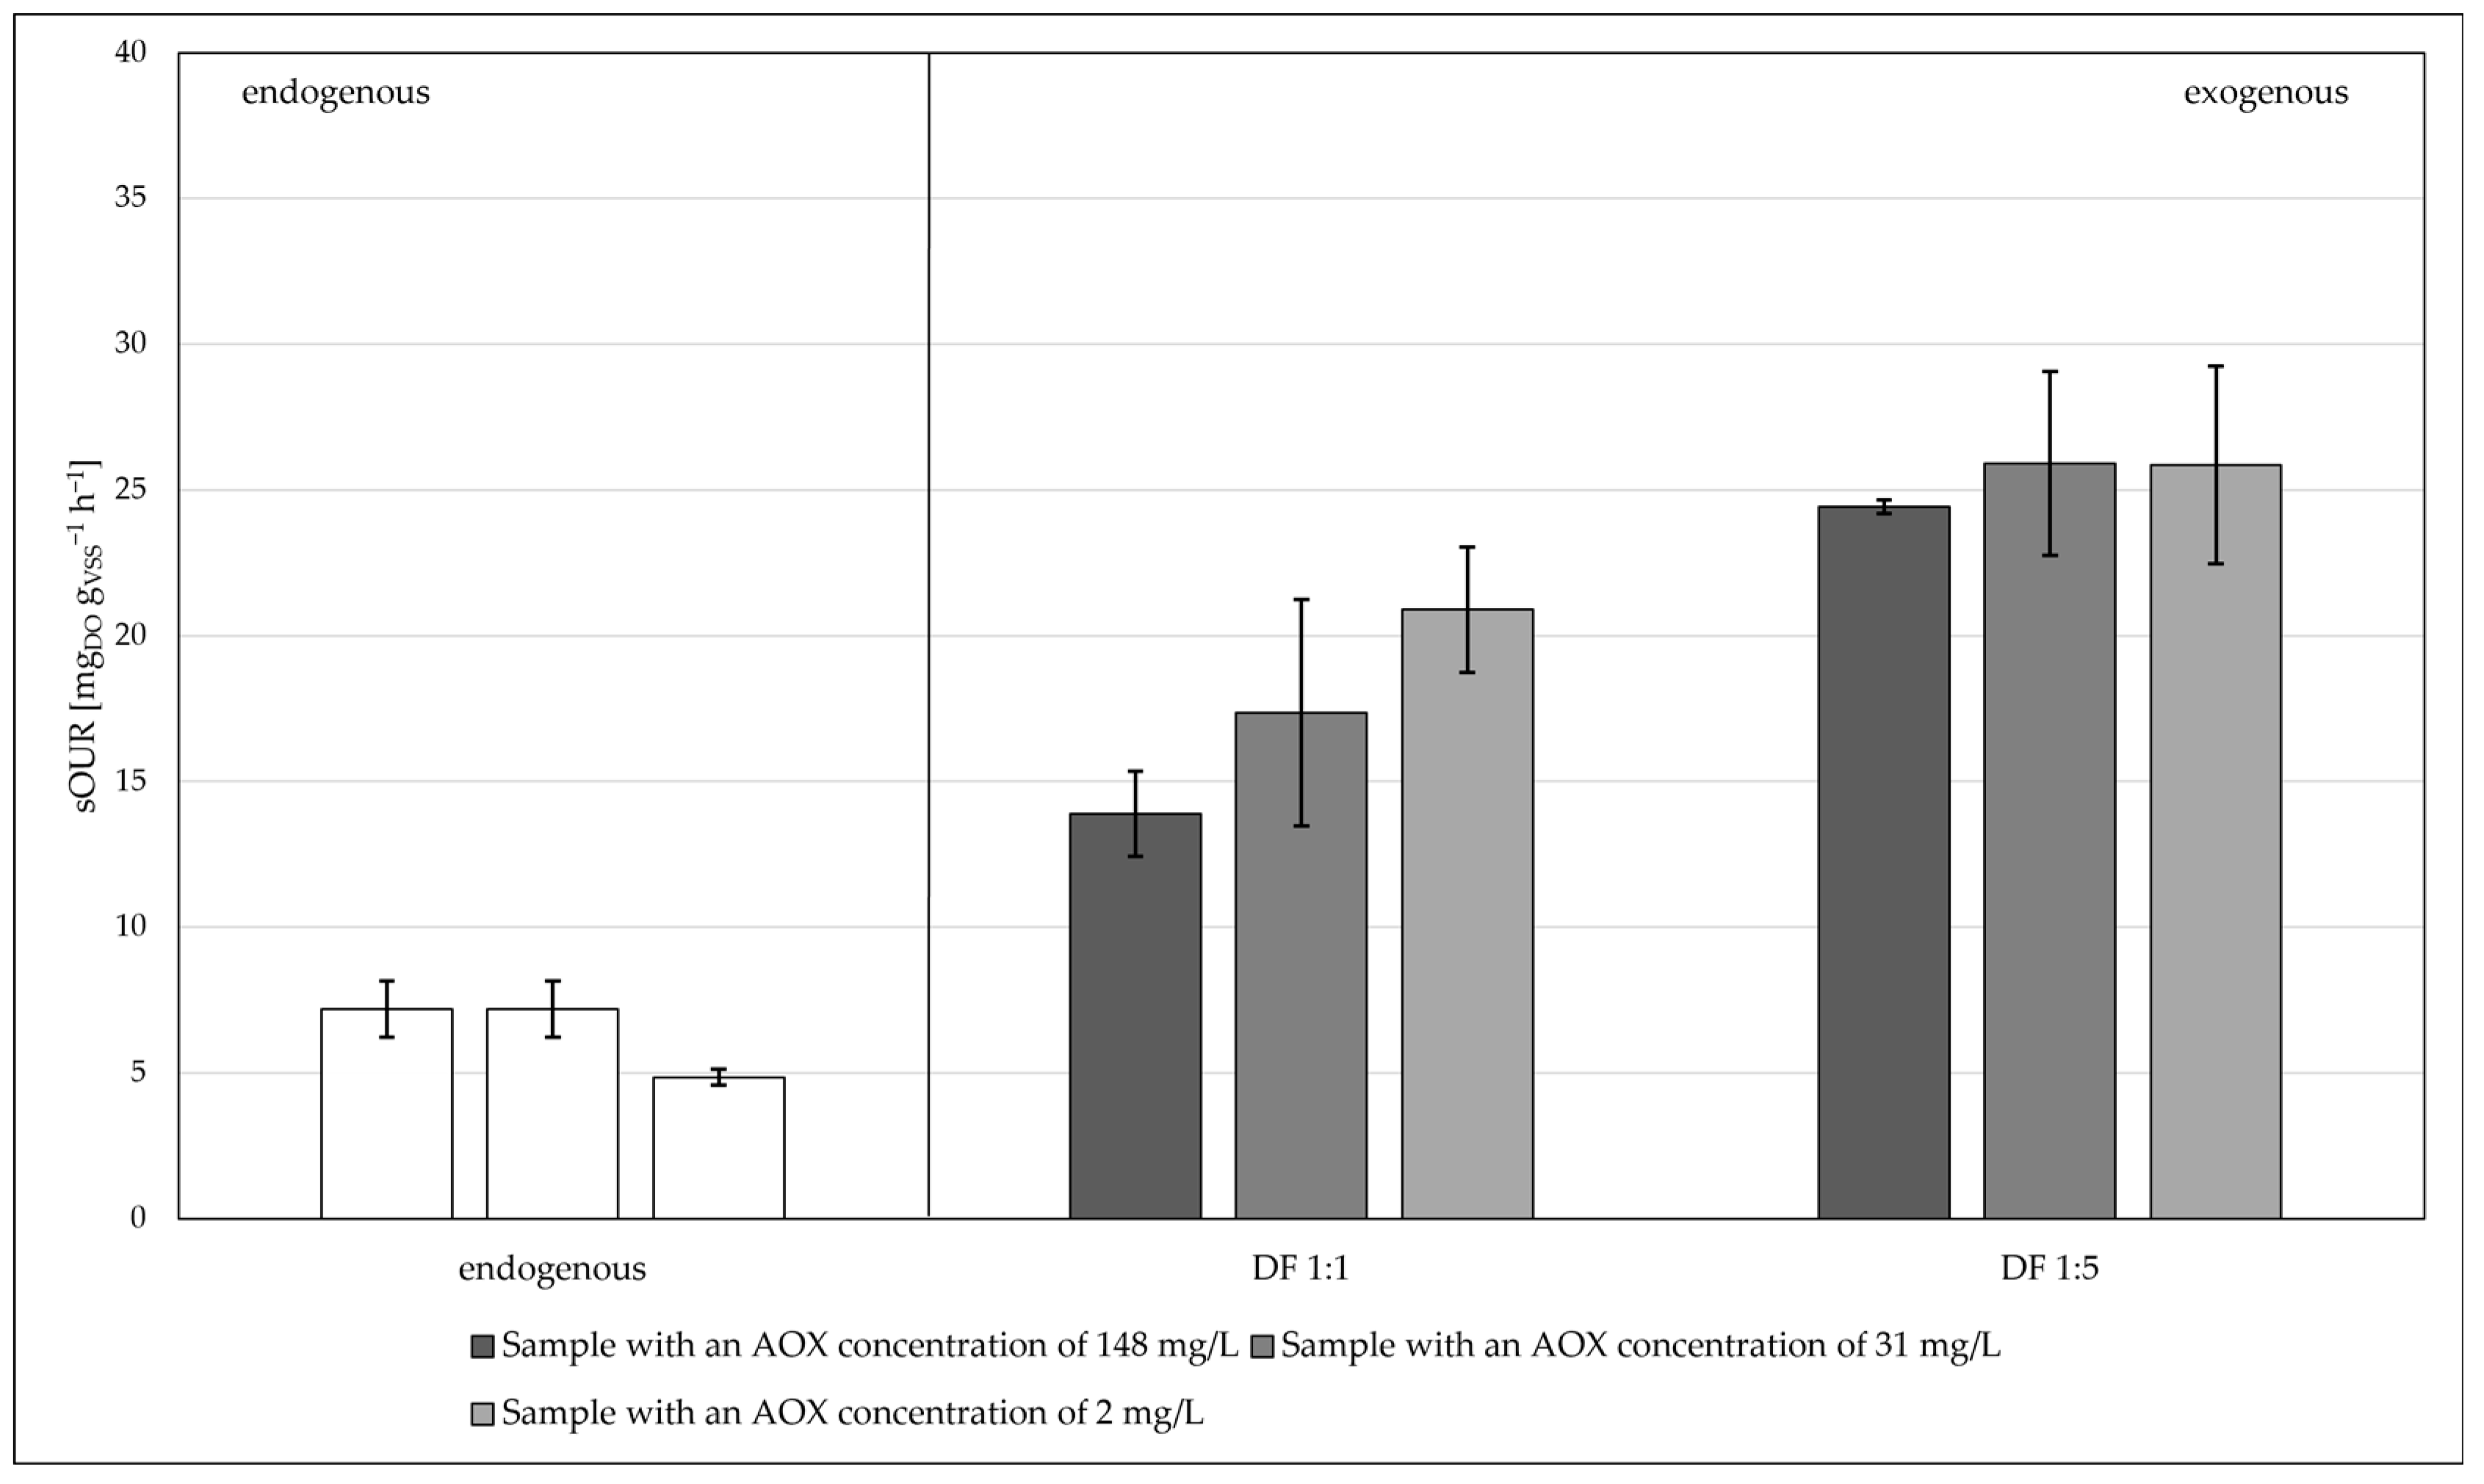
3.2.1. Batch Tests

As can be seen in Figure 2, the kinetics of the oxygen consumption increased by lowering the pH from about 9–10 to about 8. Furthermore, because industrial biomass B1 was already acclimated to “unconventional” pollutants, it had higher biological kinetics than the municipal biomass B2 when put in contact with the substrate containing AOXs, even if the endogenous value was lower for biomass B1.
Figure 3 compares the biological kinetics of the different biomasses from municipal WWTPs with different capacities. It can be observed that, as the biological kinetics increased with plant capacity, the biomasses originating from medium-to-low WWTPs required acclimatization.
Comparing the kinetics of oxygen consumption in the tests of the different samples containing different AOX concentrations, it can be noticed that there was no a considerable change in short-term oxygen consumption with a DF of 1:5 (Figure 4). With regard to DF 1:1, there was an increase in oxygen consumption shifting from the sample with the higher AOX concentration (i.e., for 148.00 mgAOX L−1, the sOUR was 13.884 mgDO gVSS−1 h−1) to the sample with the lower AOX concentration (i.e., for 2.00 mgAOX L−1, the sOUR was 20.891 mgDO gVSS−1 h−1). Thus, for a sample with a given AOX content, it may be concluded that the sample’s oxygen consumption will increase with the dilution factor.
Figure 5 shows that the different types of AOXs—i.e., conventional (natural) AOX and bad (anthropogenic) AOX—had similar short-term oxygen consumption kinetics for both types of biomasses tested (B1 and B2). However, with a higher DF, i.e., a lower concentration of the AOX, the kinetics of the oxygen consumption was higher. Furthermore, it can be observed that biomass B2 showed exogenous sOUR values lower than those of the endogenous one, except for the sample that did not contain any AOX, demonstrating a possible inhibitory effect due to the presence of an AOX.
Table 6 shows the results obtained from the batch tests carried out with the thermophilic biomass (B5). On days “A” and “B”, tests were carried out with the same aqueous waste that had an AOX concentration of 1.81 mgAOX L−1 and a pH of 7.80. Originally, it was decided to evaluate the exogenous OUR using the substrate as is and with two different DFs, i.e., 1:2 and 1:5. Since the results obtained with DF 1:2 and DF 1:5 were similar, on day “B”, the tests were only carried out with the aqueous waste diluted 1:5. On day “C”, aqueous waste characterized by an AOX concentration of 30.80 mgAOX L−1 and a pH of 8.00 was tested as is and with a DF equal to 1:5. It can be observed that as the dilution increased, the sOUR value increased on day “A”, decreased on day “B”, and remained almost the same on day “C”. Comparing the results obtained from the tests carried out on days “B” and “C”, it can be concluded that the higher the concentration of AOXs in the original aqueous waste (i.e., 30.80 mgAOX L−1 vs. 1.81 mgAOX L−1), the lower the sOUR value. Thus, thermophilic aerobic systems are particularly suited for the treatment of wastewaters with toxicity concerns resulting from high salinity levels or the presence of hazardous compounds [32]. The energy content of high-strength wastewaters is sufficient to allow for autothermal operation, avoiding the need for exogenous heat input: the release of significant energy from the microbial metabolism of the organic substrate allows for the maintenance of autothermal thermophilic conditions [32]. On the other hand, biomass separation is often difficult due to poor flocculation and the settling characteristics of thermophilic biomasses [32].

3.2.2. Continuous Tests

Table 7 shows that
  • By lowering the pH from values of about 10 to around 8, the oxygen consumption increases.
  • Industrial biomass B1, which was already acclimated to industrial wastewaters, showed a higher oxygen consumption than the civil biomass.
  • Under the same substrate conditions—same AOX concentration and same pH—the thermophilic biomass (B5) showed a lower oxygen consumption with respect to the industrial biomass (B1).
Table 8 shows that as the concentration decreased (from 30.80 to 2.00 and finally to 0.40 mg L−1), the oxygen consumption increased. However, as the concentration decreased from 0.40 to 0.20 mg L−1, the oxygen consumption decreased because the substrate was too diluted. Regarding the test in which the industrial biomass B1 was put in contact with a synthetic solution containing 80 mg L−1 dichlorophenol for 5 days, no medium-term toxicity effect was observed.
All the evidence shows that there was no inhibition of the aerobic biomasses tested, even in the medium term; however, low oxygen consumption was observed.

4. Discussion

This study aimed to investigate the critical issues that arise when measuring AOX concentrations in aqueous waste and to assess the potential impact of AOX-containing substrates on various aerobic biomass types.
UNI EN ISO 9562:2004 specifies the standard method for the determination of the AOX concentration in water and wastewater samples. Standard-compliant preparation of the sample is a crucial aspect for a reliable AOX analysis. In this study, four different laboratories —Lab-1, Lab-2, Lab-3 and Lab-4—were asked to carry out measurements of the AOX content of two samples: sample S1 was expected to have a low concentration of AOXs, while sample S2 was expected to have a high concentration of AOXs. The results showed that the standard procedure was followed by all the laboratories. They employed 100 mL of diluted samples. However, each laboratory used a different dilution factor (DF) and obtained very different values for the AOX concentration. In order to verify whether a cause/effect relationship between the DF of the sample and the AOX concentration actually exists, Lab-1 was commissioned to carry out the AOX analysis using four different DFs. The outcomes of this investigation showed that the AOX value was not influenced by the different dilution ratios. Moreover, the results of the two series of tests showed a concordant trend in the normalized data, which could argue in favor of a systematic problem. Therefore, further investigations will be necessary.
In this study, both batch tests and continuous tests were carried out in order to evaluate the actual biological treatability of AOX-containing substrates. Five different types of aerobic biomasses from plants with different capacities were tested. The results obtained can be summarized as follows:
  • By changing the pH value from about 9–10 to about 8, the kinetics of the oxygen consumption increased. Thus, the optimum pH range to ensure the best biomass respiration kinetics is close to neutrality;
  • The industrial biomass B1 showed higher biological kinetics compared to the civil biomass B2 when put in contact with aqueous waste containing AOXs. The explanation for this lies in the fact that the industrial biomass was already accustomed to “unconventional” pollutants;
  • Lower biological kinetics was observed for small civil plant biomasses, proving that biomasses coming from plants with a medium-low capacity need to be acclimatized;
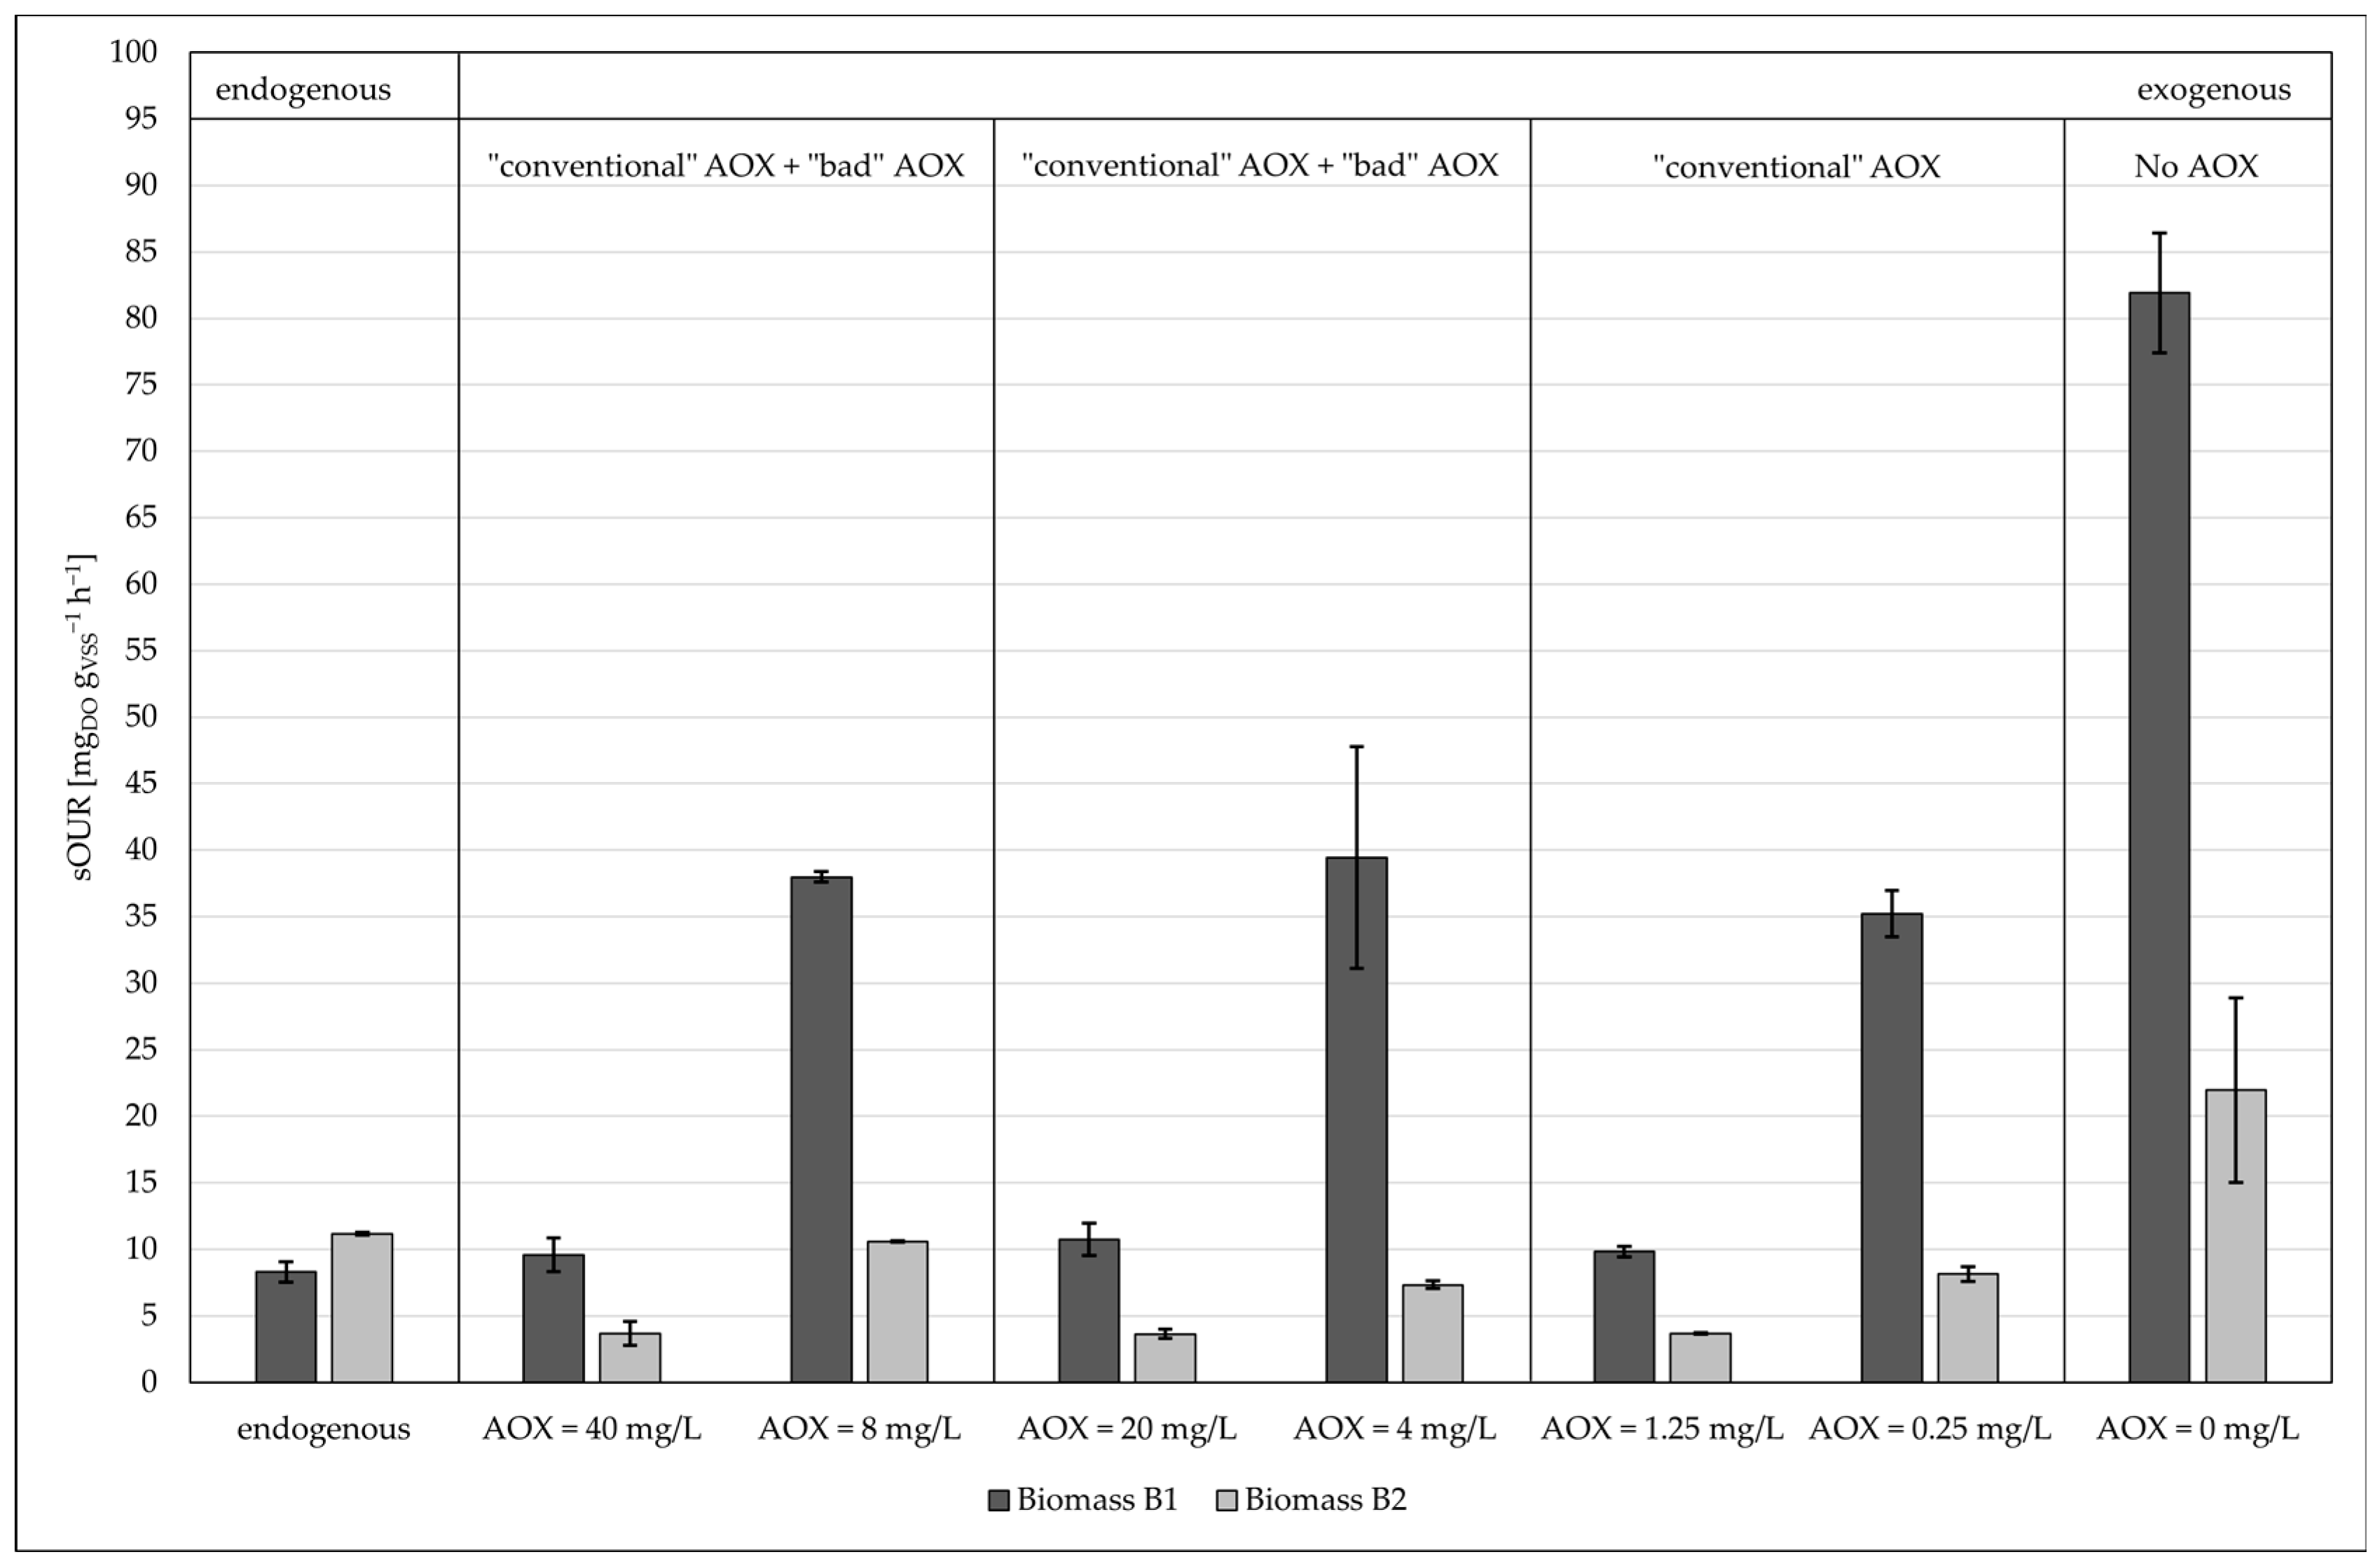
  • When the substrate was more diluted, i.e., it had a lower concentration of AOXs, the kinetics of the oxygen consumption was higher;
  • The type of AOX did not affect short-term oxygen consumption for both biomass B1 and biomass B2;
  • There was no inhibition of the tested aerobic biomasses, either in the short term nor in the medium term. However, low oxygen consumption was noticed.

5. Conclusions

The study highlighted the impact of substrates with a high AOX content on aerobic biomass using OUR tests. Another important aim was highlighting the challenges in quantifying AOX concentrations in real substrates. Despite the use of standardized methods like UNI EN ISO 9562:2004, significant variability was observed in the results from different laboratories. This suggests that various factors, including the adsorption method, the amount of activated carbon, sample volume and washing solutions, can influence measurement accuracy. The OUR tests further revealed that AOXs have varying inhibitory effects on aerobic biomass respiration, yet discrepancies between the laboratory analyses made it difficult to pinpoint the initial AOX concentration and establish a consistent working point. These findings indicate that AOX toxicity and its inhibitory effects on biomass can vary greatly, necessitating a tailored, case-by-case approach for accurate risk assessments of these contaminants. Addressing these procedural discrepancies is essential to obtaining more reliable and consistent data to better understand and mitigate the risks associated with AOX exposure in environmental substrates.

Author Contributions

Conceptualization, M.C.C. and S.B.; methodology, M.C.C.; software, A.A.; validation, A.A., S.B. and G.G.; formal analysis, G.G.; investigation, G.G.; resources, M.C.C.; data curation, S.B.; writing—original draft preparation, G.G.; writing—review and editing, S.B. and A.A.; visualization, G.G.; supervision, A.A., M.B.; project administration, M.C.C.; funding acquisition, M.C.C. All authors have read and agreed to the published version of the manuscript.

Funding

This research received no external funding.

Informed Consent Statement

Informed consent was obtained from all the subjects involved in the study.

Data Availability Statement

The data presented in this study are available on request from the corresponding author.

Acknowledgments

The authors thank Idroclean S.r.l. (Itelyum Group) for providing operational support for the research activities.

Conflicts of Interest

The authors declare no conflicts of interest.

References

  1. Müller, G. Sense or no-sense of the sum parameter for water soluble “adsorbable organic halogens” (AOX) and “absorbed organic halogens” (AOX-S18) for the assessment of organohalogens in sludges and sediments. Chemosphere 2003, 52, 371–379. [Google Scholar] [CrossRef] [PubMed]
  2. Xu, R.; Xie, Y.; Tian, J.; Chen, L. Adsorbable organic halogens in contaminated water environment: A review of sources and removal technologies. J. Clean. Prod. 2021, 283, 124645. [Google Scholar] [CrossRef]
  3. UNI EN ISO 9562:2004; Water Quality–Determination of Adsorbable Organically Bound Halogens (AOX). ISO: Geneva, Switzerland, 2004.
  4. Analytik-jena. Available online: https://www.analytik-jena.com/products/chemical-analysis/combustion-elemental-analysis/aox (accessed on 21 June 2024).
  5. Murányi, R.; Cserfalvi, T. High Performance Microcoulometry. Mater. Sci. Forum 2007, 537–538, 687–694. [Google Scholar] [CrossRef]
  6. Ribeiro, J.P.; Marques, C.C.; Portugal, I.; Nunes, M.I. Fenton processes for AOX removal from a kraft pulp bleaching industrial wastewater: Optimisation of operating conditions and cost assessment. J. Environ. Chem. Eng. 2020, 8, 104032. [Google Scholar] [CrossRef]
  7. Gupta, S.; Charabarti, S.; Singh, S. Effect of Varying Load of Organochlorine Compounds on Activated Sludge Process. IPPTA Q. J. Indian Pulp Pap. Tech. Assoc. 2011, 23, 175–179. [Google Scholar]
  8. Kamenická, B.; Weidlich, T. A Comparison of Different Reagents Applicable for Destroying Halogenated Anionic Textile Dye Mordant Blue 9 in Polluted Aqueous Streams. Catalysts 2023, 13, 460. [Google Scholar] [CrossRef]
  9. Naumczyk, J.; Kucharska, M.; Ładyńska, J.; Wojewódka, D. Electrochemical oxidation process in application to raw and biologically pre-treated tannery wastewater. Desalination Water Treat. 2019, 162, 166–175. [Google Scholar] [CrossRef]
  10. Toth, A.J.; Ladanyi, R.; Thi, H.T.D.; Szilagyi, B.; Haaz, E. Sustainable Technology Solutions for Reuse of Process Wastewaters from Fine Chemical Industries. Chem. Eng. Trans. 2022, 91, 187–192. [Google Scholar] [CrossRef]
  11. Chen, L.; Cheng, P.; Ye, L.; Chen, H.; Xu, X.; Zhu, L. Biological performance and fouling mitigation in the biochar-amended anaerobic membrane bioreactor (AnMBR) treating pharmaceutical wastewater. Bioresour. Technol. 2020, 302, 122805. [Google Scholar] [CrossRef]
  12. Murat Hocaoğlu, S.; Dursun, M.; Baştürk, İ.; Partal, R. Treatment-based hospital wastewater characterization and fractionation of pollutants. J. Water Process Eng. 2021, 43, 102205. [Google Scholar] [CrossRef]
  13. Noma, Y.; Yamane, S.; Kida, A. Adsorbable organic halides (AOX), AOX formation potential, and PCDDs/DFs in landfill leachate and their removal in water treatment processes. J. Mater. Cycles Waste Manag. 2001, 3, 126–134. [Google Scholar]
  14. Xie, Y.W.; Chen, L.J.; Liu, R. Oxidation of AOX and organic compounds in pharmaceutical wastewater in RSM-optimized-Fenton system. Chemosphere 2016, 155, 217–224. [Google Scholar] [CrossRef] [PubMed]
  15. Commission Implementing Decision (EU) 2018/1147 of 10 August 2018 Establishing Best Available Techniques (BAT) Conclusions for Waste Treatment, under Directive 2010/75/EU of the European Parliament and of the Council. Off. J. Eur. Union 2018, 38–87. Available online: https://eur-lex.europa.eu/legal-content/EN/TXT/PDF/?uri=CELEX:32018D1147 (accessed on 13 March 2024).
  16. Yang, J.; Li, J.; Tan, X.; Li, J.; Croué, J.-P.; Chen, B. Insights into adsorbable organic halogen analysis: Two overlooked factors impacting water quality assessment. Sci. Total Environ. 2024, 928, 172429. [Google Scholar] [CrossRef] [PubMed]
  17. Li, Y.; Zhang, X.; Shang, C. Effect of reductive property of activated carbon on total organic halogen analysis. Environ. Sci. Technol. 2010, 44, 2105–2111. [Google Scholar] [CrossRef]
  18. Hua, G.; Reckhow, D.A. Determination of TOCl, TOBr and TOI in drinking water by pyrolysis and off-line ion chromatography. Anal. Bioanal. Chem. 2006, 384, 495–504. [Google Scholar] [CrossRef]
  19. Jekel, M.R.; Roberts, P.V. Total organic halogen as a parameter for the characterization of reclaimed waters: Measurement, occurrence, formation, and removal. Environ. Sci. Technol. 1980, 14, 970–975. [Google Scholar] [CrossRef]
  20. Kristiana, I.; McDonald, S.; Tan, J.; Joll, C.; Heitz, A. Analysis of halogen-specifc TOX revisited: Method improvement and application. Talanta 2015, 139, 104–110. [Google Scholar] [CrossRef]
  21. Kußmaul, H.; Simon, H.; Sietz, M. Impact of halide ions on the determination of adsorbable organically bound halogens (AOX). Fresen. J. Chem. 1988, 330, 532. [Google Scholar] [CrossRef]
  22. Grøn, C.; Dybdahl, H.P. Determination of total organic halogens (TOX); bias from a non-halogenated organic compound. Environ. Int. 1996, 22, 325–329. [Google Scholar] [CrossRef]
  23. Novák, L.; Larrea, L.; Wanner, J.; Garcia-Heras, J.L. Non-filamentous activated sludge bulking in a laboratory scale system. Water Res. 1993, 27, 1339–1346. [Google Scholar] [CrossRef]
  24. Technologies for Quality S.r.l. Available online: https://www.tqsrl.com/tecniche_analitiche/analisi-elementare/aox-200/ (accessed on 26 June 2024).
  25. Oleksy-Frenzel, J.; Wischnack, S.; Jekel, M. Application of ion-chromatography for the determination of the organic-group parameters AOCl, AOBr and AOI in water. Fresenius' J. Anal. Chem. 2020, 366, 89–94. [Google Scholar] [CrossRef] [PubMed]
  26. Kinani, A.; Sa lhi, H.; Bouchonnet, S.; Kinani, S. Determination of adsorbable organic halogens in surface water samples by combustion–microcoulometry versus combustion–ion chromatography titration. J. Chromatogr. A. 2018, 1539, 41–52. [Google Scholar] [CrossRef] [PubMed]
  27. Hagman, M.; La, J.; Jansen, C. Oxygen uptake rate measurements for application at wastewater treatment plants. Vatten 2007, 63, 131–138. [Google Scholar]
  28. Andreottola, G.; Foladori, P.; Ziglio, G.; Cantaloni, C.; Bruni, L.; Cadonna, M. Methods for Toxicity Testing of Xenobiotics in Wastewater Treatment Plants and in Receiving Water Bodies. In Dangerous Pollutants (Xenobiotics) in Urban Water Cycle; Springer: Dordrecht, The Netherlands, 2007; pp. 191–206. [Google Scholar]
  29. Borzooei, S.; Simonetti, M.; Scibilia, G.; Chiara, M. Journal of Environmental Chemical Engineering. Critical evaluation of respirometric and physicochemical methods for characterization of municipal wastewater during wet-weather events. J. Environ. Chem. Eng. 2021, 9, 105238. [Google Scholar] [CrossRef]
  30. Capodici, M.; Fabio, S.; Di, F.; Di, D.; Torregrossa, M. An innovative respirometric method to assess the autotrophic active fraction: Application to an alternate oxic–anoxic MBR pilot plant. Chem. Eng. J. 2016, 300, 367–375. [Google Scholar] [CrossRef]
  31. Yankovych, H.; Vaclavikova, M.; Melnyk, I. A Review on Adsorbable Organic Halogens Treatment Technologies: Approaches and Application. Sustainability 2023, 15, 9601. [Google Scholar] [CrossRef]
  32. LaPara, T.M.; Alleman, J.E. Thermophilic aerobic biological wastewater treatment. Water Res. 1999, 33, 895–908. [Google Scholar] [CrossRef]
Figure 1. Dispersion of analytical AOX measurements. Values S1_a and S1_b are for the S1 samples with a low AOX concentration while value S2 is for the samples with a high AOX concentration.
Applsci 14 11546 g001
Figure 2. Effect of pH value.
Applsci 14 11546 g002
Figure 3. Effect of biomasses coming from municipal WWTPs with different capacities.
Applsci 14 11546 g003
Figure 4. Effect of AOX concentration on biomass B1.
Applsci 14 11546 g004
Figure 5. Effect of AOX type.
Applsci 14 11546 g005
Table 1. Characteristics of the tested aerobic biomasses.
NameOptimal
Operating
Temperature [°C]
Type of
Wastewater Treated
VSS
Concentration
[gVSS L−1]
Plant
Capacity
[PE]
B120Municipal wastewater mixed with aqueous waste3.2–4.350,000
B220Municipal wastewater2.5–2.8100,000
B320Municipal wastewater3.01500
B420Municipal wastewater3.015,000
B550Aqueous waste26.4–27.250,000
Table 2. Biomasses and characteristics of substrate used in carrying out batch tests. Regarding pH values, the symbol “NB” indicates a non-buffered sample, while “B” indicates a buffered sample; “-” means “not measured”.
SubstrateAOX Concentration
[mg L−1]
pH (NB)
[-]
pH (B)
[-]
Tested DFsTested
Biomass(es)
Sub1 (real)2.00 ± 0.0110.208.101:1/1:2/1:5B1/B2
Sub2 (real)148.00 ± 0.018.00-1:1/1:5B1
Sub3 (real)31.00 ± 0.018.00-1:1/1:5B1
Sub4 (real)2.50 ± 0.018.00-1:1/1:5B1
Sub5 (real)1.81 ± 0.01-7.801:1/1:2/1:5B1/B2/B5
Sub6 (real)30.80 ± 0.018.00-1:1/1:5B1/B2/B3/B4/B5
Sub7 (synthetic)80.00 ± 0.018.00-1:1/1:5B1/B2
Sub8 (synthetic)40.00 ± 0.018.00-1:1/1:5B1/B2
Sub9 (synthetic)2.50 ± 0.018.00-1:1/1:5B1/B2
Sub10 (real)<0.018.00-1:1B1/B2
Sub11 (real)1.81 ± 0.019.358.201:1/1:2/1:5B1
Table 3. Biomasses and characteristics of substrates used in carrying out continuous tests. Regarding pH values, “NB” indicates a non-buffered sample, while “B” indicates a buffered sample; “-” means “not measured”.
SubstrateAOX [mg L−1]pH (NB) [-]pH (B) [-]Tested Biomass(es)
Sub1 (real)2.00 ± 0.0110.208.10B1/B2
Sub1 (real) diluted 1:50.40 ± 0.01-7.80B1
Sub1 (real) diluted 1:100.20 ± 0.01-7.80B1
Sub6 (real)30.80 ± 0.018.00-B1/B5
Sub7 (synthetic)80.00 ± 0.018.00-B1
Table 4. The AOX concentrations of samples S1 and S2 obtained by the four laboratories. The analytical method used by all laboratories was UNI EN ISO 9562:2004.
SampleLaboratoryAOX Concentration [mg L−1]
S1Lab-12.00 ± 0.01
Lab-26.02 ± 0.76
Lab-31.55 ± 0.36
Lab-40.60 ± 0.20
S2Lab-130.80 ± 0.01
Lab-286.50 ± 0.01
Lab-323.80 ± 5.50
Lab-48.00 ± 3.00
Table 5. Additional information requested from different analytical laboratories.
ParameterLab-1Lab-2Lab-3Lab-4
Adsorption procedure: frits (batch), columnFrits (shaking procedure paragraphs 9.3.2 of the ISO 9562 method)100 mL of sample (diluted based on expected concentration) + 5 mL of nitrate solution (NaNO3 + HNO3), agitated with a rocking agitator for 1 hColumn procedure from ISO 9562 methodColumn method (paragraphs 7.1.3 and 9.3.4 of the ISO 9562 method)
Mass of activated carbon used~50 mg50 mg of activated carbonAnalytik Jena vials containing ~50 mg each; 2 vials used per sampleSpecific cartridges provided by supplier; quantity was approx. 50–200 mg
Volume of sample used for adsorption or contact with the frit100 mL100 mL (diluted as needed)100 mL of sample used as is or diluted100 mL per method
Volume of ultrapure water used for washing before combustion25 mL of NaNO3 washing solution5–10 mL of diluted nitrate solution used for washing, additional 5 mL for rinsingWashed with sodium nitrate and nitric acid solution as per supplier method25 mL of washing solution, prepared by diluting stock solution
Any other data for AOX quantificationBlank counts: ~0.2 µg; dilution factor: 100; formula: (sample counts—blank counts) (Dil/100)Calibration curve: 10–250 ppb; control charts for blanks; adsorption capacity checks; 0.01 M HCl titration checkn.a.Initial 100 mL sample volume; dilution factor considered; results in µg/L
Table 6. Results obtained from batch tests carried out with thermophilic biomass (biomass B5). “-” indicates unmeasured values.
Test-Day AOX Concentration in the Aqueous Waste Tested [mgAOX L–1]sOUR [mgDO gVSS–1 h–1]
EndogenousDF 1:1DF 1:2DF 1:5
A1.810.300.290.360.44
B1.810.290.79-0.51
C30.800.290.42-0.41
Table 7. Results obtained from continuous OUR tests: effect of the type of biomass and of the substrate’s pH.
BiomasspHAOX Concentration
[mg L–1]
Exogenous ΔO2
[mgDO gVSS–1]
Overall ΔO2
[mgDO gVSS–1]
Effect of the type of biomass (industrial vs. civil) and of the substrate’s pHB110.202.0015.1035.70
B210.202.007.2024.50
B17.802.0046.2067.90
B27.802.0022.5039.60
Effect of the type of biomass (mesophilic vs. thermophilic biomass)B18.0030.809.8015.75
B58.0030.801.721.96
Table 8. Results obtained from continuous OUR tests: effect of substrate’s AOX concentration and medium-term toxicity assessment (test carried out with a synthetic solution containing 80 mg L−1 dichlorophenol and lasted 5 days).
BiomasspHAOX Concentration
[mg L–1]
Exogenous ΔO2
[mgDO gVSS–1]
Overall ΔO2
[mgDO gVSS–1]
Effect of the substrate’s AOX concentrationB18.0030.809.8015.75
B17.802.0046.2067.90
B17.800.4071.0584.90
B17.800.2021.8052.70
Medium-term toxicityB18.0180.00549.59755.53
Disclaimer/Publisher’s Note: The statements, opinions and data contained in all publications are solely those of the individual author(s) and contributor(s) and not of MDPI and/or the editor(s). MDPI and/or the editor(s) disclaim responsibility for any injury to people or property resulting from any ideas, methods, instructions or products referred to in the content.

