Abstract
In recent decades, there has been an increasing consumer demand for the so-called superfoods, accompanied by a growing scientific interest. In our work, sixteen commercial nutraceuticals of different product categories, including powders of cereal grasses, vegetables, fruits, microalgae, an aquatic plant, and herbs, were analyzed to compare their nutritional properties and volatile profile. Some samples, especially spirulina, chlorella, and duckweed powders, were rich in protein; however, their amino acid composition was imbalanced. Spinach, duckweed, and moringa powders exhibited very high ash contents, while sea buckthorn powder was a relatively rich source of lipids. Acerola powder had the highest total phenolic content by far and showed exceptional antioxidant and antibacterial properties in in vitro analyses as well. Aronia and rosehip powders also had high antioxidant potential, while moringa powder exhibited remarkable antibacterial activity. The headspace volatiles of the samples showed significant variations. Terpenes were the major volatiles in herbs, especially in turmeric and ginger powders. High levels of acids were detected in fruit powders. Some compounds were only characteristic of certain products, for example, dimethyl sulfide in beetroot powder, trans-3-penten-2-one in aronia powder, hexadecane in spirulina powder, and turmerones in turmeric powder. These volatiles can be considered botanical markers, which potentially help detect the adulteration of specific nutraceuticals. Overall, this study presents the nutritional and aromatic diversity among various “superfood” powders, highlights their potential application as ingredients in functional foods, and emphasizes the need for regulatory standards to ensure product safety, quality, and consistency in the growing nutraceutical market.
1. Introduction
The global superfood market of was estimated to be worth USD 182.15 billion in 2023 and is expected to grow at an annual rate of 4.0% until 2030 [1]. In general, the term “superfood” refers to natural or minimally processed foods believed to have exceptional nutritional value [2]. These foods include mostly products of plant origin rich in nutrients and phytochemicals, such as certain fruits, vegetables, seeds, nuts, legumes, seaweed, spices, and herbs [3,4]. The term “superfood” has been widely used in web search tools, social media sites, and marketing communication platforms, although it has no legal or clear scientific definition [4,5]. Due to the ambiguity of the definition, the perception of superfoods is very subjective. Therefore, consumers’ attitudes towards these products have recently been the subject of research in several countries, including the United Kingdom [6], Switzerland [7], Germany [5,8], Slovenia [9], Malaysia [10], and India [11]. The findings of these studies suggest that superfoods are preferred by certain segments of consumers, primarily due to their perceived dietary and therapeutic benefits beyond basic nutrition.
Superfoods are widely marketed in the form of powders, which are generally obtained by drying and size reduction of plant materials. Common dehydration methods include spray drying and freeze drying, while size reduction is achieved by crushing, grinding, or other pulverization methods. These processes concentrate nutrients and enable a longer shelf life, making powdered products more attractive for some consumers. In addition, powdering of foods may contribute to sustainable food production as it reduces the energy demand of storage and transport and minimizes food waste [12]. Superfood powders are generally categorized as food supplements or nutraceuticals, and they can also be used as ingredients of functional foods. These categories include products that are at the interface between nutrition and medicine. While functional foods usually refer to value-added products similar to regular foods, food supplements and nutraceuticals are marketed in doseable forms like capsules, tablets, powders, or ampoules of liquids [13]. To date, extensive research has been conducted related to nutraceuticals, focusing mainly on their safety, nutritional value, and potential biological activities [3,14,15,16]. Nevertheless, there is a lack of comparative experimental studies on the nutritional value and functional properties of commercially available products. Scientific information is also incomplete regarding their odorants and other attributes that directly influence their sensory properties and consumers’ acceptance.
The aim of our work was to compare sixteen commercial nutraceutical powders that are marketed as superfoods, based on their composition, antioxidant capacity, and antimicrobial activity. In addition, the volatile fraction of the products was analyzed, as aromatic volatiles play important role in the biological activity and sensory characteristics of foods [17,18]. For a comprehensive view, we aimed to compare products made from a large variety of raw materials. Our samples included powders of plants traditionally consumed in the Western world (e.g., spinach, rosehip, and ginger powders) and products that are made of raw materials considered exotic in most countries (e.g., goji berry, acerola, and moringa powders). In addition, microalgae and duckweed powders, as alternative nutrient sources, were also investigated.
2. Materials and Methods
2.1. Material Collection and Pretreatment of the Samples
Most nutraceuticals were purchased from Caleido IT-Outsource Kft (Budapest, Hungary). Sea buckthorn powder originated from Best BanGor Kft. (Budapest, Hungary), while aronia and acerola were obtained from Votamax s.r.o. (Ostrava, Czech Republic). These are specified for the distribution of foods, medicinal products, and cosmetics of natural origins. Duckweed powder was obtained from a Chinese manufacturer of herbal raw materials (Hunan MT Health Inc., Hunan, China). Samples were stored in their original packaging, protected from light and oxygen, at room temperature until use. Our samples (Figure 1) covered nutraceuticals obtained from different raw materials, including cereal grasses (n = 2), vegetables (n = 2), fruits (n = 6), microalgae (n = 2), an aquatic plant (n = 1), and herbs (n = 3). Available information on these products is summarized in Table 1.
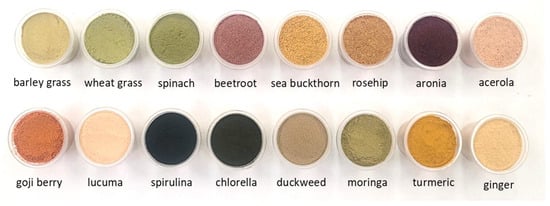
Figure 1.
Commercial nutraceuticals used in our experiments.

Table 1.
Available information on commercial nutraceuticals used in our experiments.
2.2. Chemicals, Reagents, and Laboratory Equipment
Sulfuric acid (96%), potassium sulphate, sodium hydroxide, and petroleum ether were purchased from Lach-Ner Ltd. (Neratovice, Czech Republic), while copper (II) sulphate originated from Thomasker (Budapest, Hungary). Hydrochloric acid (37%) was obtained from Carlo Erba Reagents (Milano, Italy). Ethanol, methanol, TSB agar, and 4 mL capped vials were purchased from VWR (Debrecen, Hungary). Amino acid standard, Folin and Ciocalteu’s phenol reagent, iron(III) chloride hexahydrate, TPTZ, ascorbic acid, copper(II) chloride, neocuproine, Trolox, potassium peroxydisulfate, ABTS, DPPH, sodium acetate, and sodium carbonate originated from Sigma-Aldrich (St. Louis, MO, USA). Gallic acid was purchased from Carl Roth (Karlsruhe, Germany). Ninhydrin, 50 mL centrifuge tubes, and Eppendorf tubes were obtained from Thermo Fisher Scientific (Budapest, Hungary), while Petri dishes were from Anicrin (Venice, Italy).
2.3. Determination of Proximate Composition
The crude protein content of the products was determined by the classical Kjeldahl method (AOAC 2001.11) [19]. To obtain more accurate estimations of the protein content, specific nitrogen-to-protein conversion factors were used instead of the generally applied factor of 6.25. Based on the literature data, a N:P factor of 4.43 for cereal grasses and moringa [20], 4.39 for vegetables [21], 4.05 for fruits [22], 4.92 for microalgae [23], and 5.6 for other plant-based powders [24] were used. Crude fat content was determined by Soxhlet extraction using petroleum ether as a solvent (AOAC 2003.06) [25]. For the determination of ash content, samples were carbonized at 600 ± 20 °C in a laboratory furnace until they reached a constant weight. The moisture content was determined by drying the samples at 105 ± 2 °C in a hot-air oven until they reached a constant weight. The total carbohydrate content of the samples was estimated using the following equation, considering both digestible and non-digestible carbohydrates:
2.4. Amino Acid Analysis
For the determination of total amino acids, 50–600 mg (depending on the crude protein content) of the sample was weighed in hydrolyzing tubes and mixed with 10 mL of hydrochloric acid solution (6 M). The suspensions were hydrolyzed at 110 °C for 24 h in a block thermostat. After cooling, hydrolysates were transferred to 25 mL flasks using 10 mL of sodium hydroxide solution (4 M) and filled to the full volume with distilled water. Extracts were filtered through filter paper to test tubes, and then filtrates were re-filtered through a syringe filter with a 0.22 µm pore size. The filtrates were diluted 10-fold, and extracts were stored in Eppendorf tubes at −20 ± 2 °C until analysis. The amino acid composition of the samples was determined by applying an AAA 400 automatic amino acid analyzer (Ingos Ltd., Praha, Czech Republic) equipped with a cation-exchange column (Ionex Ostion LCP5020 220 × 3.7 mm). After post-column derivatization (at 120 °C) with a ninhydrin reagent, spectrophotometric detection was carried out. The color reaction of proline was detected at 440 nm, while other amino acids were detected at 570 nm. The assay was conducted in a strongly acidic medium, using a series of eluents of gradually weakening acidity with a step-gradient elution. The buffers used were as follows: buffer 1 (0.18 M Li citrate, pH 2.80), buffer 2 (0.20 M Li citrate, pH 3.05), buffer 3 (0.36 M Li citrate, pH 3.35), buffer 4 (0.33 M Li citrate, pH 4.05), and buffer 5 (1.20 M Li citrate, pH 4.65). Dilution factors were chosen to be able to measure in the linear range of detection. Recovery rates were above 90% for each amino acid, and the detection limit was 0.5 nmol/mL. Chromatograms were analyzed using the CHROMuLAN082 program by comparing them to standard amino acid mixtures.
2.5. Determination of Antioxidant Parameters
2.5.1. Preparation of Extracts
For the determination of antioxidant properties, extracts were prepared as follows: 100–500 mg (depending on the antioxidant capacity obtained from preliminary tests) of sample was weighed in centrifuge tubes with a precision of four decimals, and this was dissolved in 10 mL of ethanol:distilled water (60:40) mixture. The contents of the tubes were vortexed for 30 s, then treated in an ultrasonic bath (300 W, 40 °C) for 1 h. Following that, suspensions were centrifuged at 10,000 rpm for 10 min, and 1.5 mL of supernatants were then transferred to Eppendorf tubes. Extracts were stored in a refrigerator (−20 ± 2 °C) and protected from light until use.
2.5.2. Total Phenolic Content and In Vitro Antioxidant Capacity
For the determination of the total phenolic content (TPC), the Folin–Ciocalteu method developed by Singleton and Rossi was used [26]. The TPC of the nutraceuticals was expressed in mg gallic acid equivalent (GAE) per gram of sample. The antioxidant capacity of the samples was assessed by applying four different spectrophotometric assays to obtain a comprehensive evaluation of their free radical scavenging abilities and overall antioxidant potential. The ferric reducing antioxidant power (FRAP) assay was conducted as proposed by Benzie and Strain [27]. The cupric ion reducing antioxidant capacity (CUPRAC) assay was performed according to the method described by Apak and co-workers [28]. For the Trolox equivalent antioxidant capacity (TEAC) assay, the method introduced by Miller and co-workers was applied [29]. The measurement of 2,2-diphenyl-1-picrylhydrazyl (DPPH) radical scavenging activity was carried out according to the method of Blois [30] and modifications by Hatano and co-workers [31]. Antioxidant capacity results were expressed in Trolox equivalent (TE) per gram of sample, except for the FRAP assay, in the case of which ascorbic acid was used for calibration.
2.5.3. Relative Antioxidant Capacity Index
To provide a comprehensive and standardized evaluation of the antioxidant capacity of samples, relative antioxidant capacity indexes (RACIs) were determined by combining the results of the FRAP, CUPRAC, TEAC, and DPPH assays. Calculations were conducted according to the method introduced by Sun and Tanumihardjo [32]. Firstly, standard scores were calculated according to the formula below, and then standard scores were averaged. Finally, mean scores were ranked and plotted on a bar graph.
where x represents the raw data, μ is the mean, and σ is the standard deviation.
2.6. Determination of In Vitro Antimicrobial Activity
2.6.1. Preparation of Extracts
For the determination of antimicrobial activity, extracts of the samples were prepared as follows: 1 g of sample was weighed in a centrifuge tube with a precision of four decimals, and it was dissolved in 5 mL of ethanol:distilled water (60:40) mixture. The contents of the tubes were vortexed for two minutes, then shaken (200 rpm) for 2 h at room temperature. Afterwards, mixtures were centrifuged at 10,000 rpm for 10 min. Supernatants were separated and used immediately.
2.6.2. Agar Diffusion
A semi-quantitative determination of the antimicrobial activity of nutraceutical extracts was conducted by the agar diffusion method against apathogenic strains of Escherichia coli (ATCC 8739), Escherichia coli (O157:H7), Enterococcus faecalis, Enterobacter cloacae, and Listeria innocua. These strains were selected because they are representative of different bacterial groups and are relevant to food safety. Strains originated from the Hungarian University of Agriculture and Life Sciences, except for Escherichia coli (ATCC 8739), which originated from the American Type Culture Collection. Bacterial strains were cultured in tryptic soy broth (TSB) culture medium and incubated at 37 °C for 24 h. Following that, 200 µL of freshly grown culture was pipetted into the Petri dishes and mixed well with TSB agar made by adding 30 g of tryptic soy broth to 1000 mL of distilled water and 1% of bacteriological agar sterilized at 121 °C for 15 min. An 8 mm sterile punch was used to create wells in the agar, and then 150 µL of each extract was pipetted into the wells. An ethanol:distilled water (60:40) mixture was used as the control. Following that, Petri dishes were placed in a refrigerator (4 °C) for 1 h and incubated using a thermostat (37 °C) for 24 h. After incubation, diameters of the inhibitory zones were measured using a ruler, and the results were divided into four categories as follows: no activity (zone of inhibition is not visible), small activity (<2 mm), medium activity (2–4 mm), and high activity (>4 mm).
2.7. Determination of the Volatile Composition
2.7.1. Sampling
Sampling was conducted by headspace solid-phase microextraction using a divinylbenzene–carboxen–polydimethylsiloxane (DVB/CAR/PDMS) fiber of 20 mm in length (Sigma-Aldrich, St. Louis, MO, USA). Prior to sampling, the fiber was conditioned at 270 °C for 30 min. For the extraction of the volatile compounds, 1.5 mL (approximately 1 g) of sample was weighed into 4 mL vials equipped with a screw-cap syringe valve. Each vial was placed into a dry heating block of 40 °C to increase the volatility of compounds, and was allowed to equilibrate for 20 min. Following that, the fiber was inserted into the headspace of the sample for 20 min. The SPME fiber was positioned to leave approximately 5 mm between the sample and the fiber. After extraction, the fiber was inserted into the GC injection port.
2.7.2. GC-MS Analysis
A Shimadzu GCMS-QP2010SE gas chromatograph–mass spectrometer (Shimadzu Corporation, Kyoto, Japan) was used for the analysis. Analytes were thermally desorbed from the fiber in the injector port for 1 min at 250 °C in splitless mode. The injector was operated with a 6:1 split ratio. A MEGA-WAX fused silica capillary column (60 m × 0.25 mm × 0.25 μm) (Mega S.r.l., Legnano, Italy) was used for separation. The temperature was increased from 60 to 250 °C at a rate of 5 °C min−1. The detector was operated in electron impact (EI) ionization mode at 70 eV and 250 °C. Detection was conducted in the 35–500 mass range at a 1666 mass/s scan speed. The interface temperature was also 250 °C. The carrier gas was helium (6.0) with a flow rate of 1.35 mL/min. Chromatographic data and mass spectra were processed using LabSolutions software ver. 2.5. (Shimadzu Corporation, Kyoto, Japan). Volatiles were identified using NIST05 and NIST05s spectrum libraries, and retention indexes (RIs) for each peak were calculated using a series of n-alkanes (C10-C40) obtained from Sigma Aldrich. Results were expressed as percentage of peak area.
2.8. Statistical Analysis
Each analysis was carried out in triplicate. Results were expressed as mean ± standard deviation (SD). Statistical differences were determined by one-way ANOVA with the Games–Howell post hoc test (α = 0.05), using XLSTAT Basic+ software (Addinsoft, Paris, France). Before analysis, assumption tests were conducted using IBM SPSS statistics version 27.0 software. To test normality, the Shapiro–Wilk test was used. Homogeneity of variance was tested by Levene’s test.
3. Results and Discussion
3.1. Proximate Composition
Table 2 shows the proximate composition of the 16 nutraceutical powders, where 62.5% of the samples had a moisture content between 4 and 8%. The crude protein content showed very large variances. Fruit powders were generally low in protein, except for the goji berry powder, which had a crude protein content of 9.3%. Talay and co-workers obtained a crude protein content of 13.2% for a goji berry powder [33], which is very similar to our result considering that they used the general N:P conversion of 6.25, while a specific N:P factor of 4.05 was used for the calculation by our research team to obtain a more accurate result. Spirulina and chlorella powders contained outstanding amounts of protein, with percentages of 55.3% and 45.5%, respectively. These products are considered sustainable nutrient sources and have attracted the interest of environmentally friendly and health-conscious consumers. However, future research is needed on the cultivation, harvesting, and processing methods, as well as on the food safety aspects and sensory acceptance of microalgae-based foods [34]. Duckweed powder, another promising alternative nutrient source, contained 17.7% crude protein, shortly followed by spinach, moringa, and wheat grass powders. Based on the current European Union legislation [35], the claim “rich in protein” can be indicated on the label of spirulina, chlorella, and duckweed powders because a least 20% of their energy content derives from protein, while spinach, moringa, and wheat grass powders can be labeled “protein sources” since at least 12% of their energy content derives from proteins (considering an energy content of 4 kcal/g for carbohydrates and proteins and an energy content of 9 kcal/g for fats, assuming that all carbohydrates are digestible). The total carbohydrate content of most samples was estimated to be above 60%, except for spirulina, chlorella, spinach, and moringa. The crude fat content of the examined nutraceuticals ranged between 0.2% and 12.4%. Sea buckthorn contained the highest amount of fats followed by goji berry. The reason for this observation may be that these products contained not only the pulp but also the seeds of the fruits (see Table 1). Sea buckthorn is known to be a rich source of oil, which is industrially extracted and marketed. According to a recent study, sea buckthorn contains mainly linoleic acid, palmitoleic acid, palmitic acid, oleic acid, linolenic acid, and stearic acid [36]. On the other hand, acerola, beetroot, duckweed, spirulina, and ginger powders contained fats below 1%. Regarding the ash content, three samples need to be highlighted: spinach, duckweed, and moringa powders contained 16.6, 12.6, and 10.3% of ash, respectively, in accordance with literature data [37,38,39].
Table 2.
Proximate composition of “superfood” powders.
3.2. Amino Acid Composition
With the spread of sustainable diets, the protein quality of plant foods and other alternative sources is becoming an increasingly important aspect of nutrition. The amino acid composition is a key component of protein quality as it determines the level of protein utilization. Common metrics evaluating protein quality are the PDCAAS (Protein Digestibility-Corrected Amino Acid Score) and DIAAS (Digestible Indispensable Amino Acid Score). PDCAAS calculates the proportion of dietary amino acids that are absorbed and provides a score based on how well the amino acid profile of the test protein aligns with human amino acid requirements. On the other hand, DIAAS offers a more accurate measure of amino acid bioavailability by assessing the concentrations that reach the terminal ileum, rather than focusing on what remains in feces. [40].
Table 3 shows the amino acid composition of our nutraceutical samples. In addition, the total amino acid content (TAA) as well as the ratios of essential (EAAs) and branched-chain amino acids (BCAAs) are also presented. The highest amount of total amino acids was observed in the spirulina powder (526.4 mg/g), while rosehip, aronia, and lucuma powders contained amino acids in small concentrations (below 40 mg/g). The total amino acid contents of the samples are comparable with the amounts of crude protein. In general, glutamic acid was the most abundant amino acid in the examined samples, followed by aspartic acid, leucine, alanine, and arginine. On the other hand, cysteine, methionine, and histidine were present in relatively low amounts. The ratio of essential amino acids to total amino acids ranged between 24.9 and 39.9%. The highest EAA ratios were observed in the cereal grass powders, followed by spirulina and spinach. On the other hand, goji berry, beetroot, and aronia powders showed relatively low EAA ratios. The ratios of branched-chain amino acids ranged between 12.2 (goji berry powder) and 21.0 (spirulina powder), with an average of 16.9 and a median of 17.1.
Figure 2 presents the distribution of essential amino acids in the samples in comparison with the reference protein [41]. The more similar the relative composition of amino acids to the human requirement, the better the quality. The essential amino acid present in the lowest ratio in a protein relative to the reference protein is referred to as the limiting amino acid. Plant foods are generally deficient in certain amino acids, mostly in methionine and/or lysine. Proteins that contain high amounts of these amino acids can be effectively used to complement plant proteins, to obtain foods with a higher nutritional quality [42]. In general, our samples were deficient in valine, sulfur-containing amino acids (methionine, cysteine), lysine, and isoleucine. On the other hand, threonine, aromatic amino acids (phenylalanine, tyrosine), and leucine were generally abundant. Most samples contained histidine in lower ratios compared to the reference protein, except for powders of beetroot and fruits. Considering all essential amino acids, acerola powder corresponded the most to the reference protein, whereas ginger powder showed the greatest deviation. Based on our calculations, lysine appeared to be the limiting amino acid in eight samples, namely in barley grass, rosehip, goji berry, spirulina, duckweed, turmeric, ginger, and moringa powders. Ginger powder was exceptionally poor in this amino acid. The ratio of lysine to total essential amino acids was ap-proximately three times lower in this product compared to the reference protein. Isoleucine was also a frequent limiting amino acid. It was present at the lowest relative ratios in the wheat grass, spinach, sea buckthorn, aronia, acerola, lucuma, and chlorella powders. In beetroot powder, leucin was identified as the limiting amino acid. Chlorella powder contained a high concentration and ratio of lysine; thus, this product would be an effective functional ingredient for enhancing the amino acid profile of cereal-based products. On the other hand, spinach, another protein-rich nutraceutical, contained a relatively high ratio of sulfur-containing amino acids; thus, it may be a potential functional ingredient of legume-based foods.
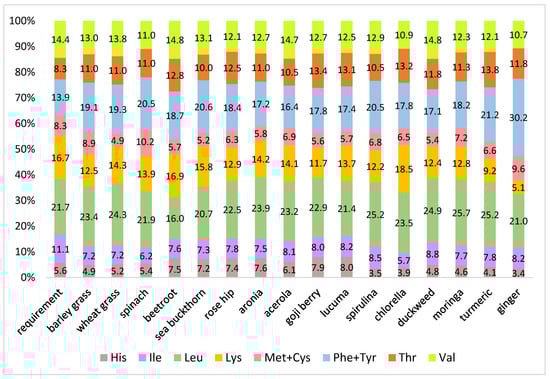
Figure 2.
Distribution of essential amino acids in the nutraceutical samples compared to the requirement (reference protein proposed by FAO/WHO/UNU 2007) [41].
Table 3.
Amino acid profiles of nutraceuticals.
Table 3.
Amino acid profiles of nutraceuticals.
| Amino Acid (mg/g) | Barley Grass | Wheat Grass | Spinach | Beetroot | Sea Buckthorn | Rosehip | Aronia | Acerola | Goji Berry | Lucuma | Spirulina | Chlorella | Duckweed | Moringa | Turmeric | Ginger |
|---|---|---|---|---|---|---|---|---|---|---|---|---|---|---|---|---|
| ASP | 5.7 ± 0.4 | 15.7 ± 0.6 | 15.0 ± 0.2 | 4.3 ± 0.2 | 7.3 ± 0.1 | 4.1 ± 0.3 | 4.9 ± 0.2 | 7.3 ± 0.3 | 14.7 ± 0.7 | 7.0 ± 0.2 | 55.5 ± 4.2 | 38.1 ± 3.1 | 28.8 ± 0.5 | 15.7 ± 2.1 | 17.7 ± 0.1 | 10.6 ± 0.2 |
| THR | 2.7 ± 0.4 | 7.1 ± 0.8 | 6.6 ± 0.3 | 2.0 ± 0.1 | 2.7 ± 0.0 | 1.4 ± 0.1 | 1.7 ± 0.1 | 1.3 ± 0.2 | 3.3 ± 0.3 | 1.8 ± 0.2 | 24.8 ± 1.7 | 23.0 ± 2.6 | 8.7 ± 0.6 | 6.7 ± 0.8 | 5.2 ± 0.2 | 2.7 ± 0.1 |
| SER | 3.1 ± 0.2 | 8.3 ± 0.8 | 8.0 ± 0.1 | 3.3 ± 0.2 | 4.2 ± 0.1 | 2.0 ± 0.1 | 2.4 ± 0.2 | 1.9 ± 0.1 | 5.0 ± 0.4 | 2.1 ± 0.1 | 32.6 ± 0.8 | 18.4 ± 2.4 | 11.0 ± 0.3 | 8.3 ± 1.1 | 5.9 ± 0.2 | 3.1 ± 0.2 |
| GLU | 8.6 ± 0.3 | 23.6 ± 0.6 | 20.2 ± 0.7 | 16.5 ± 1.2 | 13.1 ± 0.5 | 6.6 ± 0.4 | 12.9 ± 0.4 | 6.1 ± 0.3 | 17.7 ± 0.7 | 5.0 ± 0.4 | 84.5 ± 1.7 | 65.7 ± 6.5 | 31.3 ± 0.2 | 23.1 ± 3.6 | 16.0 ± 0.0 | 8.7 ± 0.3 |
| PRO | 0.5 ± 0.0 | 5.0 ± 0.8 | 2.1 ± 0.0 | 0.9 ± 0.1 | 0.2 ± 0.0 | 1.0 ± 0.1 | 1.5 ± 0.1 | 0.9 ± 0.2 | 9.4 ± 0.6 | 1.5 ± 0.3 | 0.5 ± 0.0 | 18.0 ± 1.9 | 11.8 ± 1.3 | 7.6 ± 0.9 | 1.2 ± 0.1 | 1.1 ± 0.1 |
| GLY | 4.2 ± 0.2 | 10.0 ± 1.2 | 12.2 ± 0.2 | 2.4 ± 0.1 | 5.3 ± 0.0 | 2.2 ± 0.2 | 3.7 ± 0.1 | 2.1 ± 0.1 | 3.6 ± 0.3 | 2.3 ± 0.0 | 29.7 ± 2.9 | 24.9 ± 3.7 | 12.0 ± 0.6 | 9.5 ± 1.1 | 5.7 ± 0.2 | 4.0 ± 0.4 |
| ALA | 4.5 ± 0.1 | 10.6 ± 0.8 | 8.6 ± 0.2 | 3.8 ± 0.2 | 2.9 ± 0.0 | 1.6 ± 0.1 | 2.2 ± 0.1 | 2.3 ± 0.0 | 5.8 ± 0.6 | 2.9 ± 0.0 | 42.5 ± 1.4 | 40.1 ± 1.8 | 11.9 ± 0.3 | 9.8 ± 1.2 | 3.6 ± 0.1 | 2.5 ± 0.2 |
| VAL | 3.2 ± 0.1 | 8.9 ± 0.4 | 6.6 ± 0.2 | 2.3 ± 0.2 | 3.6 ± 0.3 | 1.4 ± 0.2 | 1.9 ± 0.2 | 1.7 ± 0.2 | 3.2 ± 0.2 | 1.7 ± 0.2 | 30.6 ± 2.5 | 18.9 ± 2.0 | 10.9 ± 0.9 | 7.2 ± 0.8 | 4.5 ± 0.1 | 2.4 ± 0.2 |
| CYS | 1.2 ± 0.1 | 1.3 ± 0.1 | 4.1 ± 0.1 | 0.7 ± 0.1 | 1.1 ± 0.0 | 0.6 ± 0.1 | 0.7 ± 0.1 | 0.4 ± 0.0 | 1.1 ± 0.1 | 0.6 ± 0.0 | 7.1 ± 0.3 | 7.0 ± 0.7 | 2.6 ± 0.3 | 2.1 ± 0.1 | 1.2 ± 0.2 | 1.2 ± 0.1 |
| MET | 0.9 ± 0.0 | 1.9 ± 0.2 | 2.1 ± 0.1 | 0.2 ± 0.0 | 0.3 ± 0.0 | 0.1 ± 0.0 | 0.2 ± 0.0 | 0.4 ± 0.0 | 0.3 ± 0.0 | 0.2 ± 0.0 | 9.0 ± 0.6 | 4.4 ± 0.4 | 1.4 ± 0.2 | 2.1 ± 0.4 | 1.3 ± 0.1 | 1.0 ± 0.1 |
| ILE | 1.7 ± 0.2 | 4.7 ± 0.1 | 3.7 ± 0.1 | 1.2 ± 0.1 | 2.0 ± 0.0 | 0.9 ± 0.0 | 1.1 ± 0.0 | 1.0 ± 0.1 | 2.0 ± 0.1 | 1.1 ± 0.1 | 20.2 ± 1.1 | 9.8 ± 0.9 | 6.5 ± 0.3 | 4.6 ± 0.8 | 2.9 ± 0.2 | 1.9 ± 0.2 |
| LEU | 5.7 ± 0.4 | 15.7 ± 0.5 | 13.2 ± 0.3 | 2.5 ± 0.2 | 5.7 ± 0.0 | 2.6 ± 0.0 | 3.6 ± 0.0 | 2.8 ± 0.3 | 5.7 ± 0.2 | 2.9 ± 0.3 | 59.8 ± 3.7 | 40.8 ± 1.8 | 18.3 ± 0.2 | 15.1 ± 2.0 | 9.4 ± 0.7 | 4.8 ± 0.1 |
| TYR | 1.6 ± 0.2 | 4.5 ± 0.3 | 5.3 ± 0.4 | 1.6 ± 0.2 | 2.6 ± 0.1 | 0.7 ± 0.1 | 0.8 ± 0.0 | 0.6 ± 0.1 | 1.5 ± 0.1 | 0.8 ± 0.0 | 24.6 ± 2.3 | 14.6 ± 1.6 | 5.8 ± 0.4 | 4.5 ± 0.3 | 2.8 ± 0.2 | 1.9 ± 0.1 |
| PHE | 3.0 ± 0.1 | 8.0 ± 0.2 | 7.0 ± 0.3 | 1.4 ± 0.2 | 3.1 ± 0.0 | 1.4 ± 0.1 | 1.8 ± 0.0 | 1.4 ± 0.0 | 2.9 ± 0.3 | 1.6 ± 0.0 | 23.9 ± 1.8 | 16.3 ± 0.4 | 6.7 ± 1.2 | 6.2 ± 0.7 | 5.2 ± 0.2 | 5.0 ± 0.6 |
| LYS | 3.0 ± 0.2 | 9.3 ± 0.5 | 8.4 ± 0.2 | 2.7 ± 0.2 | 4.3 ± 0.2 | 1.5 ± 0.1 | 2.1 ± 0.0 | 1.7 ± 0.2 | 2.9 ± 0.2 | 1.8 ± 0.2 | 29.0 ± 1.5 | 32.1 ± 2.1 | 9.1 ± 0.1 | 7.5 ± 0.6 | 3.4 ± 0.1 | 1.2 ± 0.1 |
| HIS | 1.2 ± 0.1 | 3.4 ± 0.3 | 3.3 ± 0.2 | 1.2 ± 0.2 | 2.0 ± 0.1 | 0.8 ± 0.1 | 1.1 ± 0.1 | 0.7 ± 0.1 | 2.0 ± 0.0 | 1.1 ± 0.1 | 8.2 ± 1.2 | 6.7 ± 0.8 | 3.5 ± 0.1 | 2.7 ± 0.2 | 1.5 ± 0.0 | 0.8 ± 0.1 |
| ARG | 3.1 ± 0.1 | 9.8 ± 0.8 | 8.7 ± 0.5 | 1.6 ± 0.1 | 5.5 ± 0.5 | 2.2 ± 0.1 | 3.8 ± 0.1 | 1.8 ± 0.3 | 8.0 ± 0.6 | 1.6 ± 0.0 | 43.8 ± 0.8 | 28.9 ± 0.3 | 12.8 ± 1.0 | 8.7 ± 0.7 | 5.0 ± 0.0 | 3.4 ± 0.5 |
| TAA a (mg/g) | 54.1 | 147.8 | 135.2 | 48.5 | 65.8 | 31.0 | 46.4 | 34.4 | 89.0 | 36.0 | 526.4 | 407.5 | 190.2 | 141.7 | 92.5 | 56.1 |
| EAA b (%) | 39.9 | 39.9 | 37.7 | 27.8 | 35.9 | 32.5 | 29.2 | 31.8 | 24.9 | 33.9 | 39.0 | 37.3 | 34.3 | 36.9 | 36.2 | 35.0 |
| BCAA c (%) | 19.6 | 19.9 | 17.4 | 12.5 | 17.1 | 15.5 | 14.3 | 15.9 | 12.2 | 15.8 | 21.0 | 17.1 | 18.8 | 19.0 | 18.2 | 16.1 |
a: Total amino acid content. b: Sum of essential amino acids (EAAs): His, Ile, Leu, Lys, Met, Phe, Thr, Val [43]. c: Sum of branched-chain amino acids (BCAAs): Ile, Leu, Val [43].
3.3. Total Phenolic Content and Antioxidant Capacity of the Samples
Oxidative stress plays a role in the development of several diseases, such as diabetes mellitus, cardiovascular diseases, inflammatory conditions, neurodegenerative disorders, and tumors. An antioxidant-rich diet theoretically helps to prevent these diseases; however, further research is required to better understand the complex role of reactive oxygen species in disease pathogenesis and the possible harmful consequences of excessive antioxidant consumption [44]. In addition to potential health benefits, antioxidant-rich food ingredients may contribute to product stability as they can effectively prevent the oxidation of high-fat foods like meat, fish, oil, and vegetables, which leads to aesthetic deterioration and the development of rancid flavors [45]. Table 4 shows the total phenolic content (TPC) and antioxidant capacity of our samples determined by different in vitro methods (FRAP, CUPRAC, TEAC, DPPH). The TPC of the samples ranged between 2.28 and 164.82 mg GAE/g sample, with an average of 32.05 mg GAE/g and a median of 14.93 mg GAE/g. Acerola powder contained exceptionally high amounts of phenolic compounds, followed by aronia, rosehip, moringa, and turmeric powders. Only these samples contained polyphenols in concentrations above the mean. In contrast to other fruit powders, lucuma powder was characterized by a very low total phenolic content. Chlorella, spirulina, duckweed, beetroot, wheat grass, and barley grass powders were also relatively poor in phenolic compounds (TPC < 10 mg GAE/100 g).
Table 4.
Total phenolic content and in vitro antioxidant capacity of the samples.
Among the antioxidant capacity tests, the CUPRAC assay resulted in the highest values, followed by the DPPH, FRAP, and TEAC assays. These variances are attributed to the fact that these tests are based on different mechanisms and are sensitive to different types of antioxidants. To obtain a more comprehensive parameter applicable to evaluate the relative antioxidant potential of different samples, the relative antioxidant capacity index (RACI) has been proposed, which standardizes the results of different antioxidant capacity assays, thus providing a more accurate ranking of samples [32]. This approach has been applied to a wide range of food categories, such as fruit and vegetable juices [46], teas and herbal infusions [47], coffees [48], black soybeans [49], and bee pollens [50]. Several studies show that the so-called “superfoods” typically have a high antioxidant potential [51]; however, limited information is available on the relative antioxidant capacity of superfood powders originating from different food groups. Figure 3 shows the relative antioxidant capacity indexes (RACIs) of our samples, calculated according to the method proposed by Sun and Tanumihardjo [32], taking into account the results of the four assays weighed equally. The RACIs of the powders were between −0.59 and +3.34. Among the fourteen samples, only acerola, aronia, and rosehip powders resulted in positive RACI values. This figure clearly illustrates the differences between the antioxidant potential of the samples, as well as the outstanding antioxidant potential of acerola powder. Acerola is a tropical fruit gaining increasing scientific and consumer attention owing to its exceptional ascorbic acid content and abundance of phenolic compounds with beneficial biological properties, including antioxidant, antibacterial, antihyperglycemic, antihyperlipidemic, anti-inflammatory, and hepatoprotective activities [52]. Based on the obtained data, the addition of acerola powder is very effective in enhancing the antioxidant potential of foods; however, further investigations are required on its stability and bioavailability.
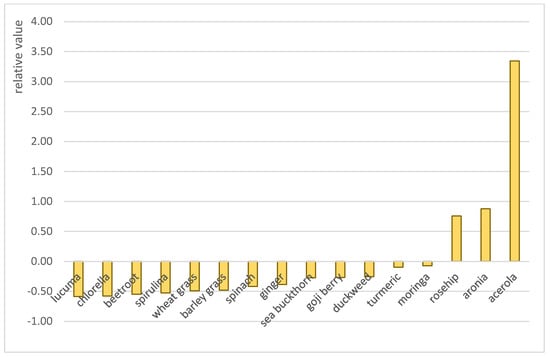
Figure 3.
Relative antioxidant capacity indexes of nutraceutical samples.
3.4. Antibacterial Potential of the Samples
The antimicrobial properties of natural plant extracts are gaining increasing attention in both the food industry and medicine, as they offer a potential alternative to synthetic preservatives and antibiotics. Certain volatiles and phenolics are the major contributors to the antimicrobial effect of plant materials [53]. This study aimed to evaluate the antimicrobial potential of 16 nutraceuticals against apathogenic strains of Escherichia coli ATCC 8739, Escherichia coli O157:H7, Listeria innocua, Enterococcus faecalis, and Enterobacter cloacae. Results are summarized in Table 5. In general, extracts of herbs and fruit powders had some effect, in contrast to products of cereal grasses, vegetables, and aquatic sources. Acerola and moringa extracts exhibited significant antimicrobial activity against all tested bacteria, particularly against the E. coli strains. Thus, it is recommended that researchers should conduct further experiments to optimize methods in order to ensure the most efficient extraction of antimicrobial compounds. In the case of acerola powder, the total phenolic content was also exceptionally high, so it can be assumed that phenolics play a key role in the antibacterial effect of this product. Nevertheless, acerola is also reported to contain ascorbic acid (vitamin C) in the range of 1500–4500 mg/100 g, which is approximately 50–100 times higher than that of orange or lemon [54]. Ascorbic acid was proven to efficiently inhibit the growth of different Gram-positive (Bacillus licheniformis, Staphylococcus aureus, Bacillus subtilis) and Gram-negative bacteria (Proteus mirabilis, Klebsiella pneumoniae, Pseudomonas aeruginosa, Escherichia coli) at an acidic pH [55]. Thus, it can be assumed that ascorbic acid plays a significant role in the exceptional antibacterial activity of acerola powder. In the case of moringa powder, several mechanisms play a role in the antibacterial activity, of which one of the most important is glucosinolate–isothiocyanate conversion. Other pathways include the presence of efflux pump inhibitors and high contents of certain phytochemical compounds, including carotenoids, tocopherols, flavonoids, sterols, and volatiles [56]. Based on our results, E. coli strains were susceptible to several of the investigated nutraceuticals. On the other hand, Enterococcus faecalis and Enterobacter cloacae were affected only by the extracts of acerola and moringa.
Table 5.
Antibacterial potential of the investigated nutraceuticals.
3.5. Volatile Profile of the Samples
Volatiles play an important role in the formation of odor and flavor [17], as well as in the bioactivity of foods [18]. In addition, some volatiles, especially terpenes and terpenoids (e.g., nerolidol, thymol, carvacrol, menthol), effectively prevent oxidation, thus contributing to the stability and shelf life of foods [45]. The volatile composition of our samples is detailed in Table S1, while the total number of volatiles in each product is shown in Figure 4. The number of total volatiles ranged between 10 (lucuma powder) and 64 (ginger powder). The contribution of the chemical classes to the total amount of volatiles is visualized in Figure 5.
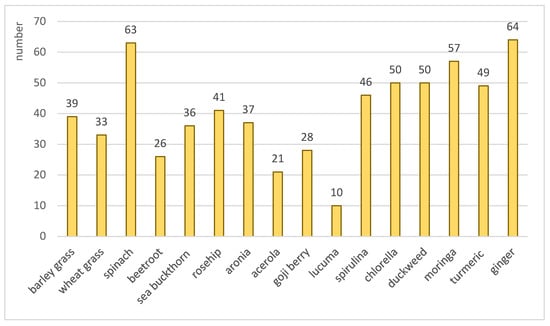
Figure 4.
Number of total volatile compounds in each nutraceutical.
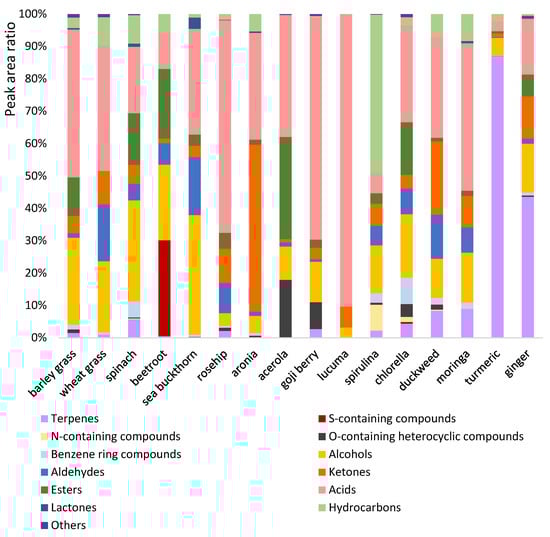
Figure 5.
Contributions of the chemical classes to the total amount volatiles in the samples.
Terpenes and terpenoids usually contribute significantly to the overall aroma of foods. These compounds accounted for small proportions of the total peak area of headspace volatiles in fruit powders. In rosehip powder, several terpenes and terpenoids were present in low amounts, including D-limonene, p-cymene, isophoron, linalol, β-cyclocitral, D-carvone, geranyl acetone, and α-ionone. In the goji berry powder, D-limonene and safranal were detected. The latter compound is the degradation product of carotenoids [57]. The total peak area ratios of terpenes and terpenoids were very low in the sea buckthorn, acerola, aronia, and lucuma powders. Herbs, on the other hand, contained several of these volatiles in high proportions. Turmeric powder contained 33 members of this chemical class, with high peak area percent values for ar-tumerone (20.9%), curcumene (19.7%), tumerone (12.3%), curlone (6.2%), and zingiberene (5.8%), which is in accordance with the literature [58]. In ginger powder, 31 terpenes and terpenoids were detected, of which curcumene (22.0%), borneol (5.7%), and β-bisabolene (3.2%) were the most abundant. This product contained a wide variety of mono- and sesquiterpenes that contribute to the aroma of ginger, which can be characterized as a unique and complex mixture of spicy, woody, herbal, minty, and citrusy notes [59]. These volatiles may contribute to the bioactivity of ginger, including antioxidant, anti-inflammatory, antimicrobial, anti-cancer, neuroprotective, cardioprotective, anti-diabetic, and anti-obesity activities [60]. In the headspace of moringa powder, 19 terpenes and terpenoids were detected, with eucalyptol showing the highest peak area ratio (3.8%). The presence of linalool and its derivatives is also noteworthy, which may contribute to the fresh, minty aroma of moringa powder with a pleasant, floral scent. The most frequently detected terpenes and terpenoids of the investigated nutraceuticals included geranyl acetone, β-ionone, β-cyclocitral, and D-limonene. The latter compound was present in turmeric powder at an exceptionally high peak area ratio of 7.9%, which may provide a sweet, citrusy scent to this product.
Sulfur-containing volatiles were absent from the vast majority of the samples. However, beetroot powder showed a 29.7% peak area ratio for dimethyl sulfide, which is in accordance with literature data. This compound probably contributes to the pungent odor and flavor of the product, although the distinctive earthy aroma of fresh beetroot is due to the presence of the terpenoid geosmin [61]. Geosmin was not detected in the beetroot powder, likely because it degraded during processing and storage. Nitrogen-containing compounds like pyrazines and acetylimidazole typically occurred in microalgae powders. Pyrazine, 2,5-dimethyl- was present in an exceptionally high peak area ratio of 7.4% in the spirulina powder. Oxygen-containing heterocyclic compounds are widely occurring natural metabolites and can be formed as a result of thermal processing in sugar-rich foods. These components include furans, furanones, and related compounds, which can contribute to the aroma of foods with sweet, baked, and caramel-like notes [62]. Compounds of this chemical class were detected in the headspace of twelve samples. Acerola powder showed an outstanding peak area ratio (14.0%) for 2-furanmethanol, while the greatest variety of oxygen-containing heterocycles was detected in the headspace of goji berry powder. Pyrazines, furan, and furan derivatives are probably formed as a result of thermal treatment. Concerning the benzene-ring compounds, the greatest number of compounds and peak area ratios were detected in spinach, spirulina, and chlorella powders. Frequently detected members of this chemical class were toluene (n = 12) and benzaldehyde (n = 7).
The total peak area ratio of alcohols in our samples ranged from 3.0% to 34.8%. At least one isomer of 2,3-butanediol was detected in eleven products. Sea buckthorn powder exhibited the highest peak area ratios for both isomers. 1-pentanol was present in eleven samples with low relative concentrations. Ethyl alcohol and 2,6-dimethylcyclohexanol were also frequently detected. The former was found in the highest proportion in vegetable powders, while the latter was a major component of microalgae powders. Smaller or higher amounts aldehydes were present in each product, except for the lucuma and turmeric powders. In sea buckthorn, wheat grass, and duckweed powders, aldehydes were present at peak area ratios above 14%. Hexanal was the most frequently detected aldehyde, which can be characterized by a fresh, green, and grassy aroma. It was present in duckweed powder in the highest proportion, followed by rosehip, sea buckthorn, chlorella, beetroot, and spirulina powders. Pentanal, another aldehyde with a fresh, green, and grassy aroma, was also present in several products. Sea buckthorn powder showed relatively high peak area ratios for heptanal and nonanal, while in the headspace of wheat grass and moringa powders, butanal, 3-methyl was detected in high proportions. Ketones were identified in the headspace of each sample with varying peak area ratios. This class of compounds contributed only 1–2% to the total volatiles in the beetroot, acerola, and turmeric powders. On the other hand, the headspace of aronia powder showed an outstanding ketone ratio of 51.1%. This product contained five ketones, of which trans-3-penten-2-one was predominant (47.5%). The fresh fruit and the juice of aronia are also rich in this volatile ketone [63,64]; thus, this compound may be a botanical marker. Acetoin was the most frequently detected ketone in our samples, followed by 5-hepten-2-one, 6-methyl-. The latter compound was present in relatively high proportions in the powders of ginger (11.6%), rosehip (9.6%), moringa (7.9%), and duckweed (4.4%).
Esters accounted for the total volatiles at 0.0 to 31.4% in the samples. A total of 26 esters were detected in at least one sample. Acerola powder showed the highest total peak area ratio for esters (31.4%), which is attributed to its high lactic acid ethyl ester content. This component was probably a result of fermentation. It was not present in other products, in contrast to acetic acid ethyl ester, which usually contributes to the fruity and sweet aroma of fruits [65]. The contribution of acids to the total peak area was typically high in the samples. Acetic acid was present in all samples at varying concentrations. Its proportion ranged between 23.5 and 89.2% in the fruit samples. In cereal grasses and moringa powder, it accounted for more than one-third of the total volatiles, while its contribution did not exceed 20% in the vegetable, microalgae, duckweed, and ginger powders. The proportion of acetic acid was only 2.7% in the turmeric powder. Propanoic, butanoic, pentanoic, and hexanoic acids were frequently detected in the samples, but long-carbon-chain fatty acids, like heptanoic, octanoic, and nonanoic acids, were scarce. Formic acid also occurred in some fruit powders with low peak area ratios. Lactones were not present in most samples at detectable amounts. Butyrolactone was identified in seven samples, but its concentration was relatively low. The contribution of this class of compounds to the total volatiles was below 1% in the samples, except for the sea buckthorn powder, which contained lactones at a peak area ratio of 3.4.
A total of 36 hydrocarbons were detected in at least one nutraceutical; however, they contributed less than 10% to the total volatiles in almost all samples. On the other hand, the headspace of spirulina powder showed an exceptionally high proportion (37.9%) of hexadecane. The results of a recent study confirm this observation, as this compound was detected at high peak area ratios in the headspace of several spirulina-based food supplements, though it did not contribute significantly to the odors of the products [66]. According to a recent study, the vivid green color and strong aroma limit the usage of microalgae as a functional ingredient [67]. These products can be characterized by a distinct algae-like aroma, encompassing grassy, fatty, and fishy notes, which are attributed to a combination of dozens of volatiles, including aldehydes, ketones, alcohols, acids, esters, furans, and sulfur compounds [68]. The proportion of hydrocarbons was very low in fruit powders, except for aronia, which contained ten different hydrocarbons at a total contribution of 5.3%. Heptane, 2,2,4,6,6-pentamethyl and nonane, 2,2,4,4,6,8,8-heptamethyl were frequently detected, but other hydrocarbons were present in only a few samples.
Based on our findings, volatiles are suitable for use as botanical markers of certain nutraceuticals, because the presence or exceptional proportions of certain compounds were characteristic of specific products. For example, high proportions of dimethyl sulfide in beetroot powder, trans-3-penten-2-one in aronia powder, hexadecane in spirulina powder, and turmerones in turmeric powder can potentially help the nutraceutical industry in authenticity testing and quality control.
4. Conclusions and Suggestions for Future Research
Our study aimed to compare sixteen commercial nutraceuticals marketed as “superfood”, based on their nutrient composition, functional properties (antioxidant and antibacterial potential), and volatile profile. Products of aquatic sources, namely spirulina, chlorella, and duckweed, were rich in protein, although they were deficient in certain amino acids. Wheat grass, spinach, and moringa powders also contained relatively high concentrations of protein. Spinach, duckweed, and moringa powders showed ash contents above 10%, so these products may serve as significant sources of essential minerals, contributing to overall dietary needs. Acerola powder was an exceptionally rich source of antioxidants, and it also exhibited strong antimicrobial activity against five pathogenic bacteria. Based on our results, microalgae powders could be effectively used to enrich foods with protein, while the addition of acerola powder would powerfully enhance their functional properties. Moringa powder is also worth highlighting, as it could enhance several parameters of foods, including their protein and mineral contents, as well as their antioxidant and antibacterial potentials. Approximately 300 volatiles were identified in the investigated nutraceuticals. A single product contained between 10 (lucuma powder) and 64 (ginger powder) volatiles. The number, intensity, and composition of these components showed large variances between the samples. Certain compounds were identified in specific products, which may help to detect adulteration and enhance quality control in the nutraceutical market.
The regulation of nutraceuticals is currently fragmented and incomplete in the EU and worldwide. As the market for nutraceutical products continues to grow, it is crucial that consumers are made aware of these regulatory gaps. Without clear and consistent guidelines and requirements, there is a risk of misleading claims, product quality issues, and potential health concerns. Our study provides valuable insights that may support authorities in developing definite international legislation for the nutraceutical market, particularly in the context of labeling requirements and minimum quality standards. The establishment of clear guidelines based on scientific evidence would contribute to consumer safety, transparency, and public health. In addition, our research could provide valuable information for nutrition science, the pharmaceutical industry, and the food industry, and may also contribute to a more informed decision-making by consumers. Future research could focus on exploring the digestibility and bioavailability of nutrients in nutraceuticals. In addition, the role of the detected volatiles in consumer acceptance and the sensory experience should also be investigated. Functional and sensory properties of foods enriched with alternative protein sources or nutraceuticals rich in bioactive components (especially acerola powder) are also important areas of future research.
Supplementary Materials
The following supporting information can be downloaded at https://www.mdpi.com/article/10.3390/app142311069/s1, Table S1: Volatile headspace compounds (peak area%) identified in superfood powders.
Author Contributions
Conceptualization, R.V., M.C. and K.T.; methodology, M.C., Z.M. and E.B.; software, Z.M., M.C. and G.S.; formal analysis, R.V. and K.T.; investigation, R.V., G.S., M.C., Z.M., E.B. and K.T.; resources, Z.M.; data curation, R.V.; writing—original draft preparation, R.V. and G.S.; writing—review and editing, M.C., Z.M., E.B. and K.T.; visualization, R.V.; supervision, M.C. and K.T.; project administration, K.T.; funding acquisition, R.V. All authors have read and agreed to the published version of the manuscript.
Funding
This research was funded by the Ministry for Innovation and Technology (ÚNKP-22-3-II-MATE/23).
Institutional Review Board Statement
Not applicable.
Informed Consent Statement
Not applicable.
Data Availability Statement
The original contributions presented in the study are included in the article/Supplementary Material, further inquiries can be directed to the corresponding author.
Acknowledgments
This work was supported by the Research Excellence Program of the Hungarian University of Agriculture and Life Sciences. The authors are grateful for the support of the Doctoral School of Food Sciences at the Hungarian University of Agriculture and Life Sciences.
Conflicts of Interest
The authors declare no conflicts of interest.
References
- Grand View Research. Superfood Market Size, Share & Trends Analysis Report by Type, by Application, by Region, and Segment Forecasts, 2024–2030. 2024. Available online: https://www.grandviewresearch.com/industry-analysis/superfood-market (accessed on 20 November 2024).
- Magrach, A.; Sanz, M.J. Environmental and social consequences of the increase in the demand for ‘superfoods’ world-wide. People Nat. 2020, 2, 267–278. [Google Scholar] [CrossRef]
- Jagdale, Y.D.; Mahale, S.V.; Zohra, B.; Nayik, G.A.; Dar, A.H.; Khan, K.A.; Abdi, G.; Karabagias, I.K. Nutritional profile and potential health benefits of super foods: A review. Sustainability 2021, 13, 9240. [Google Scholar] [CrossRef]
- Hassoun, A.; Boukid, F.; Pasqualone, A.; Bryant, C.J.; García, G.G.; Parra-López, C.; Jagtap, S.; Trollman, H.; Cropotova, J.; Barba, F.J. Emerging trends in the agri-food sector: Digitalisation and shift to plant-based diets. Curr. Res. Food Sci. 2022, 5, 2261–2269. [Google Scholar] [CrossRef]
- Kirsch, F.; Lohmann, M.; Böl, G.F. The Public’s Understanding of Superfoods. Sustainability 2022, 14, 3916. [Google Scholar] [CrossRef]
- Liu, H.; Meng-Lewis, Y.; Ibrahim, F.; Zhu, X. Superfoods, super healthy: Myth or reality? Examining consumers’ repurchase and WOM intention regarding superfoods: A theory of consumption values perspective. J. Bus. Res. 2021, 137, 69–88. [Google Scholar] [CrossRef]
- Franco Lucas, B.; Alberto Vieira Costa, J.; Brunner, T.A. How information on superfoods changes consumers’ attitudes: An explorative survey study. Foods 2022, 11, 1863. [Google Scholar] [CrossRef]
- Wiedenroth, C.F.; Otter, V. Who are the superfoodies? New healthy luxury food products and social media marketing potential in Germany. Foods 2021, 10, 2907. [Google Scholar] [CrossRef]
- Pećanin, Ž.; Vukasović, T. Factors influencing consumer purchase behaviour when buying superfoods. J. Inn. Bus. Man. 2022, 14, 1–12. [Google Scholar] [CrossRef]
- Teng, P.K.; Tai Wai, K.; Abdullah, S.I.N.W.; Ow, M.W.; Wong, K.K.S. Eating with a purpose: Development and motivators for consumption of superfood. Malays. J. Consum. Fam. Econ. 2020, 24, 207–242. [Google Scholar]
- Manjunath, P.; Fukey, L.N. Ancestral Perception Reintroduced: Assessing Consumption Patterns and Perceptions of Superfood to Bridge the Knowledge Gap among the Youth of India. In Emerging Trends in Smart Societies; Routledge: London, UK, 2024; pp. 337–340. [Google Scholar]
- Ueda, J.M.; Morales, P.; Fernández-Ruiz, V.; Ferreira, A.; Barros, L.; Carocho, M.; Heleno, S.A. Powdered Foods: Structure, Processing, and Challenges: A Review. Appl. Sci. 2023, 13, 12496. [Google Scholar] [CrossRef]
- Domínguez Díaz, L.; Fernández-Ruiz, V.; Cámara, M. The frontier between nutrition and pharma: The international regulatory framework of functional foods, food supplements and nutraceuticals. Crit. Rev. Food Sci. Nutr. 2020, 60, 1738–1746. [Google Scholar] [CrossRef]
- Fernández-Ríos, A.; Laso, J.; Hoehn, D.; Amo-Setién, F.J.; Abajas-Bustillo, R.; Ortego, C.; Palmer, P.F.; Bala, A.; Batlle-Bayer, L.; Balcells, M.; et al. A critical review of superfoods from a holistic nutritional and environmental approach. J. Clean. Prod. 2022, 379, 134491. [Google Scholar] [CrossRef]
- Kapoor, N.; Jamwal, V.L.; Shukla, M.R.; Gandhi, S.G. The rise of nutraceuticals: Overview and future. In Biotechnology Business—Concept to Delivery; Springer: Cham, Switzerland, 2020; pp. 67–92. [Google Scholar]
- Mohammadian, M.; Salami, M.; Moghadam, M.; Emam-Djomeh, Z.; Moosavi-Movahedi, A.A. Nutraceuticals and Superfoods. In Rationality and Scientific Lifestyle for Health; Springer: Berlin/Heidelberg, Germany, 2021; p. 75. [Google Scholar]
- Chambers, E.; Koppel, K. Associations of volatile compounds with sensory aroma and flavor: The complex nature of flavor. Molecules 2013, 18, 4887–4905. [Google Scholar] [CrossRef]
- Bankova, V.; Popova, M.; Trusheva, B. Propolis volatile compounds: Chemical diversity and biological activity: A review. Chem. Cent. J. 2014, 8, 28. [Google Scholar] [CrossRef]
- AOAC 2001.11; Protein (Crude) in Animal Feed, Forage (Plant Tissue), Grain, and Oilseeds. Official Methods of Analysis of the Association of Official Analytical Chemists: Official Methods of Analysis of AOAC International, 21st ed. AOAC: Washington, DC, USA, 2019.
- Yeoh, H.H.; Wee, Y.C. Leaf protein contents and nitrogen-to-protein conversion factors for 90 plant species. Food Chem. 1994, 49, 245–250. [Google Scholar] [CrossRef]
- Fujihara, S.; Kasuga, A.; Aoyagi, Y. Nitrogen-to-protein conversion factors for common vegetables in Japan. J. Food Sci. 2001, 66, 412–415. [Google Scholar] [CrossRef]
- Izhaki, I.D.O. Influence of nonprotein nitrogen on estimation of protein from total nitrogen in fleshy fruits. J. Chem. Ecol. 1993, 19, 2605–2615. [Google Scholar] [CrossRef]
- Lourenço, S.O.; Barbarino, E.; De-Paula, J.C.; Pereira, L.O.D.S.; Marquez, U.M.L. Amino acid composition, protein content and calculation of nitrogen-to-protein conversion factors for 19 tropical seaweeds. Phycol. Res. 2002, 50, 233–241. [Google Scholar] [CrossRef]
- Mariotti, F.; Tomé, D.; Mirand, P.P. Converting nitrogen into protein—Beyond 6.25 and Jones’ factors. Crit. Rev. Food Sci. Nutr. 2008, 48, 177–184. [Google Scholar] [CrossRef]
- AOAC 2003.06; Crude Fat in Feeds, Cereal Grains, and Forages. Official Methods of Analysis of the Association of Official Analytical Chemists: Official Methods of Analysis of AOAC International, 21st ed. AOAC: Washington, DC, USA, 2019.
- Singleton, V.L.; Rossi, J.A. Colorimetry of total phenolics with phosphomolybdic-phosphotungstic acid reagents. Am. J. Enol. Vitic. 1965, 16, 144–158. [Google Scholar] [CrossRef]
- Benzie, I.F.; Strain, J.J. The ferric reducing ability of plasma (FRAP) as a measure of “antioxidant power”: The FRAP assay. Anal. Biochem. 1996, 239, 70–76. [Google Scholar] [CrossRef]
- Apak, R.; Güçlü, K.; Demirata, B.; Özyürek, M.; Çelik, S.E.; Bektaşoğlu, B.; Berker, K.; Özyurt, D. Comparative evaluation of various total antioxidant capacity assays applied to phenolic compounds with the CUPRAC assay. Molecules 2007, 12, 1496–1547. [Google Scholar] [CrossRef]
- Miller, N.J.; Rice-Evans, C.; Davies, M.J.; Gopinathan, V.; Milner, A. A novel method for measuring antioxidant capacity and its application to monitoring the antioxidant status in premature neonates. Clin. Sci. 1993, 84, 407–412. [Google Scholar] [CrossRef]
- Blois, M.S. Antioxidant determinations by the use of a stable free radical. Nature 1958, 181, 1199–1200. [Google Scholar] [CrossRef]
- Hatano, T.; Kagawa, H.; Yasuhara, T.; Okuda, T. Two new flavonoids and other constituents in licorice root: Their relative astringency and radical scavenging effects. Chem. Pharma. Bullet. 1988, 36, 2090–2097. [Google Scholar] [CrossRef]
- Sun, T.; Tanumihardjo, S.A. An integrated approach to evaluate food antioxidant capacity. J. Food Sci. 2007, 72, 159–165. [Google Scholar] [CrossRef]
- Talay, R.; Erdoğan, Ü.; Turan, M. Physico-chemical properties, mineral matter, organic acid, amino acid, and plant hormones content of goji berry (Lycium barbarum L.) grown in Turkey. Turk. J. Agric. Food Sci. Technol. 2021, 9, 1889–1894. [Google Scholar] [CrossRef]
- Gao, L.; Qin, Y.; Zhou, X.; Jin, W.; He, Z.; Li, X.; Wang, Q. Microalgae as future food: Rich nutrients, safety, production costs and environmental effects. Sci. Total Environ. 2024, 927, 172167. [Google Scholar] [CrossRef]
- Regulation (EC) No 1924/2006 of the European Parliament and of the Council of 20 December 2006 on Nutrition and Health Claims Made on Foods. Available online: https://eur-lex.europa.eu/legal-content/en/ALL/?uri=CELEX%3A32006R1924 (accessed on 20 November 2024).
- Yu, W.; Du, Y.; Li, S.; Wu, L.; Guo, X.; Qin, W.; Xinlan, K.; Gao, X.; Wang, Q.; Kuang, H. Sea buckthorn-Nutritional composition, Bioactivity, Safety, and Applications: A Review. J. Food Compos. Anal. 2024, 133, 106371. [Google Scholar] [CrossRef]
- El-Sayed, S.M. Use of spinach powder as functional ingredient in the manufacture of UF-Soft cheese. Heliyon 2020, 6, e03278. [Google Scholar] [CrossRef]
- Isitua, C.C.; Lozano, M.J.S.; Jaramillo, C.; Dutan, F. Phytochemical and nutritional properties of dried leaf powder of Moringa oleifera Lam. from Machala El Oro Province of Ecuador. Asian J. Plant Sci. Res. 2015, 5, 8–16. [Google Scholar]
- Ifie, I.; Olatunde, S.; Ogbon, O.; Umukoro, J.E. Processing techniques on phytochemical content, proximate composition, and toxic components in duckweed. Int. J. Veg. Sci. 2021, 27, 294–302. [Google Scholar] [CrossRef]
- Zhu, J.; Xiao, X.; Du, W.; Cai, Y.; Yang, Z.; Yin, Y.; Wakisaka, M.; Wang, J.; Zhou, Z.; Liu, D.; et al. Leveraging microalgae as a sustainable ingredient for meat analogues. Food Chem. 2024, 450, 139360. [Google Scholar] [CrossRef] [PubMed]
- FAO/WHO/UNU Expert Consultation. Protein and Amino Acid Requirements in Human Nutrition; WHO Technical Reports Series no. 935; WHO: Geneva, Switzerland, 2007. [Google Scholar]
- Krajcovicova-Kudlackova, M.; Babinska, K.; Valachovicova, M. Health benefits and risks of plant proteins. Bratislavske lekarske listy 2005, 106, 231. [Google Scholar]
- Judge, A.; Dodd, M.S. Metabolism. Essays Biochem. 2020, 64, 607–647. [Google Scholar] [CrossRef]
- Martemucci, G.; Portincasa, P.; Centonze, V.; Mariano, M.; Khalil, M.; D’Alessandro, A.G. Prevention of oxidative stress and diseases by antioxidant supplementation. Med. Chem. 2023, 19, 509–537. [Google Scholar] [CrossRef]
- Gutiérrez-del-Río, I.; López-Ibáñez, S.; Magadán-Corpas, P.; Fernández-Calleja, L.; Pérez-Valero, Á.; Tuñón-Granda, M.; Miguélez, E.M.; Villar, C.J.; Lombó, F. Terpenoids and polyphenols as natural antioxidant agents in food preservation. Antioxidants 2021, 10, 1264. [Google Scholar] [CrossRef]
- Šeregelj, V.; Tumbas Šaponjac, V.; Pezo, L.; Kojić, J.; Cvetković, B.; Ilic, N. Analysis of antioxidant potential of fruit and vegetable juices available in Serbian markets. Food Sci. Technol. Int. 2024, 30, 472–484. [Google Scholar] [CrossRef]
- Gorjanović, S.; Komes, D.; Pastor, F.T.; Belščak-Cvitanović, A.; Pezo, L.; Hečimović, I.; Sužnjević, D. Antioxidant capacity of teas and herbal infusions: Polarographic assessment. J. Agr. Food Chem. 2012, 60, 9573–9580. [Google Scholar] [CrossRef]
- Gorjanović, S.; Komes, D.; Laličić-Petronijević, J.; Pastor, F.T.; Belščak-Cvitanović, A.; Veljović, M.; Pezo, L.; Sužnjević, D.Ž. Antioxidant efficiency of polyphenols from coffee and coffee substitutes-electrochemical versus spectrophotometric approach. J. Food Sci Technol. 2017, 54, 2324–2331. [Google Scholar] [CrossRef]
- Lee, K.J.; Baek, D.Y.; Lee, G.A.; Cho, G.T.; So, Y.S.; Lee, J.R.; Ma, K.H.; Chung, J.W.; Hyun, D.Y. Phytochemicals and antioxidant activity of Korean black soybean (Glycine max L.) landraces. Antioxidants 2020, 9, 213. [Google Scholar] [CrossRef] [PubMed]
- Végh, R.; Sipiczki, G.; Csóka, M. Investigating the Antioxidant and Color Properties of Bee Pollens of Various Plant Sources. Chem. Biodivers. 2023, 20, e202300126. [Google Scholar] [CrossRef] [PubMed]
- Roidaki, A.; Kollia, E.; Panagopoulou, E.; Chiou, A.; Varzakas, T.; Markaki, P. Super foods and super herbs: Antioxidant and antifungal activity. Curr. Res. Nutr. Food Sci. J. 2016, 4, 138–145. [Google Scholar] [CrossRef]
- Vilvert, J.C.; de Freitas, S.T.; dos Santos, L.F.; Ribeiro, T.D.S.; Veloso, C.M. Phenolic compounds in acerola fruit and by-products: An overview on identification, quantification, influencing factors, and biological properties. J. Food Mes. Charact. 2024, 18, 216–239. [Google Scholar] [CrossRef]
- Oulahal, N.; Degraeve, P. Phenolic-rich plant extracts with antimicrobial activity: An alternative to food preservatives and biocides? Front. Microbiol. 2022, 12, 753518. [Google Scholar] [CrossRef]
- Prakash, A.; Baskaran, R. Acerola, an untapped functional superfruit: A review on latest frontiers. J. Food Sci. Technol. 2018, 55, 3373–3384. [Google Scholar] [CrossRef]
- Mumtaz, S.; Mumtaz, S.; Ali, S.; Tahir, H.M.; Kazmi, S.A.R.; Mughal, T.A.; Younas, M. Evaluation of antibacterial activity of vitamin C against human bacterial pathogens. Braz. J. Biol. 2021, 83, e247165. [Google Scholar] [CrossRef]
- van den Berg, J.; Kuipers, S. The antibacterial action of Moringa oleifera: A systematic review. S. Afr. J. Bot. 2022, 151, 224–233. [Google Scholar] [CrossRef]
- Bolhassani, A.; Khavari, A.; Bathaie, S.Z. Saffron and natural carotenoids: Biochemical activities and anti-tumor effects. Biochim. Biophys. Acta 2014, 1845, 20–30. [Google Scholar] [CrossRef]
- Pepejal, I.M.; Fasa, P.M.; Spektrometri, K.G. Analysis of volatile compounds of spices grown in Banyumas District, Jawa Tengah, Indonesia using solid phase microextraction-gas chromatography mass spectrometry. Malays. J. Anal. Sci. 2019, 23, 963–979. [Google Scholar]
- Pang, X.; Cao, J.; Wang, D.; Qiu, J.; Kong, F. Identification of ginger (Zingiber officinale Roscoe) volatiles and localization of aroma-active constituents by GC–olfactometry. J. Agric. Food Chem. 2017, 65, 4140–4145. [Google Scholar] [CrossRef] [PubMed]
- Laelago Ersedo, T.; Teka, T.A.; Fikreyesus Forsido, S.; Dessalegn, E.; Adebo, J.A.; Tamiru, M.; Astatkie, T. Food flavor enhancement, preservation, and bio-functionality of ginger (Zingiber officinale): A review. Int. J. Food Prop. 2023, 26, 928–951. [Google Scholar] [CrossRef]
- Richardson, B. Identification and Characterization of Potent Odorants in Selected Beet Root (Beta vulgaris) Products. Doctoral Dissertation, University of Illinois at Urbana-Champaign, Champaign, IL, USA, 2013. [Google Scholar]
- Van Boekel, M.A.J.S. Formation of flavour compounds in the Maillard reaction. Biotechnol. Adv. 2006, 24, 230–233. [Google Scholar] [CrossRef] [PubMed]
- Romani, A.; Vignolini, P.; Ieri, F.; Heimler, D. Polyphenols and volatile compounds in commercial chokeberry (Aronia melanocarpa) products. Natur. Prod. Comm. 2016, 11, 1934578X1601100129. [Google Scholar] [CrossRef]
- Kraujalytė, V.; Leitner, E.; Venskutonis, P.R. Characterization of Aronia melanocarpa volatiles by headspace-solid-phase microextraction (HS-SPME), simultaneous distillation/extraction (SDE), and gas chromatography-olfactometry (GC-O) methods. J. Agr. Food Chem. 2013, 61, 4728–4736. [Google Scholar] [CrossRef]
- Song, J.; Forney, C.F. Flavour volatile production and regulation in fruit. Can. J. Plant Sci. 2008, 88, 537–550. [Google Scholar] [CrossRef]
- Paraskevopoulou, A.; Kaloudis, T.; Hiskia, A.; Steinhaus, M.; Dimotikali, D.; Triantis, T.M. Volatile Profiling of Spirulina Food Supplements. Foods 2024, 13, 1257. [Google Scholar] [CrossRef]
- Olsen, M.L.; Olsen, K.; Jensen, P.E. Consumer acceptance of microalgae as a novel food-Where are we now? And how to get further. Physiol. Plant. 2024, 176, e14337. [Google Scholar] [CrossRef]
- Urlass, S.; Wu, Y.; Nguyen, T.T.; Winberg, P.; Turner, M.S.; Smyth, H. Unravelling the aroma and flavour of algae for future food applications. Trends Food Sci. Technol. 2023, 138, 370–381. [Google Scholar] [CrossRef]
Disclaimer/Publisher’s Note: The statements, opinions and data contained in all publications are solely those of the individual author(s) and contributor(s) and not of MDPI and/or the editor(s). MDPI and/or the editor(s) disclaim responsibility for any injury to people or property resulting from any ideas, methods, instructions or products referred to in the content. |
© 2024 by the authors. Licensee MDPI, Basel, Switzerland. This article is an open access article distributed under the terms and conditions of the Creative Commons Attribution (CC BY) license (https://creativecommons.org/licenses/by/4.0/).