Article

Immobilization of Levocetirizine on Mesoporous Silica for Antiallergenic Gel Formulation

1
Institute of Materials and Environmental Chemistry, HUN-REN Research Centre for Natural Sciences, Magyar tudósok Körútja 2, H-1117 Budapest, Hungary
2
EGIS Pharmaceuticals PLC, Keresztúri út 30-38, H-1106 Budapest, Hungary
*
Author to whom correspondence should be addressed.
Appl. Sci. 2024, 14(20), 9605; https://doi.org/10.3390/app14209605
Submission received: 26 September 2024 / Revised: 16 October 2024 / Accepted: 17 October 2024 / Published: 21 October 2024
(This article belongs to the Special Issue Pharmaceutical Development and Drug Delivery)

Abstract

:
Levocetirizine dihydrochloride is an effective antiallergenic drug applied mostly orally; however, developing a topical formulation for localized treatment could be beneficial. To achieve this, a modified formulation technique is necessary to enhance bioavailability efficiency and minimize possible side effects. Therefore, levocetirizine particles were prepared by immobilization on mesoporous silica material. Both the dihydrochloride form and its free base of levocetirizine were fixed on a silica-type Syloid support. Immobilization of the active ingredient levocetirizine in a free base form on a Syloid support by mixing in a dichloromethane solution provides better surface coverage (65.5%) than immobilization in the dihydrochloride form in water or methanol (24.5% for both). The successful binding of levocetirizine was confirmed by X-ray photoelectron spectroscopy and infrared measurements. The active ingredient in the form of hydrochloride is more likely to be in the pores, while the free base is bound to the surface in larger quantities. The time-dependent levocetirizine release showed that the liberation of the active ingredient from the Syloid is slower than the dissolution of the starting active ingredient itself, so it may be suitable for exerting a more reliable and prolonged local effect. A gel containing a Syloid-fixed levocetirizine free base was tested in vivo in a croton oil-induced ear edema mouse model. When compared to a reference gel, the half-dose formulation containing levocetirizine free base demonstrated a similar efficacy to Fenistil gel, indicating that the new formulation may offer superior effectiveness at lower doses.

1. Introduction

A significant proportion of the population today is affected by allergic diseases, with allergic rhinitis impacting 25–35% of people, and its prevalence continues to rise. The most common symptoms include immediate allergic or anaphylactic reactions, which are caused by the immune response triggered by the IgE-type antibody. When these antibodies bind to surface receptors of various immune cells, they prompt them to release histamine and leukotrienes, which cause vasodilation, edema, and itching. The symptoms significantly worsen the patient’s quality of life, affecting their cognitive and emotional functioning [1]. Another inflammatory skin disease is atopic dermatitis (AD), with a prevalence of 15–30%. Two types of this chronic and pruritic skin syndrome are known, called intrinsic AD and extrinsic AD. Extrinsic AD affects about 80% of patients and is marked by IgE-mediated sensitization, leading to elevated serum IgE levels [2]. Oral H1-antihistamines, such as leukotriene antagonists, and corticosteroids, are usually used in their therapies [3,4]. Levocetirizine (Levo) is a second-generation histamine H1-receptor antagonist, which effectively reduces allergic symptoms, such as runny nose, sneezing, watery eyes, or reactions to insect bites and rashes. It does not prevent the release of histamine from mast cells but inhibits its binding to receptors [5].
Levocetirizine is chemically a piperazine derivative (Figure 1A), as the hydrochloric acid salt of the R(levo)-enantiomer of cetirizine named officially as levocetirizine dihydrochloride (LevdC, C21H25ClN2O3*2HCl; 2-[2-[4-[(R)-(4-chlorophenyl)-phenyl-methyl]piperazine-1-yl]ethoxy]acetic acid dihydrochloride), and is commercially available. The other cetirizine stereoisomer, the S(dextro)-enantiomer (Figure 1B), differs significantly from the R-enantiomer in its pharmacokinetic and pharmacodynamic effects. It is 30 times less effective than the R-enantiomer. Cetirizine dihydrochloride, on the other hand, is also available on the market as a racemic mixture in a less effective form for financial reasons [6]. Levo is barely metabolized in the human body and is mostly excreted unchanged [7]. Levo belongs to the new types of antihistamines and as such has few known side effects (tiredness, drowsiness, sinus pain, ear infection, cough, fever, nose bleeding, vomiting, diarrhea, constipation, weight gain, or dry mouth) [8], and it hardly enters the central nervous system, like the first-generation antihistamine preparations. However, achieving a greater effect and reducing the dose is an important aspect in the development of Levo-containing preparations. They are usually used orally in the form of tablets, capsules, syrups, drops, and oral liquids [9]. The systemically effective product is, therefore, of limited use. In contrast, locally applied Levo would provide targeted therapy and reduce systemic side effects (drowsiness, fever, cough); however, a topical preparation is available on the market only for a racemic mixture drug. A topical formulation of cetirizine has also been investigated in various dosage forms [10,11].
There was a need for the development of a topical gel preparation for the symptomatic treatment of urticaria on the skin that can have a more prolonged effect with fewer side effects, alleviating itching, and effectively reducing skin edema. One approach for enhancing efficacy while minimizing side effects is to reduce the particle size of the active ingredient [12,13]. Various traditional (e.g., melt quenching, hot melt extrusion) and new methods (supercritical fluid technique, freeze-drying, spray-drying, and spray freeze-drying) [14,15,16] are available for this purpose. Furthermore, there is a new method of increasing effectiveness, which is becoming more and more common in the cosmetics and pharmaceutical industry; it is the application of drug delivery systems (DDSs) using various organic (liposomes, polymer particles, dendrimers, various nanoparticles) and inorganic carriers (mesoporous silicon dioxide material; MSM) [17,18,19]. Inorganic silica carriers have many favorable properties, such as being non-toxic and biocompatible and having a large surface area and a large pore volume with a well-defined pore size. Additionally, their surface contains silanol groups that are easily modifiable. The bioavailability of the active ingredient increases in the case of amorphous drugs fixed in mesopores, as the crystallization of these active ingredients in the silica is significantly reduced [20,21]. Silica MSM is primarily known as a carrier of less-soluble active ingredients, increasing their apparent solubility, since they are mainly in amorphous form. However, according to the literature, MSM has proven to be a special carrier that is capable of controlled and on-demand delivery of hydrophobic and hydrophilic drug molecules as well [22]. For example, the hydrophilic gemcitabine can also be well fixed on the functionalized MSM [23].
In this work, we aimed to develop a gel containing Levo that has a topical effect on the skin, which rapidly relieves allergic symptoms, reduces local irritation, and exhibits long-lasting effects due to the immobilization of drug molecules within the micropores of the MSM. To ensure good bioavailability of Levo, we investigated which form of the active ingredient is best suited for fixing on MSM to obtain DDSs.

2. Materials and Methods

2.1. Materials

Levocetirizine dihydrohloride (LevdC) was supplied by Capot Chemical Co., Ltd. (Hangzhou, China) and by Egis Pharmaceuticals PLC (Budapest, Hungary) with European Pharmacopoeia (EuP) specification. Syloid®72FP from Grace Materials Technologies Ltd. (Columbia, MD, USA) was chosen as the MSM based on the supplier’s recommendation stating that it has excellent performance as a carrier for cream and gel preparations. Sodium hydroxide, acetone, dichloromethane (DCM), and methanol were obtained from Reanal Ltd. (Budapest, Hungary). High-purity water (18.3 MΩ/cm) was prepared by a Millipore water purification system (Merck Millipore, Burlington, MA, USA). Miglyol 812 and Dermofeel viscolid were obtained from Egis Pharmaceuticals PLC (Budapest, Hungary). Menthol (racemic) was supplied by Alfa Aesar, Budapest, Hungary. Croton oil was purchased from Sigma-Aldrich Chemicals Private Limited (Merck Life Science Kft., a subsidiary of Merck KGaA, Darmstadt, Germany). Fensitil gel was prepared by GSK (Brentford, UK). The mice were from Toxi-Coop Zrt., Budapest, Hungary.

2.2. Preparation of Levocetirizine Dihydrohloride and Levocetirizine Base Immobilized on MSM

Two different forms of levocetirizine (dihydrochloride and free base; LevdC and Levb) were employed to be immobilized on MSM. Our previously published mixing technique [24] was used to immobilize LevdC from different solutions on Syloid MSM. For the samples SyLev1–SyLev2, the solvent was water (W), while for the samples SyLev3–SyLev5, it was methanol (M), and the concentration of both solutions was 2 g 100 mL−1. Two g of the particulate Syloid carrier was stirred with 2 w/w% LevdC solutions (aqueous, methanolic) by changing the mixing time (2, 24, and 72 h), as Table 1 shows. The solid Syloid material, to which the agent had been immobilized, was filtered using a filter paper, and subsequently dried to weight stability. The material was filled into boxes under nitrogen and stored in a desiccator.
Levocetirizine free base (Levb) was used for the preparation of samples SyLev6–SyLev9. The synthesis of Levb was described by Basavaiah et al. [25] (Figure S1); however, in our experiment, some modification in the procedure was applied. An amount of 4.62 g (10 mmol) of LevdC was dissolved in 50 mL water (pH = 1.2). At continuous stirring at ambient temperature, the pH was kept at 9 with 1 M NaOH (34.3 mL); after 10 min, the pH was set to 6 with 1 M HCl solution (8 mL). After a further 30 min of stirring, the solution was extracted with 80 mL dichloromethane (DCM). Two phases were checked by thin layer chromatography (in 20:2 DCM:M eluent). We used another 20 mL DCM to extract the aqueous phase. The mixed DCM phases were dried over anhydrous magnesium sulfate; later, the desiccant was filtered off. After the determination of Levb content with a rapid spectrophotometric method according to Prabhu et al. (absorbance was read at 231 nm) [26], the appropriate volume of solution obtained was used for further experiments. The as-prepared Levb was immobilized on MSM in DCM solvent. The ratio of the Syloid carrier to the active ingredient was the same as in the previous series of experiments, while the stirring times varied from 2 to 72 h (Table 1). The further experimental processes, such as filtering, drying, and storage, were also the same as those used in the previous series of experiments.

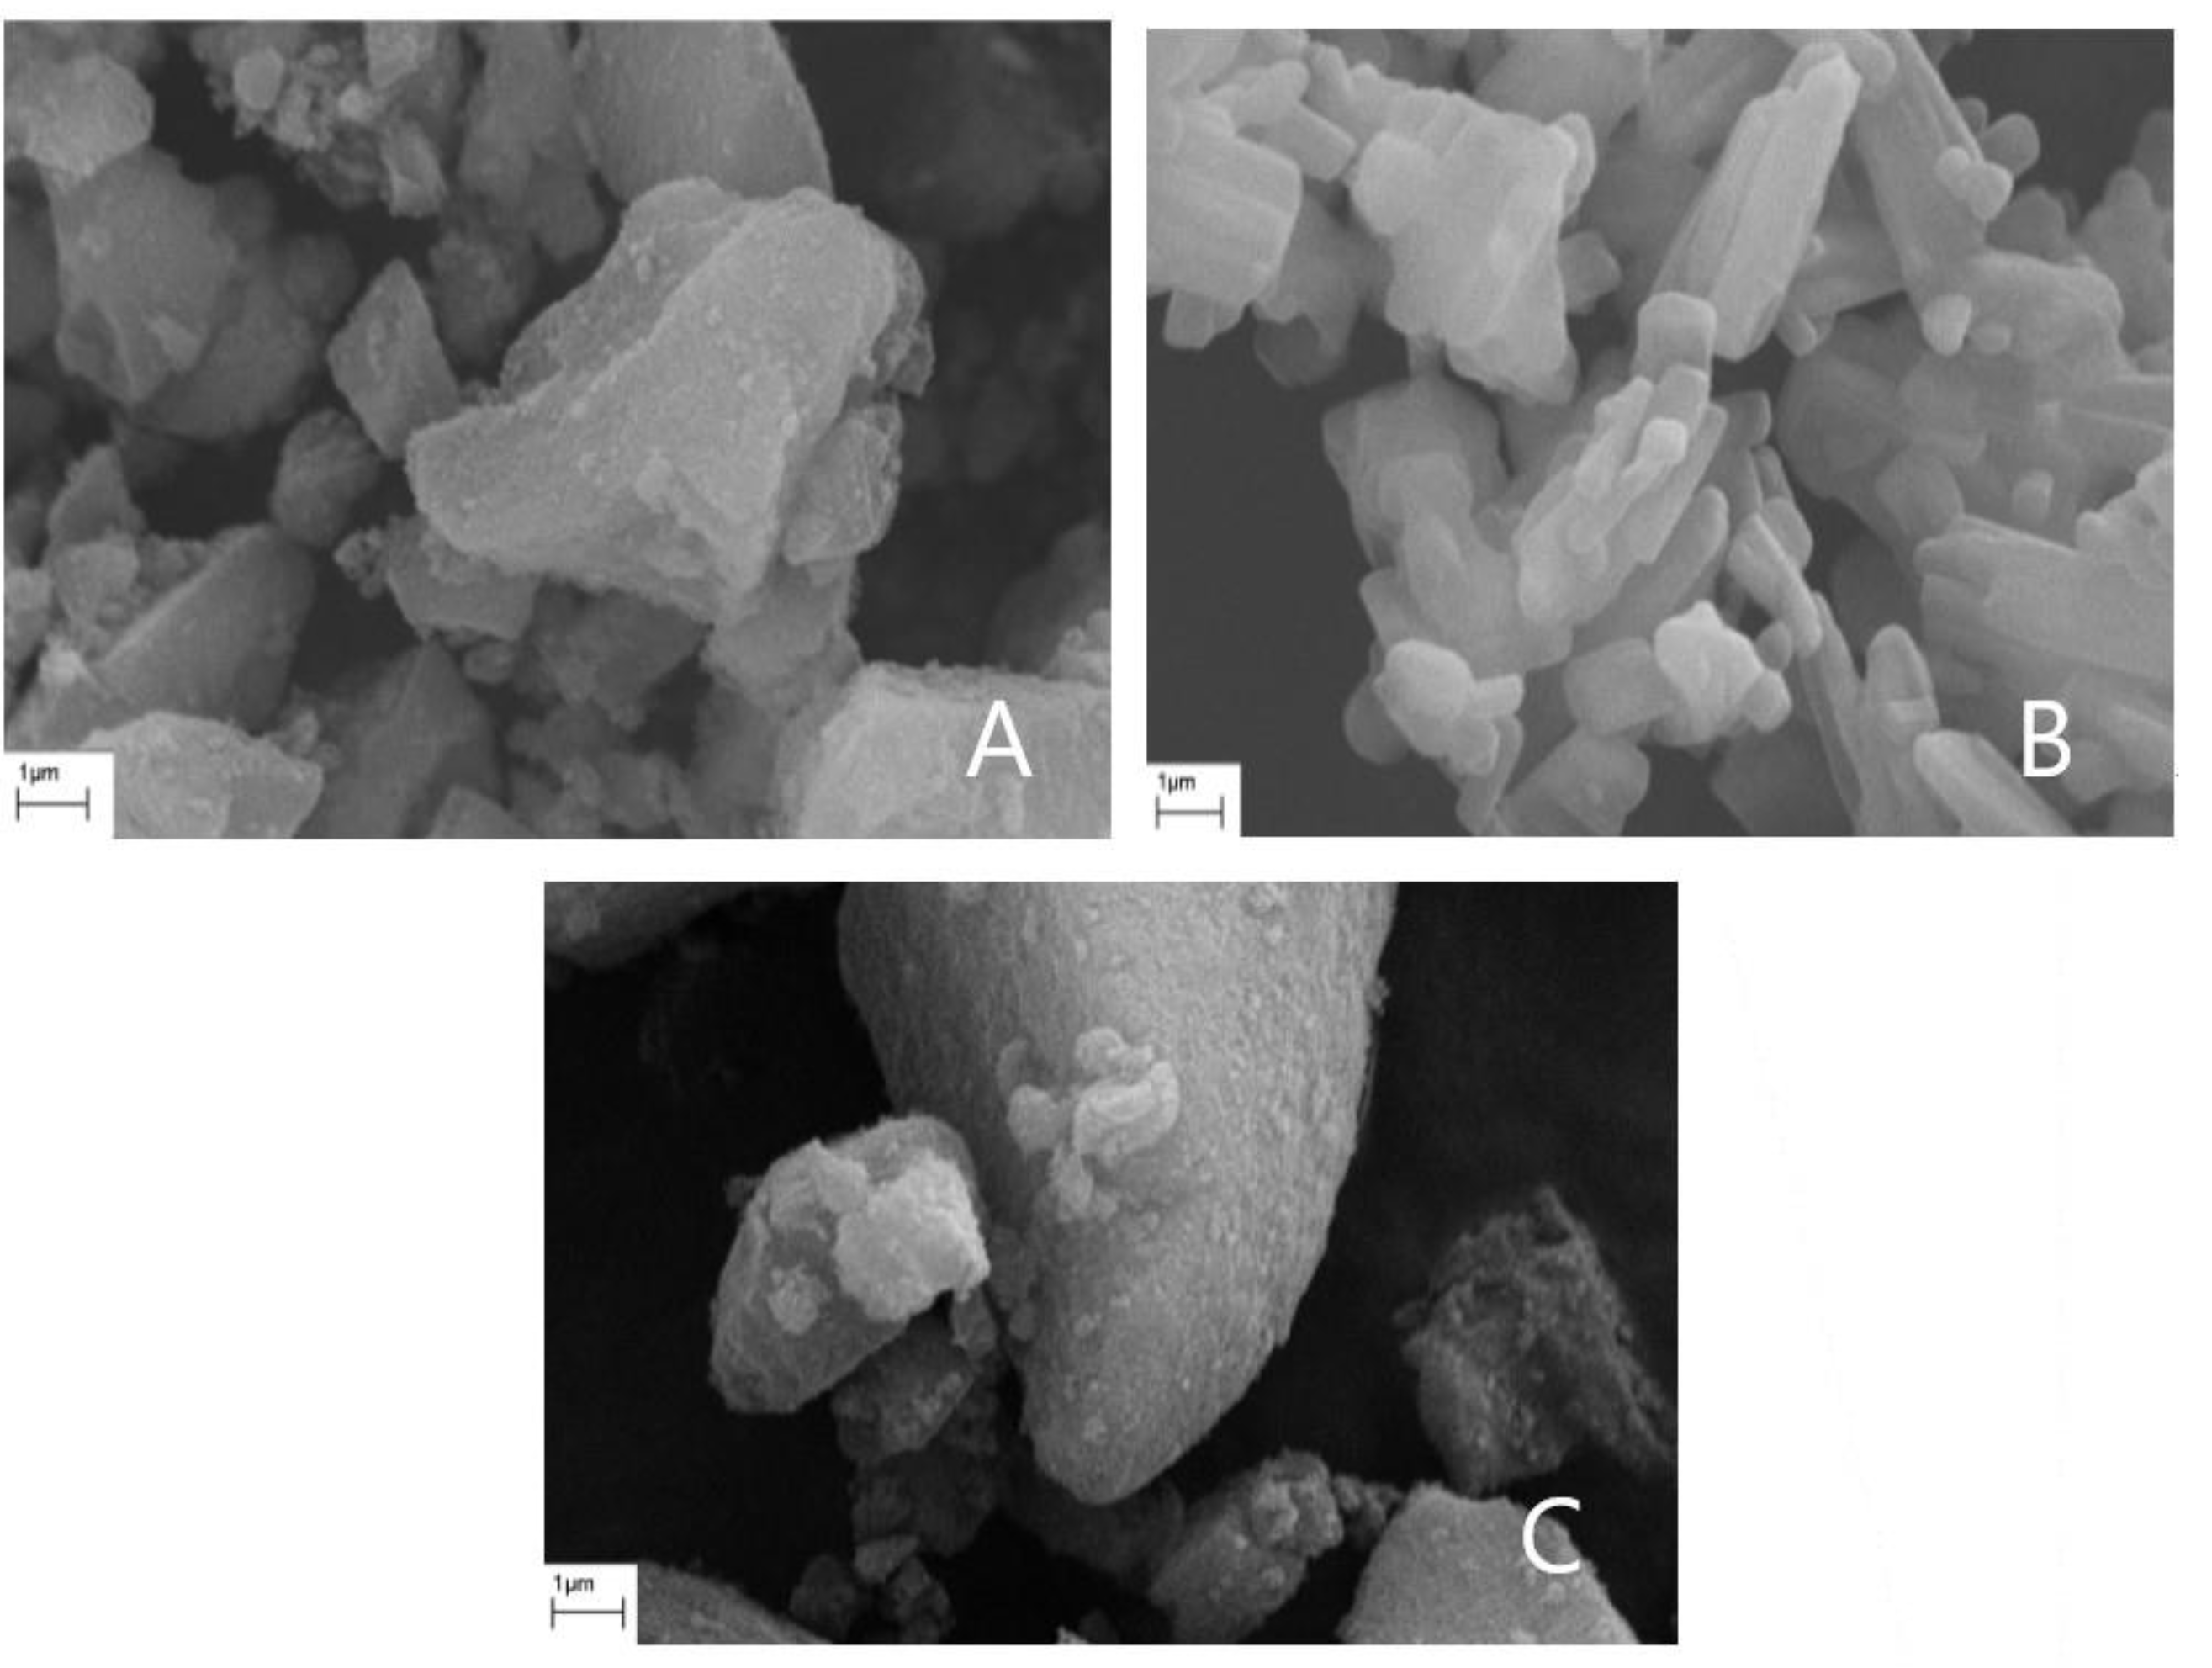
2.3. Scanning Electron Microscopy (SEM) Measurement

The starting materials and the synthesized mesoporous materials were characterized using SEM (Zeiss EVO40, Zeiss, Jena, Germany) equipment equipped with a tungsten hairpin filament operated at 20 kV. Working distance was set between 10 and 11 mm depending on the focus. Images were captured at various magnifications utilizing a secondary electron detector. Prior to analysis, the powders were sputter-coated with an ultrathin layer of gold to avoid electrostatic charging.

2.4. Low-Temperature Nitrogen Adsorption/Desorption

To characterize the porous structure of the samples, we took up the nitrogen adsorption isotherms at 77 K by an Autosorb 1C (Quantachrome. Boynton Beach, FL, USA) static volumetric instrument, which was computer-controlled. To characterize the porous structure of the samples, we took up the nitrogen adsorption isotherms at −196 °C by an Autosorb 1C (Quantachrome. Boynton Beach, FL, USA) static volumetric instrument, which was computer-controlled. The measurements involved monitoring the volume increase at equilibrium as a function of relative pressure. Prior to gas adsorption, all samples were degassed under vacuum at 60 °C. Approximately 0.05 g of each sample was used, with incremental doses of nitrogen added until a relative pressure (p/p0) of 1 was reached. The Brunauer–Emmett–Teller (BET) model was applied to determine the apparent surface area [27], while the total pore volume (Vtot) was estimated from the amount of nitrogen adsorbed at a relative pressure p/p0 close to 1, assuming that nitrogen is in a condensed phase. The distribution of pore size was calculated from the desorption branch of the isotherms, using the Barrett–Joyner–Halenda (BJH) method, and the micropore volume (Vm) was obtained from the Dubinin–Radushkevich (DR) model.

2.5. X-ray Photoelectron Spectroscopy (XPS) Measurement

The XPS measurements were carried out with utmost care and precision using a Kratos XSAM 800 spectrometer operating in fixed analyzer transmission mode (pass energy 40 eV) (Kratos Analytical, Manchester, UK), using Mg Kα1.2 (1253.6 eV) excitation. We recorded the survey spectra in the kinetic energy range of 150–1300 eV with 0.5 eV steps. Photoelectron lines of the primary constituent elements (O1s, N1s, C1s, and Si2p) were recorded with 0.1 eV steps. The C1s line (binding energy, BE = 285.0 eV) of the hydrocarbon type carbon was used as a reference in the spectra. Quantitative analysis and layer thickness calculations, based on peak area intensity after Shirley-type background removal, were performed by the XPS MultiQuant 7.8 program [28], using cross-section data of Evans et al. [29] and asymmetry parameters of Reilman et al. [30] We used the method described by Mohai [31] for the correction of the surface contamination.

2.6. X-ray Diffraction (XRD) Measurement

X-ray powder diffraction measurements were carried out on a Philips PW-1050 diffractometer (Philips, Amsterdam, The Netherlands), which was equipped with a Bragg–Brentano parafocusing goniometer. The anode tube was made of Cu and operated at 40 kV and 35 mA. A secondary beam graphite monochromator, along with a proportional counter, were used for detection. The scans were performed in step mode with a step size of 0.04° for 1 s covering the 2θ range from 10° to 70°.

2.7. Differential Scanning Calorimetric (DSC) Measurement

The thermal properties of the samples were measured by the use of a Setaram LabsysEvo (Lyon, France) TG-DSC apparatus. All materials were used as received and were heated in 100 μL Al cells from 25 °C to 300 °C with a heating rate of 10 °C·min−1. The obtained raw measurement data were baseline corrected using the thermoanalyzer’s processing software (Calisto Processing, ver. 2.06), where the calorimetric melting point, peak maximum temperature, and melting enthalpy were determined by the baseline integration method. The degree of crystallinity of the Levo in the samples was calculated based on comparing the melting enthalpies of samples with the melting enthalpy of fully crystalline starting Levo reference material. The above-mentioned thermal analyzer was calibrated by the use of seven different certified reference materials (CRMs), which covered the apparatus’s entire operating temperature range.

2.8. Infrared Spectroscopic (IR) Measurements

Fourier transform infrared spectra with attenuated total reflectance (FTIR-ATR) were collected for the powder samples in the wavelength ranges of 4000 and 400 cm−1 over 32 scans, with a resolution of 4 cm−1. The measurements were conducted using a Tensor 27 (Bruker Optik GmbH, Leipzig, Germany) spectrophotometer fitted with a Platinum ATR unit A225. Air was used as the background medium during the measurements.

2.9. Levocetirizine Releasing Study from Silica Containing Drug Delivery System

Samples of 2 g of Levo immobilized on Syloid were stirred in water at room temperature and at 37 °C at constant speed, and were sampled from the system at different times. A 5 mL portion of the solution was withdrawn, and the sample volume was replenished with water. The Levo concentration in the extracted solution was analyzed using spectrophotometry, with absorbance measured at 231 nm.

2.10. Preparation of Gel for In Vivo Experiment

For gel preparation, Dermofeel viscolid powder (5% w/w), Miglyol 812 (95% w/w), and sample SyLev8 of the highest active ingredient content (23.2%, w/w) were used. Miglyol 812 and Dermofeel viscolid powder were combined in a beaker and heated in a water bath at 50 °C. Subsequently, the measured quantity of sample SyLev8 was added to the gel in a quantity to set the final concentration at 5% (w/w) for Levo. This was then stirred vigorously at 1100 rpm for a period of two minutes. Subsequently, the sample was stirred at 500 rpm for 20 min at room temperature. During this period, the sample (SyLev) solidified, forming a homogeneously distributed oleogel. The gel (Suppl. Figure S2) was stored at 0–5 °C.

2.11. Animal Experiment

NMRI mice (27–34 g) were divided into five groups, each consisting of 8 animals. Edema was induced in all groups employing croton oil (100 µL dissolved in 10 µL acetone) and acetone (10 µL) on the inner surface of the right and left ear, respectively [32]. The first group served as the control and was treated with croton oil only. The second group received croton oil and a reference treatment of Fenistil gel (20 µL/concentration: 0.1% w/w), while the third, fourth, and fifth groups were tested with croton oil and gel (5, 10, and 20 µL) containing sample SyLev8 (50 mg Levo gel). Ear thickness was measured using a Quick Mini Caliper (Mitutoyo Corporation, Kawasaki, Japan).
As the first step of the experiment, the treatment was applied to the inner side of the right ear with the reference gel and the gel containing sample SyLev8. Then, 30 min later, the croton oil treatment took place. After 4 h, we measured the ear thicknesses. The evaluation was based on the difference in the thicknesses of the right and left ear.
We kept all animals in cages made of plastic under standard laboratory conditions (24 ± 2 °C, 40–60% relative humidity) with unrestricted access to standard laboratory pellets and drinking water. The study adhered to the Declaration of Helsinki guidelines and the EU Directive 2010/63/EU for animal experiments and was approved by the local animal ethical committee (COEO-mice). All animal procedures were performed under the stipulations of the Protection and Careful Treatment of Animals Decree (40/2013. II. 14., Hungarian Government Decree) and were approved by the Institutional Animal Care and Use Committee.

2.12. Statistical Analysis

For statistical analysis, we used GraphPad Prism 9.0 (GraphPad Software, San Diego, CA, USA) software. Mean and standard error of the mean were calculated from the observed data. The statistical evaluation was performed by one-way analysis of variance followed by Bonferroni’s multiple comparison tests (selected comparisons) for edema thickness. The significance was determined as p < 0.05.

3. Results and Discussions

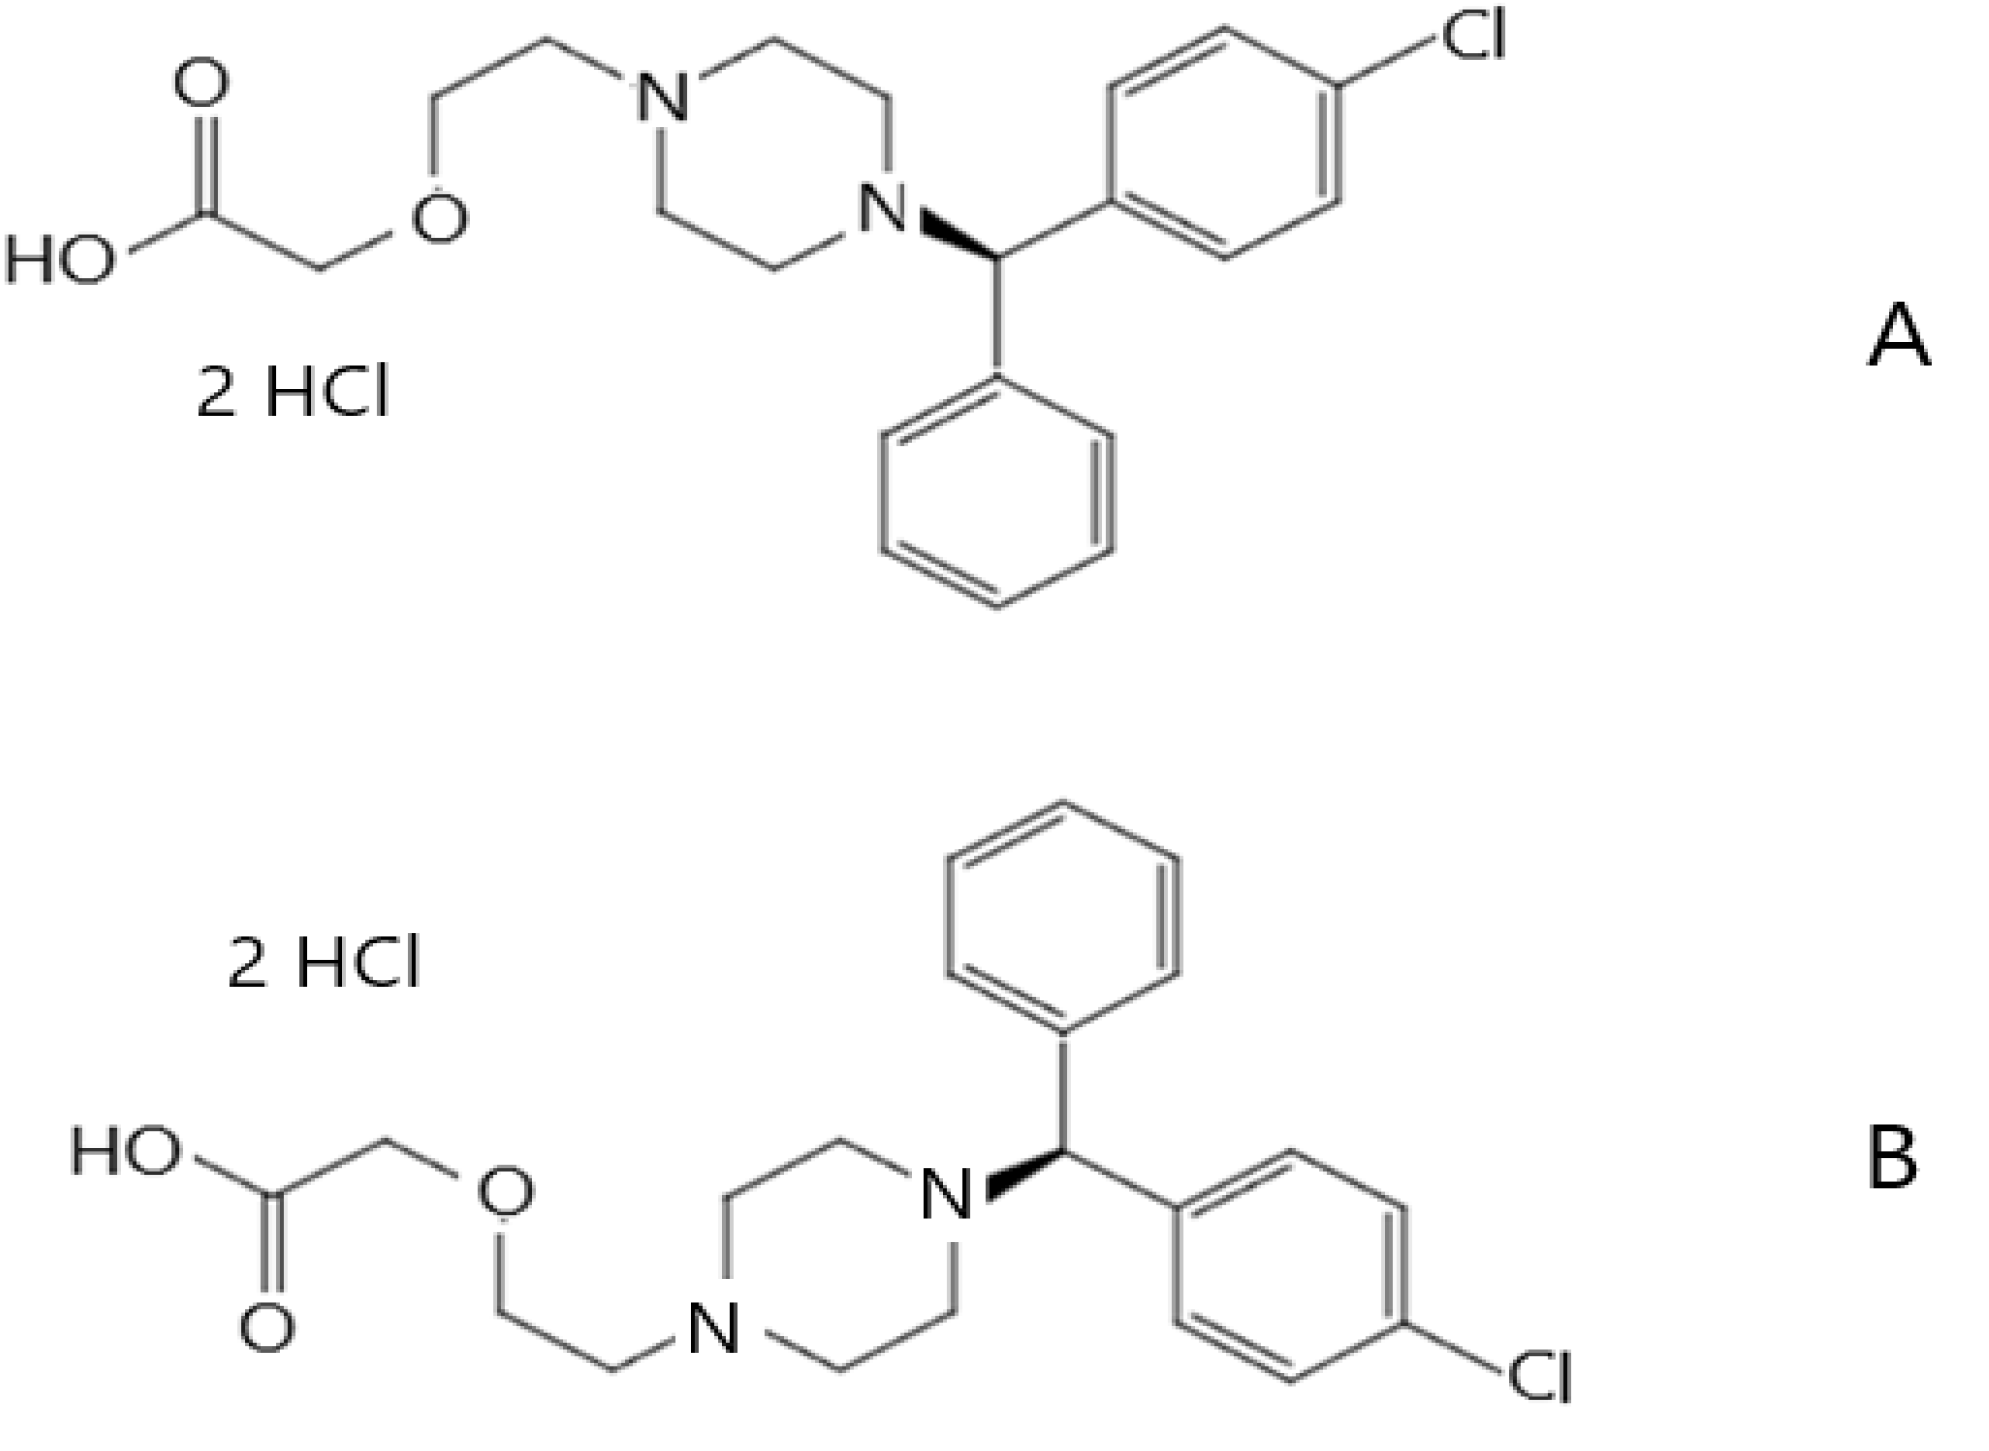
3.1. Surface Characterization of Pure Levocetirizine Samples

To identify the active ingredient on the surface of the carrier, both forms of levocetirizine (dihydrochloride and free base) were analyzed by XPS before the immobilization experiments. The two forms can be distinguished by the chemical states of nitrogen (C–N 399.4 eV, C–N+ 401.7 eV) and chlorine (Cl–C 200.7 eV, Cl 197.6 eV). The surface compositions for the resolved chemical states are shown in Suppl. Table S1. Both molecule forms are on the surface, indicated by the chemical states of nitrogen and chlorine. The quantity of Cl is relatively low compared to N+. The moderate oxygen surplus may suggest that some of the Cl were replaced by OH groups. The concentrations of the carboxyl groups are also lower than expected.

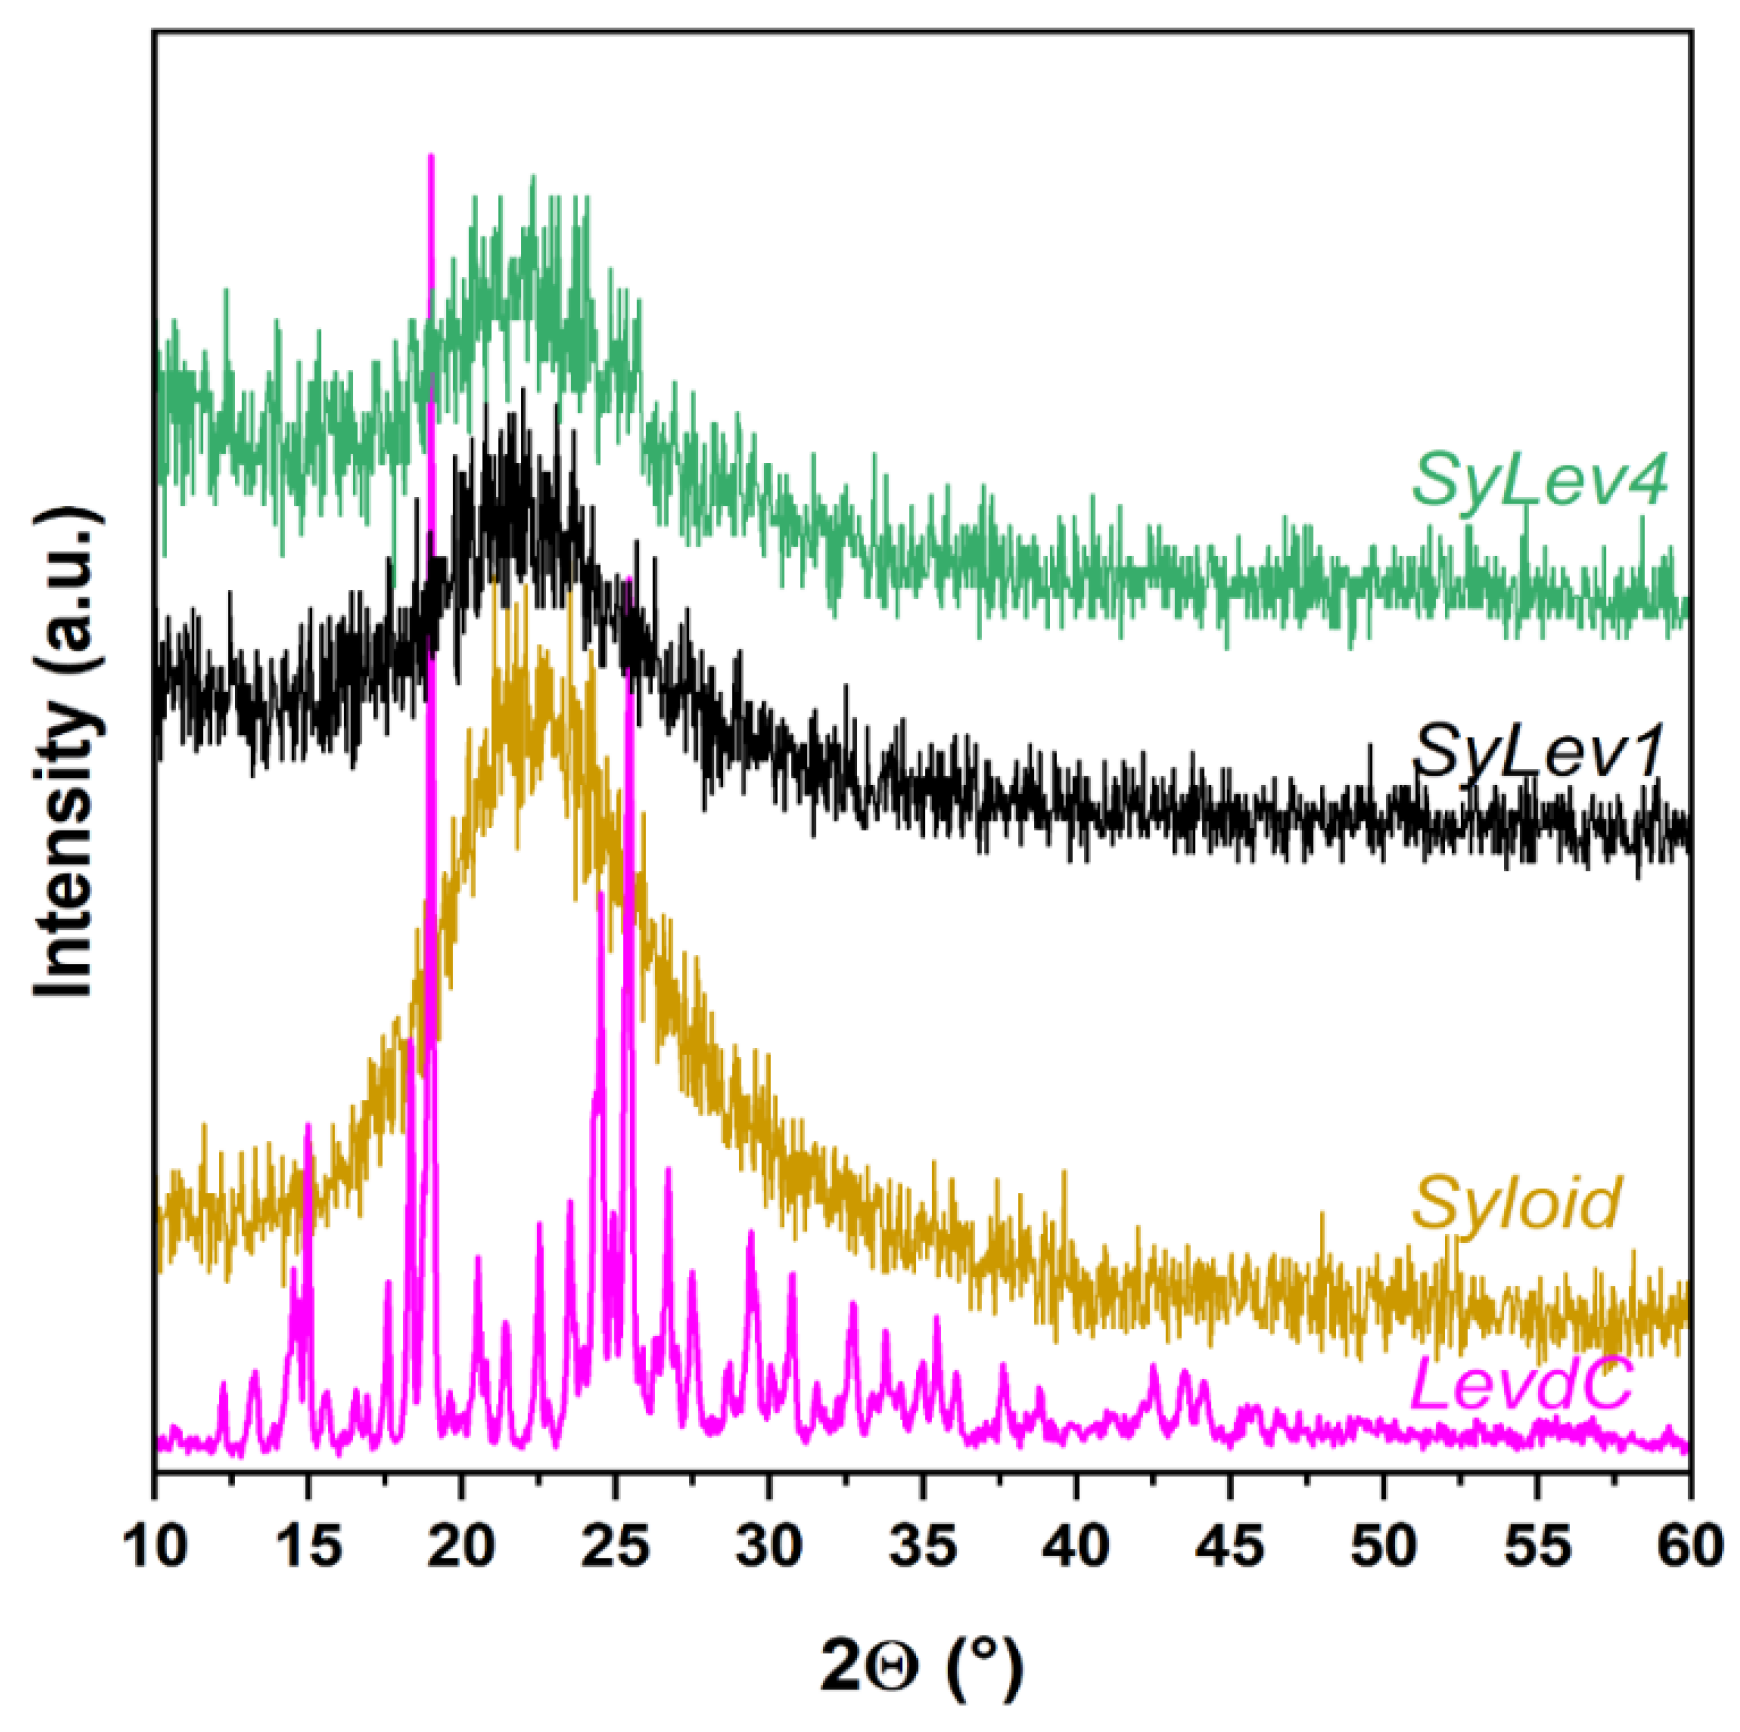
3.2. Immobilization of LevdC on Mesoporous Material

The absorption–desorption isotherms of LevdC-immobilized carrier and Syloid are shown in Figure 2. The decrease occurred in the specific surface area values of the mesoporous substrate after the immobilization of the drug allowed for calculating the coverage of the substrate surface with the drug [22]. It was assumed that the decrease in the SSA of the Syloid was due to the adsorption of drug molecules on the surface. Accordingly, the changes in SSA suggest that the active substance covered only ¼ of the surface of the Syloid carrier in the case of samples SyLev1 and SyLev4, while in the other samples, this was true to a lesser extent (Table 2). The maximum coverage of 24.5% was achieved after 2 h of mixing in aqueous medium. In a methanolic medium, the same coverage was reached only after 24 h of mixing, although the coverage values did not show considerable differences with respect to mixing time. It follows that adsorption was completed within the shortest time tested (2 h) irrespective of the medium used, and the 24.5% coverage seems to be an equilibrium in the given conditions. This result may be of a surprise considering that the binding efficiency of the active ingredient to the surface is better when using a less polar solvent [24,33] characterized by lower permittivity [34,35]. The permittivity of methanol (εr = 32.7) is approximately a third of that of water (εr = 80.1) [36], so, theoretically, better surface bonding was expected when using a methanol solution. In our case, the concentration of the solution (which was identical for tests) seemed to have a decisive influence on the adsorption efficiency.
The 24.5% coverage obtained with LevdC in a methanol medium is much higher than the 9% observed in a metronidazole fixation study using a Syloid carrier and made using similar experimental conditions and procedures [24]. The difference can be explained by the chemical structure and the molecular size. To achieve the highest possible drug coverage, the ratio of the pore diameter to the size of the drug molecule should theoretically be larger than 1. The pore accessibility for the drug molecule is adequate if the ratio of the pore to the drug molecule is above 3 [37]. The average pore size of Syloid is 11.3 nm in diameter, and the molecular size of LevdC is approximately 2 × 2 nm, while metronidazole is approx. 1 × 1.5 nm, which suggests that both can fit comfortably into the mesopores of Syloid. The ratio in the case of LevdC is approx. 5, while for metronidazole it is approx. 10. From the same number of molecules, LevdC can cover a larger surface area due to its larger size, which can also contribute to the greater affinity resulting from its chemical structure.
The XPS tests showed a small increase in the surface carbon content in all samples (samples SyLev1SyLev5) made with LevdC in aqueous and methanol media. However, no such increase in the nitrogen and chlorine content was detected up to a depth of 10 nm. Considering that the results obtained from XPS are typically characteristic only of the outermost surface of the analyzed sample, the results suggest that the active ingredient is not located on the outer surface but within the pores.
With XRD analysis, we monitored the changes in the immobilization process of LevdC on the Syloid carrier. Figure 3 shows a characteristic X-ray diffractogram of the samples made in both aqueous and methanolic medium. By XRD analysis, only amorphous peaks were detected for all samples, which belong to the Syloid carrier; the characteristic peaks of LevdC were not visible. Neither increasing the stirring time nor varying the applied solvent (water or methanol) resulted in detectable Levo content on the Syloid carrier by XRD.
Based on the IR spectra, a low amount of active substance is probable inside the pores of the carrier for sample SyLev2. However, the IR spectrum of sample SyLev1 with a higher active substance content is the same as that of pure Syloid. Given that, like XPS, IR measurements can only analyze the substances on the surface, it can be concluded that the active substance is located inside the Syloid pores. This is also supported by the XPS measurements. In the samples SyLev3, SyLev4, and SyLev5, prepared in a methanolic medium, the active ingredient is also probably inside the pores of the Syloid, which is also supported by the IR measurement results (Figure S3).
The morphology of the LevdC immobilized Syloid samples treated in water and methanol solvents was examined using SEM. According to the microscopic observations, the samples have an irregular shape and a wide range of grain sizes. Highly agglomerated small particles (1–2 µm) are characteristic of the samples in addition to the largest particles (5–6 µm), which belong to the MSM carrier (Figure S4). Regarding the morphology changes in MSM after the immobilization of LevdC, no notable differences were observed between the coated Syloid particles and the reference. LevdC could not be distinctly identified on the surface of Syloid particles even under high magnification, as illustrated in Figure 4. Both the BET and the XPS analysis, however, supported that LevdC is probably positioned mainly in the pores of the carriers and, to a lesser extent, on the surface as well, since the SSA decreased obviously in the LevdC-treated samples compared with the untreated, pure Syloid.
The immobilization of LevdC on Syloid in aqueous and methanol media shows that the active substance occupied about 20–25% of the mesopores, which is supported by nitrogen adsorption tests and IR measurements. A maximum of 24.5% surface coverage was available in both media, which decreased over time due to the solubility of LevdC and weak binding.

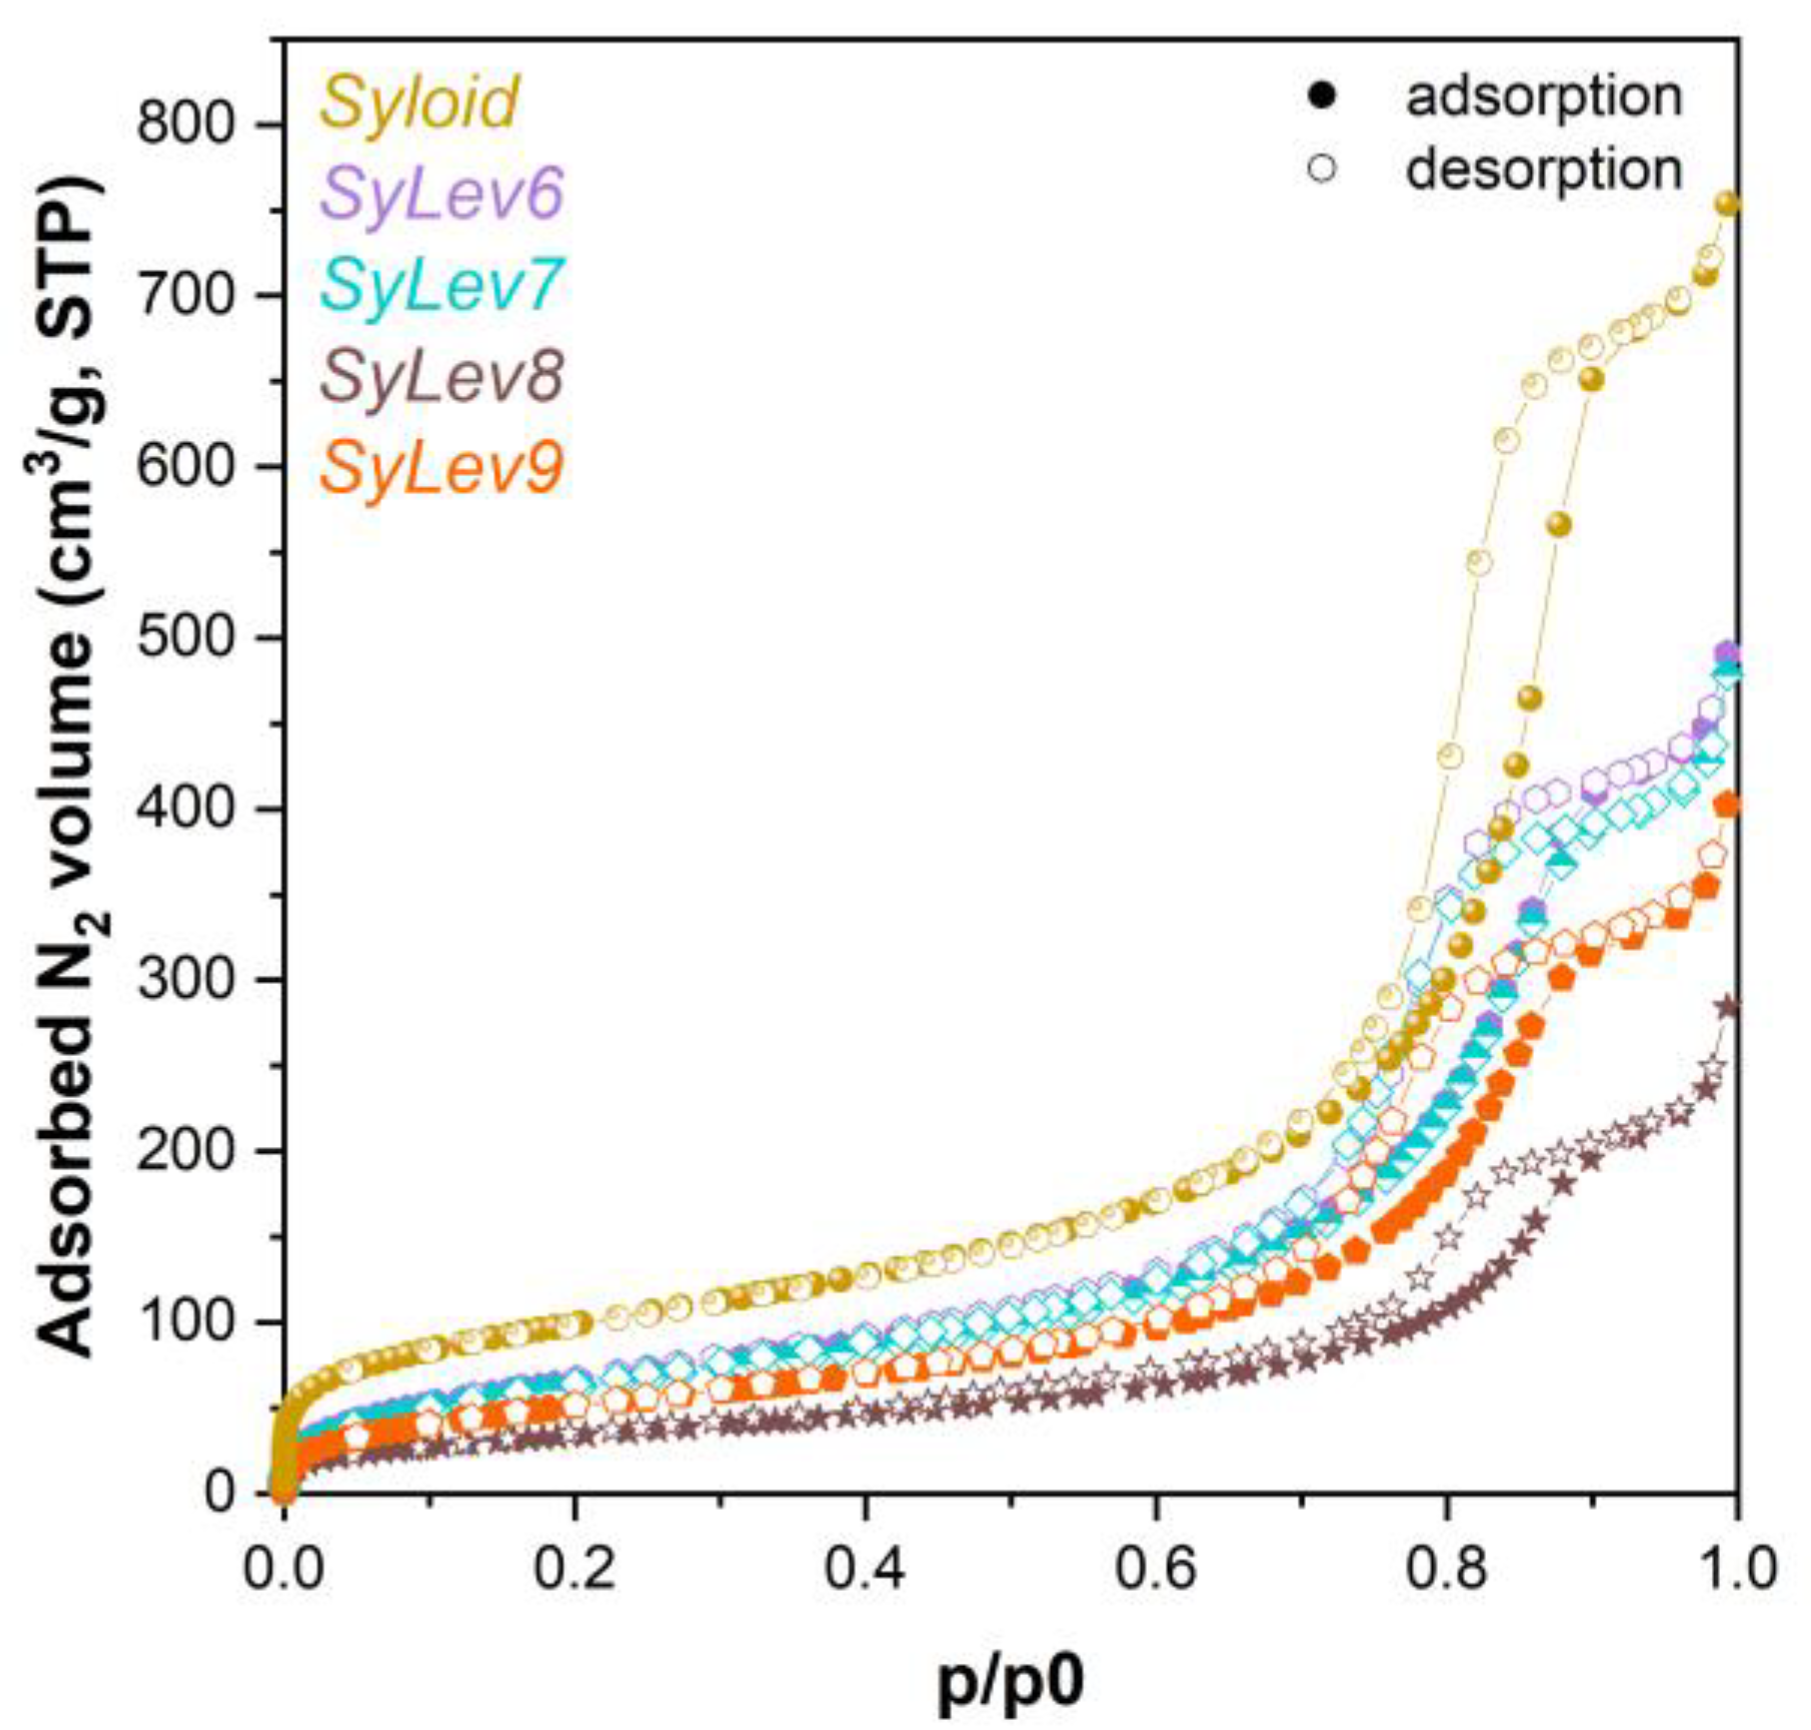
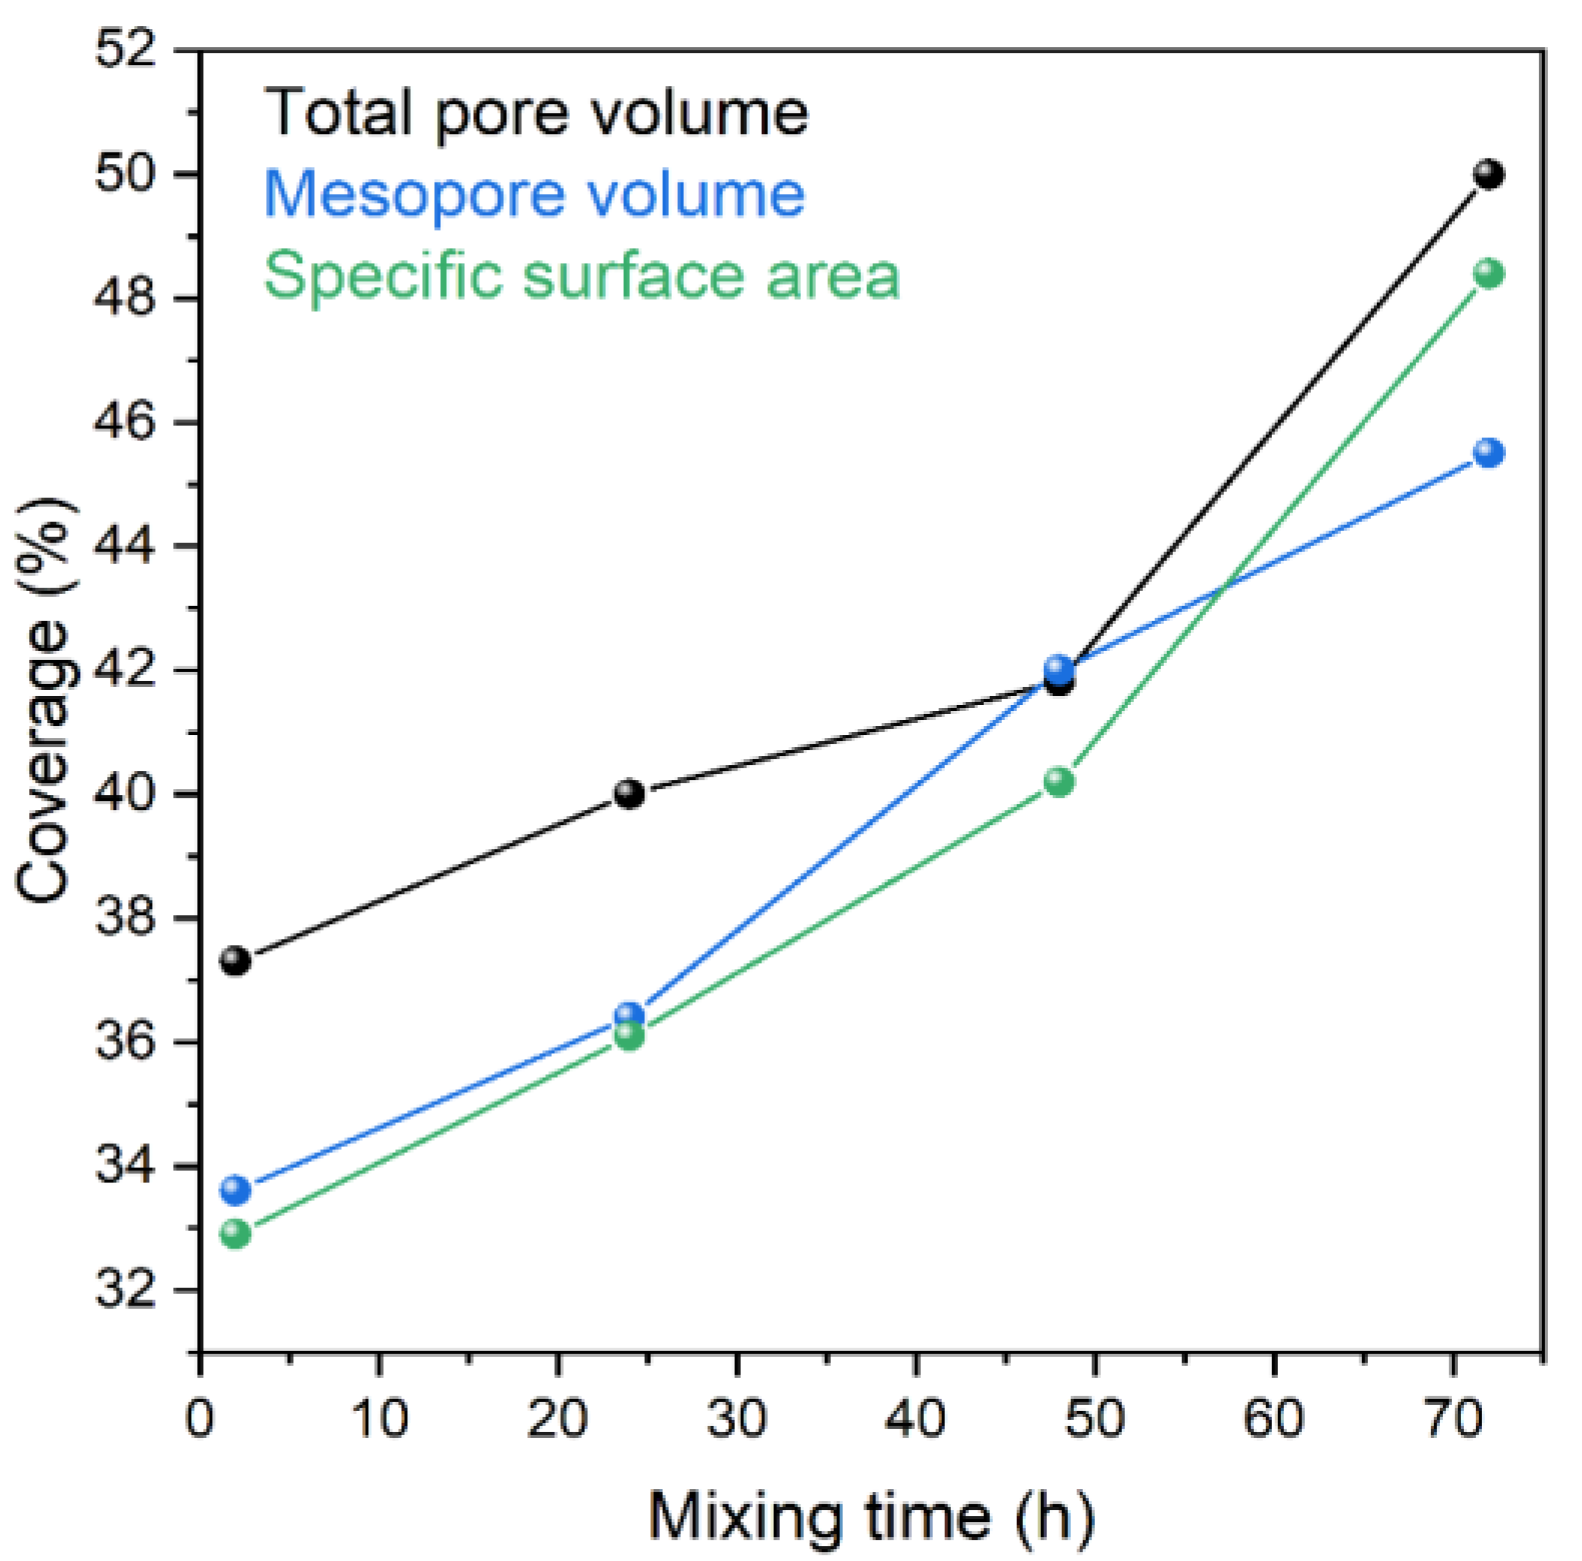
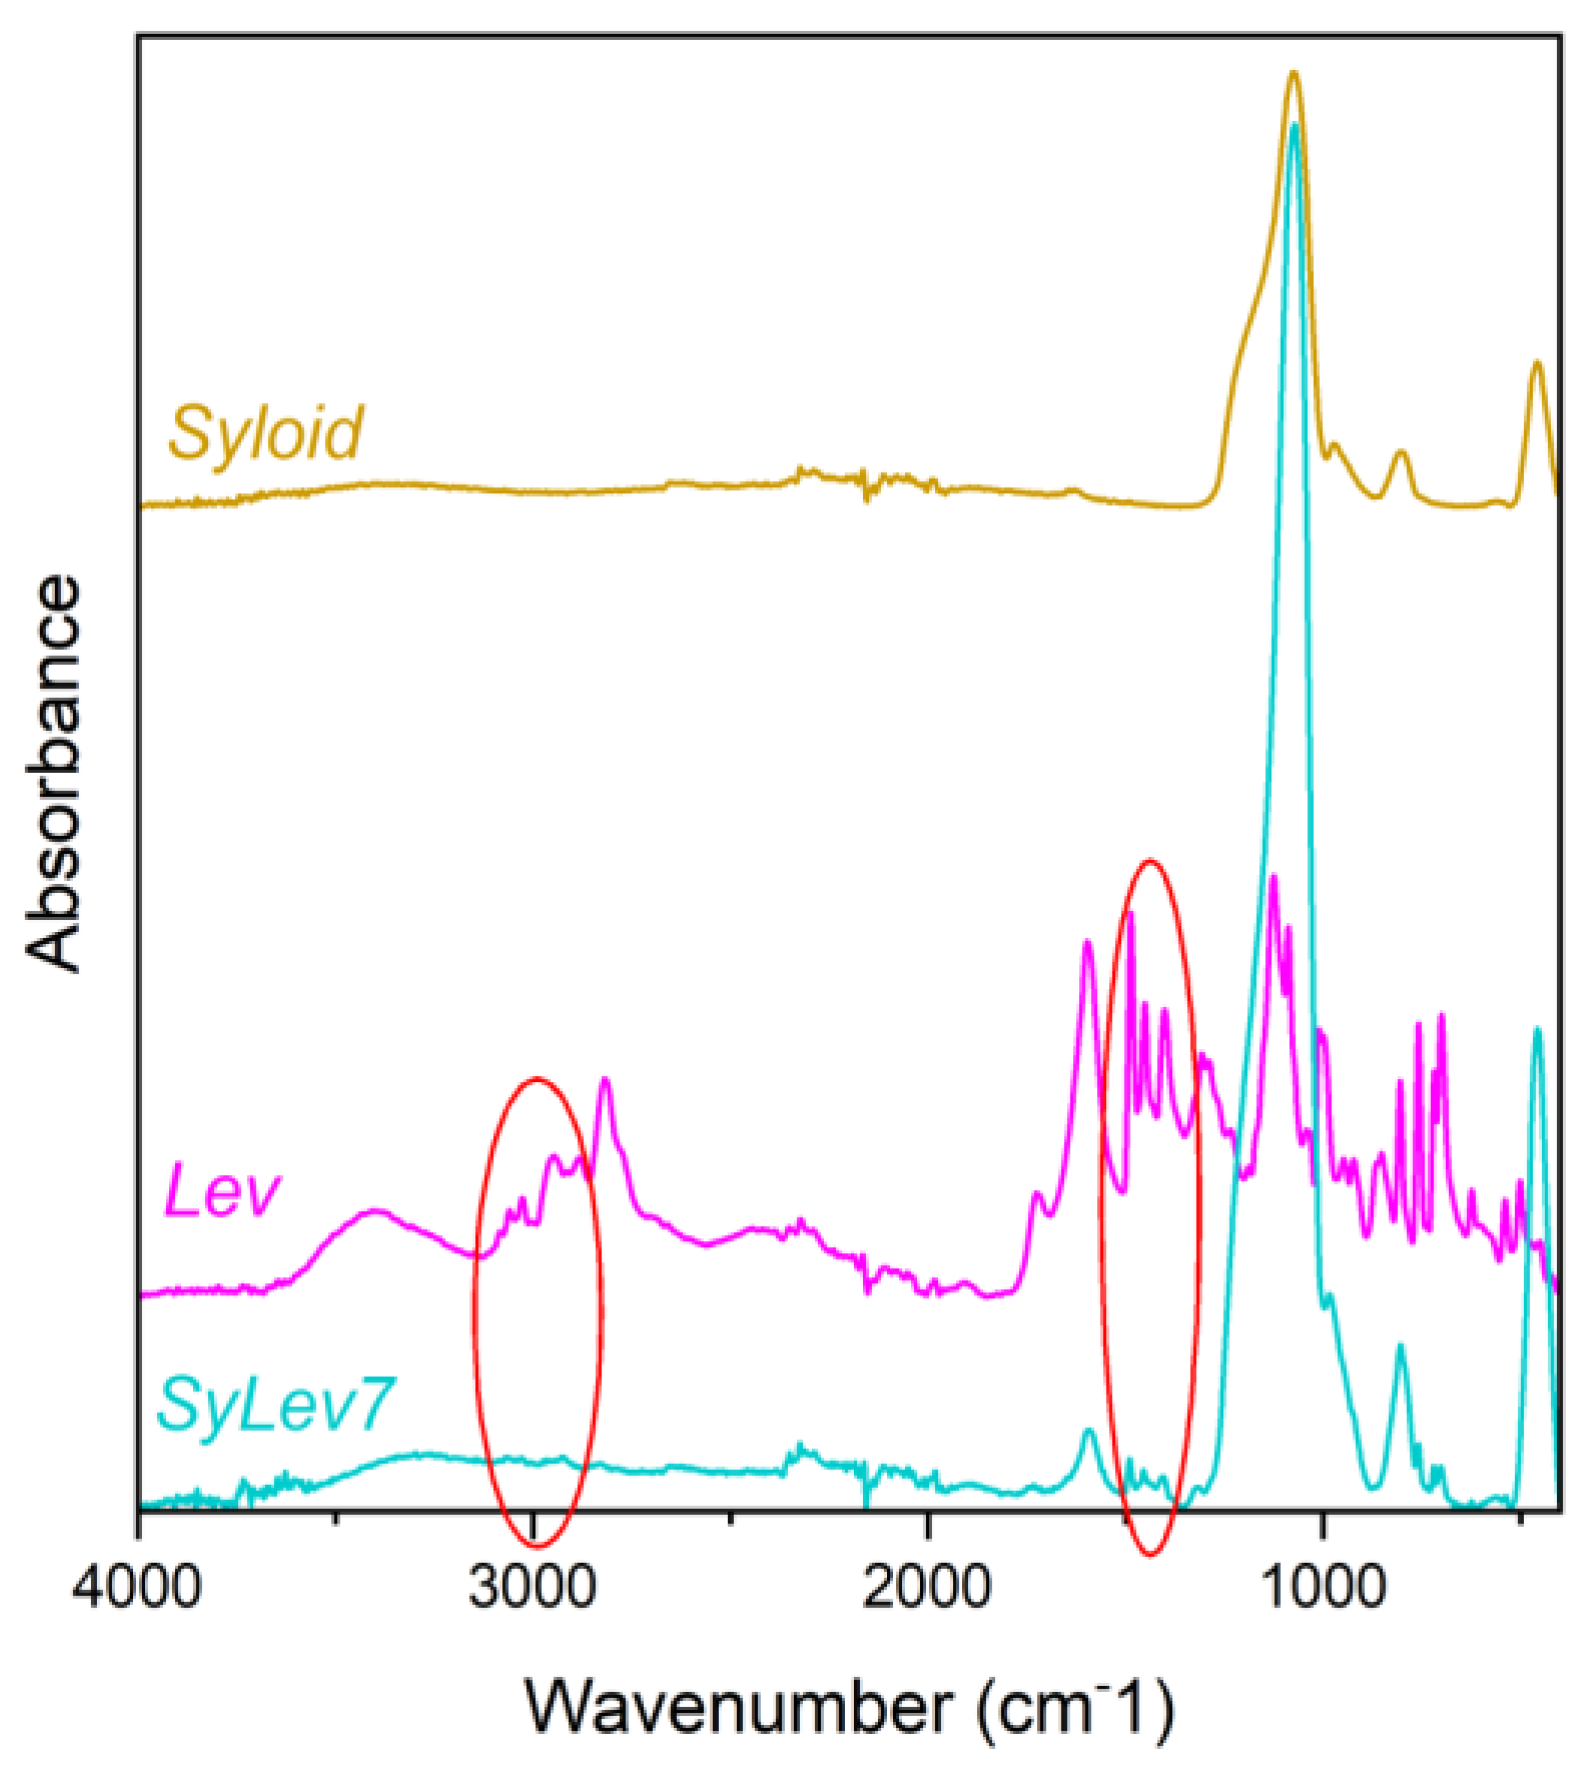
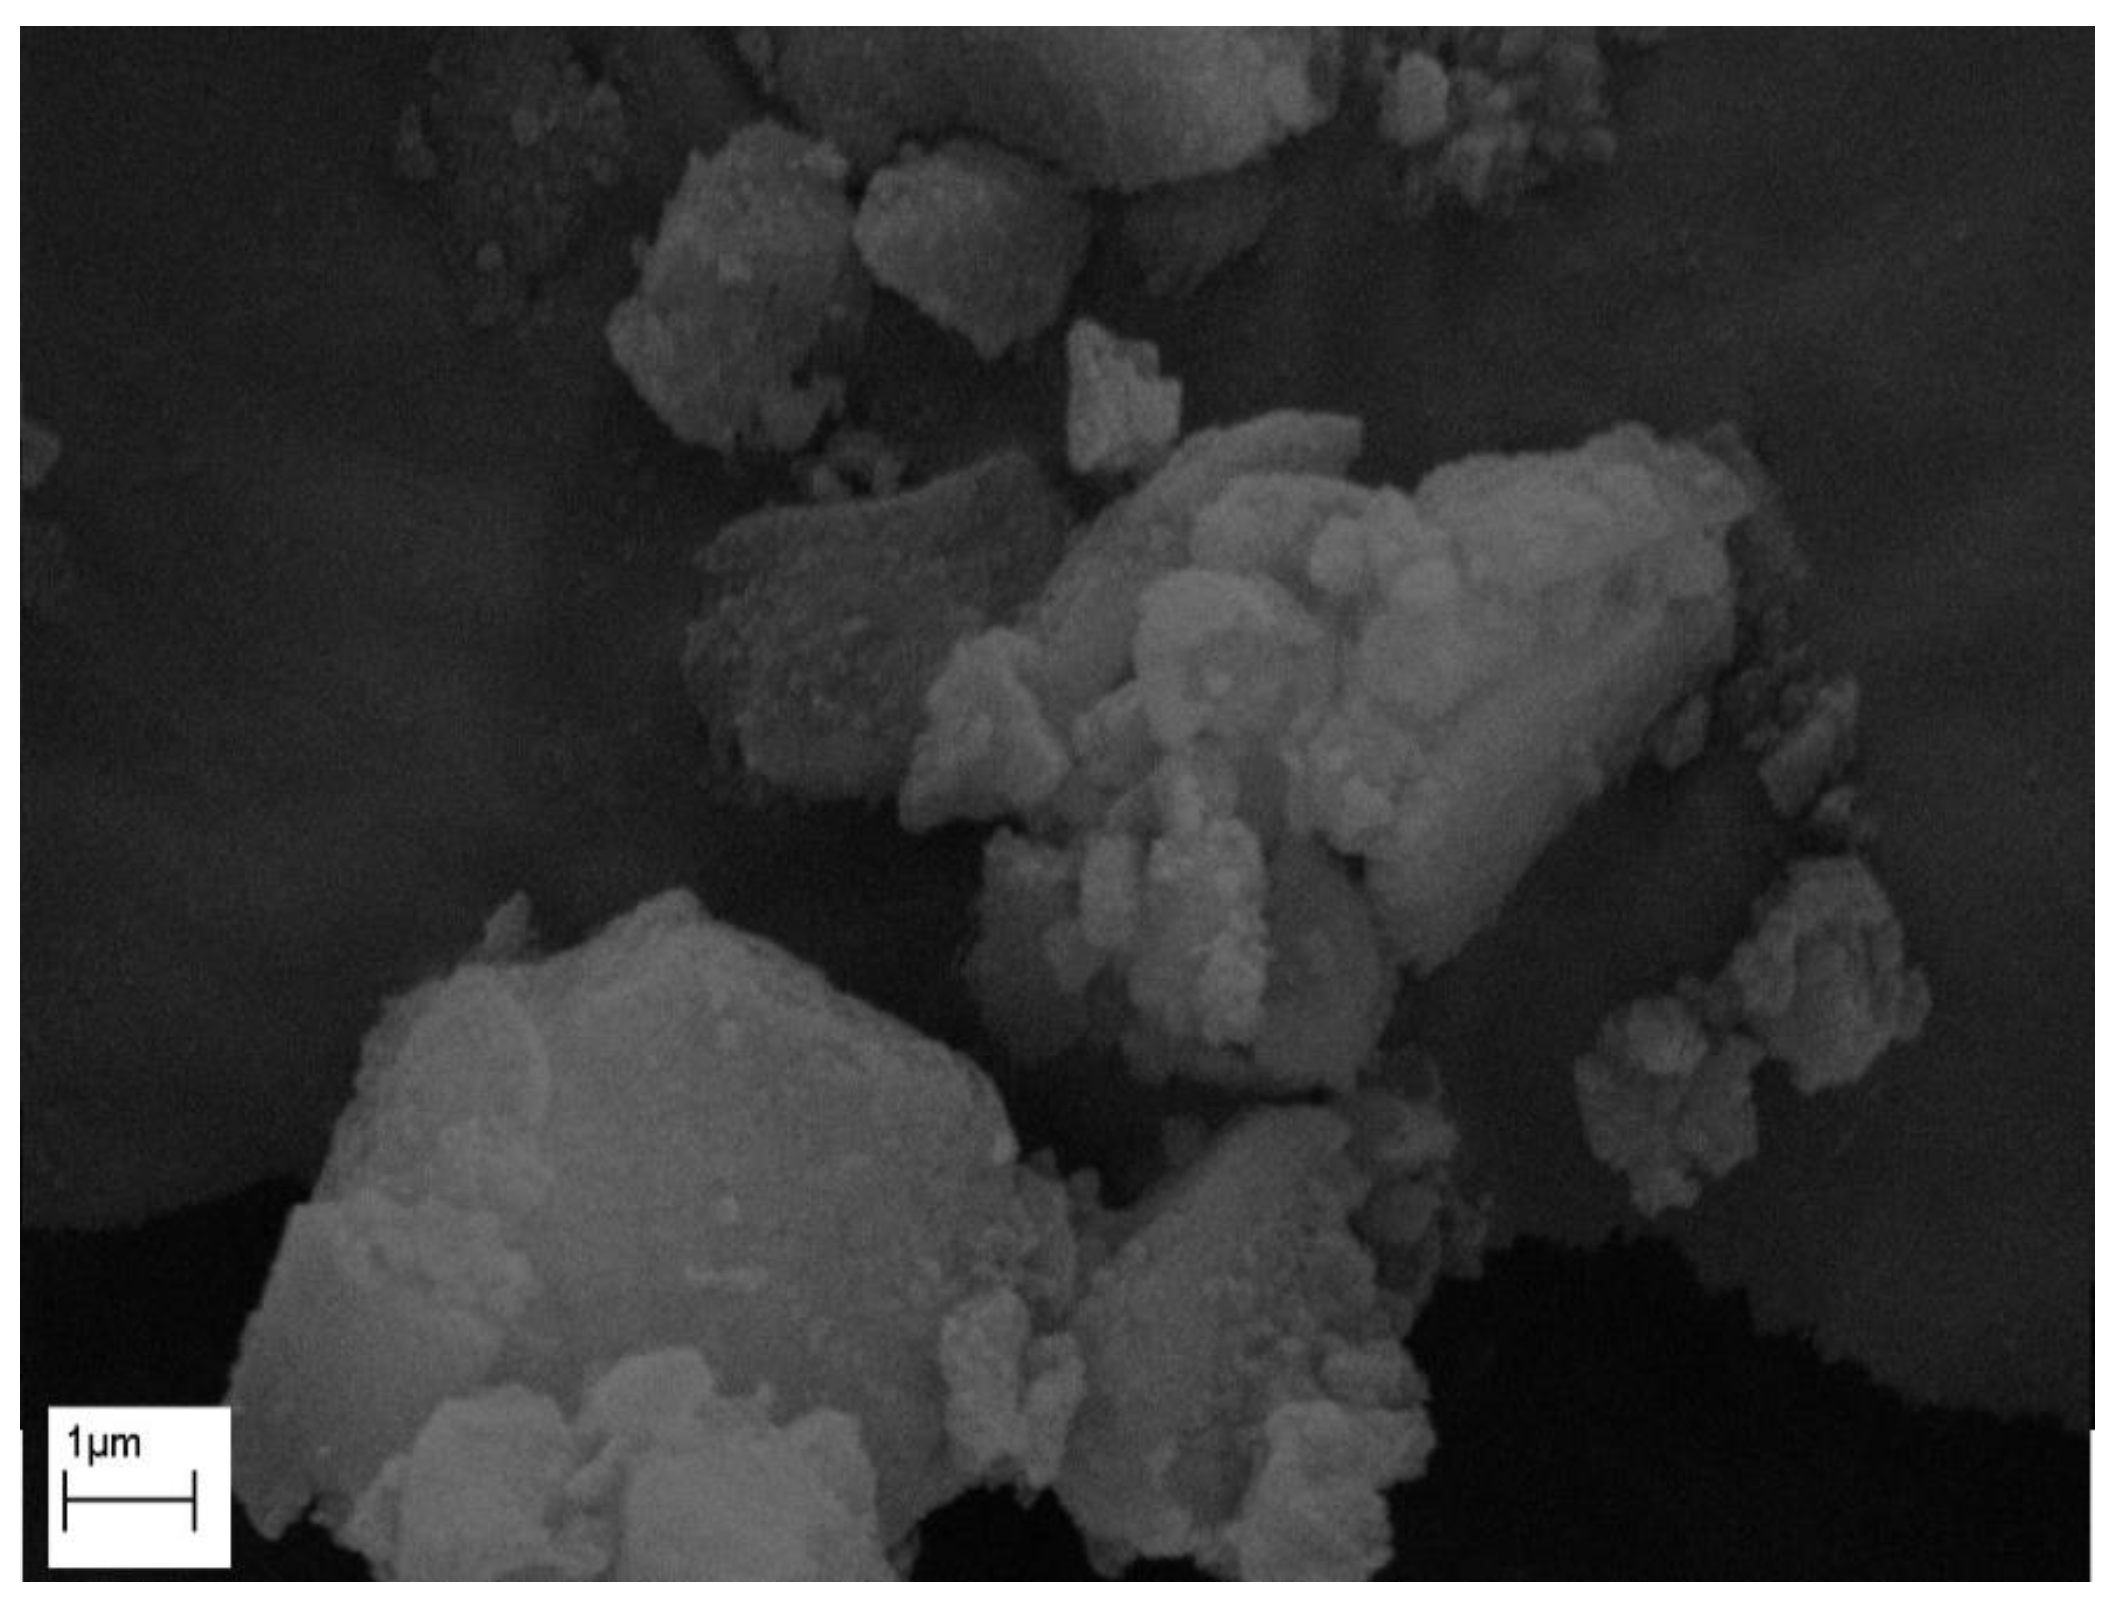
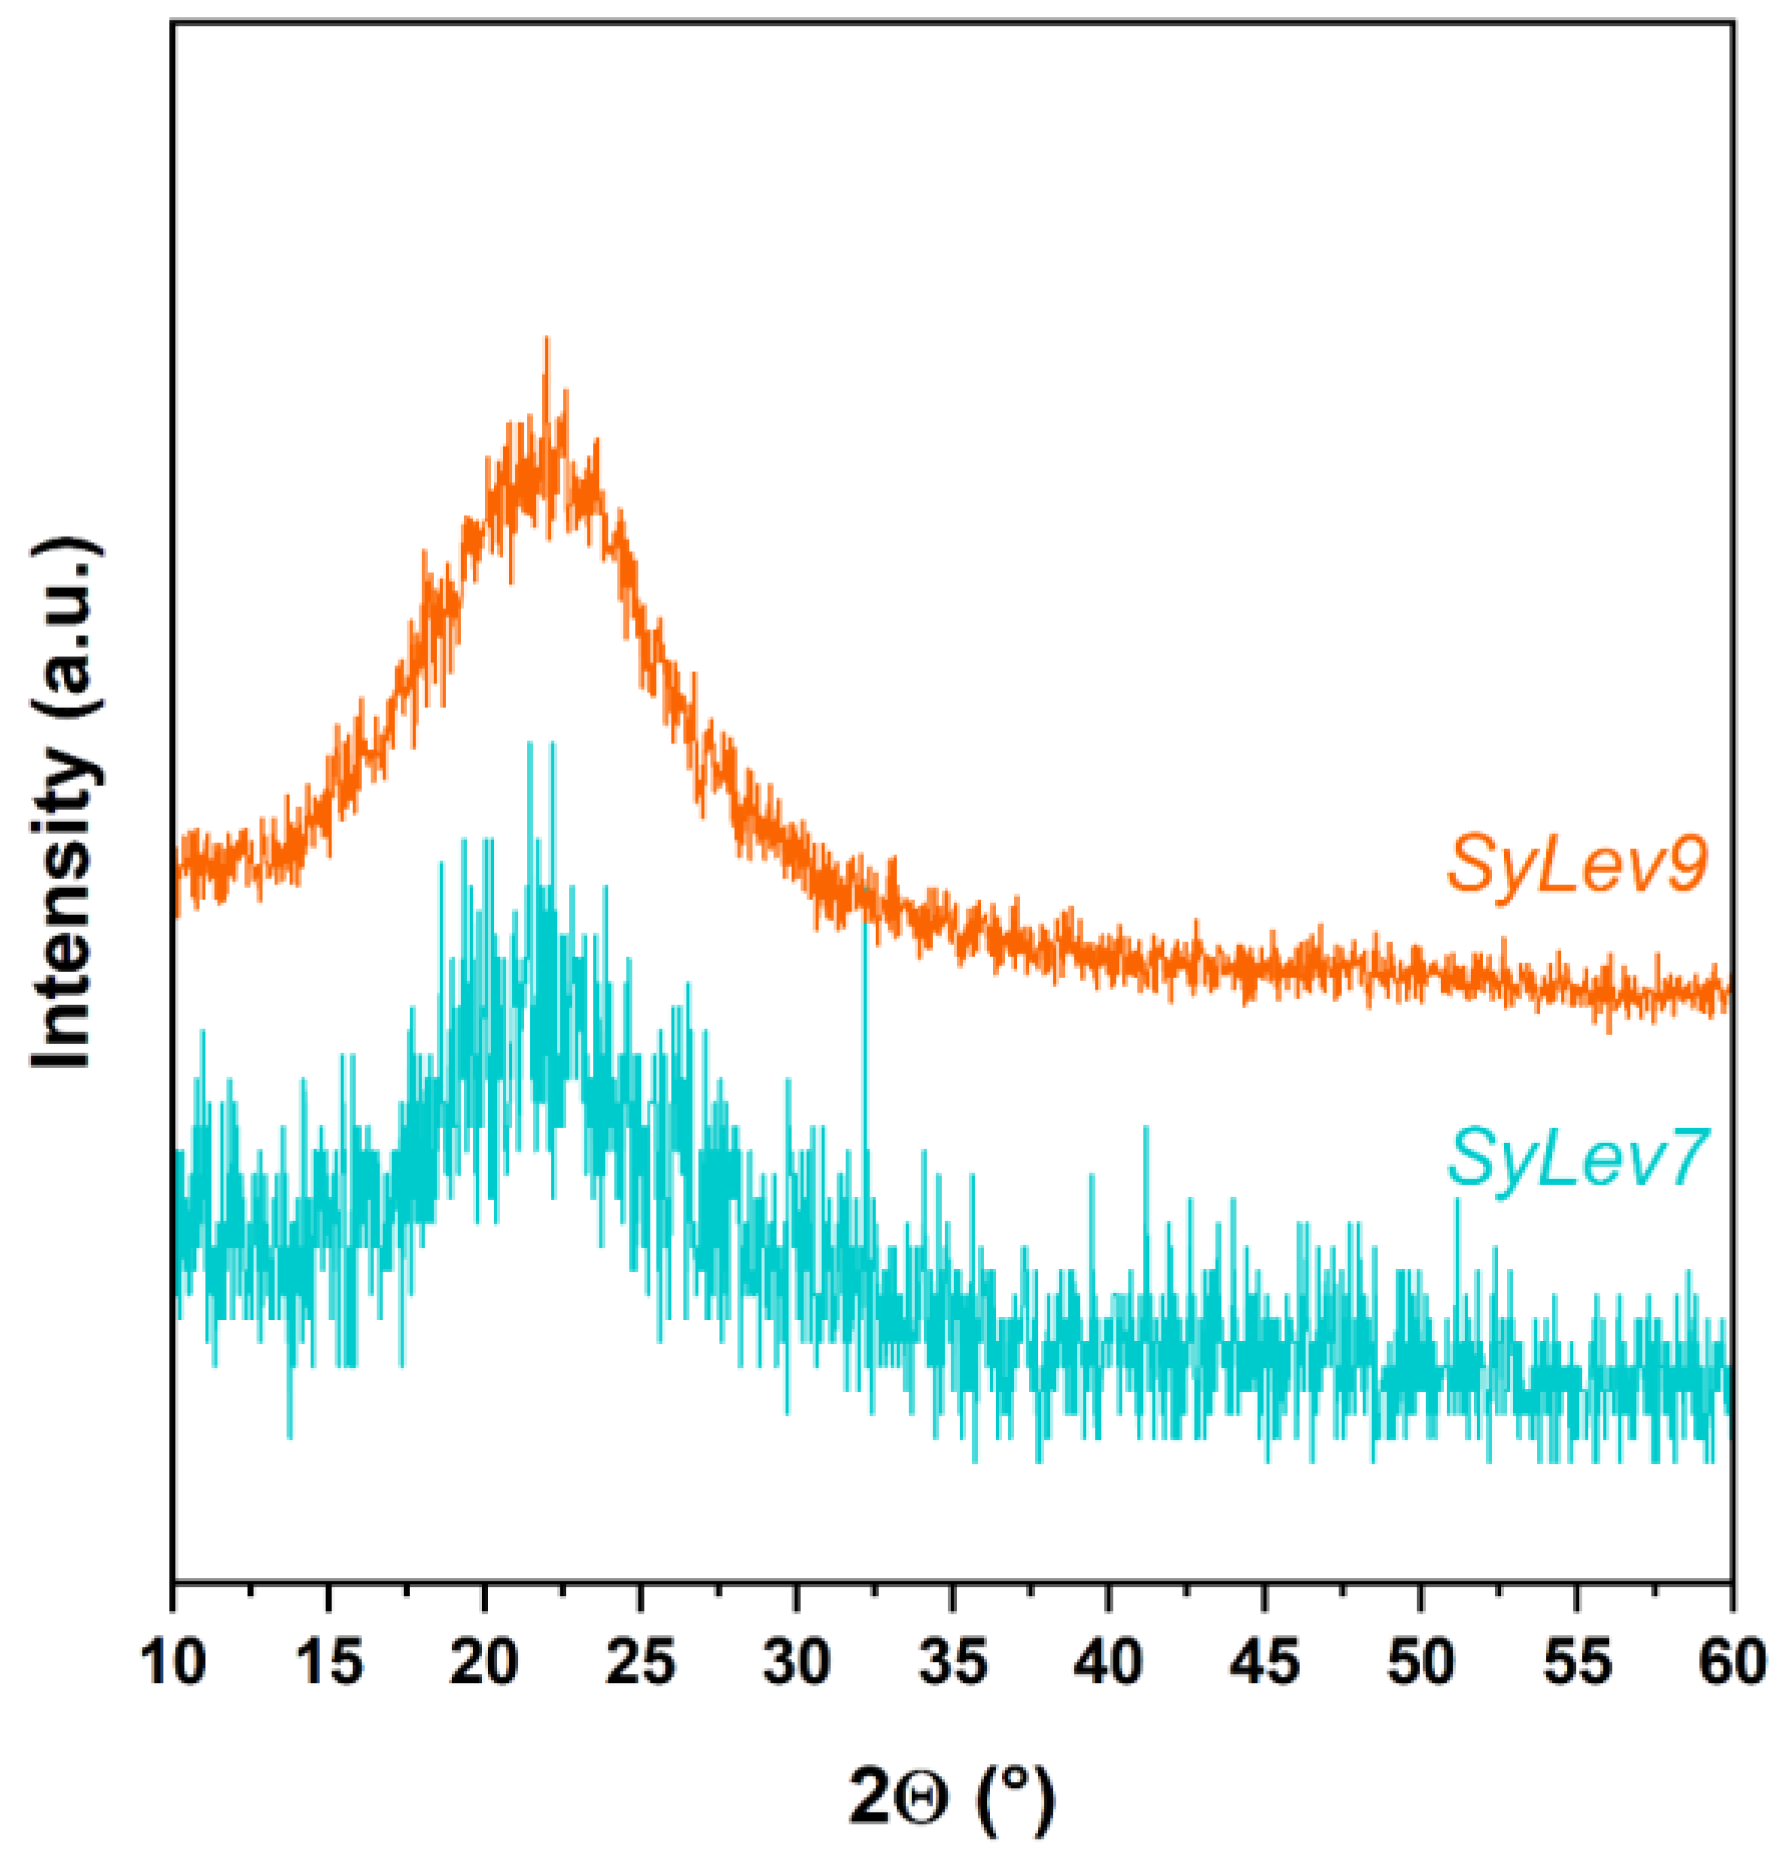
3.3. Immobilization of Levb on Mesoporous Material

Regarding the obtained results of the LevdC–Syloid system, the highest coverage rate was 24.5% on Syloid. Therefore, in further experiments, the Levb–Syloid system was studied using DCM solvent and increasing the immobilization time from 2 h to 72 h. Since Levb is soluble in DCM and LevdC is almost insoluble [38], only Levb is present in the organic solvent.
Based on the nitrogen adsorption isotherms (Figure 5), the coverage of the carrier containing the active ingredient showed a maximum of 65.5% for sample SyLev8 (mixing for 48 h), while it decreased for sample SyLev9 after 72 h of mixing. The SSA of the silicon dioxide support is the smallest in sample SyLev8, which may mean the coverage with the largest active ingredient, while in the case of the other samples, this value is around 33–48% (Table 3). Based on the results, the immobilization of the active ingredient Levo in free base form by mixing in DCM solvent with a Syloid support provided much greater surface coverage than in the case of immobilization in the dihydrochloride form with water or methanol. The 2.5-fold increase in the binding efficiency of Levb compared to LevdC is obviously facilitated by DCM with low permittivity (εr = 8.93) [34,35,36], which is almost 10 times smaller than that of water (εr = 80.1) and 3.5 times smaller than that of methanol (εr = 32.7). This low permittivity supports the previous finding that binding efficiency can be increased by using a less polar solvent. Thus, by using DCM with a lower permittivity, which dissolves Levb better than water, a larger coverage can be achieved, in principle.
The XPS investigation clearly proved the presence of Levo on the surface of all immobilized samples. Typical X-ray photoelectron spectra of the Levo adsorbed on the Syloid are shown in Figure S5. The chemical states detected on the adsorbed samples are the same as those measured on the pure levocetirizine. Like the pure sample, both kinds of nitrogen and chlorine can be identified. We calculated the surface composition of the samples after immobilization (Table 4) using the “infinitely thick homogeneous sample” model. This approach only gives raw information: the samples are not homogeneous, and the presence of silica distorts the results. Raw results can be corrected by splitting the O1s intensity belonging to the adsorbed molecule and silica and fitting data to the theoretical composition of Levo. The corrected compositions are closely aligned with both the expected theoretical values and the measured results. The composition of the silica calculated in this way is also plausible, a typical partially OH-covered SiO2 surface (Table 4).
The following model was supposed to get the adsorbed amount of Levo: the spherical silica is covered by a layer of Levo, as illustrated in the Figure 6 inset. The thickness of Levo layers was calculated by this Layers-on-Sphere model for all samples. The layer thickness values are shown in Figure 6 as the function of the preparation (mixing) time. Evidently, the Levo does not form a uniform and coherent layer on the surface, but the thickness of the layer can help approximate the adsorbed quantity. The trend of increasing the layer thickness with mixing time is in good agreement with the results of adsorption measurements, as illustrated in Figure 7.
The FTIR analysis provides complementary information about the immobilization of the drug (Figure S6). In Syloid, the SiO44− tetrahedrons form long Si–O–Si chains, typically resulting in bands at 1074 cm−1 and 804 cm−1 as asymmetric and symmetric stretches, respectively (Figure 8). The strong band at 464 cm−1 is attributed to a bending vibration of the Si–O–Si chain. A silica surface usually reacts with the humidity of air to form Si–OH bonds, and this stretch gives a band at 973 cm−1 here. Moreover, there are two broader bands with lower intensity at 3350 cm−1 and 1630 cm−1, which can be attributed to adsorbed water, as inorganic materials always contain it. The IR spectrum of Levo is richer than that of Syloid owing to the numerous functional groups. Therefore, the additional peaks that cannot be seen on the carrier but are present in the immobilized sample are attributed to Levo, providing evidence of immobilization of the drug.
Based on the DSC measurement results (Figure S7), variable amounts of physically bound water could be detected in all samples. This is confirmed by the variable amount of mass losses (determined between 30 and 125 °C, hot presented here) and the intense absorption bands in the IR spectrum around 3400 cm−1 and 1640 cm−1. The highest amount of moisture (18.3 m/m%) was contained by the sample SyLev8, which also explains the broad endotherm noticeable on its corresponding heat flow curve (Figure S7). On the heat flow curve of the other three samples (SyLev6, SyLev7, and SyLev9) a small and broad endotherm is visible, with a peak maximum in the range of 72–86 °C, corresponding to the evaporation of water, while the other endotherm, at higher temperatures, described above, is noticeable only in the case of sample SyLev7. Based on the IR recordings, the presence of the active ingredient could be detected in each sample. The fact that the melting endotherm of the active ingredient is not visible in all cases can be explained by the fact that in such cases, a small amount of the active ingredient may be present only on the surface of the Syloid and possibly in amorphous form.
The morphologies of the Levb on Syloid were studied by SEM, and are shown in Figure S8 for all samples and Figure 9 for sample SyLev8. The coverage of Levb on the surface of the Syloid grains is not obvious on the micrographs, regardless of the increasing stirring time. However, a lot of particles are visible on and between Syloid grains. Like the micrographs presented above for the LevdC–Syloid system (Figure 4), we assumed that these small particles belong to Levb, supporting the results of the nitrogen absorption, IR, and XPS tests.
The XRD spectra of the samples with Levb made with different stirring times (Figure 10) are similar to those of the Syloid carrier. No characteristic peaks of crystalline Levo appear in the diffractograms of the samples, suggesting that the drug molecules did not form free-standing aggregates.

3.4. In Vitro Levo Releasing

After the morphological and physicochemical tests of Levb attached to Syloid, we determined the active ingredient content of sample SyLev8, and then investigated the releasing of Levb from the silica, which was followed by the UV-VIS spectrophotometric method [24]. The active substance content of the sample was 23.2%. The sample SyLev8 was first mixed in distilled water at an ambient condition. The releasing test shows that a third (36.9%) of the active substance released very quickly, within 5 min. After that, a gradual dissolution could be observed until the 120th min., when it reached 85% (Figure 11A). The dissolution rate apparently gradually slowed down from 345 mg min−1 to approx. up to 1 mg min−1.
The rapid releasing of Levo from the silica is partly due to the very good solubility of the active ingredient, which can be seen in Figure 11A. The dissolution of Levb was almost complete in 15 min. The dissolution also depends on the experimental conditions; the process of dissolution is faster in water than, e.g., in an acid solution [39].
In the releasing experiment at a higher temperature, such as the human body’s, of 37 °C, the dissolution of Levb was faster, exceeding 50% in 5 min and reaching 95% in 120 min (Figure 11B). The initial dissolution rate was also much higher (525 mg min−1) than at room temperature. The dissolution of Levb was very quick, 99.5% in 5 min; therefore, this is not depicted in Figure 11B.
The active substance release is also influenced by the applied DDS [40]. Depending on the DDS, the diffusion rate of Levo is slowed [41]. Thus, the extended Levo active substance release obtained in our releasing experiment has already been described by several people in the literature. The Levo dissolution–active agent release is slower from the Levo–chitosan nanoparticle [42], as well as from the Levo–polymer system; however, its rate depends on the polymer used [39].

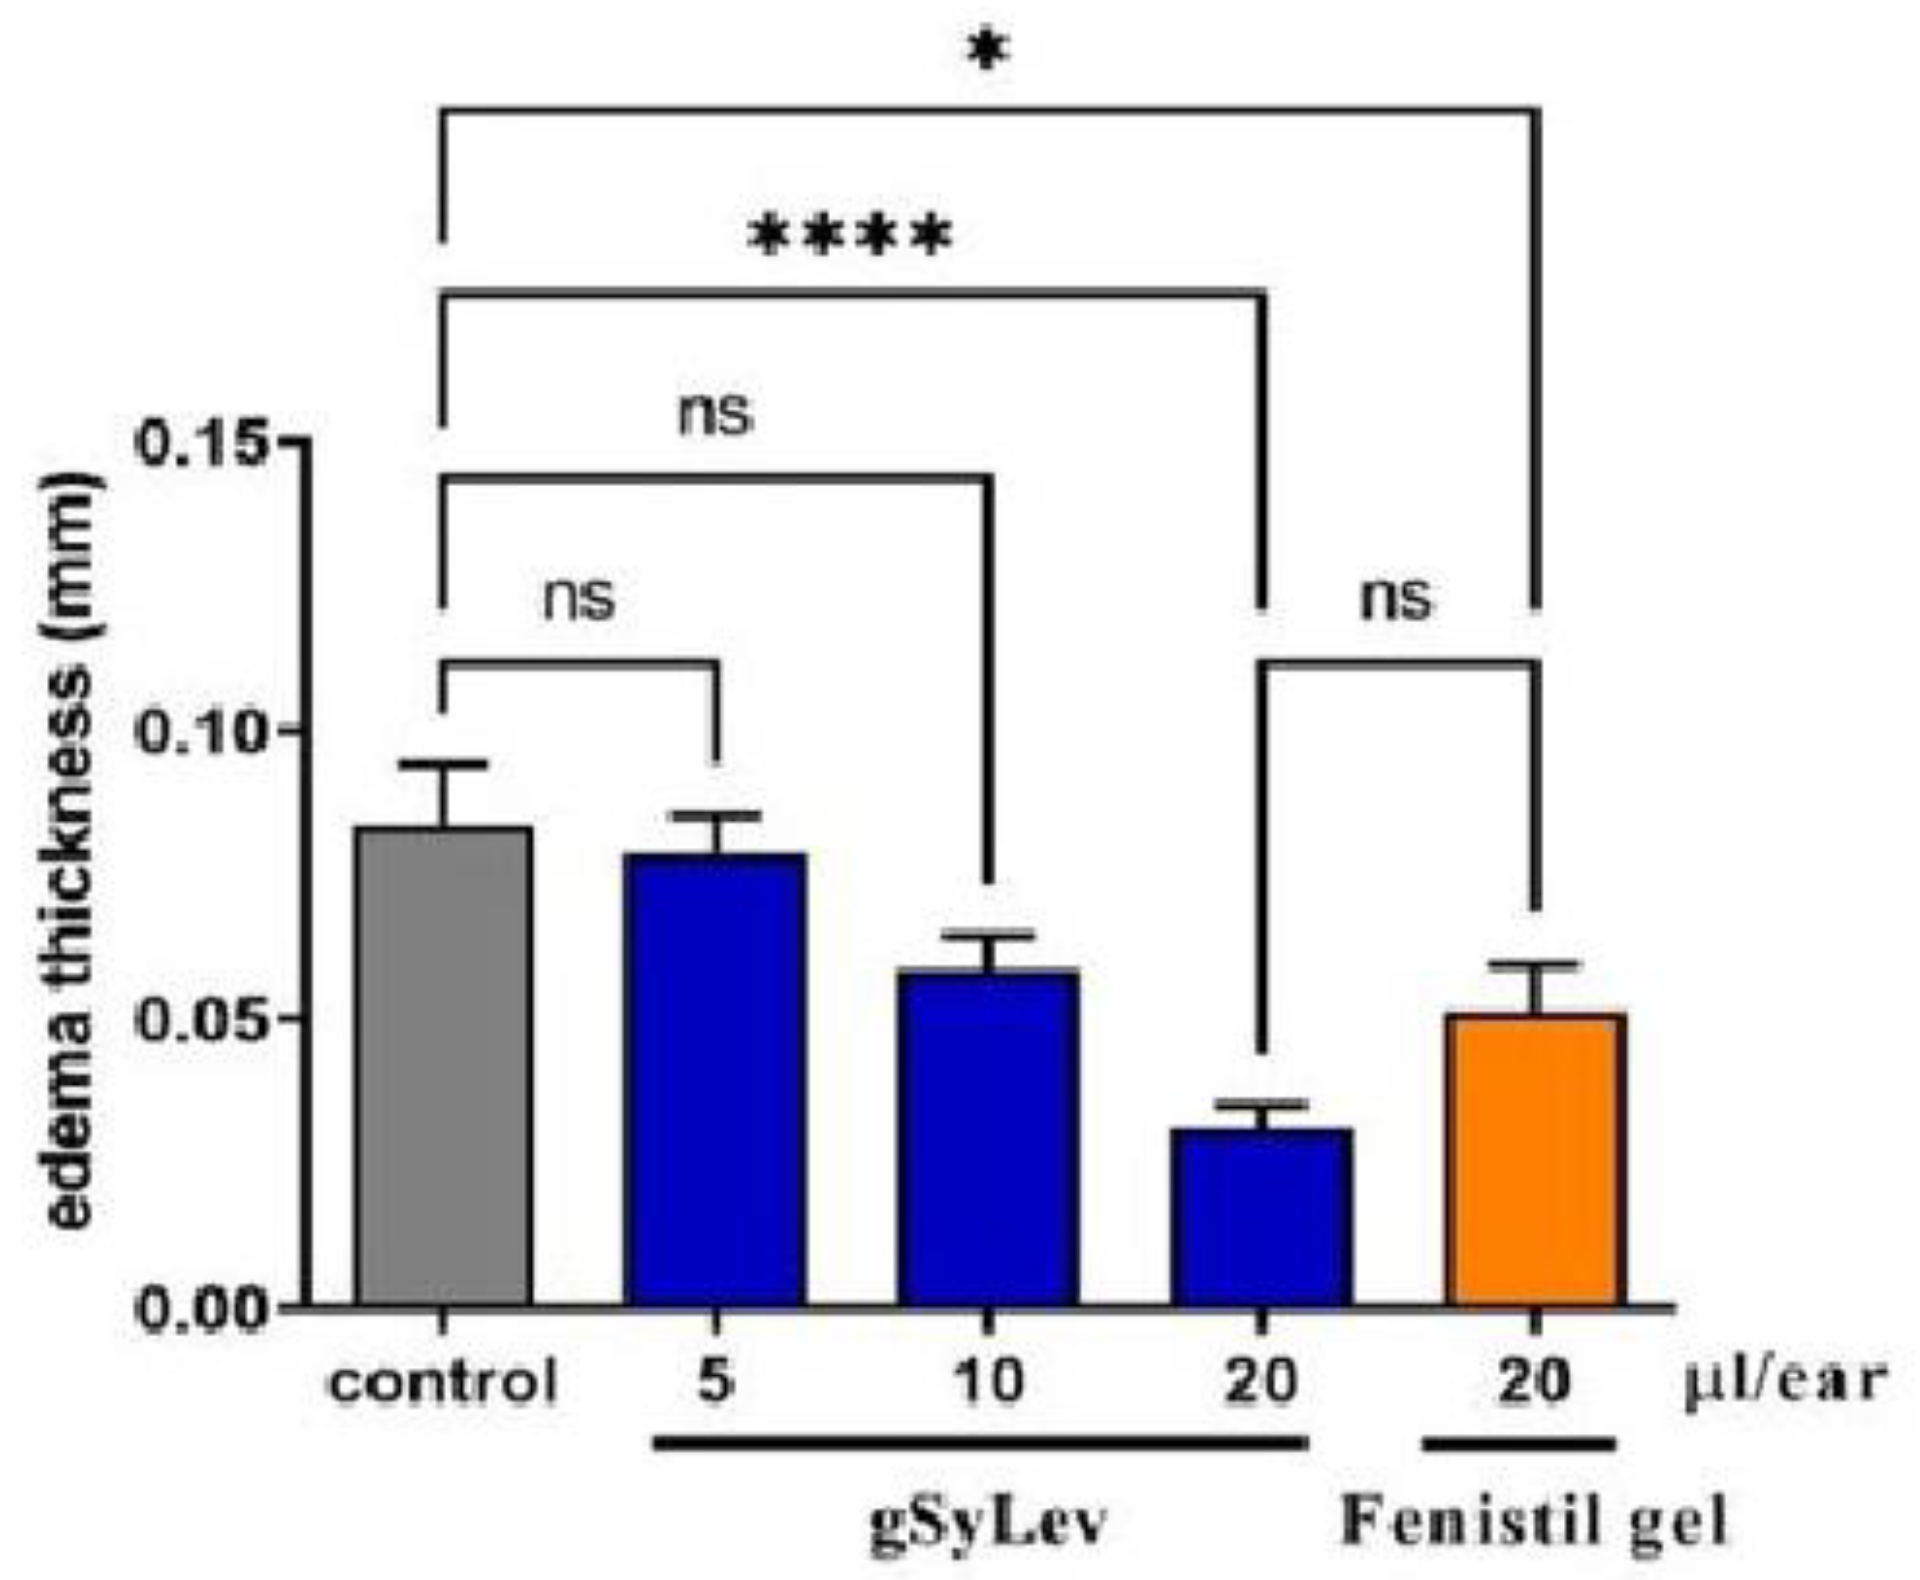
3.5. In Vivo Effectiveness of Gel Containing Levb Immobilized on Silica

Croton oil-induced ear inflammation in the ears of mice was applied to study the anti-inflammatory effect of gel (gSyLev) containing Levb immobilized on a Syloid carrier (sample SyLev8) compared to the control and reference Fenistil gel. Using croton oil on the ears of the mice leads to edema, which can be successfully inhibited by Levo-containing preparations. The effects of the gels and doses used are illustrated in Figure 12. The introduction of croton oil induced the swelling of ears for control mice, which was inhibited significantly (p < 0.05) by 20 μL of the reference Fenistil gel. The gel containing sample SyLev8 showed a dose-dependent anti-inflammatory effect; it reduced the thickness of the ear proportionally to the doses of 5, 10 and 20 µL. A substantial difference compared to the control was observed with the dose of 20 µL. Half a dose of the Levo-containing gel (10 μL) showed roughly the same effect as Fenistil gel (20 μL). Furthermore, in the application of the same dose, the effect of the Levo-containing gel was approximately twice that of the reference Fenistil gel since the ear edema, and thus, the ear thickness, was reduced to a much greater extent compared to the Fenistil-treated animals.
Mirankó and her coworkers produced spray-dried Levo dihydrochloride with HPMC polymer and prepared a gel from it. In their in vivo experiment using the same croton oil-induced ear inflammation mouse model, they reached similar results to ours [43]. However, their gel contained a penetration-enhancing substance (10%) and a higher concentration (10%) of the active ingredient than our gel with 5% active ingredient. Therefore, considering the concentration differences, the gel preparation with a lower concentration produced by us could be more favorable despite the similar effect, as it is expected that smaller side effects will occur.

4. Conclusions

Although the immobilization of LevdC on Syloid was successful, only 24.5% coverage was achieved in both aqueous and methanol media. In contrast, with the fixation of the free base of Levo on a Syloid support in a DCM solution with two days of mixing, a surface coverage of 65.5% can be achieved with an active substance content of 23.2% by weight. The binding of the active ingredient to the MSM carrier was clearly demonstrated by XPS and IR tests. The in vitro release experiments in an aqueous solution showed that a significant part of the active substance was released quickly. Then, depending on the conditions used, the release was continuous. The release of Levb from the carrier occurs more slowly than the dissolution of the starting active ingredient. This slower process is influenced by the diffusion of Levb from the pores, which at the same time ensures the extended, longer-lasting effect of the active ingredient. In the in vivo croton oil-induced ear inflammation mouse experiment, the SyLevb-containing gel showed a similar inflammation-reducing effect at half the dose compared to the reference gel.

Supplementary Materials

The following supporting information can be downloaded at https://www.mdpi.com/article/10.3390/app14209605/s1, Figure S1: Reaction for the production of levocetirizine free base; Figure S2: Levocetirizine base containing Syloid (sample SyLevb, A) and gel containing levocetirizine base on Syloid (gSyLev, B); Figure S3: IR spectra of samples SyLev1, SyLev2, SyLev3, SyLev4, and SyLev5, as well as Syloid and levocetirizine; Figure S4: Scanning electron microscopic images of samples SyLev1 (A), SyLev2 (B), SyLev3 (C), SyLev4 (D), and SyLev5 (E); Figure S5: Typical X-ray photoelectron spectra of levocetirizine adsorbed on silica (sample SyLev9). N1s and C1s photoelectron lines are decomposed to various chemical states (C–X represents carbons connected to heteroatoms (O, N, Cl), except carboxyl); Figure S6: IR spectra of samples SyLev6, SyLev7, SyLev8, and SyLev9, as well as Syloid and levocetirizine; Figure S7: DSC trace of samples containing levocetirizine free base on Syloid carrier (samples SyLev6–SyLev9); Figure S8: Scanning electron microscopic images of samples SyLev6 (A) SyLev7 (B), SyLev8 (C), and SyLev9 (D); Table S1: Surface composition (atomic %) of the pure levocetirizine samples (corrected for carbonaceous contamination). C-X represents the carbon atoms connected to heteroatoms, except the COO group.

Author Contributions

Conceptualization, K.S. and Z.K.; methodology, K.S. and Z.M.; formal analysis, K.S., S.K., K.M., E.B., M.M. (Mirella Mirankó) and L.T.; investigation, K.S.; animal expert, A.B.S.-N.; writing—original draft preparation, K.S.; writing—review and editing, K.S., S.K., Z.M., M.M. (Miklós Mohai), L.T., T.F. and Z.K.; visualization, K.S., E.B. and L.T.; supervision, Z.K.; project administration, K.S. and Z.K. All authors have read and agreed to the published version of the manuscript.

Funding

This research work was funded by the European Structural and Investments Funds and the Government of Hungary under the GINOP-2.2.1-15-2016-00023 project.

Institutional Review Board Statement

The study adhered to the Declaration of Helsinki guidelines and the EU Directive 2010/63/EU for animal experiments, and was approved by the local animal ethical committee (COEO-mice). All animal procedures were performed under the stipulations of the Protection and Careful Treatment of Animals Decree (40/2013. II. 14., Hungarian Government Decree) and were approved by the Institutional Animal Care and Use Committee (protocol code PE/EA/732-7/2021 and date of approval: 5 August 2021).

Informed Consent Statement

Not applicable.

Data Availability Statement

The original contributions presented in the study are included in the article, further inquiries can be directed to the corresponding author.

Acknowledgments

Eszter Bódis is grateful to the Hungarian Academy of Sciences for the János Bolyai Research Fellowship.

Conflicts of Interest

Authors Krisztina Móricz and Antal Balázs Szenes-Nagy were employed by the company EGIS Pharmaceuticals PLC. The remaining authors declare that the research was conducted in the absence of any commercial or financial relationships that could be construed as a potential conflict of interest.

Abbreviations

ADatopic dermatitis
BETBrunauer–Emmett–Teller
DCMdichloromethane
DDSdrug delivery system
DRDubinin–Radushkevich
DSCdifferential scanning calorimetric
gSyLevgel containing levocetirizine base on Syloid mesoporous silica material
IRinfrared spectroscopic
Levolevocetirizine
Levblevocetirizine base
LevdClevocetirizine dihydrochloride
Mmethanol
MSMmesoporous silica material
NMRImouse model (Naval Medical Research Institute)
SEMscanning electron microscopy
SySyloid®72FP
SSAspecific surface area
SyLevdClevocetirizine dihydrochloride on Syloid mesoporous silica material
SyLevblevocetirizine base on Syloid mesoporous silica material
TG-DSC thermogravimetric and differential scanning calorimetry
USultrasound, ultrasonic
Vtottotal pore volume
Vmmesopore volume
Wwater
XPSX-ray photoelectron spectroscopy
XRDX-ray diffraction

References

  1. Vieira, R.J.; Torres, M.I.; Bognanni, A.; Gil-Mata, S.; Ferreira-da-Silva, R.; Lourenço-Silva, N.; Cardoso-Fernandes, A.; Ferreira, A.; Ferreira-Cardoso, H.; Teles, J.; et al. Protocol for the Systematic Reviews on the Desirable and Undesirable Effects of Pharmacological Treatments of Allergic Rhinitis Informing the ARIA 2024 Guidelines. Allergol. Sel. 2024, 8, 270–277. [Google Scholar] [CrossRef] [PubMed]
  2. Renert-Yuval, Y.; Guttman-Yassky, E. What’s New in Atopic Dermatitis. Dermatol. Clin. 2019, 37, 205–213. [Google Scholar] [CrossRef] [PubMed]
  3. Shamji, M.H.; Durham, S.R. Mechanisms of Allergen Immunotherapy for Inhaled Allergens and Predictive Biomarkers. J. Allergy Clin. Immunol. 2017, 140, 1485–1498. [Google Scholar] [CrossRef] [PubMed]
  4. Silverberg, J.I.; Toth, D.; Bieber, T.; Alexis, A.F.; Elewski, B.E.; Pink, A.E.; Hijnen, D.; Jensen, T.N.; Bang, B.; Olsen, C.K.; et al. Tralokinumab plus Topical Corticosteroids for the Treatment of Moderate-to-Severe Atopic Dermatitis: Results from the Double-Blind, Randomized, Multicentre, Placebo-Controlled Phase III ECZTRA 3 Trial*. Br. J. Dermatol. 2021, 184, 450–463. [Google Scholar] [CrossRef]
  5. Choudhary, D.R.; Patel, V.A.; Chhalotiya, U.K.; Patel, H.V.; Kundawala, A.J. Formulation and Evaluation of Fast Dissolving Film of Levocetirizine Dihydrochloride Using Different Grades of Methocel Parameters Polymer Grades Methocel K3 Methocel E3 Methocel E5 Methocel E15. J. Pharm. Res. 2011, 4, 2919–2924. [Google Scholar]
  6. Tillement, J.P.; Testa, B.; Brée, F. Compared Pharmacological Characteristics in Humans of Racemic Cetirizine and Levocetirizine, Two Histamine H1-Receptor Antagonists. Biochem. Pharmacol. 2003, 66, 1123–1126. [Google Scholar] [CrossRef]
  7. Benedetti, M.S.; Plisnier, M.; Kaise, J.; Maier, L.; Baltes, E.; Arendt, C. McCracken, N. Absorption, Distribution, Metabolism and Excretion of [14C]Levocetirizine, the R Enantiomer of Cetirizine, in Healthy Volunteers. Eur. J. Clin. Pharmacol. 2001, 57, 571–582. [Google Scholar] [CrossRef]
  8. Randall, K.L.; Hawkins, C.A. Antihistamines and Allergy. Aust. Prescr. 2018, 41, 42–45. [Google Scholar] [CrossRef]
  9. Uysal, Ü.; Tunçel, M. Validated Capillary Electrophoresis Study for the Determination of Cetirizine in Pharmaceutical Forms. J. Liq. Chromatogr. Relat. Technol. 2006, 29, 1781–1792. [Google Scholar] [CrossRef]
  10. Goindi, S.; Kumar, G.; Kumar, N.; Kaur, A. Development of Novel Elastic Vesicle-Based Topical Formulation of Cetirizine Dihydrochloride for Treatment of Atopic Dermatitis. AAPS PharmSciTech 2013, 14, 1284–1293. [Google Scholar] [CrossRef]
  11. Ciurlizza, C.; Fernández, F.; Calpena, A.C.; Lázaro, R.; Parra, A.; Clares, B. Semisolid Formulations Containing Cetirizine: Human Skin Permeation and Topical Antihistaminic Evaluation in a Rabbit Model. Arch. Dermatol. Res. 2014, 306, 711–717. [Google Scholar] [CrossRef] [PubMed]
  12. Singh, S.; Mangal, A.; Singh Bhadoriya, S.; Madoriya, N.; Dixit, P. Bioavailability and Bioactivity Enhancement of Herbal Drugs by “Nanotechnology”: A Review. J. Curr. Pharm. Res. 2011, 8, 1–7. [Google Scholar]
  13. Nohynek, G.J.; Dufour, E.K.; Roberts, M.S. Nanotechnology, Cosmetics and the Skin: Is There a Health Risk? Ski. Pharmacol. Physiol. 2008, 21, 136–149. [Google Scholar] [CrossRef] [PubMed]
  14. Vandana, K.R.; Prasanna Raju, Y.; Harini Chowdary, V.; Sushma, M.; Vijay Kumar, N. An Overview on in Situ Micronization Technique—An Emerging Novel Concept in Advanced Drug Delivery. Saudi Pharm. J. 2014, 22, 283–289. [Google Scholar] [CrossRef]
  15. Vemula, V.R.; Lagishetty, V. Srikanth Lingala Solubility Enhancement Techniques. Int. J. Pharm. Sci. Rev. Res. 2010, 5, 41–51. [Google Scholar]
  16. Wanning, S.; Süverkrüp, R.; Lamprecht, A. Pharmaceutical Spray Freeze Drying. Int. J. Pharm. 2015, 488, 136–153. [Google Scholar] [CrossRef]
  17. David, A. Edwards; Justin Hanes; Giovanni Caponetti; Jeffrey Hrkach; Abdelaziz Ben-Jebria; Mary Lou Eskew; Jeffrey Mintzes; Daniel Deaver; Noah Lotan; Robert Langer Large Porous Particles for Pulmonary Drug Delivery. Science (1979) 1997, 276, 1868–1871. [Google Scholar]
  18. Poursina, N.; Vatanara, A.; Rouini, M.R.; Gilani, K.; Rouholamini Najafabadi, A. Systemic Delivery of Parathyroid Hormone Using Spray Freeze-Dried Inhalable Particles. Pharm. Dev. Technol. 2017, 22, 733–739. [Google Scholar] [CrossRef]
  19. Waters, L.J.; Hanrahan, J.P.; Tobin, J.M.; Finch, C.V.; Parkes, G.M.B.; Ahmad, S.A.; Mohammad, F.; Saleem, M. Enhancing the Dissolution of Phenylbutazone Using Syloid® Based Mesoporous Silicas for Oral Equine Applications. J. Pharm. Anal. 2018, 8, 181–186. [Google Scholar] [CrossRef]
  20. Sliwinska-Bartkowiak, M.; Dudziak, G.; Sikorski, R.; Gras, R.; Radhakrishnan, R.; Gubbins, K.E. Melting/Freezing Behavior of a Fluid Confined in Porous Glasses and MCM-41: Dielectric Spectroscopy and Molecular Simulation. J. Chem. Phys. 2001, 114, 950–962. [Google Scholar] [CrossRef]
  21. Zhao, Q.; Wang, T.; Wang, J.; Zheng, L.; Jiang, T.; Cheng, G.; Wang, S. Fabrication of Mesoporous Hydroxycarbonate Apatite for Oral Delivery of Poorly Water-Soluble Drug Carvedilol. J. Non. Cryst. Solids 2012, 358, 229–235. [Google Scholar] [CrossRef]
  22. Mai, W.X.; Meng, H. Mesoporous Silica Nanoparticles: A Multifunctional Nano Therapeutic System. Integr. Biol. 2013, 5, 19–28. [Google Scholar] [CrossRef] [PubMed]
  23. Zaharudin, N.S.; Mohamed Isa, E.D.; Ahmad, H.; Abdul Rahman, M.B.; Jumbri, K. Functionalized Mesoporous Silica Nanoparticles Templated by Pyridinium Ionic Liquid for Hydrophilic and Hydrophobic Drug Release Application. J. Saudi Chem. Soc. 2020, 24, 289–302. [Google Scholar] [CrossRef]
  24. Szentmihályi, K.; Klébert, S.; May, Z.; Bódis, E.; Mohai, M.; Trif, L.; Feczkó, T.; Károly, Z. Immobilization of Metronidazole on Mesoporous Silica Materials. Pharmaceutics 2022, 14, 2332. [Google Scholar] [CrossRef]
  25. Basavaiah, K.; Raghu, M.S.; Vinay, K.B. Simple and Rapid Spectrophotometric Assay of Levocetirizine in Pharmaceuticals through Charge-Transfer Complexation Using Chloranilic Acid and 2,3-Dichloro-5,6-Dicyanoquinone as π-Acceptors. Bull. Chem. Soc. Ethiop. 2012, 26, 319–328. [Google Scholar] [CrossRef]
  26. Prabhu, S.L.; Shirwaikar, A.A.; Shirwaikar, A.; Kumar, C.D.; Kumar, G.A. Simultaneous UV Spectrophotometric Estimation of Ambroxol Hydrochloride and Levocetirizine Dihydrochloride. Indian J. Pharm. Sci. 2008, 70, 236. [Google Scholar]
  27. Brunauer, S.; Emmett, P.H.; Teller, E. Adsorption of Gases in Multimolecular Layers. J. Am. Chem. Soc. 1938, 60, 309–319. [Google Scholar] [CrossRef]
  28. Mohai, M. XPS MultiQuant: Multimodel XPS Quantification Software. Surf. Interface Anal. 2004, 36, 828–832. [Google Scholar] [CrossRef]
  29. Evans, S.; Pritchard, R.G.; Thomas, J.M. Relative Differential Subshell Photoionisation Cross-Sections (MgKα) from Lithium to Uranium. J. Electron Spectrosc. Relat. Phenom. 1978, 14, 341–358. [Google Scholar] [CrossRef]
  30. Reilman, R.F.; Msezane, A.; Manson, S.T. Relative Intensities in Photoelectron Spectroscopy of Atoms And Molecules. J. Electron Spectrosc. Relat. Phenom. 1976, 8, 389–394. [Google Scholar] [CrossRef]
  31. Mohai, M.; Bertóti, I. Correction for surface contaminations in XPS: A practical approach. In ECASIA 95; Mathieu, H.J., Reihl, B., Briggs, D., Eds.; John Willey & Sons: Chichester, UK, 1996; pp. 675–678. [Google Scholar]
  32. Yu, M.; Ma, H.; Lei, M.; Li, N.; Tan, F. In Vitro/in Vivo Characterization of Nanoemulsion Formulation of Metronidazole with Improved Skin Targeting and Anti-Rosacea Properties. Eur. J. Pharm. Biopharm. 2014, 88, 92–103. [Google Scholar] [CrossRef] [PubMed]
  33. Zhuravlev, L.T. Concentration of Hydroxyl Groups on the Surface of Amorphous Silicas. Langmuir 1987, 3, 316–318. [Google Scholar] [CrossRef]
  34. Fisher, K.A.; Huddersman, K.D.; Taylor, M.J. Comparison of Micro- and Mesoporous Inorganic Materials in the Uptake and Release of the Drug Model Fluorescein and Its Analogues. Chem. A Eur. J. 2003, 9, 5873–5878. [Google Scholar] [CrossRef] [PubMed]
  35. Rosenholm, J.M.; Lindén, M. Towards Establishing Structure–Activity Relationships for Mesoporous Silica in Drug Delivery Applications. J. Control. Release 2008, 128, 157–164. [Google Scholar] [CrossRef] [PubMed]
  36. Available online: https://web.archive.org/web/20100704013154/http://macro.lsu.edu/HowTo/solvents/Dielectric%20Constant%20.htm (accessed on 25 September 2024).
  37. Maleki, A.; Kettiger, H.; Schoubben, A.; Rosenholm, J.M.; Ambrogi, V.; Hamidi, M. Mesoporous Silica Materials: From Physico-Chemical Properties to Enhanced Dissolution of Poorly Water-Soluble Drugs. J. Control. Release 2017, 262, 329–347. [Google Scholar] [CrossRef]
  38. Akhtar, S.; Hussain, S.; Mandal, S.K. Formulation Development And Characterization Of Effervescent Tablets Along With Levocetirizine Dihydrochloride. Asian J. Pharm. Clin. Res. 2020, 13, 124–130. [Google Scholar] [CrossRef]
  39. Yi, L.; Cui, L.; Cheng, L.; Móczó, J.; Pukánszky, B. Levocetirizine-Loaded Electrospun Fibers from Water-Soluble Polymers: Encapsulation and Drug Release. Molecules 2023, 28, 4188. [Google Scholar] [CrossRef]
  40. Djekic, L.; Primorac, M.; Filipic, S.; Agbaba, D. Investigation of Surfactant/Cosurfactant Synergism Impact on Ibuprofen Solubilization Capacity and Drug Release Characteristics of Nonionic Microemulsions. Int. J. Pharm. 2012, 433, 25–33. [Google Scholar] [CrossRef]
  41. Almawash, S.; Quadir, S.S.; Al Saqr, A.; Sharma, G.; Raza, K. Dual Delivery of Fluticasone Propionate and Levocetirizine Dihydrochloride for the Management of Atopic Dermatitis Using a Microemulsion-Based Topical Gel. ACS Omega 2022, 7, 7696–7705. [Google Scholar] [CrossRef]
  42. Yurtdaş Kirimlioğlu, G.; Öztürk, A.A. Levocetirizine Dihydrochloride-Loaded Chitosan Nanoparticles: Formulation and in Vitro Evaluation. Turk J. Pharm. Sci. 2020, 17, 27–35. [Google Scholar] [CrossRef]
  43. Mirankó, M.; Tóth, J.; Fodor-Kardos, A.; Móricz, K.; Szenes-Nagy, A.B.; Gácsi, A.; Spaits, T.; Gyenis, J.; Feczkó, T. Topical Formulation of Nano Spray-Dried Levocetirizine Dihydrochloride against Allergic Edema. Pharmaceutics 2022, 14, 2577. [Google Scholar] [CrossRef] [PubMed]
Figure 1. Levocetirizine dihydrochloride (A) and dextrocetirizine dihydrochloride (B).
Applsci 14 09605 g001
Figure 2. Adsorption isotherms of levocetirizine dihydrochloride–MSM and Syloid materials.
Applsci 14 09605 g002
Figure 3. XRD spectra of samples Syloid, levocetirizine dihydrochloride (LevdC), SyLev1, and SyLev4.
Applsci 14 09605 g003
Figure 4. Scanning electron micrographs of Syloid carrier (A), levocetirizine dihydrochloride (B), and sample SyLev3 (C).
Applsci 14 09605 g004
Figure 5. Adsorption isotherms of levocetirizine base–MSM and Syloid materials.
Applsci 14 09605 g005
Figure 6. Thickness of the levocetirizine layers adsorbed on silica, calculated from X-ray photoelectron intensity data, as function of preparation (mixing) time.
Applsci 14 09605 g006
Figure 7. Changes in results of adsorption measurements (total and mesopore volume, specific surface area; relative to Syloid) as function of preparation (mixing) time.
Applsci 14 09605 g007
Figure 8. IR spectra of Syloid, levocetirizine base, and sample SyLev7.
Applsci 14 09605 g008
Figure 9. Electron micrograph of sample SyLev8.
Applsci 14 09605 g009
Figure 10. X-ray diffractograms of samples SyLev7 and SyLev9.
Applsci 14 09605 g010
Figure 11. Dissolution of levocetirizine base in water and release of levocetirizine base from silica MSM at 20 °C (A) and 37 °C (B).
Applsci 14 09605 g011
Figure 12. In vivo effectiveness of gel containing levocetirizine free base immobilized on Syloid (gSyLev) on ear inflammation in the ears of mice. Values are mean ± standard error of the mean. (n = 8), ns stands for not significant, * p ≤ 0.05, **** p ≤ 0.0001.
Applsci 14 09605 g012
Table 1. Parameters used to prepare levocetirizine immobilized on Syloid MSM. (SyLev: levocetirizine on Syloid mesoporous silica material).
SamplesMixing Time (h)SolventLevocetirizine Form
SyLev12waterdihydrochloride
SyLev224
SyLev32methanol
SyLev424
SyLev572
SyLev62dichloromethanefree base
SyLev724
SyLev848
SyLev972
Table 2. Specific surface area and percent surface coverage of samples made in aqueous and methanol solutions containing levocetirizine dihydrochloride on the surface of Syloid carrier according to nitrogen adsorption measurements.
SamplesSpecific Surface Area
(m2 g−1)
Covered Area
(%)
Syloid368
SyLev127824.5
SyLev23573.0
SyLev328821.8
SyLev427824.5
SyLev530119.2
Table 3. Nitrogen adsorption results of samples made with levocetirizine base (SSA: specific surface area, Vtot: total pore volume, Vm: mesopore volume).
SamplesVtot
(cm3 g−1)
Covered
Vtot
(%)
Vm
(cm3 g−1)
Covered Vm
(%)
SSA
(m2 g−1)
Covered SSA
of Syloid
(%)
Syloid1.1 1.1 368
SyLev60.7630.90.7531.824732.9
SyLev70.7432.70.7036.423536.1
SyLev80.4460.00.3964.512765.5
SyLev90.6243.60.6045.519048.4
Table 4. Surface composition (atomic %) of the immobilized levocetirizine base samples calculated by the infinitely thick homogeneous sample model.
SampleONCClSi
UncorrectedSyLev650.32.124.20.722.7
SyLev746.93.027.60.921.5
SyLev844.02.530.61.221.7
SyLev943.13.232.11.220.5
Pure baseTheoretical11.17.477.83.7
Measured12.69.674.53.3
CorrectedSyLev612.06.978.92.2SiO2.3
SyLev711.28.577.82.5SiO2.2
SyLev811.96.478.83.0SiO2.1
SyLev911.37.778.02.9SiO2.2
Disclaimer/Publisher’s Note: The statements, opinions and data contained in all publications are solely those of the individual author(s) and contributor(s) and not of MDPI and/or the editor(s). MDPI and/or the editor(s) disclaim responsibility for any injury to people or property resulting from any ideas, methods, instructions or products referred to in the content.

