Article

Slope Stability Analysis of Rockfill Embankments Considering Stress-Dependent Spatial Variability in Friction Angle of Granular Materials

1
PowerChina Chengdu Engineering Corporation Limited, No. 1 Huanhua North Road, Chengdu 610072, China
2
State Key Laboratory of Hydraulics and Mountain River Engineering, College of Water Resource & Hydropower, Sichuan University, No. 24 South Section 1, Yihuan Road, Chengdu 610065, China
*
Author to whom correspondence should be addressed.
Appl. Sci. 2024, 14(14), 6354; https://doi.org/10.3390/app14146354
Submission received: 21 June 2024 / Revised: 17 July 2024 / Accepted: 18 July 2024 / Published: 21 July 2024
(This article belongs to the Special Issue Slope Stability and Earth Retaining Structures—2nd Edition)

Abstract

Slope stability is a major safety concern of rockfill embankments. Since rockfills are incohesive materials, only friction angle is considered as a shear strength parameter in the slope stability analysis of rockfill embankments. Recently, it was found that confining pressure can significantly affect the mean value and variance of the friction angle of rockfills. Since the confining pressure spatially varies within a rockfill embankment, the effect of stress-dependent spatial variability in the friction angle of rockfills should be investigated for slope stability evaluation of rockfill embankments. In the framework of the Limit Equilibrium Method (LEM), an approach is proposed for the slope stability analysis of rockfill embankments considering the stress-dependent spatial variability in the friction angle. The safety factors of slope stability are computed with variable values of the friction angle at the bases of slices which are determined by the stress-dependent mean value and variance of the friction angle of rockfills. The slope stability of a homogeneous rockfill embankment is analyzed to illustrate the proposed approach, and a parametric analysis is carried out to explore the effect of variation in the parameters of the variance function of friction angle on slope stability. The illustrative example demonstrates that the stress-dependent spatial variability of friction angle along the slip surface is obvious and is affected by the location of the slip surface and the loading condition. The effects of the stress-dependent spatial variability of the friction angle on the slope stability of high rockfill embankments should be considered.

1. Introduction

Rockfill embankments are widely constructed around the world due to their low cost and strong adaptability to complex topographical and geological conditions [1,2,3,4,5,6,7,8,9]. While playing an important role, accidents that may occur in rockfill embankments also pose potential threats to the environment and society. The San Fernando dam suffered a 6.6 magnitude earthquake in 1971, resulting in slope instability and extensive collapse [10]. The Teton dam experienced piping during its initial impounding in 1976, ultimately resulting in 11 fatalities and USD 2 billion in economic losses [11]. Slope stability analysis is a major aspect of the safety evaluation of water-retaining embankments [12]. Since rockfills are incohesive materials, only friction angle is considered as a shear strength parameter in the slope stability analysis of rockfill embankments [13,14]. Due to inherent variability, test errors, and other unknown factors, the values of the friction angle of rockfills are uncertain and the uncertainty of the friction angle can be quantified by its variance (a measure of the dispersion extent of friction angle around its mean value). In addition, the shear strength of rockfill materials is closely related to confining pressure, specifically, the friction angle of rockfills decreases with an increase in confining pressure [15,16,17,18,19,20,21]. Recently, it was found that confining pressure can significantly affect the mean value and variance of the friction angle of rockfill materials which decrease with increasing confining pressure [16]. Since the confining pressure (i.e., the minor principal stress) spatially varies within a rockfill embankment, this finding indicates that the mean value and variance of the friction angle of rockfills vary from one location to another in the dam as well. For high rockfill embankments, the stress-dependent spatial variability of the friction angle is expected to be significant and may considerably affect the slope stability.
Probabilistic slope stability analysis provides a reasonable way to quantitatively characterize stochastic uncertainties and their effects on slope stability [22,23,24,25,26,27,28,29]. However, for the complex formulations and algorithms as well as the requirement for a large quantity of samples to accurately determine the probability distributions and statistical parameters, the practical application of probabilistic slope stability analysis is not convenient. In practice, the slope ratio of rockfill embankments is commonly designed with safety factors of slope stability evaluated using the Limit Equilibrium Method (LEM) or numerical method, and the computed safety factors must be higher than the allowable safety factors [30,31,32,33,34]. The LEM considers the analysis domain as a rigid body, based on the principle of static equilibrium to calculate the safety factor. It has the characteristics of simplicity and high efficiency, including specific methods such as the Bishop’s simplified method, the Janbu method, and the Morgenstern–Price method [35]. Numerical methods such as the finite element method, finite difference method, and boundary element method can more accurately take into account the topographical and geological conditions as well as the deformation behavior of rockfills, but at a higher computational cost [36]. As discussed above, the effect of stress-dependent spatial variability in the friction angle of rockfills should be investigated for the slope stability evaluation of rockfill embankments by considering the adverse variation towards low values of friction angle based on the distribution of confining pressure in rockfill embankments.
Based on the LEM, this paper proposes an approach for the slope stability analysis of rockfill embankments considering the stress-dependent spatial variability in the friction angle of rockfills. This approach computes the safety factors of slope stability with the variable values of friction angle at the bases of slices which are determined by the stress-dependent mean value and variance of the friction angle of rockfills. The spatial variability of the values of the friction angle along the slip surface is taken into account through the varying variance of the friction angle at the bases of the slices. The remainder of the paper is organized as follows: In Section 2, an approach for the slope stability analysis of rockfill embankments considering stress-dependent spatial variability in the friction angle is presented. In Section 3, the slope stability of a homogeneous rockfill embankment is analyzed to illustrate the proposed approach and investigate the variation in the spatial variability of the friction angle with the changes in the location of the slip surface and loading condition. In addition, a parametric analysis is carried out to explore the effect of variation in the parameters of the variance function of the friction angle on the slope stability. Finally, a summary and conclusions for this study are drawn and given in Section 4.

2. Approach for Slope Stability Analysis of Rockfill Embankments Considering Stress-Dependent Spatial Variability in Friction Angle

2.1. Bishop’s Simplified Method and Pseudo-Static Method for Seismic Slope Stability Analysis of Embankments

Embankment dams usually consist of rockfill, transition, filter, foundation, core wall (or concrete slab for concrete-faced rockfill dams), cut-off wall, etc. Typical sections are shown in Figure 1. When the topographical and geological conditions of the analyzed domain are not complex, the LEMs can be efficient in obtaining the accurate safety factor. In virtue of simple formulation, Bishop’s simplified method [37] is one of the LEMs commonly used for the stability analysis of earth slopes and embankments. It has been verified that the precision of Bishop’s simplified method is satisfactory by comparison with more rigorous methods such as the Morgenstern–Price method [38]. Bishop’s simplified method is one of the LEMs prescribed in the Chinese design specification [39] for the slope stability calculation of embankment dams. Therefore, Bishop’s simplified method is used to analyze the embankment slope stability in this study. Bishop’s simplified method is based on the method of slices and only satisfies the overall moment equilibrium. Bishop’s simplified method considers normal interslice forces and ignores interslice shear forces. The forces acting on the slice are shown in Figure 2. The safety factor Fs given by Bishop’s simplified method for a circular slip surface is as follows:
F s = { [ ( W + V ) sec α u b sec α ] tan φ + c b sec α } [ 1 / ( 1 + tan α tan φ / F s ) ] [ ( W + V ) sin α + M c / R ]
in which W is the weight of the slice; V is the vertical seismic inertia force; u is the pore water pressure at the base of the slice; α is the inclination angle of the slice base to the horizontal direction; b is the slice width; Mc is the moment about the center of the slip arc due to the horizontal seismic inertia force; R is the radius of the slip arc; and c and φ are the cohesion and friction angle of the soil, respectively.
According to the Chinese specifications for the seismic design of hydraulic structures [40], the seismic effect on embankment slope stability is estimated by a pseudo-static method in Bishop’s simplified method, where the impact of ground motion on the slope is modeled by horizontal and vertical seismic inertia forces, Q and V, acting on the slice:
{ Q = a h ξ W α / g V = a h ξ W α / 3 g
in which a h is the design peak horizontal ground acceleration; ξ is the reduction coefficient of seismic effects (ξ = 0.25); and α is the dynamic distribution coefficient for the seismic inertia force. The values of α for the embankment higher than 40 m are presented in Figure 2.

2.2. An Algorithm for Determining the Values of the Friction Angle at the Bases of the Slices

For coarse-grained soil, such as rockfills, the cohesion is ignored, and the values of the friction angle at the bases of the slices are determined by the stress-dependent mean value and variance of the friction angle. The spatial variability of the values of the friction angle is taken into account through the varying mean value and variance of the friction angle along the slip surface. According to Wu and Chen [16,22], the mean value, M(φp), and variance, Var(φp), of the friction angle φp of rockfills are the functions of the minor principal stress, σ3:
M ( φ p ) = φ 0 Δ φ ln ( σ 3 p a )
V a r ( φ p ) = a exp [ b ( σ 3 p a ) c ] + d
in which φ0, Δφ, a, b, c, and d are the parameters.
In order to consider the adverse variation in φp, the design values of φp at the bases of the slices are determined as follows:
φ p = M ( φ p ) k V a r ( φ p )
in which V a r ( φ p ) is the standard deviation of φp, k is a coefficient, and in this study, k is taken as 3.
In Equations (3) and (4), σ3 is calculated by (see Figure 3 for the derivation)
σ 3 = σ n ( sec 2 φ f tan φ f sec φ f )
tan φ f = tan φ p F s
in which σn is the stress normal to the failure arc, and φf is the friction angle corresponding to the sliding limit state of the slope. In terms of Bishop’s simplified method, σn is computed as
σ n = ( W ± V ) b + b tan φ f tan α u
Iterations are required to obtain the design values of φp and the safety factor Fs. The iterative process is given as follows:
(a)
Assume an initial φ p ( 0 ) and F s ( 0 ) ; in this study, φ p ( 0 ) = φ 0 and F s ( 0 ) = 1.
(b)
Determine φf by substituting φ p ( k ) and F s ( k ) ( k = 1 , 2 , , n ) in Equation (7), then σ3 is calculated using Equations (6) and (8).
(c)
Obtain φ p ( k + 1 ) from Equations (3)–(5).
(d)
Compute F s ( k + 1 ) using Equation (1).
(e)
Repeat steps (b) to (d) until | F s ( k + 1 ) F s ( k ) | ε, where ε is the tolerance; in this study, ε = 0.001.

3. Illustrative Example

In this section, as a simple and easily replicable example, the slope stability of a homogeneous rockfill embankment is analyzed to illustrate the slope stability analysis approach considering the stress-dependent spatial variability in the friction angle of granular materials, and additionally, a parametric analysis is carried out to explore the influence of variation in the parameters of the variance function of the friction angle on the slope stability.

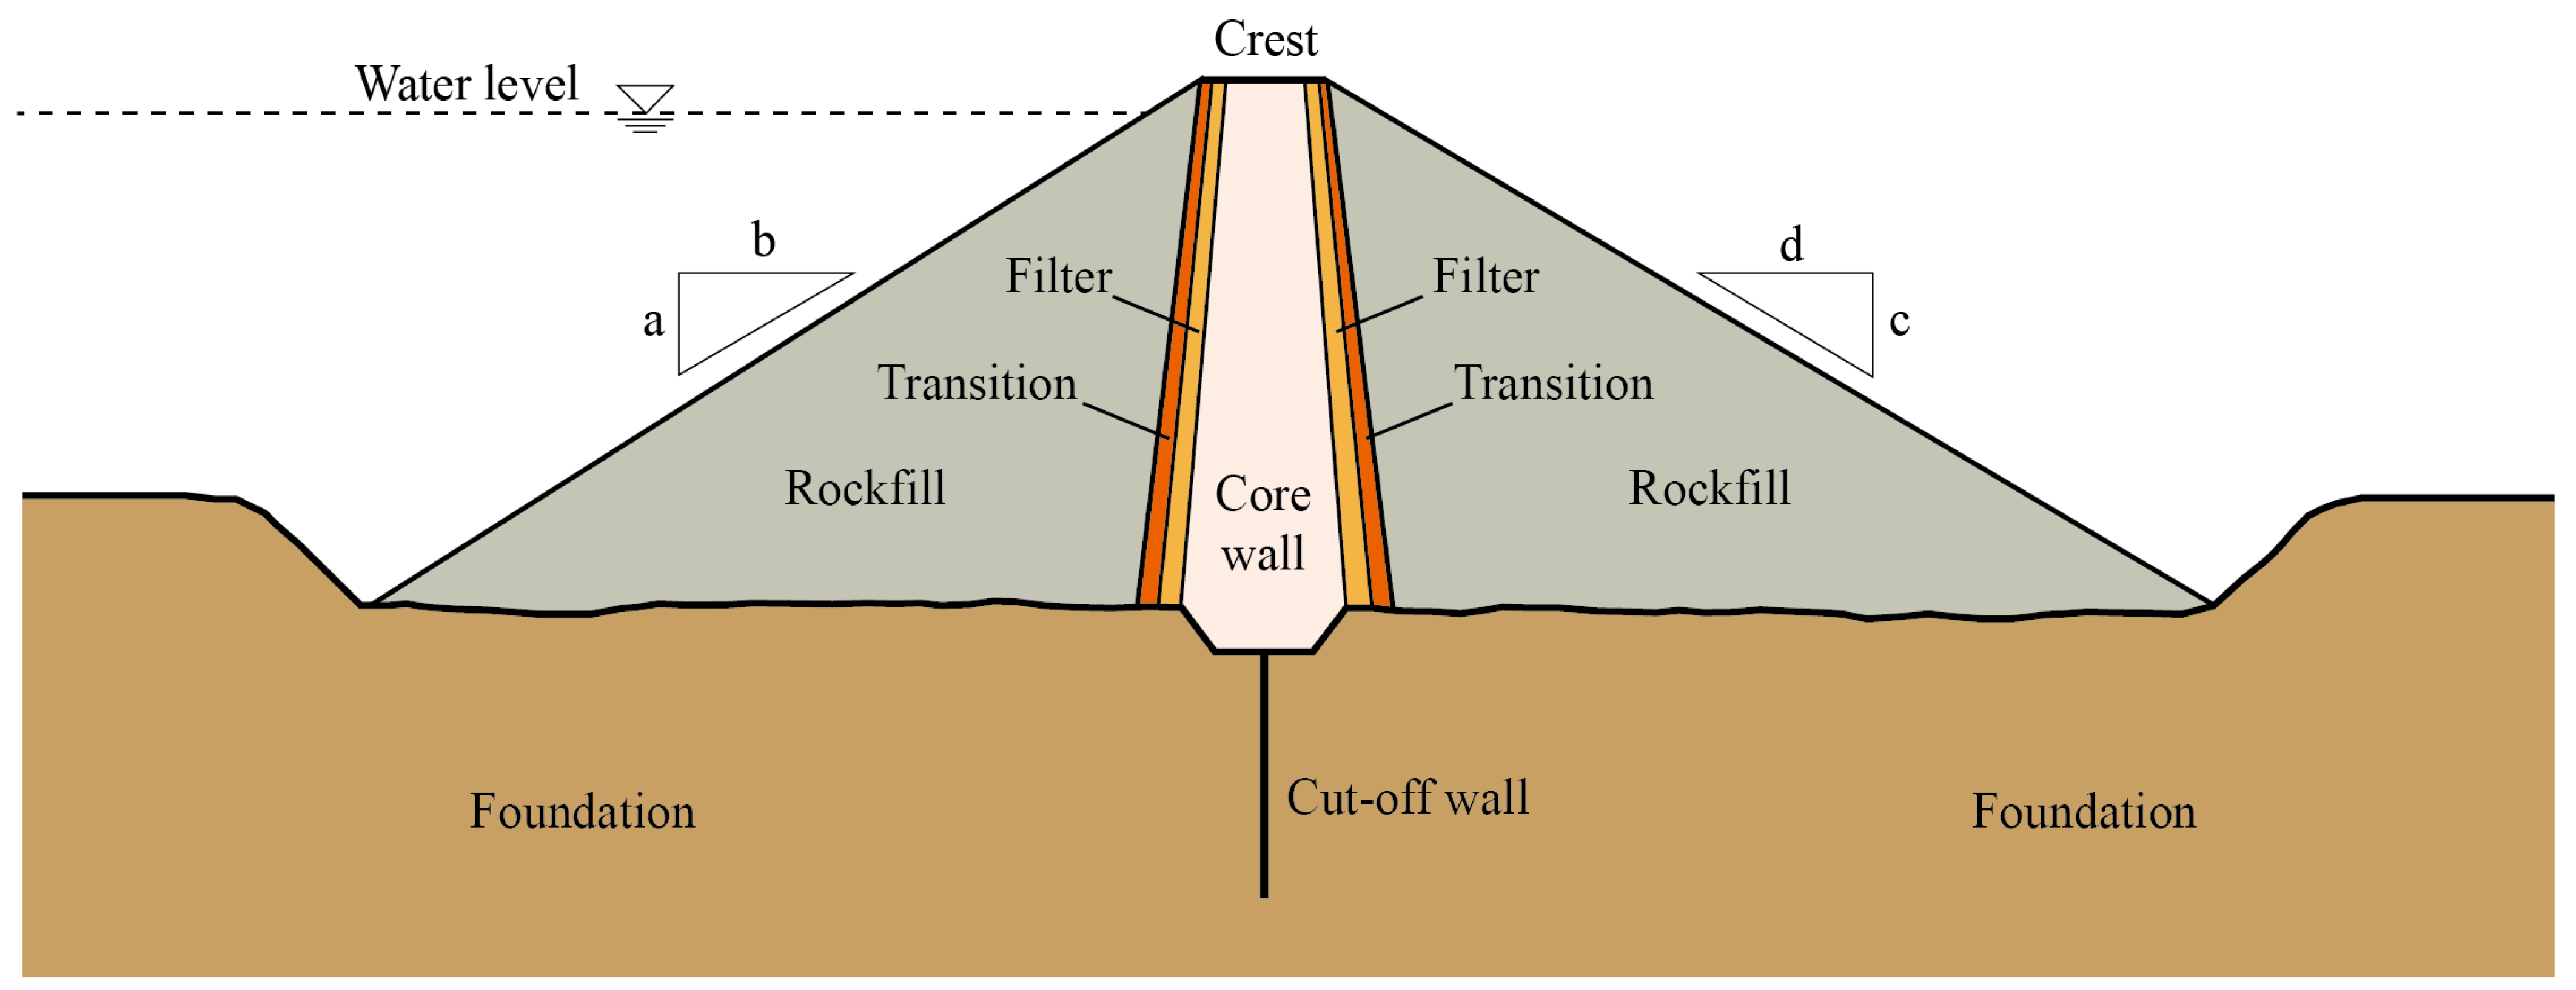
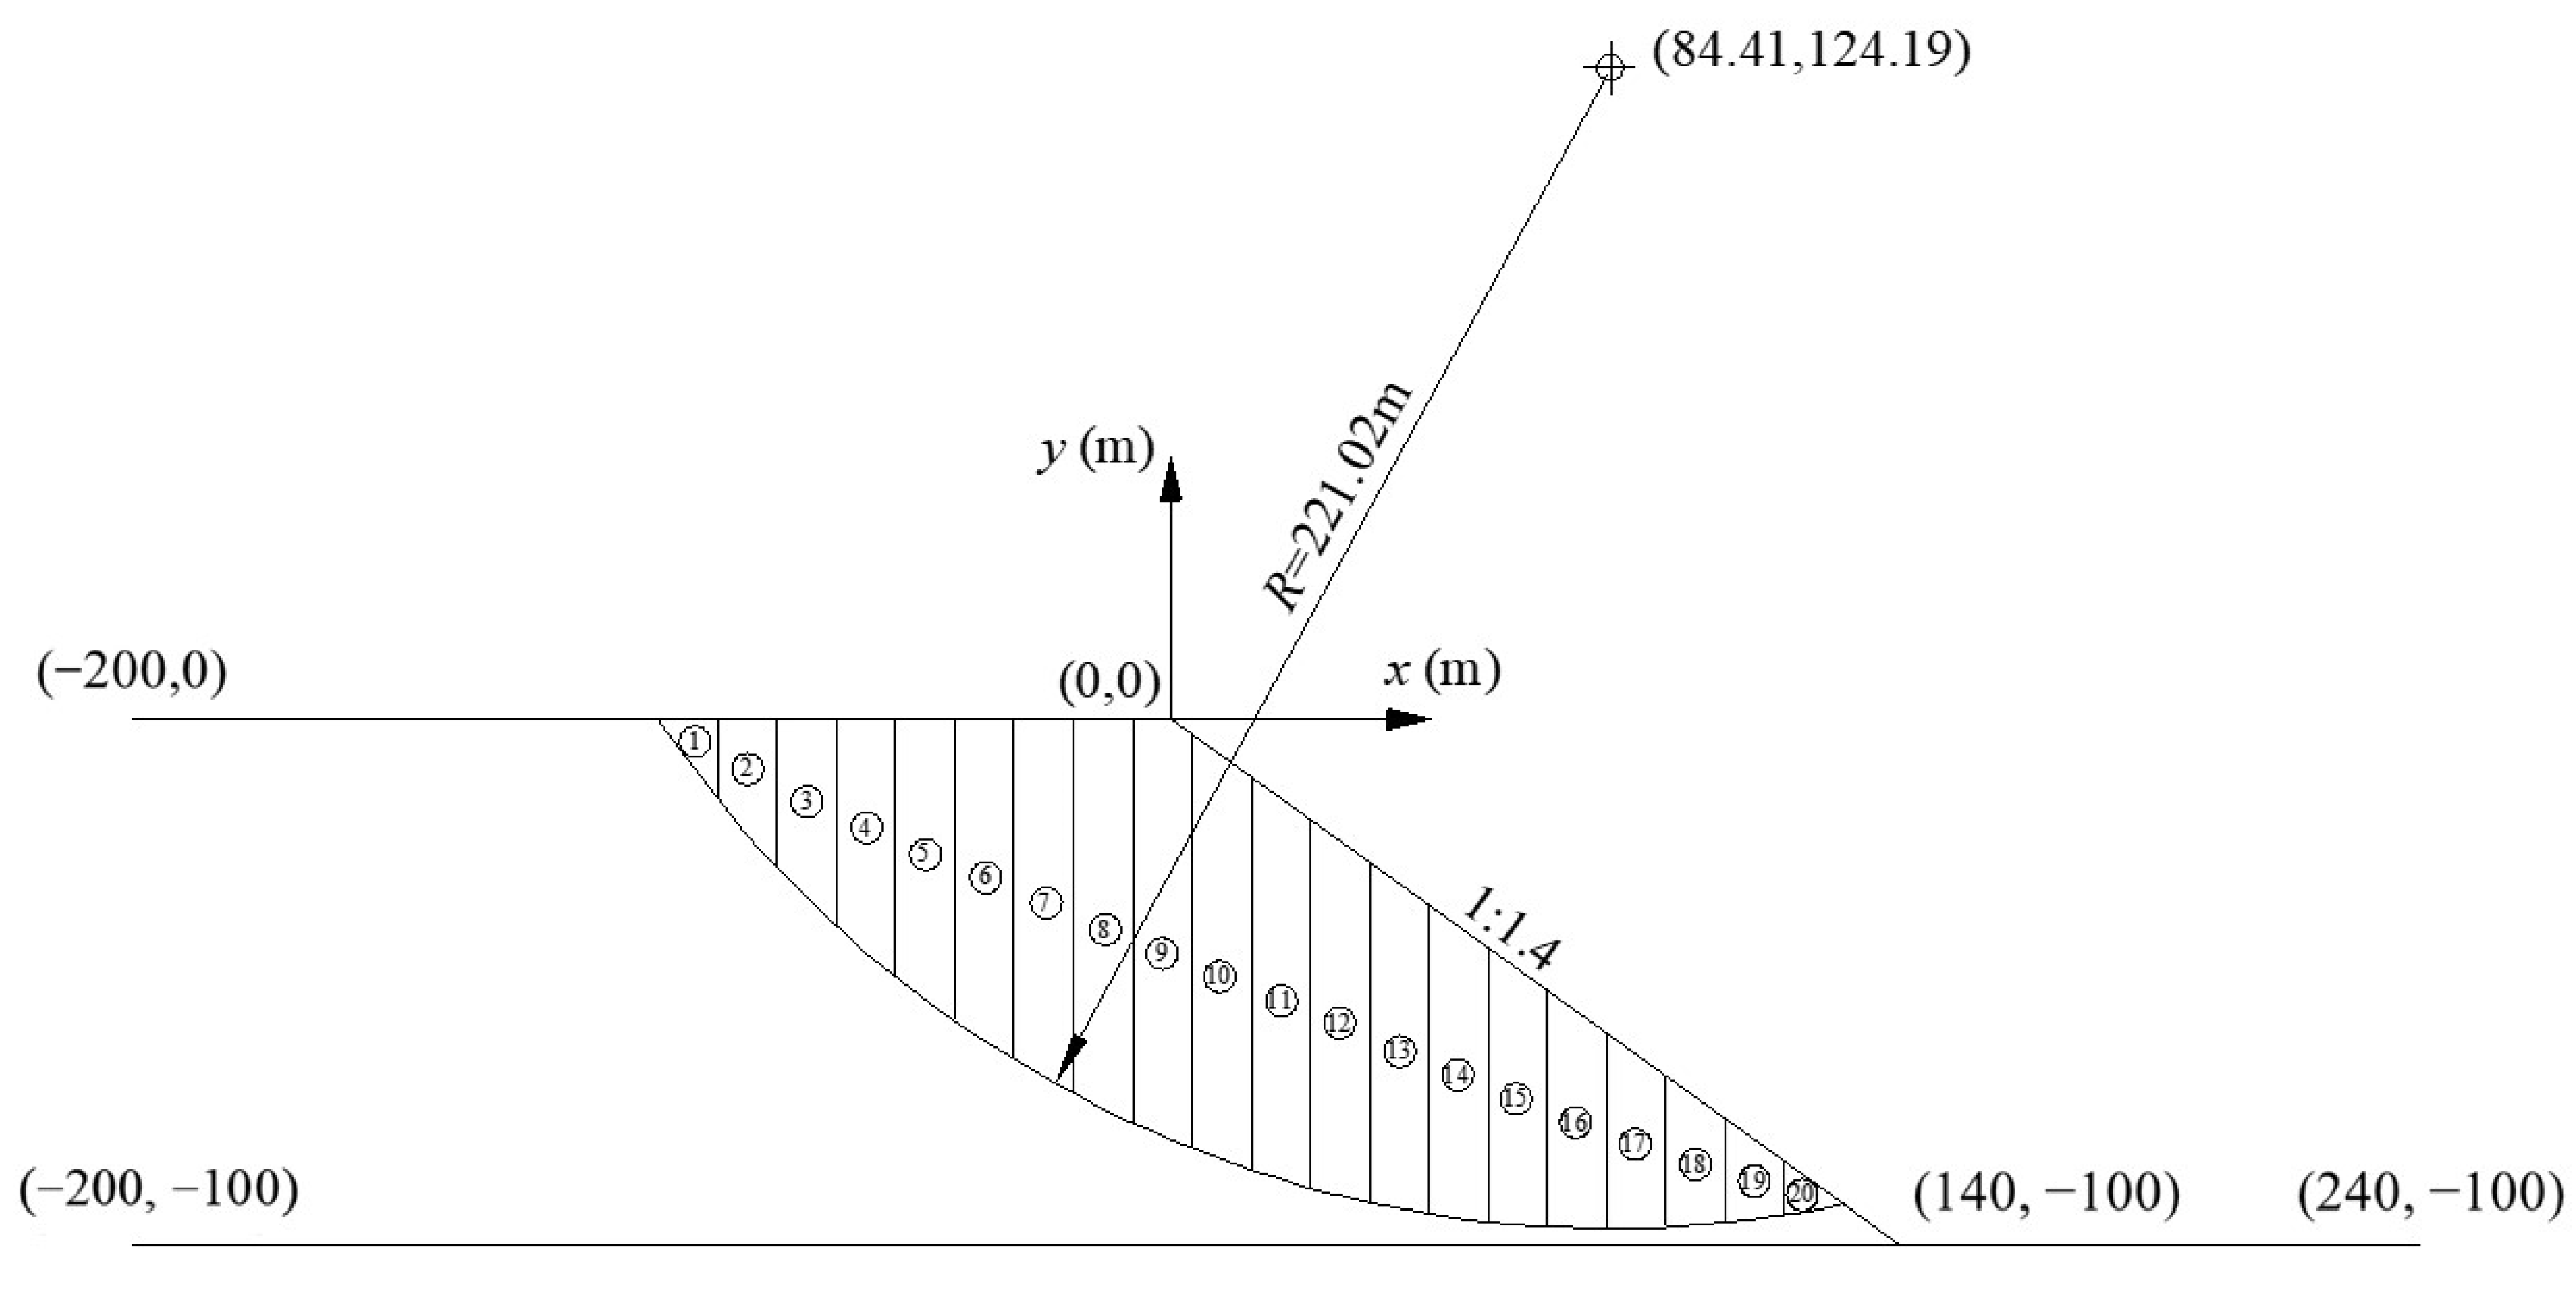
3.1. The Slope Stability Analysis of a Rockfill Embankment

The rockfill embankment is assumed to be composed of a blasting-quarried granite rockfill material [16,22] and lies on a rock foundation. It has a height of 100 m and an inclination ratio of 1:1.4. The cross section of the rockfill embankment is shown in Figure 4. An arbitrary slip arc is adopted to illustrate the slope stability analysis approach as shown in Figure 4, which has a radius of 221.02 m, and the x and y coordinates of the radius center are 84.41 m and 124.19 m, respectively. The slip block is divided into 20 slices with identical widths. The unit weight of the rockfills is equal to 20 kN/m3. The rockfill material consists of angular or sub-angular particles with a Dmax (maximum particle size) of 60 mm, a D10 (particle size at 10% finer) of 1.76 mm, a D50 (particle size at 50% finer) of 18.4 mm, and a D60 (particle size at 60% finer) of 26.7 mm. The mean values, M(φp), and variances, Var(φp), of the friction angle of the rockfills are as follows [22]:
M ( φ p ) = 52.4 3.9 ln ( σ 3 p a )
V a r ( φ p ) = 3.5 exp [ 0.1 ( σ 3 p a ) 1.5 ] + 0.3
Based on the slip arc, the slope safety factors for different loading conditions were computed using the proposed approach. Three loading conditions are considered herein: (1) the static loading condition, i.e., only takes into account the weights of the slices, (2) the seismic loading condition I, i.e., takes into account both the weights of the slices and the horizontal and upward vertical seismic inertia forces, and (3) the seismic loading condition II, i.e., takes into account the weights of the slices as well as the horizontal and downward vertical seismic inertia forces. The peak horizontal ground acceleration is ah = 0.4 g, and the maximum dynamic distribution coefficient is αm = 2.0.
The slope safety factors for the three loading conditions without considering the variability in the friction angle of the rockfills (i.e., the variance of the friction angle is equal to 0) are 2.874, 2.286, and 2.297, respectively, while if the stress-dependent spatial variability in the friction angle of rockfills is considered, the slope safety factors are reduced to 2.612, 2.060, and 2.080, respectively. The computed minor principal stresses, σ3, and the associated mean values, M(φp), variances, Var(φp), and design values of φp at the bases of the slices are listed in Table 1, Table 2 and Table 3. It is observed that the minor principal stresses, σ3, are basically proportional to the heights of the slices, and the maximum minor principal stress is located at the base of the intermediate slice. Because the horizontal seismic inertia forces towards the slope face are involved, the minor principal stresses for the seismic loading conditions are smaller than those for the static loading condition. Moreover, the minor principal stresses for seismic loading condition I (with upward vertical seismic inertia forces) are smaller than those for seismic loading condition II (with downward vertical seismic inertia forces). Because the mean values, M(φp), and variances, Var(φp), are dependent on the minor principal stresses, σ3, the values of M(φp) and Var(φp) at the bases of the slices differ from slice to slice and differ from loading condition to loading condition.
The formulation of the proposed approach indicates that design values of φp and minor principal stresses, σ3, are related to each other. Therefore, for the same loading condition and the same slice, due to different design values of φp, the minor principal stresses are not the same in the cases of considering and not considering the variability in the friction angle of the rockfills. However, the minor principal stresses are insensitive to the design values of φp. For most slices in the three loading conditions, the relative differences of σ3 are less than 2%, and the maximum relative difference of σ3 is within 8%.
Figure 5 and Figure 6 show the variations of the minor principal stresses, σ3, mean values, M(φp), variances, Var(φp), and design values of φp along the slices for the static loading condition and seismic loading condition I. It can be seen that both the mean values, M(φp), and variances, Var(φp), of φp at the bases of the slices decrease as the minor principal stress, σ3, increases. Furthermore, both M(φp) and Var(φp) dramatically drop in the range of σ3 from 0 to approximately 800 kPa, and there are much less variations in M(φp) and Var(φp) in the range of σ3 between 800 kPa and 1100 kPa. As shown in Figure 5 and Figure 6, the stress-dependent spatial variability in φp makes the design values of φp more uniform than the mean values of φp. In order to investigate the influence of the number of slices on the computational results, the slope safety factor for the static loading condition is computed with 10, 20, 30, 40, 50, and 100 slices and is equal to 2.616, 2.612, 2.611, 2.610, 2.610, and 2.610, respectively. It can be seen that the computational results are insensitive to the number of slices. A grid-and-radius method was adopted to search for the minimum slope safety factor. The minimum safety factors are 1.583 and 1.916, respectively, for the static loading condition with and without considering the variability in the friction angle of the rockfills, and the minimum safety factors are 1.315 and 1.597, respectively, for seismic loading condition I with and without considering the variability in the friction angle of the rockfills. Figure 7 shows the corresponding critical slip surfaces, and Figure 8 shows the minor principal stresses, σ3, mean values, M(φp), variances, Var(φp), and design values of φp along the slices for the critical slip surface ② in Figure 7. It is observed that the critical slip surfaces are close to each other, and the critical slip surfaces ① and ② (considering the variability in the friction angle of the rockfills) are a little shallower than ③ and ④ (not considering the variability in the friction angle of the rockfills). The critical slip surface ② is much shallower than the slip surface in Figure 4, and the minor principal stresses, σ3, at the bases of the slices are much lower (generally less than 200 kPa), and as a result, the corresponding mean values, M(φp), and variances, Var(φp), are both much higher. Moreover, since the variation in the minor principal stresses, σ3, along the slices is much smaller, there are much fewer variations in M(φp) and Var(φp) for the critical slip surface ② than those for the slip surface in Figure 4. It is important to note that, in addition to earthquakes, changes in environmental factors such as water load, humidity, and temperature may also affect the stress state of embankment dams and consequently impact the stability of the slopes. These factors should be taken into consideration when sufficient data are available [36,42].

3.2. Parametric Analysis of Variance Function of Friction Angle

In this section, a parametric analysis is carried out to explore the influence of variation in the parameters a, b, c, and d of the variance function of the friction angle on slope stability. It can be seen from Equation (4) that parameter d is equal to the variance of φp at quite a large σ3, parameter a is the variance of φp at σ3 = 0 subtracting d, and parameters b and c control the decreasing rate of the variance of φp. The higher the parameters a and d are, the greater the variance of φp becomes, while the higher the parameters b and c are, the more rapidly the variance of φp decreases. In order to compare the effects of variation in the parameters on decreasing the slope stability, parameters a and d are increased by 20%, 40%, 60%, and 80%, and parameters b and c are decreased by 20%, 40%, 60% and 80%. Figure 9 shows the influence of variation in parameters a, b, c, and d on the shape of the variance function of the friction angle. It is observed that increasing the value of parameter a only significantly affects the variances, Var(φp), at relatively low σ3 (less than 500 kPa), and increasing the value of parameter d slightly shifts the curve of the variances, Var(φp), upward (because the initial value of parameter d is small). Decreasing the values of parameters b and c reduces the decreasing rate of the variances, Var(φp), and the effect of decreasing the value of parameter c on the decreasing rate of the variances, Var(φp), is more significant than that of parameter b.
Based on the slip surface in Figure 4 and the critical slip surface ② in Figure 7, the slope safety factors were calculated by varying the parameters a, b, c, and d of the variance function of the friction angle and the results are plotted in Figure 10, Figure 11, Figure 12 and Figure 13. Figure 10 shows the reduction in the safety factors with respect to the increase in parameters a and d and the decrease in parameters b and c for the slip surface in Figure 4. It is observed that the variation in parameters b and c affects the slope safety factors obviously more significantly than the variation in parameters a and d. The reason is that the slip surface in Figure 4 is deep beneath the embankment surface, thus the minor principal stresses, σ3, at the bases of the slices are relatively high (14 slices with σ3 greater than 500 kPa). As mentioned before, the influence of the variation in parameter a on the variances, Var(φp), is only significant at σ3 less than 500 kPa, and the influence of the variation in parameter d is negligible; therefore, the slope safety factors are insensitive to the variation in parameters a and d. As shown in Figure 9, the influences of the variation in parameters b and c on the variances, Var(φp), are quite more significant than those of parameters a and d at σ3 greater than 500 kPa. Figure 11 shows the variances, Var(φp), for most slices in the case of decreasing the parameters b and c by 40% are obviously greater than those in the case of increasing the parameters a and d by 40%. Consequently, the slope safety factors are more sensitive to the variation in parameters b and c for the deep slip surface in Figure 4. In contrast, Figure 12 shows that the slope safety factor is only sensitive to the variation in parameter a for the critical slip surface ② in Figure 7 since the slip surface is quite shallower than the one in Figure 4 and the minor principal stresses, σ3, at the bases of the slices are relatively low (generally less than 200 kPa). As shown in Figure 9, for σ3 less than 200 kPa, the variances, Var(φp), rise significantly with the increase in parameter a whereas the variances, Var(φp), change slightly with the variation in parameters b, c, and d. Figure 13 also shows that the increases in the variances, Var(φp), along the slices are quite small in the cases of decreasing the parameters b and c by 40% and increasing parameter d by 40%. Consequently, the slope safety factors are insensitive to the variation in parameters b, c, and d for the relatively shallow slip surface ② in Figure 7.

4. Summary and Conclusions

This paper proposes an approach for the slope stability analysis of rockfill embankments considering stress-dependent spatial variability in the friction angle. The approach is formulated in the framework of Bishop’s simplified method, but the values of the friction angle at the bases of the slices are determined by the stress-dependent mean values, M(φp), and variances, Var(φp), of the friction angle, φp, which are the functions of the minor principal stresses, σ3, at the bases of the slices. The spatial variability in the values of φp is taken into account through the varying variance of φp along the slip surface.
The slope stability analysis of a homogeneous rockfill embankment indicates that the slope safety factors decrease when considering the adverse variation in φp, and the values of M(φp) and Var(φp) at the bases of the slices differ from slice to slice and differ from loading condition to loading condition for the same slip surface. The extent of the variation in Var(φp) along the slip surface diminishes with the decrease in the depth of the slip surface, since the variation in the minor principal stresses, σ3, along the slices becomes smaller. Regarding the illustrative example, the shape of the variance function of φp is significantly influenced by the variation in parameters a, b, and c (a, b, c, and d are the parameters of the variance function in Equation (4)). The parametric analysis reveals that the variation in parameters b and c affects the slope safety factors obviously more significantly than the variation in parameter a for the deep slip surface, since the minor principal stresses, σ3, at the bases of the slices are relatively high, and the influences of the variation in parameters b and c on Var(φp) are quite more significant than those of parameter a at a relatively high σ3, while the slope safety factor is only sensitive to the variation in parameter a for the shallow slip surface, since the minor principal stresses, σ3, at the bases of the slices are relatively low, and only the influence of the variation in parameter a on Var(φp) is significant at relatively low σ3.
The illustrative example demonstrates that the stress-dependent spatial variability of friction angle is obvious in the rockfill embankment, and its effects on slope stability should be considered. However, the proposed approach deals with the stress-dependent spatial variability of the friction angle in a simple way. The combination of large-scale tests or determination methods of material parameters with the proposed approach is expected to be investigated in the future [43,44]. In addition, there are still shortcomings in this study for embankments with complex topographical and geological conditions or reinforcement, and more advanced numerical calculation methods may offer better performance [45].

Author Contributions

Conceptualization, C.R. and Z.W.; Methodology, C.R., Z.Z., X.L., B.G. and Z.W.; Software, Z.Z. and Y.J.; Validation, B.G.; Formal analysis, C.R., B.G. and Y.J.; Investigation, Z.Z., X.L. and Y.J.; Resources, Z.Z. and Z.W.; Data curation, X.L.; Writing—original draft, C.R.; Writing—review & editing, Z.W.; Visualization, Y.J.. All authors have read and agreed to the published version of the manuscript.

Funding

This research is supported by the National Natural Science Foundation of China (No. 52309162) and the Fundamental Research Funds for the Central Universities (YJ202287).

Institutional Review Board Statement

Not applicable.

Informed Consent Statement

Not applicable.

Data Availability Statement

The data presented in this study are available on request from the corresponding author.

Conflicts of Interest

Authors Congyong Ran, Zhengjun Zhou, Binfeng Gong, and Yuanyuan Jiang were employed by the company PowerChina Chengdu Engineering Corporation Limited. The remaining authors declare that the research was conducted in the absence of any commercial or financial relationships that could be construed as a potential conflict of interest.

References

  1. Liu, S.; Sun, Y.; Shen, C.; Yin, Z. Practical nonlinear constitutive model for rockfill materials with application to rockfill dam. Comput. Geotech. 2020, 119, 103383. [Google Scholar] [CrossRef]
  2. Zhou, X.; Chi, S.; Wang, M.; Jia, Y. Study on wetting deformation characteristics of coarse granular materials and its simulation in core-wall rockfill dams. Int. J. Numer. Anal. Methods Geomech. 2020, 44, 851–873. [Google Scholar] [CrossRef]
  3. Qu, Y.; Zou, D.; Liu, J.; Yang, Z.; Chen, K. Two-dimensional DEM-FEM coupling analysis of seismic failure and anti-seismic measures for concrete faced rockfill dam. Comput. Geotech. 2022, 151, 104950. [Google Scholar] [CrossRef]
  4. Liu, D.; Yang, J.; Dong, B. Discrete element analysis of the influence of compaction quality on mechanical properties of rockfill materials. Comput. Geotech. 2022, 151, 104958. [Google Scholar] [CrossRef]
  5. Zhang, H.; Jing, Y.; Chen, J.; Gao, Z.; Xu, Y. Characteristics and causes of crest cracking on a high core-wall rockfill dam: A case study. Eng. Geol. 2022, 297, 106488. [Google Scholar] [CrossRef]
  6. Zhao, X.; Zhu, J.; Wu, Y.; Jia, Y.; Colliat, J.-B.; Bian, H. A Numerical Study on the Influence of Coordination Number on the Crushing of Rockfill Materials. Rock Mech. Rock Eng. 2022, 55, 6279–6300. [Google Scholar] [CrossRef]
  7. Cheng, J.; Ma, G.; Zhang, G.; Chang, X.; Zhou, W. A theoretical model for evaluating the deterioration of mechanical properties of rockfill materials. Comput. Geotech. 2023, 163, 105757. [Google Scholar] [CrossRef]
  8. Yan, S.; Chi, S.; Shao, X.; Guo, Y. Effect of size and strain rate on particle strength and stress–strain properties of rockfill materials. Soil Dyn. Earthq. Eng. 2022, 162, 107422. [Google Scholar] [CrossRef]
  9. Xing, H.; Gong, X.; Zhou, X.; Fu, H. Construction of Concrete-Faced Rockfill Dams with Weak Rocks. J. Geotech. Geoenviron. Eng. 2006, 132, 778–785. [Google Scholar] [CrossRef]
  10. Wu, Z.; Chen, C.; Lu, X.; Pei, L.; Zhang, L. Discussion on the allowable safety factor of slope stability for high rockfill dams in China. Eng. Geol. 2020, 272, 105666. [Google Scholar] [CrossRef]
  11. Wu, G. Earthquake-induced deformation analyses of the upper San Fernando dam under the 1971 San Fernando earthquake. Can. Geotech. J. 2001, 38, 1–15. [Google Scholar] [CrossRef]
  12. Zhang, X.; Wang, C.; Wong, H.; Jiang, T.; Dong, J. Modeling dam deformation in the early stage of internal seepage erosion-application to the Teton dam, Idaho, before the 1976 incident. J. Hydrol. 2022, 605, 127378. [Google Scholar] [CrossRef]
  13. Andjelkovic, V.; Pavlovic, N.; Lazarevic, Z.; Radovanovic, S. Modelling of shear strength of rockfills used for the construction of rockfill dams. Soils Found. 2018, 58, 881–893. [Google Scholar] [CrossRef]
  14. Wu, Z.; Li, Y.; Chen, J.; Zhang, H.; Pei, L. A reliability-based approach to evaluating the stability of high rockfill dams using a nonlinear shear strength criterion. Comput. Geotech. 2013, 51, 42–49. [Google Scholar] [CrossRef]
  15. Xiao, Y.; Liu, H.; Chen, Y.; Jiang, J. Strength and Deformation of Rockfill Material Based on Large-Scale Triaxial Compression Tests. I: Influences of Density and Pressure. J. Geotech. Geoenviron. Eng. 2014, 140, 04014070. [Google Scholar] [CrossRef]
  16. Wu, Z.; Chen, J. Pressure-dependent variability in shear strength of a blasting-quarried granite rockfill material. Soils Found. 2019, 59, 2299–2310. [Google Scholar] [CrossRef]
  17. Heshmati, A.; Tabibnejad, A.; Salehzadeh, H.; Tabatabaei, S.H. Effect of stress conditions on collapse deformation behavior of a rockfill material. KSCE J. Civ. Eng. 2015, 19, 1637–1646. [Google Scholar] [CrossRef]
  18. Xu, M.; Song, E.; Chen, J. A large triaxial investigation of the stress-path-dependent behavior of compacted rockfill. Acta Geotech. 2012, 7, 167–175. [Google Scholar] [CrossRef]
  19. Frossard, E.; Hu, W.; Dano, C.; Hicher, P.Y. Rockfill shear strength evaluation: A rational method based on size effects. Géotechnique 2012, 62, 415–427. [Google Scholar] [CrossRef]
  20. Asadi, R.; Disfani, M.M.; Ghahreman-Nejad, B. A New Modified Replacement Method for Discrete Element Modelling of Rockfill Material. Comput. Geotech. 2024, 168, 106168. [Google Scholar] [CrossRef]
  21. Gupta, A.K. Effects of particle size and confining pressure on breakage factor of rockfill materials using medium triaxial test. J. Rock Mech. Geotech. Eng. 2016, 8, 378–388. [Google Scholar] [CrossRef]
  22. Zhang, W.; Gu, X.; Han, L.; Wu, J.; Xiao, Z.; Liu, M.; Wang, L. A short review of probabilistic slope stability analysis considering spatial variability of geomaterial parameters. Innov. Infrastruct. Solut. 2022, 7, 249. [Google Scholar] [CrossRef]
  23. Wijesinghe, D.R.; Dyson, A.; You, G.; Khandelwal, M.; Ooi, E.T. Image based probabilistic slope stability analysis of soil layer interface fluctuations with Brownian bridges. Eng. Fail. Anal. 2023, 148, 107227. [Google Scholar] [CrossRef]
  24. Jiang, S.; Zhu, G.; Wang, Z.; Huang, Z.; Huang, J. Data augmentation for CNN-based probabilistic slope stability analysis in spatially variable soils. Comput. Geotech. 2023, 160, 105501. [Google Scholar] [CrossRef]
  25. Bardhan, A.; Samui, P. Probabilistic slope stability analysis of Heavy-haul freight corridor using a hybrid machine learning paradigm. Transp. Geotech. 2022, 37, 100815. [Google Scholar] [CrossRef]
  26. Zhang, W.; Wu, J.; Gu, X.; Han, L.; Wang, L. Probabilistic stability analysis of embankment slopes considering the spatial variability of soil properties and seismic randomness. J. Mt. Sci. 2022, 19, 1464–1474. [Google Scholar] [CrossRef]
  27. Li, L.; Li, C.; Wen, J.; Yu, G.; Cheng, Y.; Xu, L. Probabilistic seismic slope stability analysis using swarm response surfaces and rotational Newmark sliding model with primary sliding direction. Comput. Geotech. 2023, 163, 105754. [Google Scholar] [CrossRef]
  28. Zeng, X.; Khajehzadeh, M.; Iraji, A.; Keawsawasvong, S. Probabilistic Slope Stability Evaluation Using Hybrid Metaheuristic Approach. Period. Polytech. Civ. Eng. 2022, 66, 1309–1322. [Google Scholar] [CrossRef]
  29. Pandit, B.; Kumar, A.; Tiwari, G. Assessing the applicability of local and global sensitivity approaches and their practical utility for probabilistic analysis of rock slope stability problems: Comparisons and implications. Acta Geotech. 2023, 18, 2615–2637. [Google Scholar] [CrossRef]
  30. Kafle, L.; Xu, W.; Zeng, S.; Nagel, T. A numerical investigation of slope stability influenced by the combined effects of reservoir water level fluctuations and precipitation: A case study of the Bianjiazhai landslide in China. Eng. Geol. 2022, 297, 106508. [Google Scholar] [CrossRef]
  31. Wang, G.; Zhao, B.; Wu, B.; Zhang, C.; Liu, W. Intelligent prediction of slope stability based on visual exploratory data analysis of 77 in situ cases. Int. J. Min. Sci. Technol. 2023, 33, 47–59. [Google Scholar] [CrossRef]
  32. Deng, D.; Zhao, L.; Li, L. Limit equilibrium slope stability analysis using the nonlinear strength failure criterion. Can. Geotech. J. 2014, 52, 563–576. [Google Scholar] [CrossRef]
  33. Faramarzi, L.; Zare, M.; Azhari, A.; Tabaei, M. Assessment of rock slope stability at Cham-Shir Dam Power Plant pit using the limit equilibrium method and numerical modeling. Bull. Eng. Geol. Environ. 2017, 76, 783–794. [Google Scholar] [CrossRef]
  34. Deng, D.; Zhao, L.; Li, L. Limit equilibrium method for slope stability based on assumed stress on slip surface. J. Cent. South Univ. 2016, 23, 2972–2983. [Google Scholar] [CrossRef]
  35. Johari, A.; Mousavi, S. An analytical probabilistic analysis of slopes based on limit equilibrium methods. Bull. Eng. Geol. Environ. 2019, 78, 4333–4347. [Google Scholar] [CrossRef]
  36. Hu, S.; Zhao, L.; Li, L.; Zuo, S.; Xie, Z.; Qiao, N. Nonlinear analysis of slope stability considering geomaterial dilatancy. Int. J. Geomech. 2024, 24, 04024029. [Google Scholar] [CrossRef]
  37. Bishop, A.W. The use of the Slip Circle in the Stability Analysis of Slopes. Géotechnique 1955, 5, 7–17. [Google Scholar] [CrossRef]
  38. Morgenstern, N.R.; Price, V.E. The Analysis of the Stability of General Slip Surfaces. Géotechnique 1965, 15, 79–93. [Google Scholar] [CrossRef]
  39. National Development and Reform Commission (NDRC). Design Specification for Rolled Earth-Rock Fill Dams (DL/T 5395-2007); China Electric Power Press: Beijing, China, 2007. [Google Scholar]
  40. National Development and Reform Commission, PRC. Chinese Specifications for Seismic Design of Hydraulic Structures (Industry Standard No. DL 5073-1997); China Electric Power Press: Beijing, China, 1997. [Google Scholar]
  41. Chen, Z. Slope stability analysis using nonlinear strength parameters. Water Power 1990, 9, 9–13. (In Chinese) [Google Scholar]
  42. Sali, S.; Noori, K. Assessment of the upstream slope stability of darbandikhan rockfill dam during drawdown. Aro-Sci. J. Koya Univ. 2021, 9, 8–15. [Google Scholar]
  43. Smesnik, M.; Krstic, S.; Verdianz, M. Determination of rockfill shear parameters for dam stability analysis of an embankment dam. In Proceedings of the XVII ECSMGE-2019, Reykjavík, Iceland, 1–6 September 2019. [Google Scholar]
  44. Oggeri, C.; Ronco, C.; Vinai, R. Validation of numerical D.E.M. modelling of geogrid reinforced embankments for rockfall protection. Geam-Geoing. Ambient. Mineraria-Geam-Geoengin. Environ. Min. 2021, 163, 36–45. [Google Scholar]
  45. Honkanadavar, N.; Sharma, K. Testing and modeling the behavior of riverbed and blasted quarried rockfill materials. Int. J. Geomech. 2014, 14, 04014028. [Google Scholar] [CrossRef]
Figure 1. Typical cross section of embankment dams.
Applsci 14 06354 g001
Figure 2. The forces acting on the slice for Bishop’s simplified method and the dynamic distribution coefficient, α, where Ti is the resisting shear force, Ei and Ei+1 are the normal interslice forces, H is the embankment height, h is the height of the centroid of the slice, and αm is the maximum value of α located on the embankment crest.
Applsci 14 06354 g002
Figure 3. The derivation of the formula, Equation (6), for the minor principal stress, σ3 [41].
Applsci 14 06354 g003
Figure 4. A cross section of the rockfill embankment and the fixed slip surface for the computation of slope safety factors.
Applsci 14 06354 g004
Figure 5. The variation in the minor principal stresses, σ3, mean values, M(φp), variances, Var(φp), and design values of φp along the slices for the static loading condition. (a) The minor principal stresses, σ3, mean values, M(φp), and design values of φp along the slices. (b) The minor principal stresses, σ3, and variances, Var(φp) along the slices.
Applsci 14 06354 g005
Figure 6. The variation in the minor principal stresses, σ3, mean values, M(φp), variances, Var(φp), and design values of φp along the slices for seismic loading condition I. (a) The minor principal stresses, σ3, mean values, M(φp), and design values of φp along the slices. (b) The minor principal stresses, σ3, and variances, Var(φp) along the slices.
Applsci 14 06354 g006
Figure 7. The critical slip surfaces for ① seismic loading condition I considering the variability in the friction angle of the rockfills, ② the static loading condition considering the variability in the friction angle of the rockfills, ③ seismic loading condition I not considering the variability in the friction angle of the rockfills, ④ the static loading condition not considering the variability in the friction angle of the rockfills.
Applsci 14 06354 g007
Figure 8. The variation in the minor principal stresses, σ3, mean values, M(φp), variances, Var(φp), and design values of φp along the slices for the critical slip surface ② in Figure 7. (a) The minor principal stresses, σ3, mean values, M(φp), and design values of φp along the slices. (b) The minor principal stresses, σ3, and variances, Var(φp) along the slices.
Applsci 14 06354 g008aApplsci 14 06354 g008b
Figure 9. The influence of variation in parameters a, b, c, and d on the shape of the variance function of the friction angle. (a) The values of b, c, and d are fixed at 0.1, 1.5, and 0.3, respectively. (b) The values of a, c, and d are fixed at 3.5, 1.5, and 0.3, respectively. (c) The values of a, b, and d are fixed at 3.5, 0.1, and 0.3, respectively.(d) The values of a, b, and c are fixed at 3.5, 0.1, and 1.5, respectively.
Applsci 14 06354 g009aApplsci 14 06354 g009b
Figure 10. Variation in the safety factor Fs with a variation in the parameters a, b, c, and d of the variance function for the slip surface in Figure 4.
Applsci 14 06354 g010
Figure 11. Variation in the variances, Var(φp), along the slices for the slip surface in Figure 4.
Applsci 14 06354 g011
Figure 12. Variation in the safety factor Fs with a variation in the parameters a, b, c, and d of the variance function for the critical slip surface ② in Figure 7.
Applsci 14 06354 g012
Figure 13. Variation in the variances, Var(φp), along the slices for the critical slip surface ② in Figure 7.
Applsci 14 06354 g013
Table 1. A summary of the computed minor principal stresses, σ3, and the associated mean values, M(φp), variances, Var(φp), and design values of φp at the bases of the slices for the static loading condition.
Slice No.Not Considering the Variability in the Friction Angle of the RockfillsConsidering the Stress-Dependent Spatial Variability in the Friction Angle of the Rockfills
σ3
(kPa)
M(φp)
(°)
Var(φp)
(°)
Design Value of φp
(°)
σ3
(kPa)
M(φp)
(°)
Var(φp)
(°)
Design Value of φp
(°)
164.72954.1054.169.75753.83.648.1
2216.19749.4049.4226.63349.22.844.2
3364.24547.4047.4374.65247.22.043.0
4504.12846.1046.1511.38846.01.442.5
5634.67945.2045.2637.58545.21.042.2
6755.67644.5044.5754.21944.50.742.0
7867.21944.0044.0862.00144.00.641.7
8969.51543.5043.5961.35843.60.541.5
91055.78243.2043.21045.67443.20.441.3
101048.43643.2043.21038.99343.30.441.3
111004.61343.4043.4996.68843.40.541.4
12948.79943.6043.6942.61843.70.541.5
13881.24843.9043.9877.01243.90.641.7
14802.09644.3044.3799.94844.30.741.8
15711.36644.7044.7711.33344.70.842.0
16608.97145.4045.4610.88245.31.142.2
17494.71746.2046.2498.09746.11.542.5
18368.31447.3047.3372.29747.32.043.0
19229.42249.2049.1232.76049.12.844.1
2077.99353.4053.479.30853.33.647.6
Table 2. A summary of the computed minor principal stresses, σ3, and the associated mean values, M(φp), variances, Var(φp), and design values of φp at the bases of the slices for seismic loading condition I.
Slice No.Not Considering the Variability in the Friction Angle of the RockfillsConsidering the Stress-Dependent Spatial Variability in the Friction Angle of the Rockfills
σ3
(kPa)
M(φp)
(°)
Var(φp)
(°)
Design Value of φp
(°)
σ3
(kPa)
M(φp)
(°)
Var(φp)
(°)
Design Value of φp
(°)
152.55254.9054.956.93754.63.748.9
2179.97550.1050.1189.80949.93.044.7
3307.70348.0048.0318.33847.92.343.4
4430.57346.7046.7438.84446.61.742.7
5546.93945.8045.8551.22545.71.342.4
6656.18845.1045.1656.00245.11.042.1
7758.11344.5044.5753.68144.50.741.9
8852.68144.0044.0844.60844.10.641.8
9933.68443.7043.7922.95143.70.541.6
10931.48843.7043.7921.36443.70.541.6
11896.39443.8043.8887.96643.90.541.7
12850.14644.1044.1843.66544.10.641.8
13792.89444.3044.3788.54444.30.741.9
14724.67644.7044.7722.54644.70.842.0
15645.41745.1045.1645.44945.11.042.2
16554.92945.7045.7556.84845.71.242.4
17452.90046.5046.5456.14246.51.642.7
18338.89247.6047.6342.55747.62.243.2
19212.35549.5049.5215.26449.42.944.3
2072.85753.6053.673.86853.63.647.9
Table 3. A summary of the computed minor principal stresses, σ3, and the associated mean values, M(φp), variances, Var(φp), and design values of φp at the bases of the slices for seismic loading condition II.
Slice No.Not Considering the Variability in the Friction Angle of the RockfillsConsidering the Stress-Dependent Spatial Variability in the Friction Angle of the Rockfills
σ3
(kPa)
M(φp)
(°)
Var(φp)
(°)
Design Value of φp
(°)
σ3
(kPa)
M(φp)
(°)
Var(φp)
(°)
Design Value of φp
(°)
156.81354.6054.661.70954.33.648.6
2194.21849.8049.8205.06749.62.944.5
3331.73947.7047.7343.22247.62.143.2
4463.88446.4046.4472.53646.31.642.6
5588.92145.5045.5593.11045.51.142.3
6706.21844.8044.8705.60244.80.842.0
7815.57044.2044.2810.56744.20.641.8
8916.95443.8043.8908.34243.80.541.6
91003.71143.4043.4992.57543.40.541.4
101001.04943.4043.4990.54943.50.541.4
11963.06243.6043.6954.23843.60.541.5
12913.12143.8043.8906.23443.80.541.6
13851.39344.0044.0846.65844.10.641.7
14777.92644.4044.4775.47844.40.741.9
15692.64644.9044.9692.48344.90.942.1
16595.36045.4045.4597.25745.41.142.3
17485.74446.2046.2489.15246.21.542.6
18363.34147.4047.4367.31347.32.043.1
19227.58149.2049.2230.80649.12.844.2
2078.03053.4053.479.17553.33.647.6
Disclaimer/Publisher’s Note: The statements, opinions and data contained in all publications are solely those of the individual author(s) and contributor(s) and not of MDPI and/or the editor(s). MDPI and/or the editor(s) disclaim responsibility for any injury to people or property resulting from any ideas, methods, instructions or products referred to in the content.

