Article

Optimization of Mode-Switching Quality of Hybrid Tractor Equipped with HMCVT

1
Automotive Engineering Research Institute, Jiangsu University, Zhenjiang 212013, China
2
National Key Laboratory of Special Vehicle Design and Manufacturing Integration Technology, Baotou 014030, China
3
Laboratory of Fluid Power and Mechatronic Systems, Zhejiang University, Hangzhou 310027, China
*
Author to whom correspondence should be addressed.
Appl. Sci. 2024, 14(14), 6288; https://doi.org/10.3390/app14146288
Submission received: 17 May 2024 / Revised: 10 July 2024 / Accepted: 15 July 2024 / Published: 19 July 2024

Abstract

:
During the mode-switching process of a hybrid tractor equipped with a hydraulic-mechanical continuously variable transmission (HMCVT) device, the separation and combination of the clutch will cause transient shocks, affecting the smoothness and driving comfort of the entire vehicle. This article conducts simulation and experimental research on the impact problem when switching from pure electric drive mode to hybrid-power speed coupling mode. Firstly, establish a system dynamics model in SimulationX 3.5 software and build a hardware-in-the-loop (HIL) experimental platform. Secondly, a strategy of “clutch oil pressure fuzzy control + motor torque compensation” is proposed to solve the problem of the slow dynamic response of the engine. Finally, the orthogonal experiment range analysis method and variance analysis method are used to optimize the quality of mode switching, with six clutch-switching time sequences as experimental factors. The simulation results show that adopting the strategy of “clutch oil pressure fuzzy control + motor torque compensation” and optimizing the clutch-switching timing can effectively reduce the amplitude of output shaft speed reduction, dynamic load coefficient, and impact, and shorten the switching time. The comparison between the HIL test results and the simulation results shows that there is a certain difference between the two, but the overall trend is consistent, which verifies the effectiveness of the proposed control strategy and method.

1. Introduction

According to the International Energy Agency (IEA), global energy-related CO2 emissions reached a record high of 37.4 billion tons in 2023, up 1.1% from 2022. With the intensification of global climate change and the increasingly serious problem of global warming caused by greenhouse gas emissions, countries around the world have implemented more stringent emissions regulations for non-road mobile machinery, such as the European Union Stage V standard and the United States Tier 4 standard. Therefore, the development of tractors that meet low emissions standards has become an urgent need [1].
Tractors use mechanical power instead of human and animal power for farming. They are used to improve agricultural production efficiency and can be used to pull and drive operational machinery to complete various agricultural work. Tractors play an important role in agricultural road transportation and field operations. Conventional tractors usually use the engine to drive the mechanical transmission mechanism directly. As a result, the engine is in a state of low load and high emissions for a long time, the fuel economy is poor, and a tractor with a mechanical transmission structure cannot achieve stepless transmission. The shortcomings of pure electric tractors, such as high purchase cost and fast battery decay, have led to the arrival of the era of hybrid power tractors. Therefore, hybrid power as a tractor power source is the best choice at present [2].
Hybrid tractors have a variety of working modes to adapt to different working conditions. In the process of mode switching, the impact load, vibration phenomenon, and power transmission interruption have a negative impact on the smooth operation of the tractor and can even cause damage to the transmission system.
In recent years, many researchers have conducted research on dynamic coordination control, clutch control, and other aspects during the mode-switching process. Shilei Zhou and others from the University of Technology Sydney proposed a closed-loop control strategy based on lqr. The simulation results show that this strategy can ensure maneuverability during vehicle mode switching [3]. Pranay Banerjee and others from Purdue University proposed a unified control strategy based on torque, which can improve the driving experience [4]. Adel Ubered and others from the University of Bejaia proposed two intelligent torque distribution strategies based on particle swarm optimization (PSO) and fuzzy logic control (FLC), which can reduce the transient torque during mode switching [5]. Dou Haishi from Beijing Institute of Technology and others proposed a hybrid dual-flow coupled power system configuration and used the Haar wavelet decomposition method to propose a torque distribution strategy based on power prediction. The hardware-in-the-loop test verified that this control strategy can be effective, reducing torque ripple by 35% [6]. Liu Dongyang and others from Chongqing University proposed a neural network model based on genetic algorithms to improve the accuracy of engine torque estimation [7].
In terms of HMCVT research, Ali H. Shaker from Ruhr University Bochum in Germany conducted in-depth research on the structure, performance, and control methods of HMCVT [8]. Scholars such as NCE E from Turkey’s Tobu University of Economics and Technology, and Rossetti and Antonio from Italy’s University of Padua, analyzed the engine fuel consumption and discussed the advantages of tractors and city buses equipped with HMCVT under various working conditions [9]. L. Viktor Larsson et al. from Linkoping University in Sweden analyzed the dynamic response performance and power distribution rule of the hydraulic-mechanical continuously variable transmission system. A static decoupling multi-input to multi-output control strategy is proposed. The cross-coupling phenomenon existing in the transmission mode switching process is reduced, and the steady-state error caused by cross-coupling is eliminated by replacing the integral element with the feedforward method [10]. Lu Zhixiong et al., Nanjing Agricultural University, combined the full factor analysis method and response surface method to design the shift-impact bench test of the hydraulic-mechanical continuously variable transmission device, establish a mathematical model based on linear regression analysis theory, and determine the optimal operating point under the comprehensive evaluation index of shift quality determined by variance weight [11]. Xia Guang, Hua Yang Ying, and others from Hefei University of Technology verified that wavelet neural network PID can effectively stabilize the tractor speed in the target speed range and improve the tractor’s driving smoothness [12].
The vehicle configurations studied above are hybrid models or transmission tractor models equipped with HMCVT. This article proposes a hybrid tractor equipped with a hydraulic-mechanical continuously variable transmission (HMCVT), which can solve the problem of the engine being in a low-load and high-emission state for a long time. It can also solve the problem that tractors with mechanical transmission structures cannot achieve continuously variable transmission. This paper takes this configuration as the research object and proposes a “clutch oil pressure fuzzy control + motor torque compensation” control strategy to solve the problem of the slow dynamic response of the engine. Based on this strategy, the orthogonal experimental range analysis method and variance analysis method are used to optimize the vehicle mode-switching quality.
The rest of this article follows. Section 2 describes the power transmission system of a hybrid tractor, analyzes the transmission process of the hybrid speed-coupling mode and pure electric mode, and establishes the whole vehicle transmission system model. In Section 3, mode-switching quality evaluation criteria are established. The control strategy of “clutch oil pressure fuzzy control + motor torque compensation” is proposed to solve the problem of the slow dynamic response of engine. In Section 4, based on the control strategy in Section 3, a clutch-switching timing optimization strategy, based on an orthogonal test, is proposed, and the optimal scheme is obtained through simulation analysis. The hardware in the loop test platform is set up for test verification, and the simulation results are compared with the test results. Section 5 summarizes the full text.

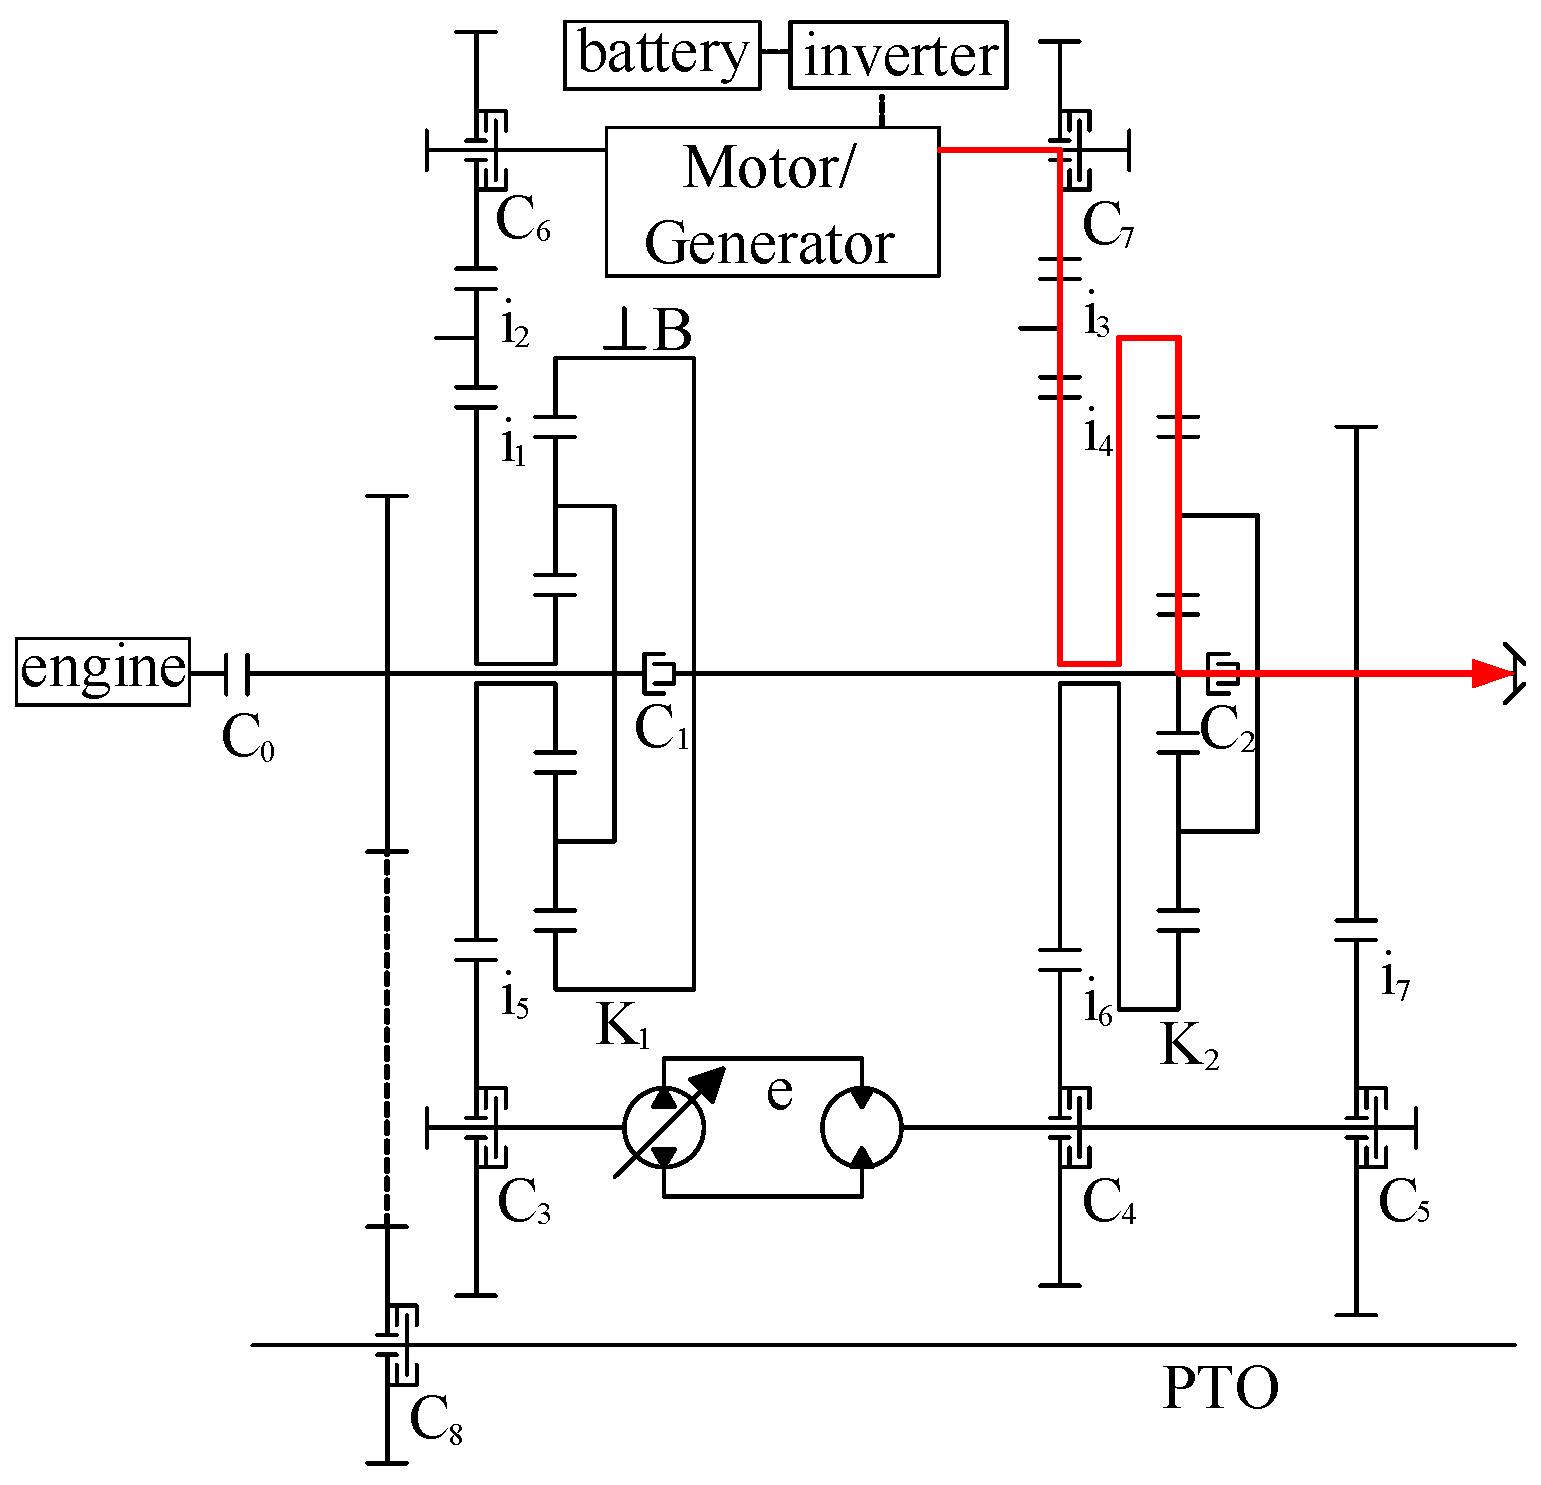
2. Transmission System of Hybrid Tractor

2.1. Transmission Mode Analysis

The hybrid speed-coupling mode is a working mode in which the engine and the motor drive the vehicle together. When the speed required by the vehicle exceeds the maximum speed of the engine and the power supply is sufficient, the system will adopt the hybrid speed-coupling mode to meet the higher speed requirements [13]. In this mode, the engine and motor work together to provide additional power support to ensure that the vehicle can maintain stable and efficient power output at higher speeds.
The transmission route of the hybrid speed-coupling mode is shown in Figure 1. The clutches C0, C3, C4 and C6 participate in this mode. The speed of the motor part and the speed of the engine achieve speed coupling before the front planetary gear mechanism, and the coupled speed is input to the sun wheel of the rear planetary bank, and then coupled again with the speed of the hydraulic part to achieve speed coupling. The speed relationship between its input and output is as follows:
n o = ( k 1 + 1 ) n e n m i 1 i 2 k 1 ( k 2 + 1 ) + k 2 e n m ( k 2 + 1 ) i 1 i 2 i 5 i 6
where k1 and k2 are the characteristic parameters of the front and back planetary rows; e is the displacement ratio of pump and motor; ne is engine speed (r/min); and nm is the motor speed (r/min).
The pure electric high-grade mode is driven by the motor alone, and is mainly used when the tractor demand torque is small and the battery power is sufficient. The tractor starts with the pure electric high-grade mode, which is suitable for make the tractor start quickly as the demand power is small, the endurance is short, and the precision is high.
The transmission route of pure electric high-end mode is shown in Figure 2. When clutches C2 and C7 are engaged, the power provided by the electric motor passes through clutch C7 and fixed gear i3 and then enters the ring gear of the rear planetary row. Because clutch C2 is engaged, the rear planetary row gear mechanism is solidly connected as a whole, and the speed relationship between its input and output is as follows:
n o = n m i 3 i 4
where no is the output shaft speed (r/min); nm is the motor output speed (r/min); and i is the gear pair ratio.

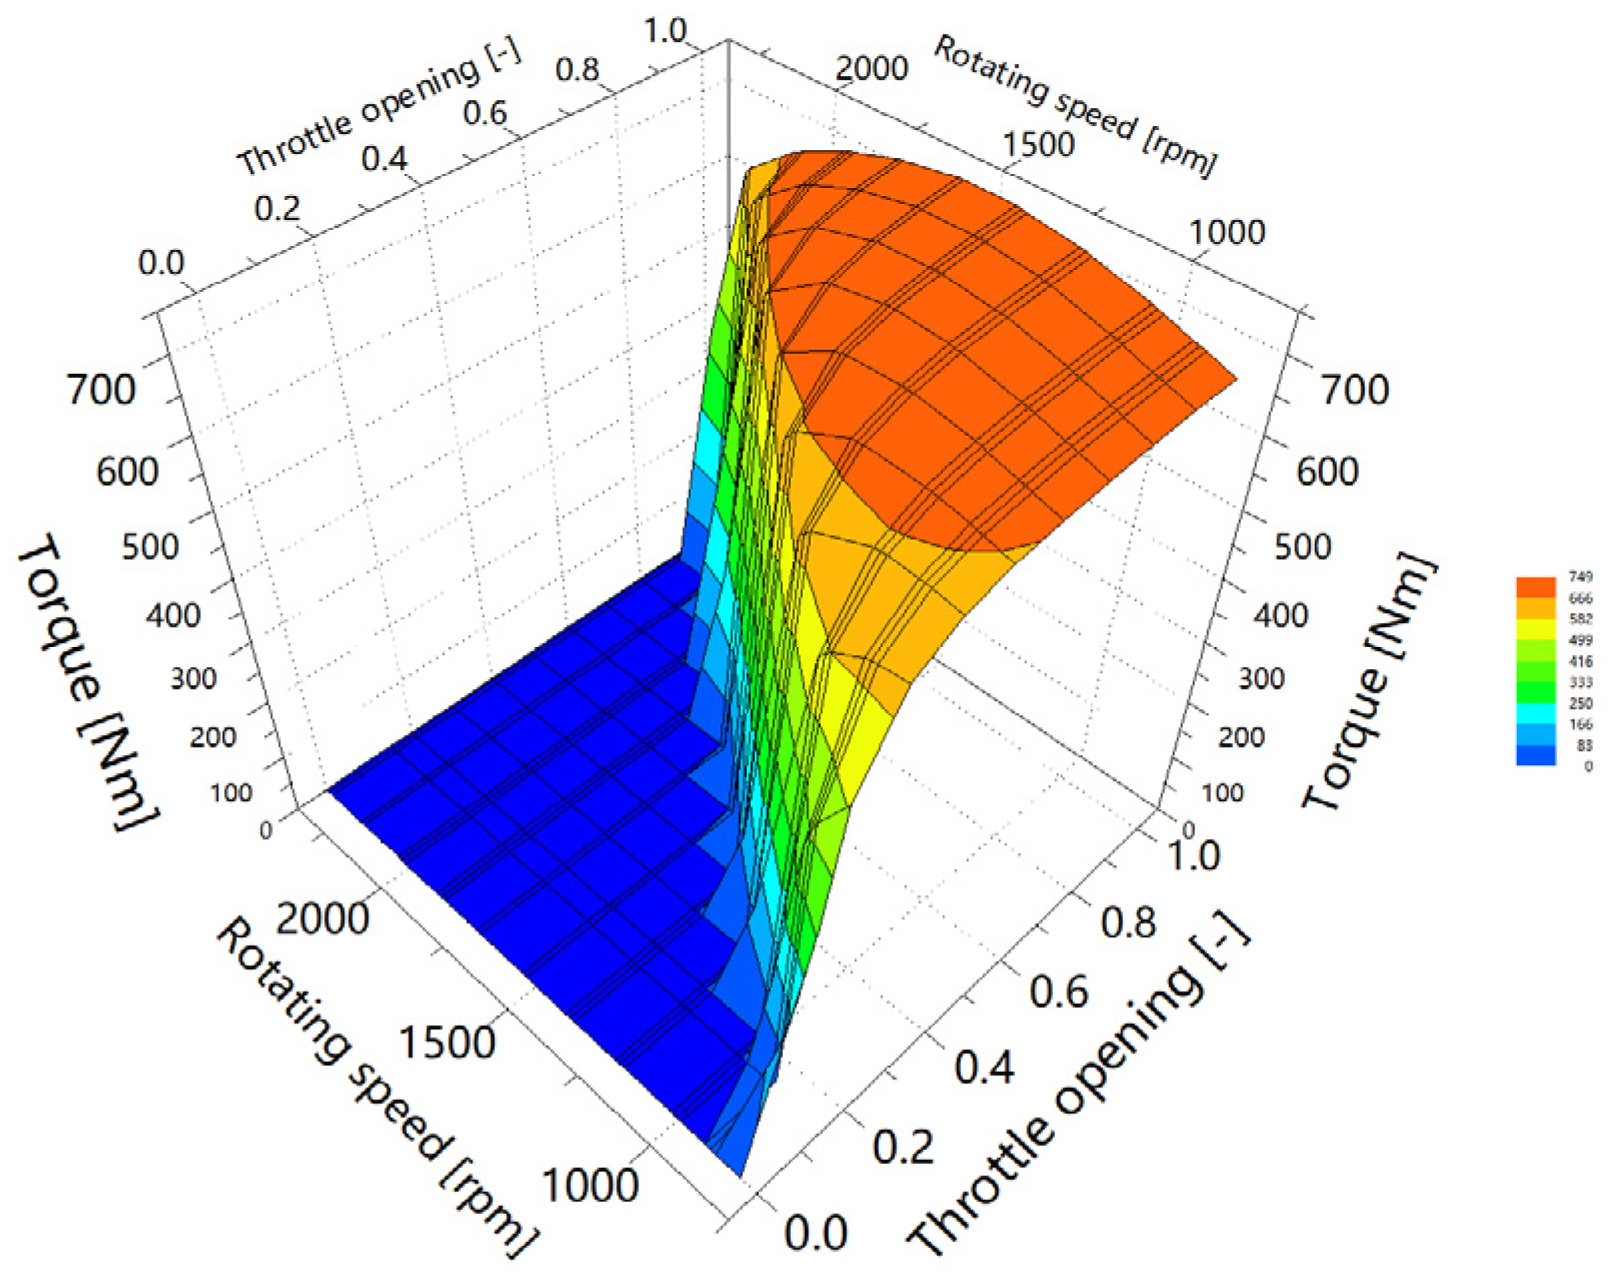
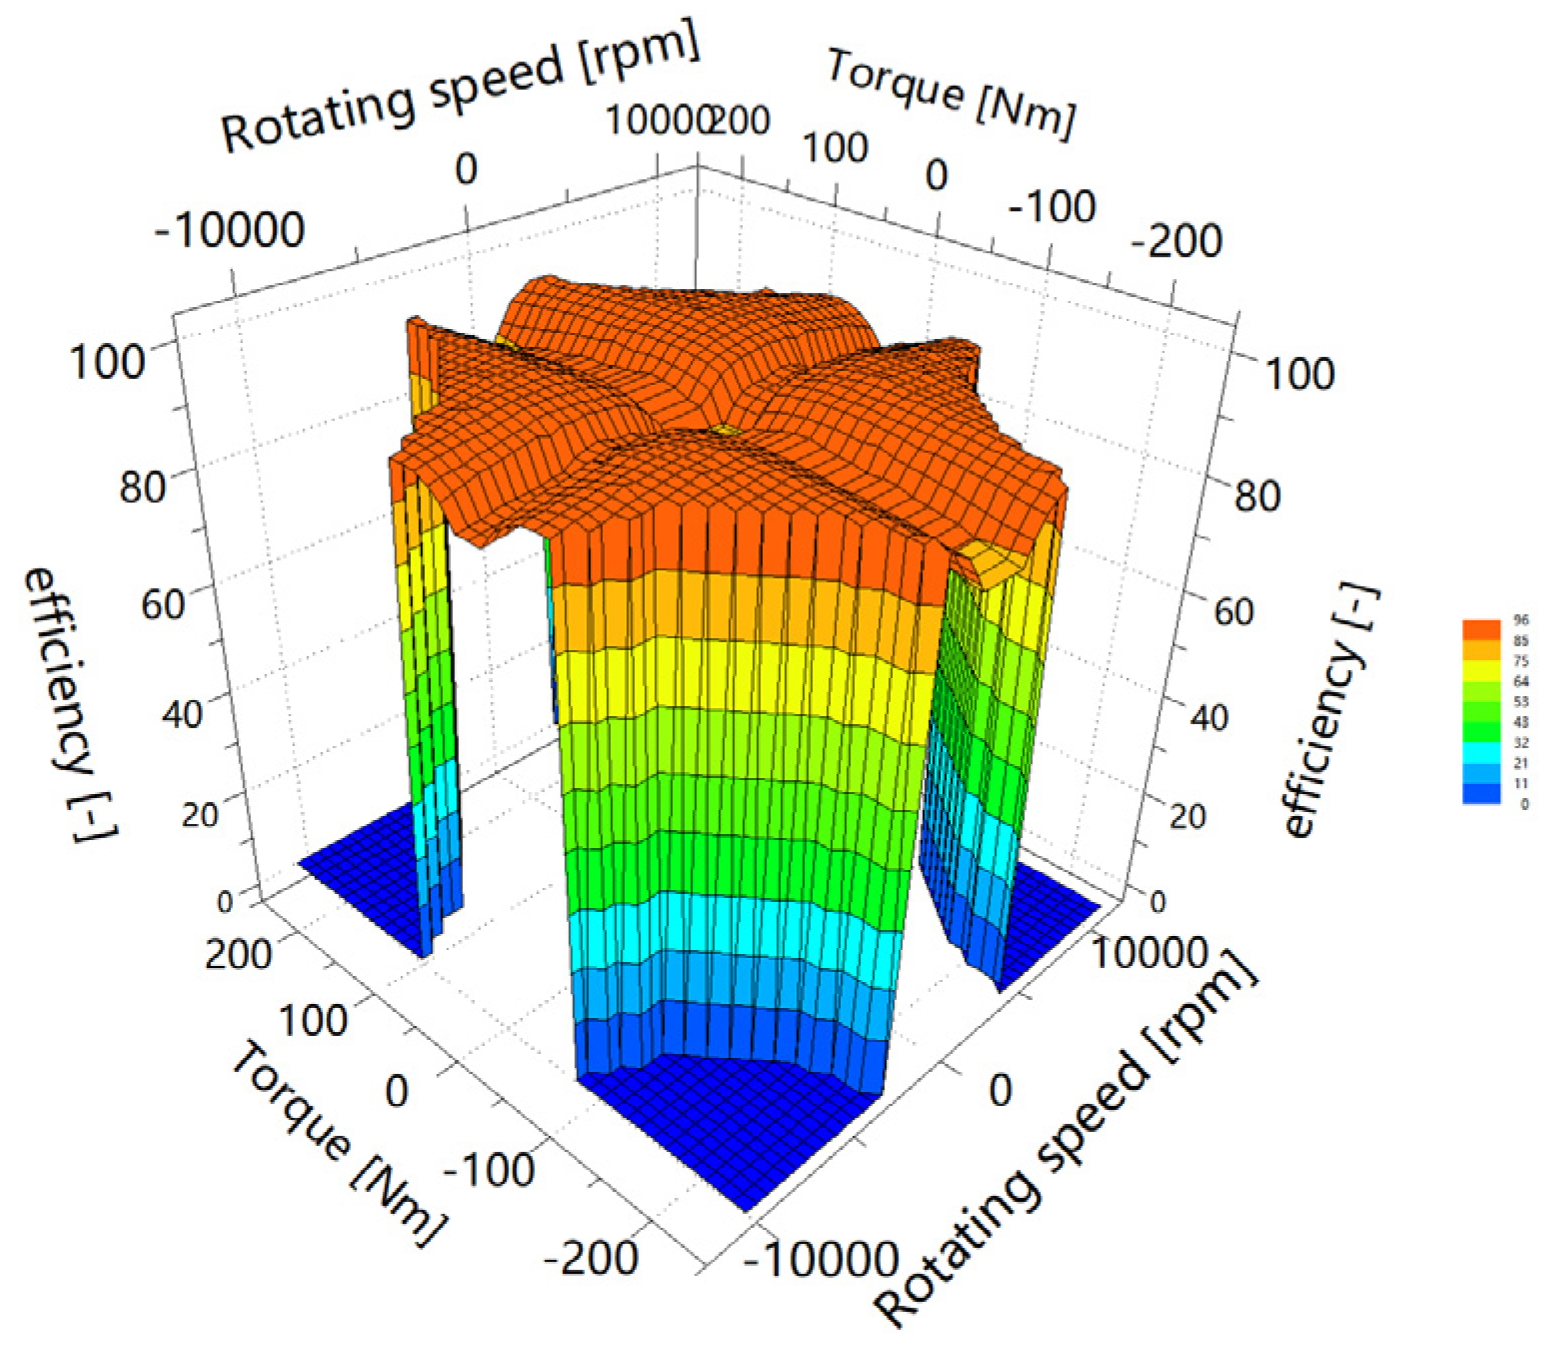
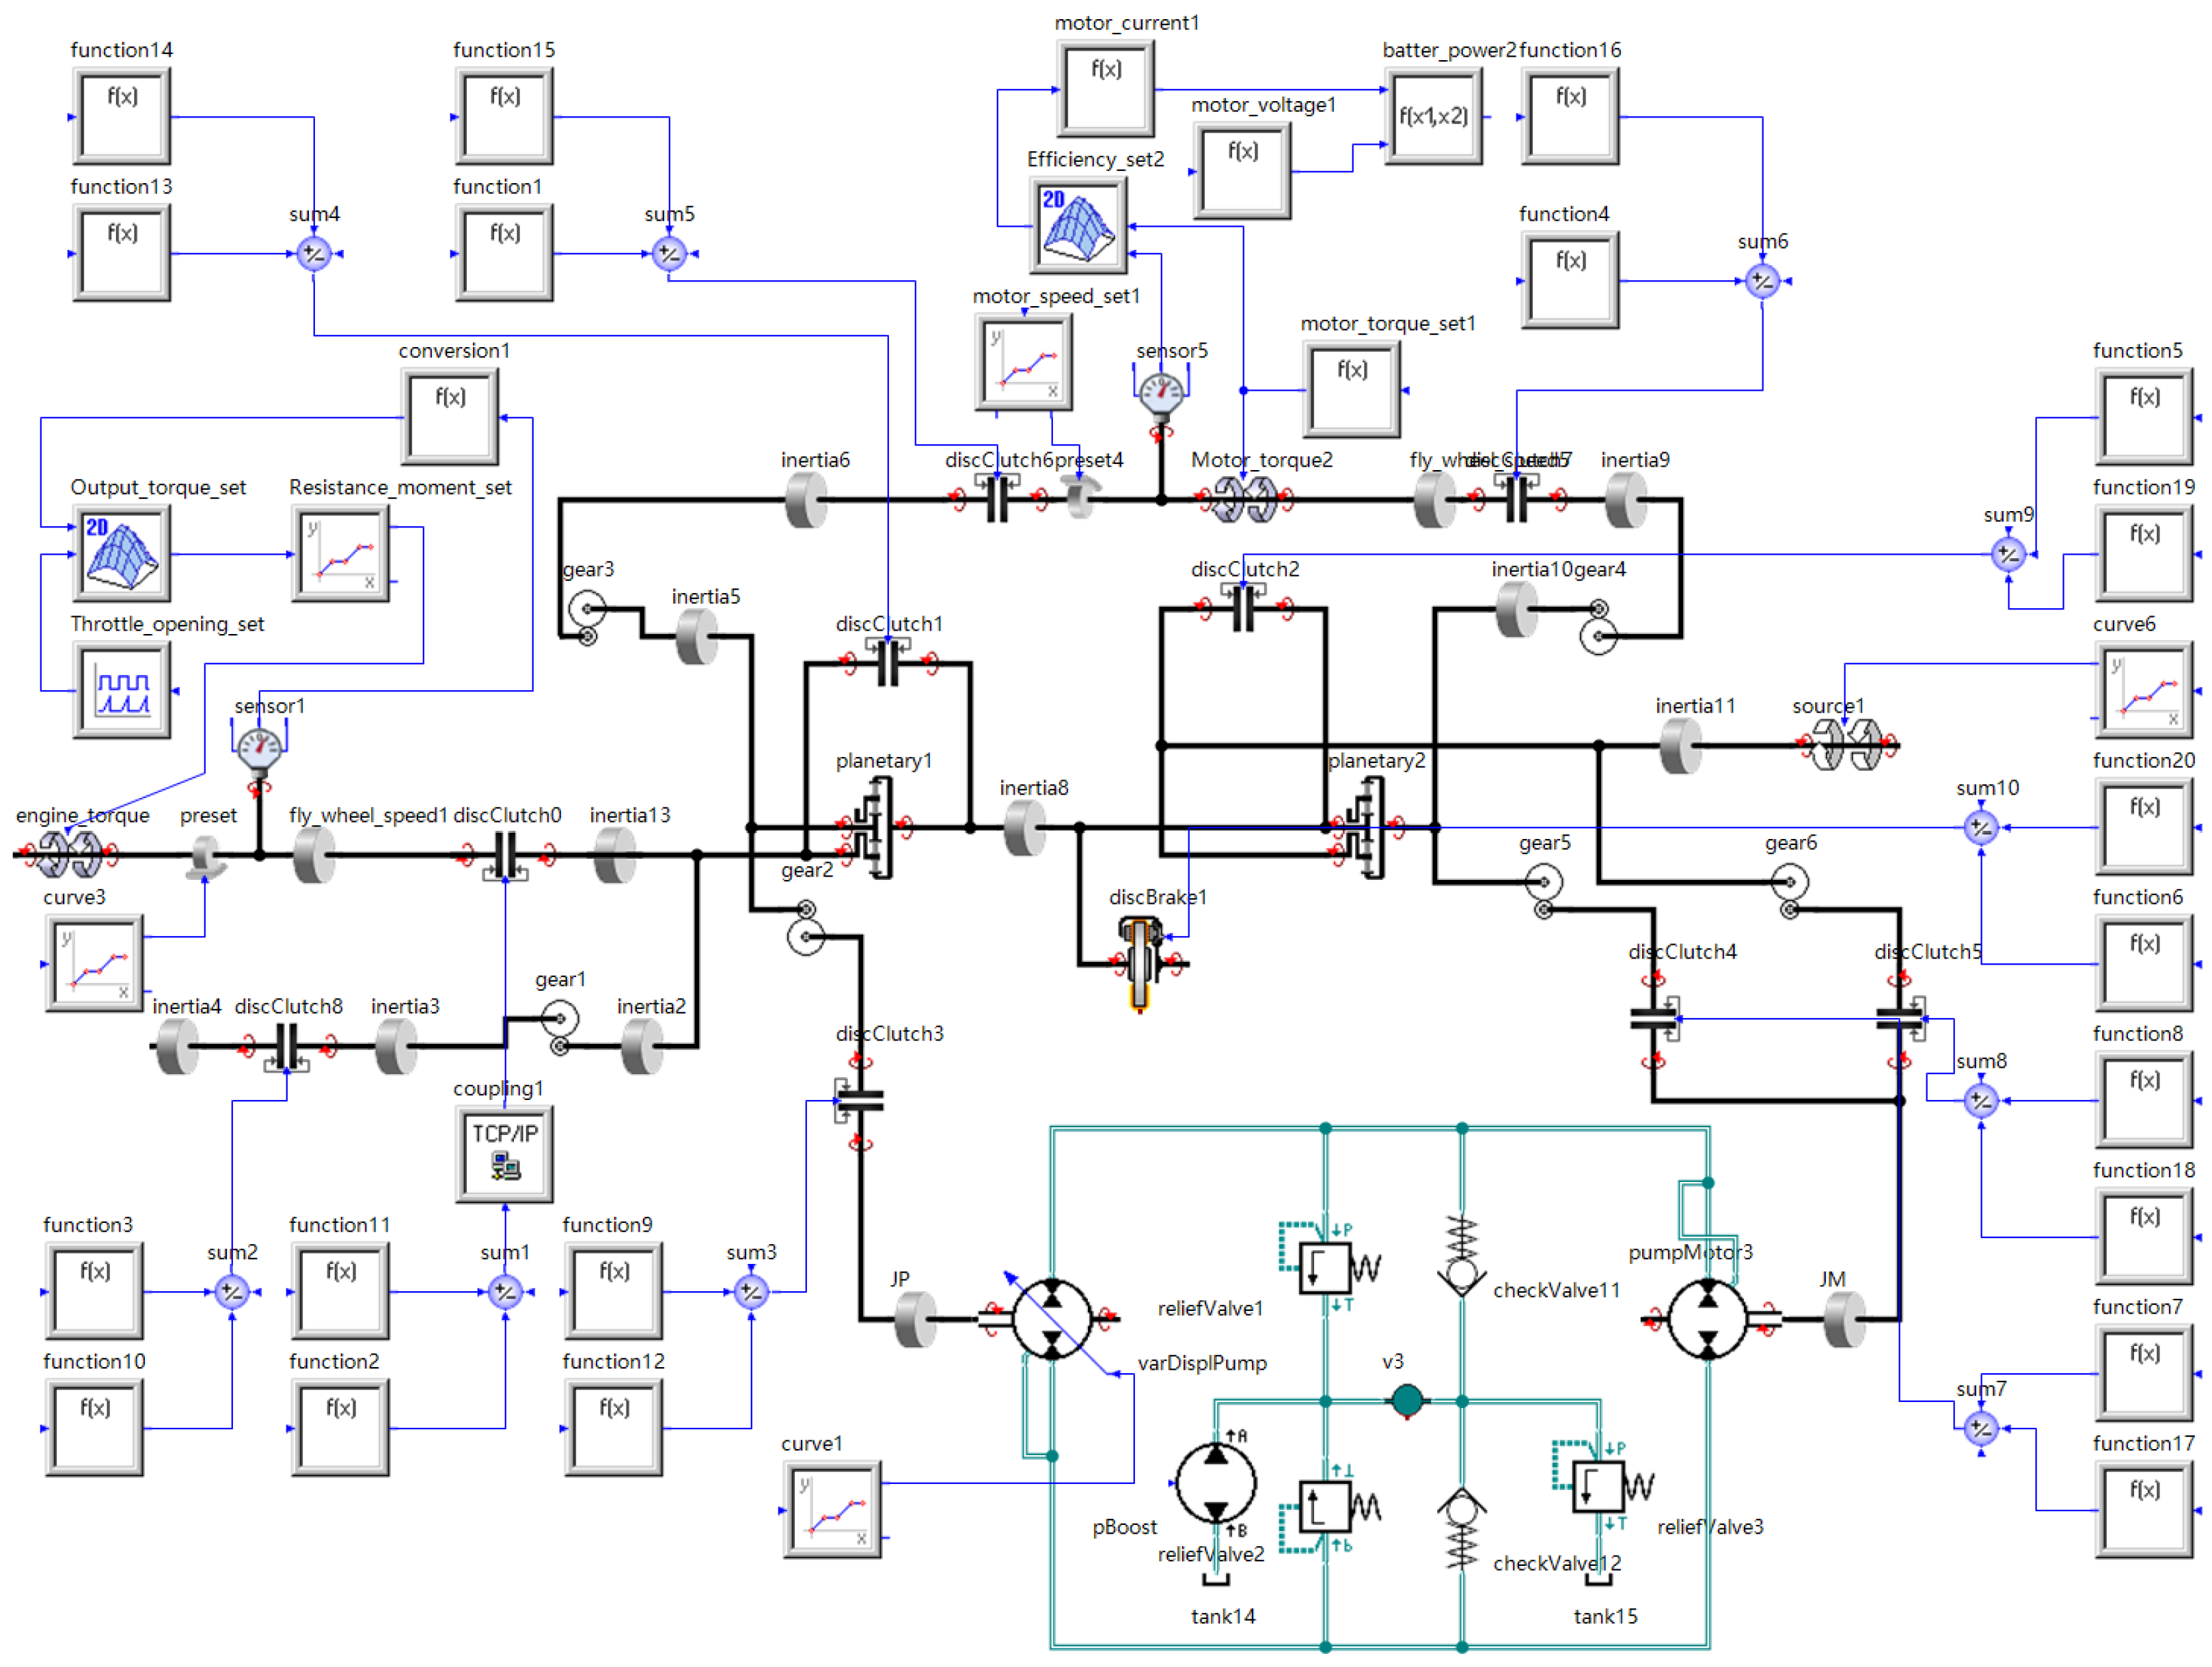
2.2. Power Transmission System Modeling

This engine model adopts the interpolation modeling method based on bench test data, which require little computation and can be quickly modeled [14]. By collecting bench data from a Weichai WP6.180E40 diesel engine and using data interpolation technology, a three-dimensional map of engine output speed, torque, and throttle opening was established. It is shown in Figure 3.
The numerical model of engine output torque can be expressed as:
T e = f 1 ( α , n e )
where α is the throttle opening; Te is the engine torque (N∙m); and ne is the engine speed (r/min).
As another power source of hybrid vehicles, the electric motor plays the role of output driving torque when the vehicle is in pure electric mode and hybrid mode [15]. In this paper, the electric motor’s operation was modeled based on an experimentally determined motor performance map. This maps the steady-state relationship between motor speed, torque, and efficiency. Intermediate points were computed through data interpolation, as shown in Figure 4.
Motor efficiency can be expressed as:
P m = T m n m 9550 η m j
where Pm is the motor efficiency (kW); Tm is the motor output torque (N∙m); nm is the motor speed (r/min); ηm is the motor efficiency; and j is −1 when the motor is used as a driving motor. When the motor is used as a generator, j is 1.
This paper uses the equivalent internal resistance model to integrate the battery into a model consisting of an ideal voltage source Uo and an internal resistance Ro connected in series, as shown in Figure 5 [16].
According to Ohm’s law, the relationship between the output voltage and the output current of a battery is as follows:
U b = U o R o I b
According to Kirchhoff’s second law, the output current of the battery can be obtained:
{ P b = U b · I b = U o I b I 2 b R o I b = U o U o 2 4 P b R o 2 R o
where Pb is the output power of the battery (W); Uo is the open circuit voltage at the battery end (V); Ub is the output voltage of the battery (V); Ib is the battery output current (A); and Ro is the internal resistance of the battery (Ω).
The clutch adopted in this article was a wet clutch, which was mainly composed of a friction plate, a driving plate, a driven plate, an oil cylinder, a piston, and a return spring. The engagement process of the clutch was divided into a separation stage, a sliding stage, and a complete engagement stage, as shown in Figure 6.
t2 to t3 is the clutch slipping stage. Currently, the clutch oil pressure continues to rise, the distance between the driving plate and the driven plate of the clutch becomes zero, the clutch enters the slipping stage, and the clutch begins to transmit friction torque Tc. The friction torque can be expressed as follows:
T c = 2 3 R 2 3 R 1 3 R 2 2 R 1 2 μ z S P
where R1 is the inner radius of the clutch friction plate (m); R2 is the outer radius of the clutch friction plate (m); and μ is the friction factor of the friction plate. z is the number of friction surfaces of the clutch; S is the piston area (m2); and P is the oil pressure (Pa).
SimulationX is a standard tool for evaluating the interactions between all components in technical systems [18]. SimulationX software supports the output of C code and can be revised and compiled according to user needs. C code can be used freely without license restrictions and can realize joint simulation with MATLAB [19]. Figure 7 shows the vehicle simulation model.

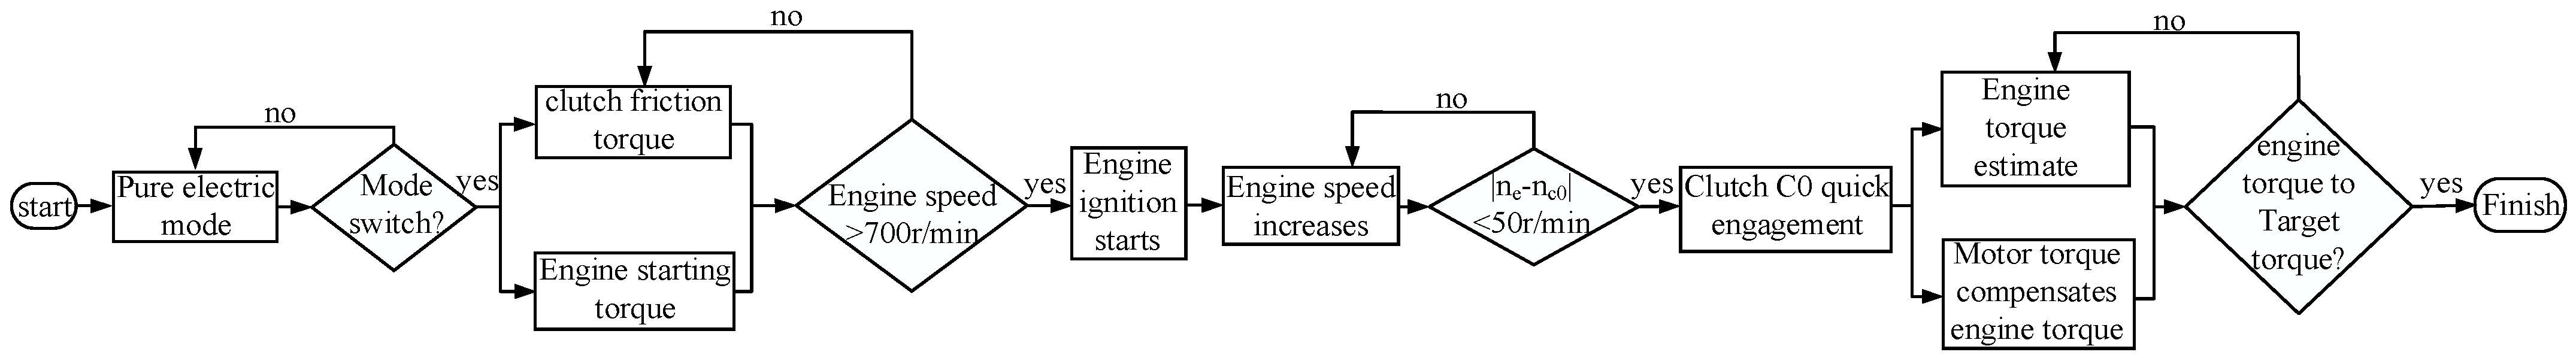
3. Optimization of Control Policy for Driver Source Switching

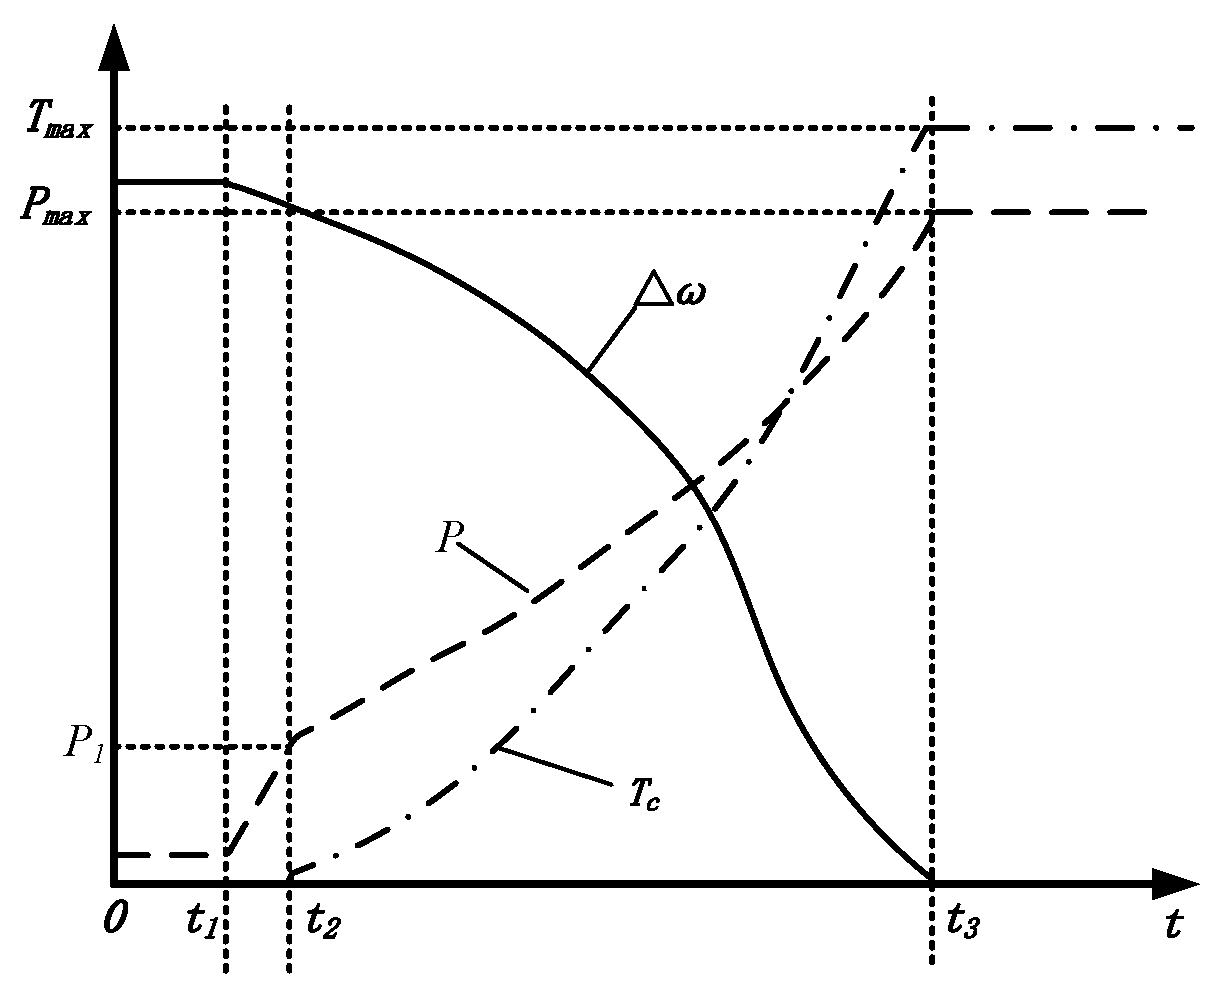
3.1. Evaluation Indicators of Mode-Switching Quality

The velocity drop amplitude of the output shaft is the amplitude of the speed rise and fall of the output shaft during the clutch-switching process, and it is an important indicator reflecting the quality of mode switching [20]. The expression is:
δ = | n ¯ o n o min | n ¯ o
where n ¯ o is the steady output speed of the output shaft (r/min), n o min is the lowest output speed of the output shaft (r/min), and δ is the velocity drop amplitude of the output shaft.
During the mode-switching process, the oil pressure in the clutch fluctuates violently, causing the output shaft torque to change. The output shaft dynamic load coefficient is used to represent the output shaft torque fluctuation amplitude [21]. The expression is:
γ = T o max T ¯ o
where T o max is the maximum torque of the output shaft (N∙m), T ¯ o is the steady-state output torque of the output shaft (N∙m), and γ is the dynamic load coefficient of the output shaft.
The output shaft impact strength describes the rate of change of vehicle acceleration. The smaller the value, the smoother the mode switching. The expression is:
J = d a d t = d 2 v d t 2 = | r q i r d 2 d t 2 ( π n o 30 ) | max
where rq is the radius of the driving wheel (m); ir is the rear axle transmission ratio; and J is the impact strength of the output shaft (m/s3).
Switching time refers to the time it takes for the output shaft speed to reach the next stable moment from the previous stable moment when the mode is switched. This paper takes the time when the output shaft speed reaches 99% of the steady state as the end point of mode switching.

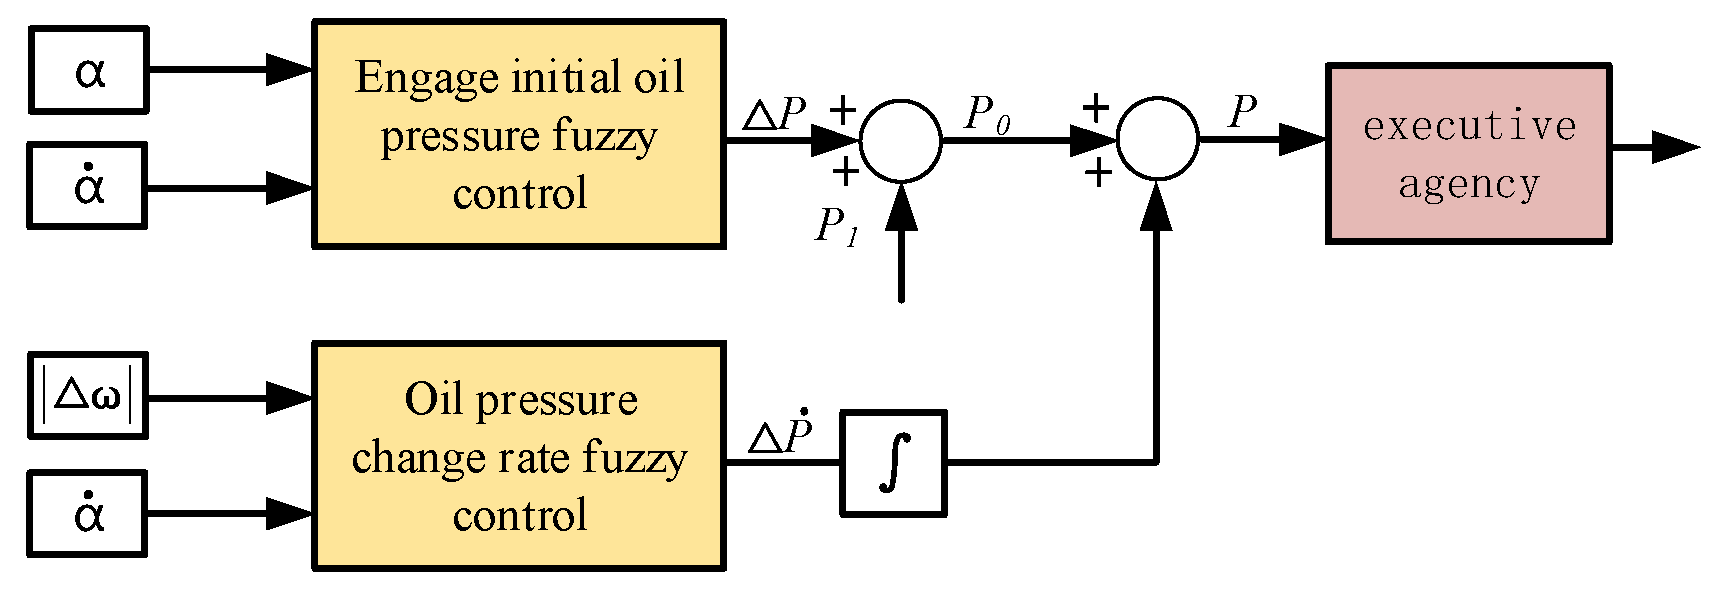
3.2. Fuzzy Control Strategy of Clutch Oil Pressure

To a large extent, the friction torque of the clutch depends on the control of the clutch engaging oil pressure. Accurate control of the clutch requires reasonable adjustment of the size and rate of change of the engaging oil pressure to ensure that the clutch can provide stable and reliable transmission effect during the working process. The adjustment of the initial engaging oil pressure and the oil pressure change rate is very important for the normal operation of the clutch. Proper setting of the initial engaging oil pressure can affect the smoothness and sensitivity of the clutch when starting, while controlling the oil pressure change rate can affect the clutch transition process and transmission efficiency [22].
This paper adopts the fuzzy control strategy of clutch oil pressure, as shown in Figure 8. The fuzzy control system is divided into two parts: initial engaging oil pressure fuzzy control and oil pressure change rate fuzzy control, which can effectively control the engaging process of the clutch.
(1)
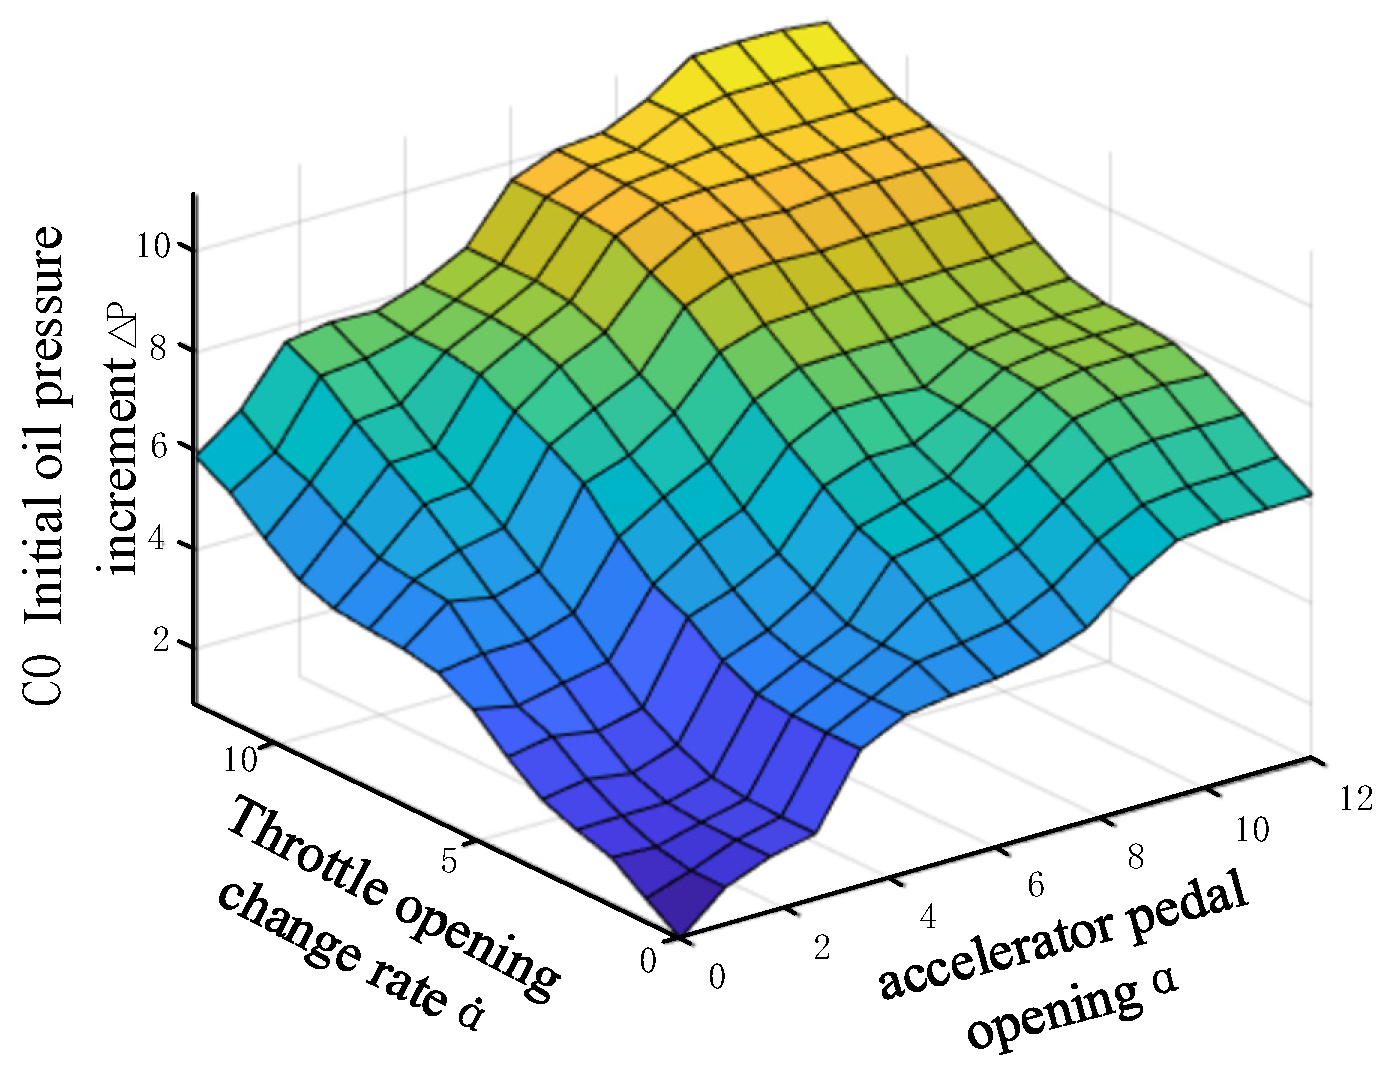
Engaging the initial oil pressure fuzzy control stage.
The gas pedal opening α and the gas pedal opening change rate α ˙ are taken as the input of the initial oil pressure fuzzy control stage, and the initial oil pressure increment ΔP is taken as the output. The initial clutch oil pressure increment ΔP is added to the preset initial engagement oil pressure P1 to obtain the initial clutch engagement oil pressure P0.
P 0 = Δ P + P 1
The Mandani fuzzy controller was adopted to clarify the output fuzzy quantity by the gravity center method, and the rule surface of the initial oil pressure fuzzy control for clutch engagement was obtained, as shown in Figure 9.
(2)
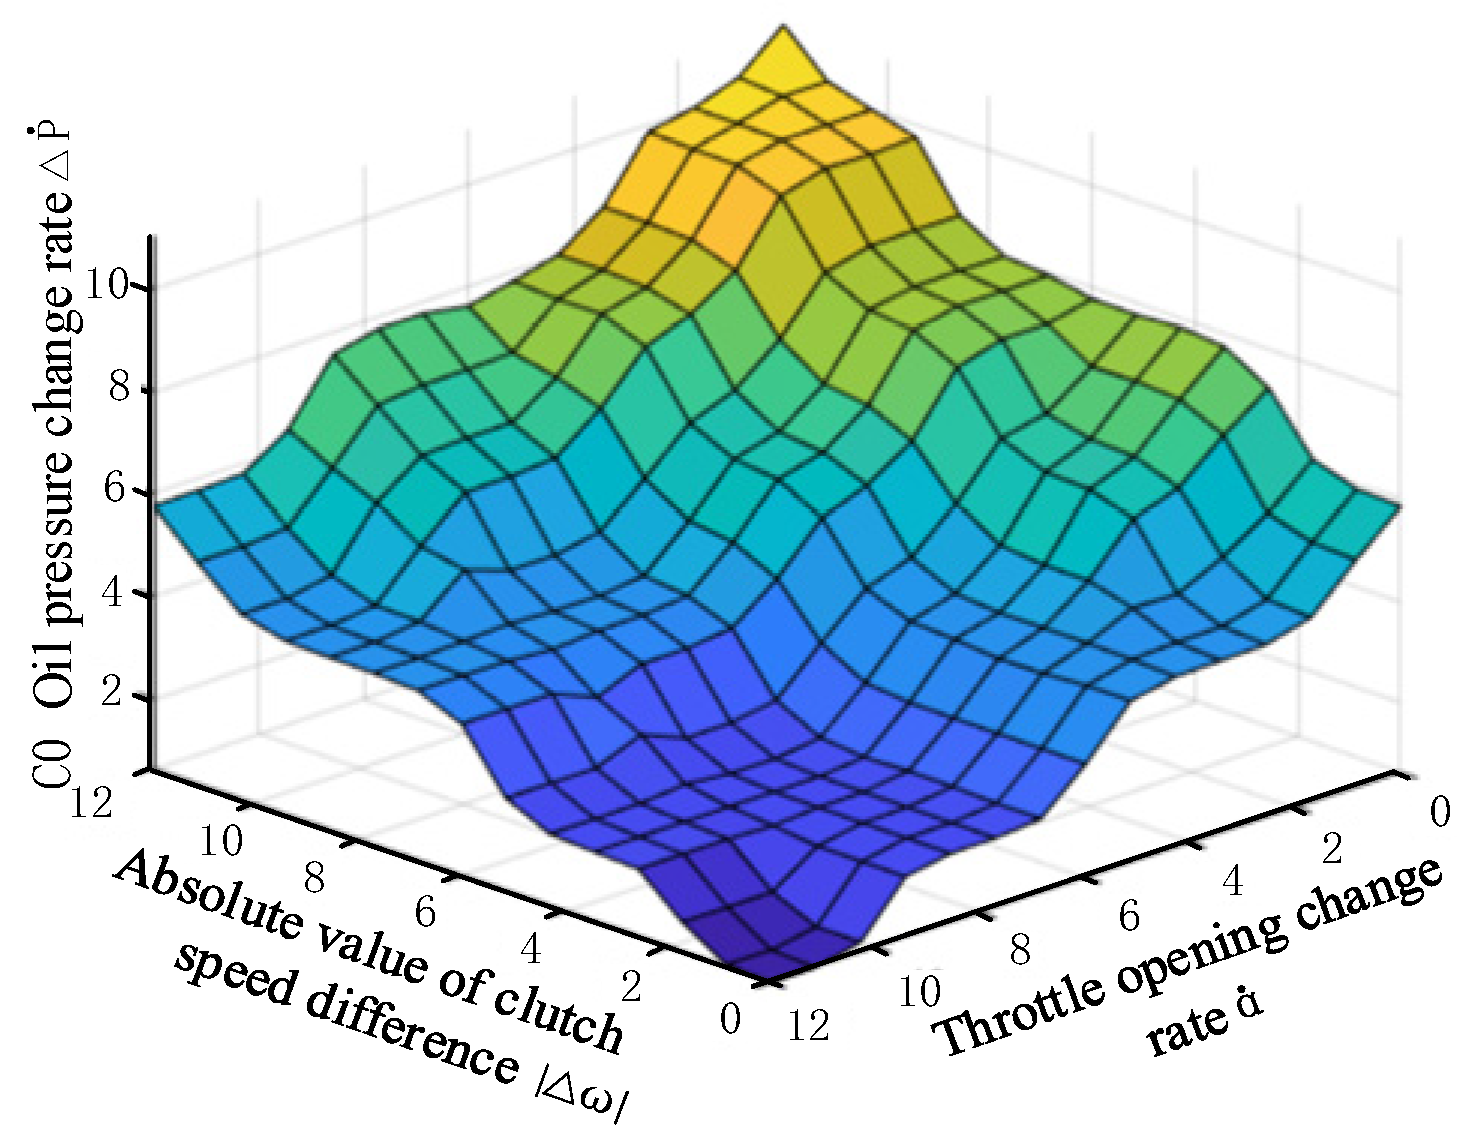
Fuzzy control stage of oil pressure change rate
The accelerator pedal opening change rate α ˙ and the absolute value | Δ ω | of the speed difference between the clutch driving plate and the driven plate are used as the input of the oil pressure change rate fuzzy control stage, and the clutch oil pressure change rate Δ P ˙ is used as the output. The clutch oil pressure P is obtained by integrating the change rate of clutch oil pressure and adding the initial clutch oil pressure P0.
P = P 0 + t 2 t 3 Δ P ˙ d t
where t2 is the start time s of clutch sliding and t3 is the end time s of clutch sliding.
The Mandani type fuzzy controller was used to clarify the output fuzzy quantity using the center of gravity method, and the clutch oil pressure change rate fuzzy control rule surface was obtained, as shown in Figure 10.
When the vehicle starts to switch modes, clutch C0 engages. The friction torque Tc0 transmitted by clutch C0 is controlled by the fuzzy controller. The engine starts to accelerate under the drag of the friction torque Tc0 of clutch C0 and the self-starting torque. To ensure the smooth acceleration of the engine, the fuzzy controller is used to adjust the change rate of the clutch oil pressure at this stage. When the engine speed rises to 700 r/min or so, the engine fires and starts. When the engine speed control is carried out and the engine speed continues to rise to close synchronization with the motor speed, the clutch is quickly engaged [23]. Before the engine ignition and start, the motor should not only maintain the torque required by the vehicle, but also offset the torque Tc0 caused by the friction of the clutch. The target torque Tm_tar of the motor is:
T m _ t a r = T r e q + T c 0
Due to the small torque of the engine after ignition, the engine torque rises slowly, so the motor compensates for the engine torque. Firstly, real-time torque is estimated from the current engine speed and throttle opening in the map in Figure 3. In the motor torque compensation strategy to make the engine quickly rise to the stable torque, the motor target torque is:
T m _ t a r = T r e q + T e _ n o w
where Te_now is the real-time engine torque (N∙m).
Aiming at the process of vehicle switching from pure electric to speed-coupling mode, a control strategy of “clutch oil pressure fuzzy control + motor torque compensation” was proposed, as shown in Figure 11:

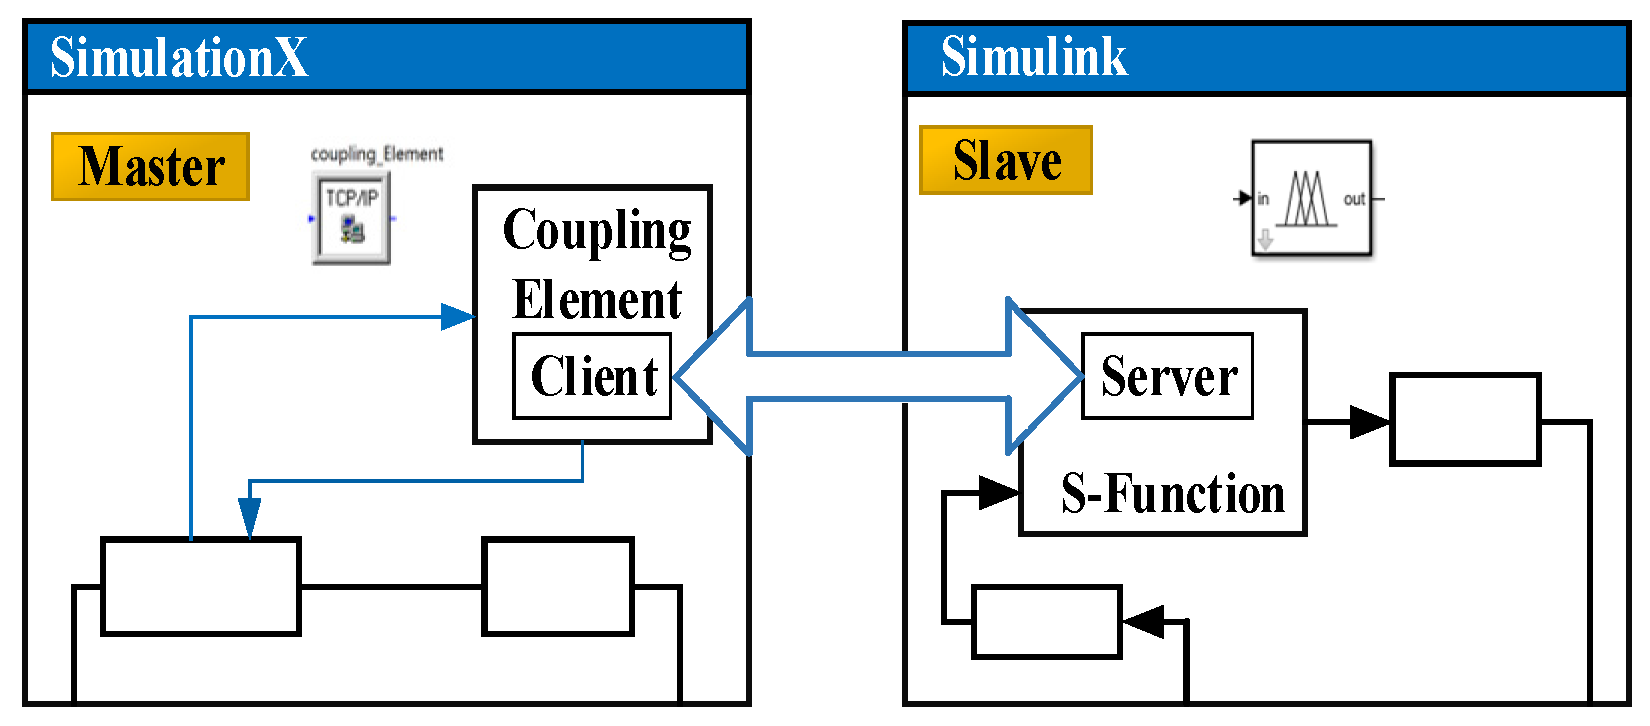
3.3. SimulationX and Matlab/Simulink Interact Analysis

SimulationX software can co-simulate with Matlab/simulink software through TCP/IP protocol [24]. The schematic diagram of interact is shown in Figure 12.
SimulationX 3.5 and Matlab/Simulink 2018a software are used for interact. When starting the simulation, Simulink should be started first, and S-Function should wait for ITI SimulationX to start calculation.
When the pure electric mode is switched to the speed-coupling mode, the control strategy of “clutch oil pressure fuzzy control + motor torque compensation” is not implemented, as shown in Figure 13. According to Formula (8), the velocity reduction of the output shaft is 21.875%. After the control strategy is added, the speed reduction of the output shaft is 18.755%. The results show that the control strategy reduces the velocity drop by 3.12%.
The pure electric mode is switched to the speed-coupling mode when it is not coordinated, as shown in Figure 14. The maximum output torque of the output shaft is 847.29 N∙m, and the dynamic load coefficient of the output shaft is 8.473, according to Formula (9). After the control strategy is implemented, the maximum output torque of the output shaft is 757.29 N∙m, and the corresponding dynamic load coefficient is 7.573. The results show that the dynamic load coefficient of the output shaft decreases from 8.473 to 7.573 after the control strategy is implemented, and the optimization effect of the control strategy for the dynamic load coefficient of the output shaft is 10.622%.
When the pure electric mode is switched to the speed-coupling mode without coordination, as shown in Figure 15, the impact strength of the output shaft is calculated to be 26.181 m/s3, and after the control strategy is implemented, the impact strength of the output shaft is 21.581 m/s3. The results show that the impact strength of the output shaft decreases from 26.181 m/s3 to 21.581 m/s3 after the implementation of the control strategy, but the impact strength is still not up to the lowest impact strength standard |J| ≤ 17.64 m/s3 in China.
When the pure electric mode is switched to the speed-coupling mode, the switching time is 1.345 s without coordination and 1.301 s with coordination. The results show that the optimization degree of switching time after implementing coordination is 3.27%.
According to the above results, the control strategy of “clutch oil pressure fuzzy control + motor torque compensation” can reduce the impact strength of output shaft, dynamic load coefficient, velocity drop amplitude, and switching time. Although mode-switching quality has improved, the improvement is limited. This is because the whole mode-switching process does not only involve the engagement and disengagement of clutch C0. The other clutches involved also have an impact strength on the rating indicators.

4. Clutch-Switching Timing Optimization Based on an Orthogonal Test

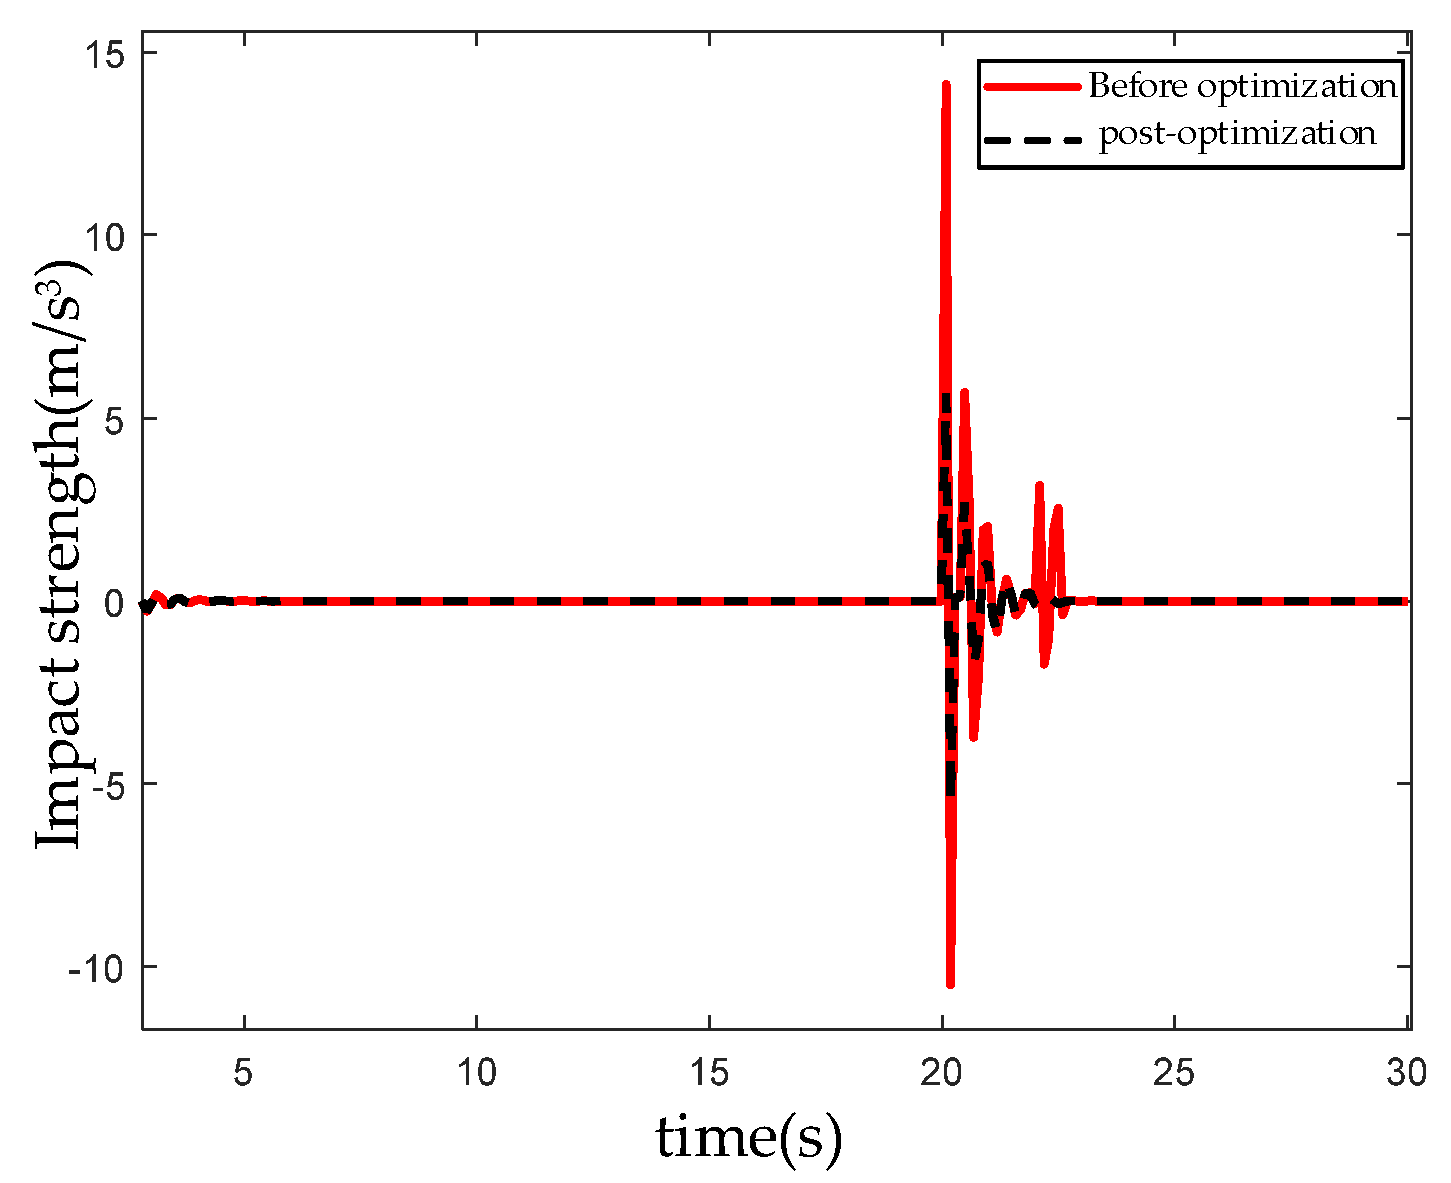
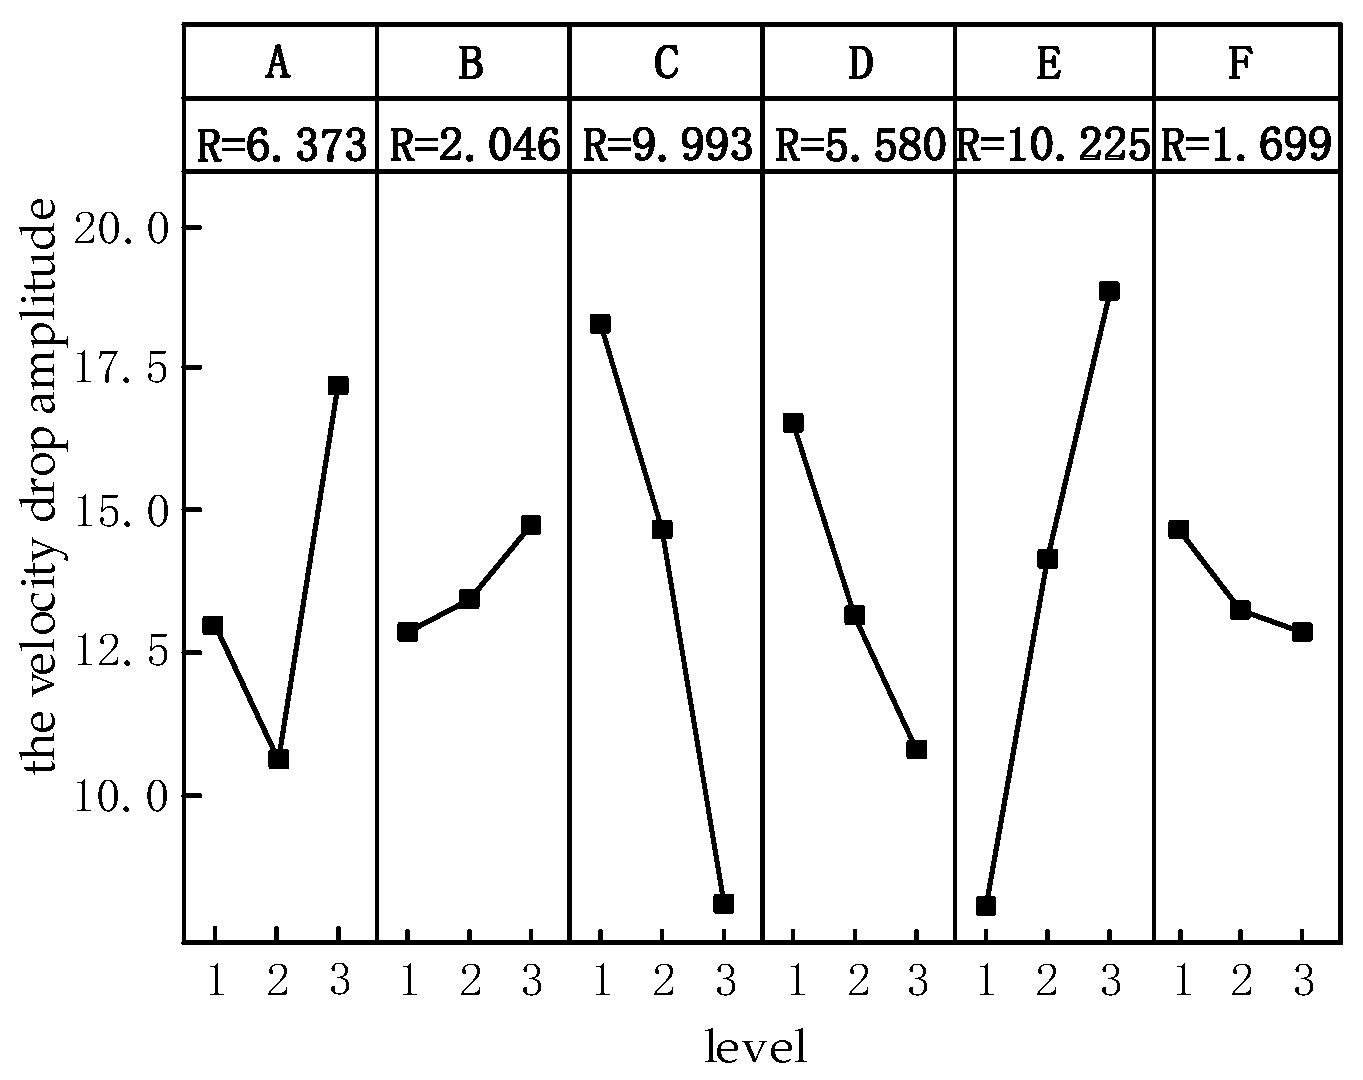
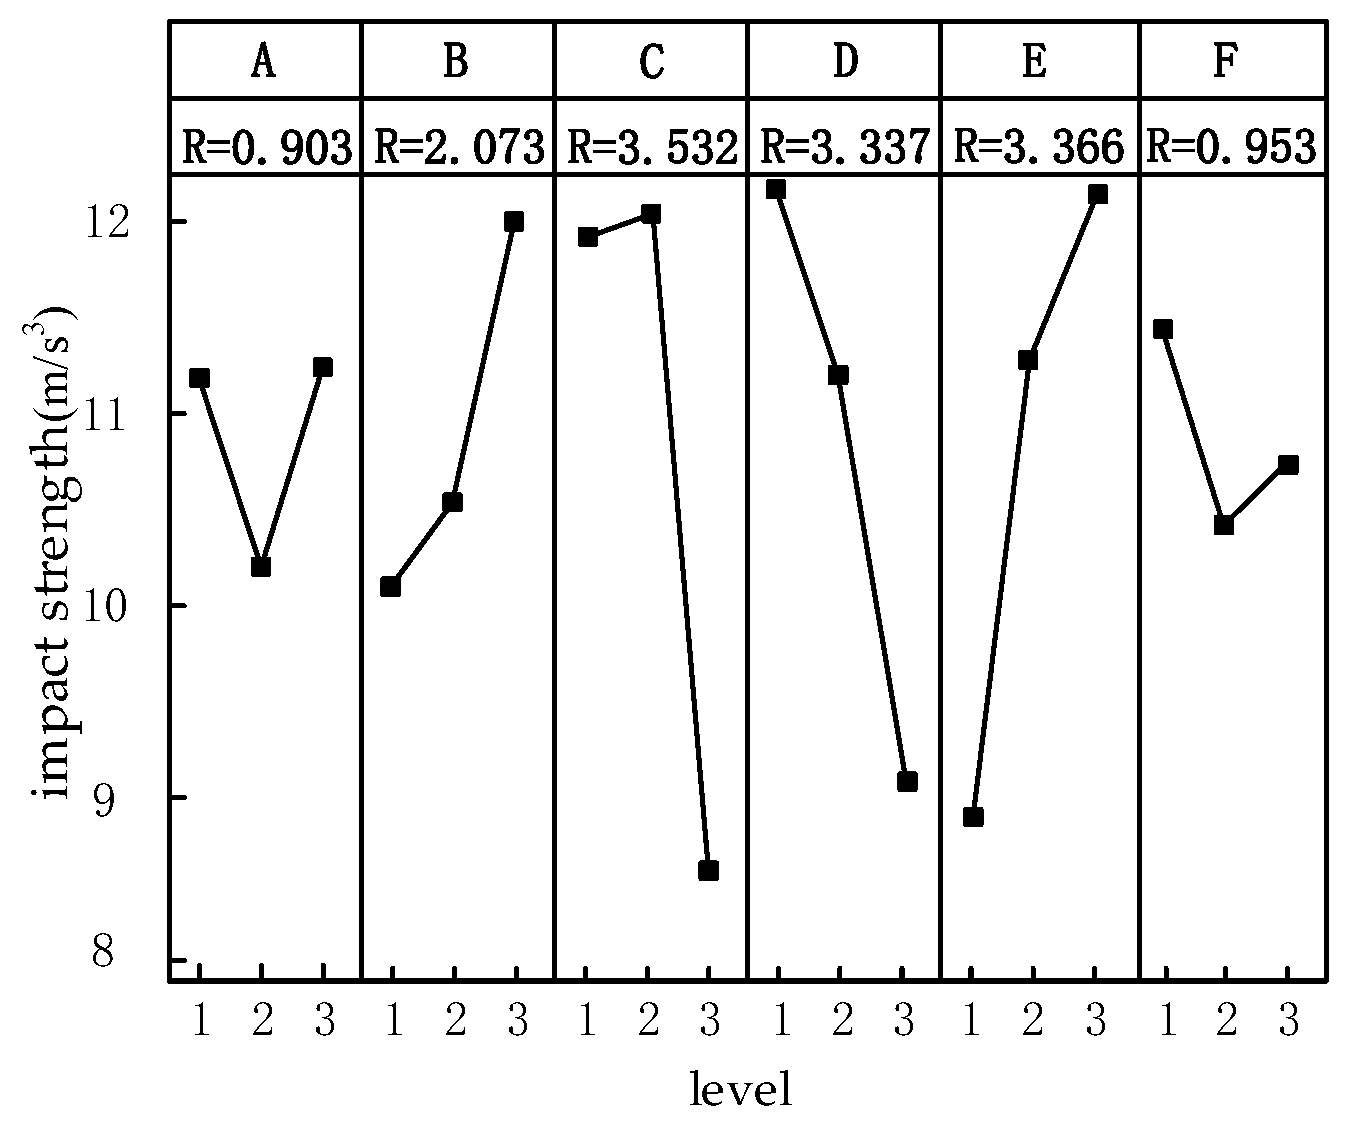
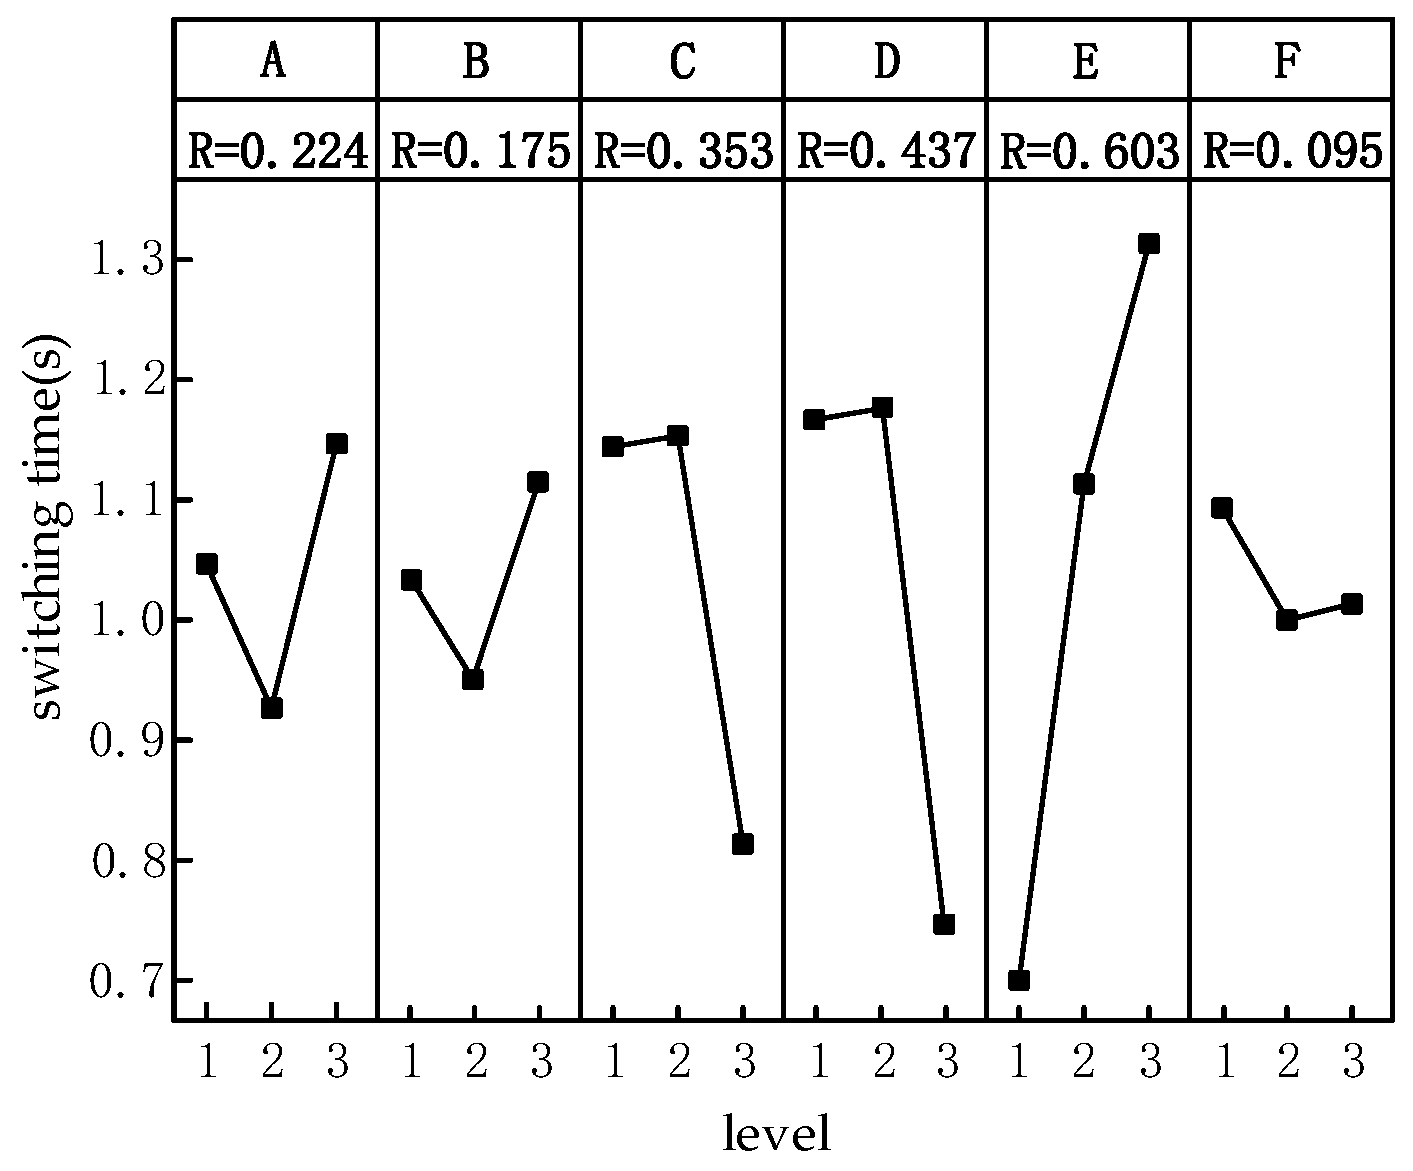
4.1. Analyze Simulation Results Using Range Method

The whole mode-switching process involves the engagement and closing of six clutches. A comprehensive test for all clutches in the mode-switching process is not only computationally heavy but also requires a lot of simulation time. To solve this problem, based on the control strategy of “clutch oil pressure fuzzy control + motor torque compensation”, this paper uses an orthogonal test to optimize the mode-switching quality.
The six clutches involved in mode switching were C0, C2, C3, C4, C6, and C7. The switching time sequence of the six clutches involved was taken as factors A, B, C, D, E, and F in the range analysis of the orthogonal test, with no interaction between the factors [25]. The whole simulation time was set to 30 s; 20 s was used as the just-in-time switching point; and the three levels were 0.5 s in advance, 0.5 s in time switching, and 0.5 s in delay switching of each clutch. Output shaft velocity drop, dynamic load coefficient of output shaft, impact strength, and switching time were used as evaluation indexes I, II, III, and IV, respectively. Using L27(36) orthogonal table to arrange the simulation, a total of 27 simulations needed to be completed, and MINITAB was used for range analysis [26].
The analysis results of the velocity drop amplitude of the output shaft by the range method are shown in Figure 16, where R represents the range value. The analysis results show that the switching sequence of clutch C6 had the greatest influence on the velocity drop amplitude of the output shaft, and the switching sequence of clutch C7 had the least influence. The optimal scheme was E1C3A2D3B1F3. From the point of view of the range value, clutches C6, C3, C0, and C4 played a major role, and clutches C2 and C7 played a certain role. Therefore, the combination of E1C3A2D3 can meet most of the working conditions, and the speed reduction can be reduced from 18.755% to 1.217%, which indicates that the gear shift without speed fluctuation can be achieved at a certain time.
The analysis results of the dynamic load coefficient of the output shaft by the range method are shown in Figure 17, where R represents the range value. The analysis results show that the switching time sequence of clutch C6 had the greatest influence on the dynamic load coefficient of output shaft, and the switching time sequence of clutch C2 had the least influence. The optimal scheme was E1C3D3F2A3B3. From the point of view of the range value, clutches C6, C3, C4, and C7 played a major role, and clutches C0 and C2 played a certain role. Therefore, the combination of E1C3D3F2 can meet most of the working conditions, and the dynamic load coefficient can be reduced from 7.573 to 2.715.
The impact strength analysis results of the range method on the output shaft are shown in Figure 18, where R represents the range value. The analysis results show that the switching sequence of clutch C3 had the greatest influence on the impact strength of output shaft, and the switching sequence of clutch C4 had the least. The optimal scheme was C3A1E1F2B1D3. From the point of view of the range value, clutches C3, C0, C6, and C7 played the main role, and clutches C2 and C4 played a certain role. Therefore, the combination of C3A1E1F2 can meet most of the working conditions, and the upper limit of the impact strength can be reduced from 21.581 m/s3 to 7.21 m/s3, meeting the Chinese impact strength standard |J| ≤ 17.64 m/s3.
The analysis results of mode-switching time by range method are shown in Figure 19, where R represents range value. The results show that the clutch C6 switching sequence had the greatest influence on the switching time, and the clutch C7 switching sequence had the least influence. The optimal scheme was E1D3C3A2B2F2. From the point of view of the range value, clutches C6, C4, C3, C0, and C2 played the main role, and clutch C7 played a small role, so the combination of E1D3C3A2B2 can meet most of the working conditions and can reduce the upper limit of the switching time from 1.301 s to 0.18 s.
Based on the above analysis results, there are differences in the degree and level of influence of factor A on each evaluation index. Therefore, it is difficult to simply predict at which level factor A has the optimal influence on the comprehensive quality. Other factors can easily predict the switching timing of B1C3D3E1F2 and obtain better mode-switching quality when the output shaft velocity drop amplitude, dynamic load coefficient, impact strength, and switching time of the output shaft are relatively small.
To obtain the optimal switching sequence, A1B1C3D3E1F2, A2B1C3D3E1F2, and A3B1C3D3E1F2 were simulated and verified as Scheme 1, Scheme 2, and Scheme 3, respectively. The results are as follows.
The rotation speed of the output shafts of Scheme 1, Scheme 2, and Scheme 3 is shown in Figure 20. The corresponding speed reduction amplitude of the three is 1.2%, 1.225%, and 1.63%, respectively. Among the three schemes, Scheme 1 has the best optimization degree for the velocity drop amplitude of the output axis.
The output shaft torque of Scheme 1, Scheme 2, and Scheme 3 is shown in Figure 21. The corresponding dynamic load coefficients of the output axes are 3.01, 2.98, and 2.72, respectively. Among the three schemes, Scheme 3 optimizes the dynamic load coefficient of the output shaft best.
The impact strength of the output shafts of Scheme 1, Scheme 2, and Scheme 3 is shown in Figure 22. The maximum impact strength of the output shafts corresponding to the three are 7.99 m/s3, 7.21 m/s3, and 7.08 m/s3, respectively. Among the three schemes, Scheme 3 optimizes the impact strength of the output shaft best, but it is far below the Chinese impact strength standard |J| ≤ 17.64 m/s3.
The switching time of the output axis in Scheme 1, Scheme 2, and Scheme 3 is 0.525 s, 0.42 s, and 0.35 s respectively. Among the three schemes, Scheme 3 has the best optimization degree for the switching time of the output axis.
After comprehensive analysis of all simulation results of Scheme 1, Scheme 2, and Scheme 3 above, the output shaft dynamic load coefficient, impact strength, and switching time of Scheme 3 are all the best among the three; therefore, Scheme 3, A3B1C3D3E1F2, is the best scheme. The output shaft velocity drop amplitude is reduced from 18.755% to 1.63%, the dynamic load coefficient is reduced from 7.573 to 2.72, the impact strength is reduced from 21.581 m/s3 to 7.08 m/s3, and the switching time is reduced from 1.301 s to 0.35 s. The above results show that the simulation results of the optimal scheme have significantly improved the mode-switching quality compared with the mode switching of all clutches simultaneously. The correctness of the optimal scheme of clutch-switching timing prediction is verified.

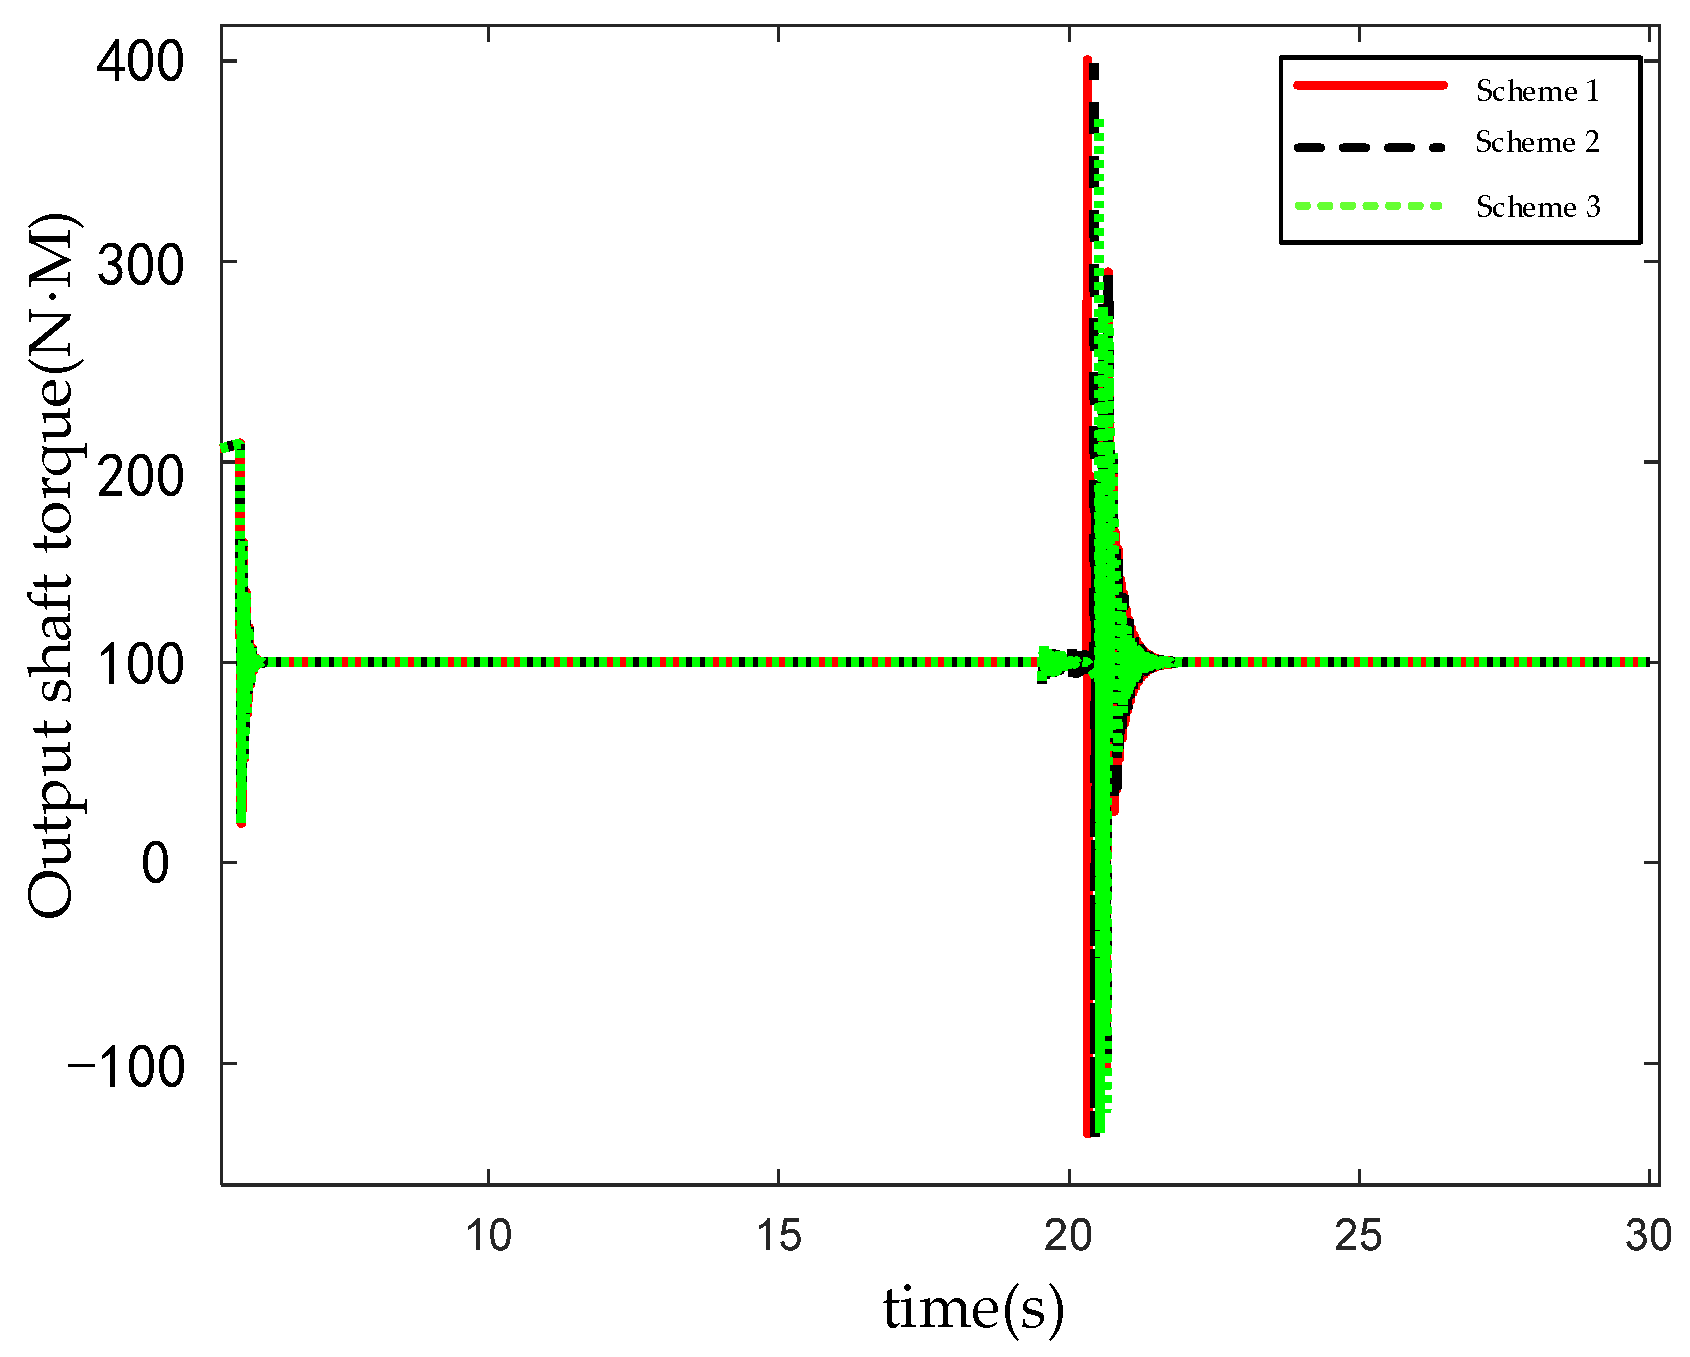
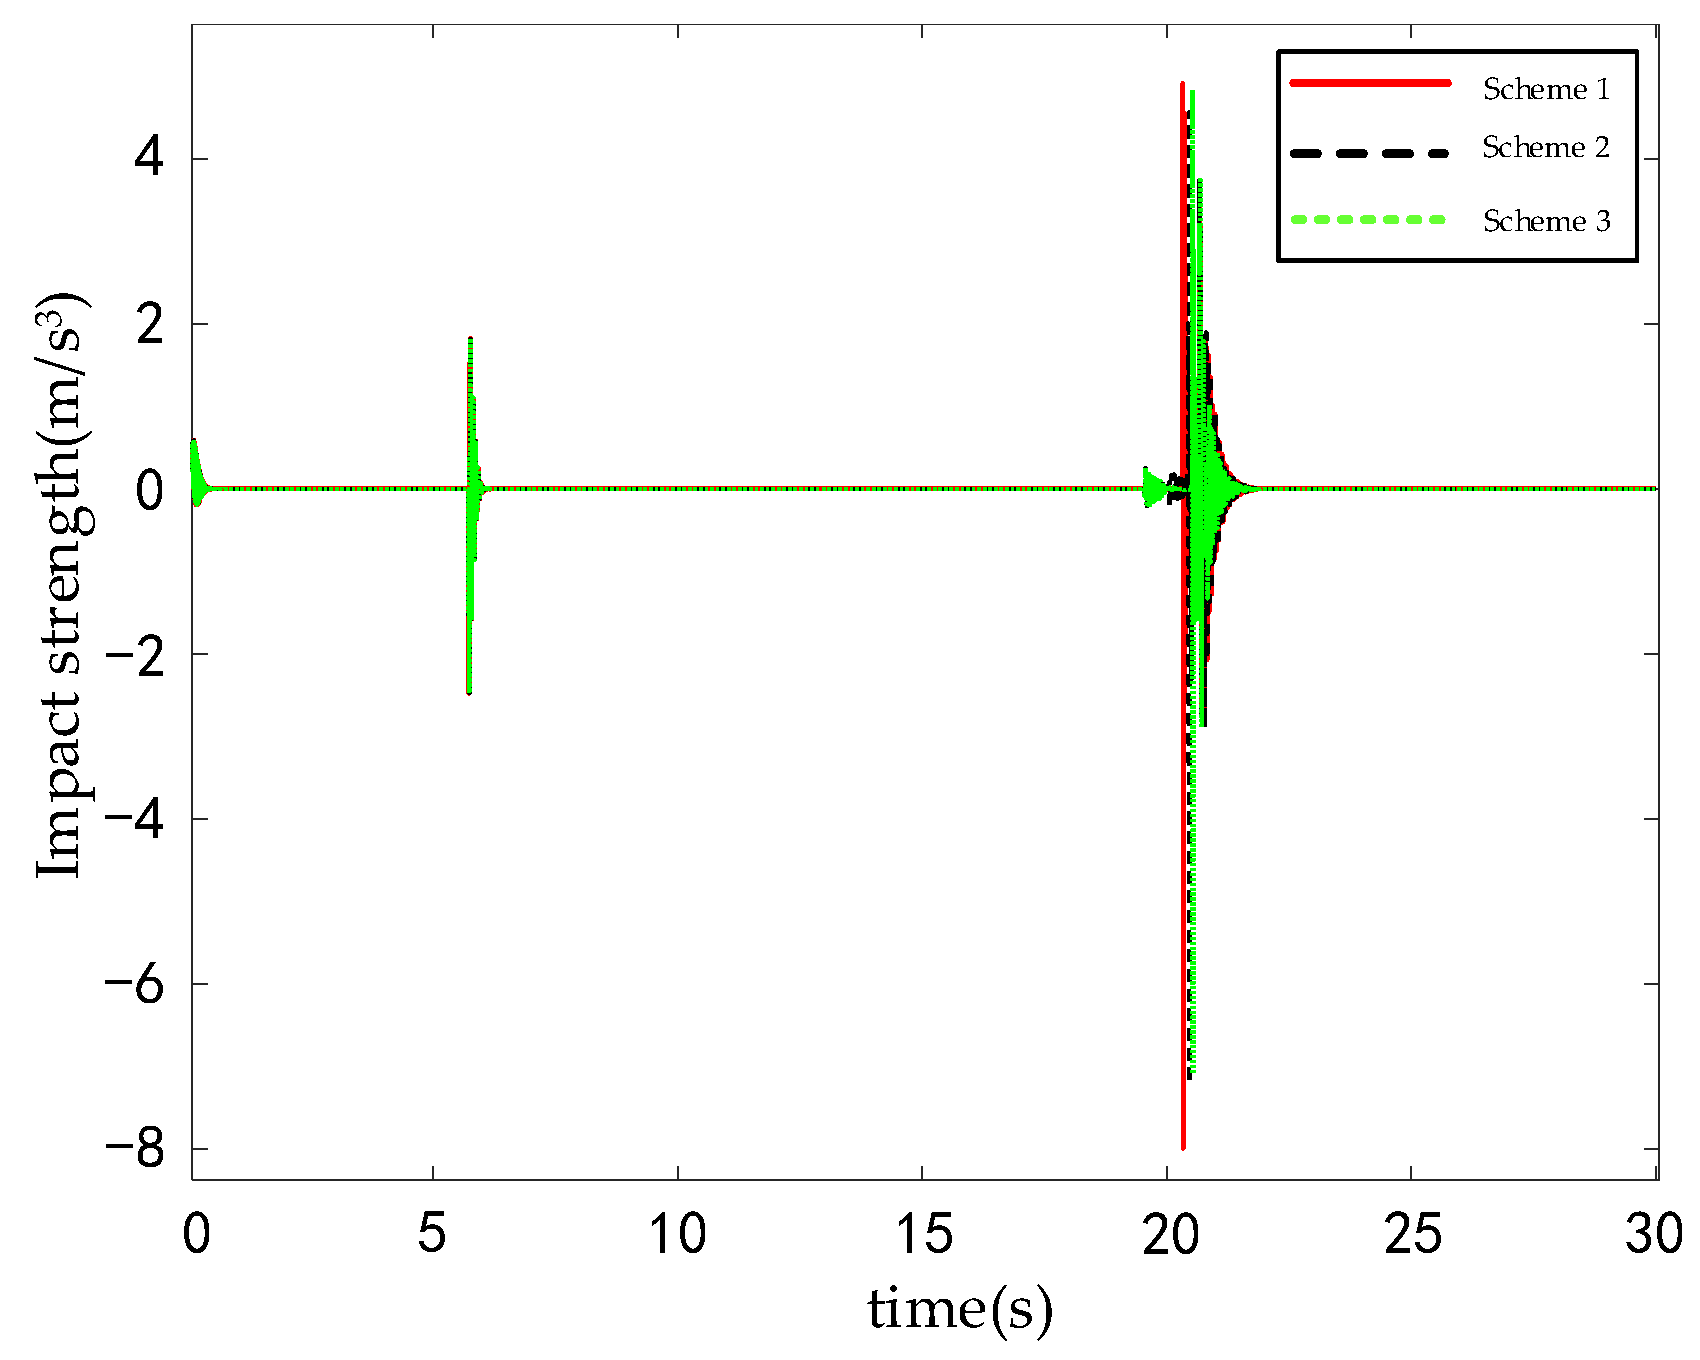
4.2. Hardware-in-the-Loop Simulation Test Verification

Hardware-in-the-loop (HIL) testing is an advanced testing method that integrates real hardware into a simulation environment. It can provide a more realistic and accurate simulation of a system, effectively reducing the time and cost required for the actual system test and commissioning phase [27]. Figure 23 shows the hardware-in-the-loop test scheme for the pure electric to speed-coupling mode-switching process. It aims to evaluate the switching process of the system under different working modes, and it provides important experimental data support for system optimization and performance improvement.
There is no interaction during the switching process from pure electric mode to speed-coupling mode. Therefore, when using orthogonal experimental variance analysis, it is necessary to arrange blank columns, and factor G is a blank column. L27(36) orthogonal table was selected to conduct 27 HIL tests, and the test results were analyzed by variance using MINITAB 2017 software.
As shown in Table 1, analysis of variance was performed on the test results. The analysis shows that factor A, factor C, and factor E had the greatest influence on the velocity drop amplitude, factor D had some influence, and factor B and factor F had no obvious influence.
As shown in Table 2, analysis of variance was performed on the test results. The analysis shows that factor E had the greatest influence on the dynamic load coefficient. The influence of factor D on the dynamic load coefficient was in the middle. Factor C had little effect on dynamic load coefficient. The influence of factors A, B, and F on the dynamic load coefficient was not obvious.
As shown in Table 3, variance analysis was performed on the test results, and the analysis showed that factors C, D, and E had a greater impact on impact strength, while the other factors had no obvious impact on impact strength.
As shown in Table 4, the variance analysis of the test results shows that factors D and E had the greatest impact on the switching time, factor C had a moderate impact, and the other factors had no significant impact.
According to Table 1, Table 2, Table 3 and Table 4, the simulation results and test results were compared and analyzed, and Table 5 was obtained.
The simulation results show that clutches C6 and C3 had the greatest influence on the velocity drop amplitude of the output shaft, and the test results show that clutches C6 and C3 had high significance. The simulation results show that clutches C6 and C4 had the greatest influence on the dynamic load coefficient of the output shaft. The test results show that the significance of clutch C6 was high and that of clutch C4 was average. The simulation results show that clutches C3, C6, and C4 had the greatest impact strength on the output shaft impact strength, and the test results show that clutches C3, C6, and C4 had high significance. The simulation results show that clutches C6, C4, and C3 had the greatest influence on the switching time. The test results show that the significance of clutches C6 and C4 was high and the significance of clutch C3 was average. There are some errors between the simulation analysis and the test results, but the general trend was the same.
The effectiveness and correctness of the proposed control strategy of “clutch oil pressure fuzzy control + motor torque compensation” and clutch-switching timing optimization based on orthogonal test are verified by the experiments. The results of velocity drop, dynamic load coefficient, impact strength, and switching time were effectively reduced. The research results provide theoretical reference for the process control strategy of switching from pure electric mode to hybrid mode.

5. Conclusions

In this paper, the proposed hybrid tractor powertrain configuration equipped with hydraulic-mechanical continuously variable transmission device was the research goal. The control strategy of “clutch oil pressure fuzzy control + motor torque compensation” has been proposed, and the quality of vehicle mode switching optimized and verified by using orthogonal test range analysis and variance analysis. The following three conclusions can be drawn:
In the process of switching from pure electric mode to hybrid speed-coupling mode, the control strategy of “clutch oil pressure fuzzy control + motor torque compensation” was proposed. SimulationX and Matlab/simulink software were used for joint simulation verification. The simulation results show that the control strategy reduced the output shaft velocity drop amplitude from 21.875% to 18.755%, the dynamic load coefficient from 8.473 to 7.573, and the impact strength from 26.181 m/s3 to 21.581 m/s3. The switching time was reduced from 1.345 s to 1.301 s.
L27(36) orthogonal table was used for the orthogonal test design, and MINITAB software was used to carry out range analysis on the simulation results. The analysis showed that A3B1C3D3E1F2 was the optimal switching scheme, the output shaft velocity drop amplitude was reduced from 18.755% to 1.63%, and the dynamic load coefficient was reduced from 7.573 to 2.72. The impact strength was reduced from 21.581 m/s3 to 7.08 m/s3, and the switching time was reduced from 1.301 s to 0.35 s. The optimal scheme effectively improved the quality of mode switching.
A hardware-in-the-loop test scheme was designed and a hardware-in-the-loop simulation test was carried out. The results were analyzed by orthogonal test and arranged in blank columns. The results of the hardware-in-the-loop test and simulation were compared and analyzed. The results show that there were some differences between the two, mainly because the hardware-in-the-loop test was affected by environmental factors. There were some errors in the experimental results, but the overall trend of the two was consistent.

6. Patents

The configuration studied in this paper has been authorized by Chinese invention patent. (Authorization No. CN109723789B, Patent No. CN201910041132.1).

Author Contributions

Conceptualization, Z.Z. and J.S.; methodology, J.S.; software, J.S.; validation, H.Z., D.W. and L.C.; formal analysis, L.C.; investigation, H.Z.; resources, Z.Z. and J.S.; data curation, Z.Z. and J.S.; writing—original draft preparation, Z.Z. and J.S.; writing—review and editing, Z.Z. and J.S.; visualization, Z.Z. and J.S.; supervision, L.C.; project administration, L.C., H.Z. and L.C.; funding acquisition, Z.Z., H.Z., D.W. and L.C. All authors have read and agreed to the published version of the manuscript.

Funding

This research was funded by the China Postdoctoral Science Foundation (2023M731370), the Open Foundation of the National Key Laboratory of Special Vehicle Design and Manufacturing Integration Technology (GZ2023KF007), the Open Foundation of the State Key Laboratory of Fluid Power and Mechatronic Systems (GZKF-202214), the National Natural Science Foundation of China (52272435, 52225212, U20A20333, U20A20331).

Institutional Review Board Statement

Not applicable.

Informed Consent Statement

Not applicable.

Data Availability Statement

The data that support the findings of this study are available from the corresponding author at chenlong@ujs.edu.cn upon reasonable request.

Conflicts of Interest

The authors declared no potential conflicts of interest.

References

  1. Huai, Z. The logic and institutional flaws of EU enterprise supply chain due diligence regulation from the perspective of foreign-related legal rule. Ger. Stud. 2023, 38, 102–134+155. [Google Scholar]
  2. Pascuzzi, S.; Łyp-Wrońska, K.; Gdowska, K.; Paciolla, F. Sustainability Evaluation of Hybrid Agriculture-Tractor Powertrains. Sustainability 2024, 16, 1184. [Google Scholar] [CrossRef]
  3. Zhou, S.; Walker, P.; Tian, Y.; Zhang, N. Mode switching analysis and control for a parallel hydraulic hybrid vehicle. Veh. Syst. Dyn. 2021, 59, 928–948. [Google Scholar] [CrossRef]
  4. Banerjee, P.; Ivantysynova, M. Development of a Torque-Based Control Strategy for a Mode-Switching Hydraulic Hybrid Passenger Vehicle; SAE Technical Paper; Purdue University: West Lafayette, IN, USA, 2018. [Google Scholar]
  5. Oubelaid, A.; Albalawi, F.; Rekioua, T.; Ghoneim, S.S.; Taib, N.; Abdelwahab, S.A.M. Intelligent torque allocation based coordinated switching strategy for comfort enhancement of hybrid electric vehicles. IEEE Access 2022, 10, 58097–58115. [Google Scholar] [CrossRef]
  6. Zhu, Z.; Sheng, J.; Zhang, H.; Wang, D.; Chen, L. Research on control strategy of rotating tillage condition of hybrid tractor with dual flow coupling configuration. J. Agric. Mach. 2024, 55, 393–400+414. [Google Scholar]
  7. Qing, D.; Liu, D.; Du, B. Power source torque coordination control for heavy hybrid electric vehicle drive mode switching. Highw. Traffic Technol. 2012, 29, 151–158. [Google Scholar]
  8. Yu, J.; Cao, Z.; Cheng, M.; Pan, R. Hydro-mechanical power split transmissions: Progress evolution and future trends. Proc. Inst. Mech. Eng. Part D J. Automob. Eng. 2019, 233, 727–739. [Google Scholar] [CrossRef]
  9. Li, J.; Zhai, Z.; Song, Z.; Fu, S.; Zhu, Z.; Mao, E. Optimization of the transmission characteristics of an HMCVT for a high-powered tractor based on an improved NSGA-II algorithm. Proc. Inst. Mech. Eng. Part D J. Automob. Eng. 2022, 236, 2831–2849. [Google Scholar] [CrossRef]
  10. Pettersson, K.; Heybroek, K.; Mattsson, P.; Krus, P. A novel hydromechanical hybrid motion system for construction machines. Int. J. Fluid Power 2017, 18, 17–28. [Google Scholar] [CrossRef]
  11. Sun, X.; Lu, Z.; Chn, Y. Lightweight design of hydraulic mechanical continuously variable transmission box based on weight optimization. J. Hunan Agric. Univ. (Nat. Sci. Ed.) 2022, 48, 363–369. [Google Scholar] [CrossRef]
  12. Hua, Y.; Xia, G.; Tang, X. Wavelet neural network PID control of tractor hydraulic mechanical transmission. J. Hefei Univ. Technol. (Nat. Sci. Ed.) 2020, 43, 26–30+107. [Google Scholar]
  13. Zhu, Z.; Zeng, L.; Lin, Y.; Chen, L.; Zou, R.; Cai, Y. Adaptive energy management strategy for hybrid tractors based on performance prediction. J. Xi’an Jiaotong Univ. 2023, 57, 201–210. [Google Scholar]
  14. Cheng, Y.; Liang, Y.; Xu, X. Energy management strategy of HEV based on Gain-power fuel coefficient. China Highw. J. 2022, 35, 343–352. [Google Scholar] [CrossRef]
  15. Geng, W.; Lou, D.; Zhang, T. Multi-objective energy management strategy for hybrid electric vehicles based on particle swarm optimization. J. Tongji Univ. (Nat. Sci. Ed.) 2020, 48, 1030–1039. [Google Scholar]
  16. Xiao, X.; Zeng, X.; Dai, Z. A new type of electric vehicle supercapacitor and battery compound power supply system. Acta Electron. 2024, 45, 922–929. [Google Scholar]
  17. Zhang, X.; Cui, Y.; Yue, Q. Torque coordination control strategy for starting engine in PHEV. J. South China Univ. Technol. (Nat. Sci. Ed.) 2021, 49, 129–139. [Google Scholar]
  18. Editorial Department of China Highway Journal. An overview of academic research on automotive engineering in China·2017. China Highw. J. 2017, 30, 1–197. [Google Scholar] [CrossRef]
  19. Qian, W.; Shen, Q.; Wu, P. Research progress of privacy protection technology in big data computing environment. J. Comput. Sci. 2022, 45, 669–701. [Google Scholar]
  20. Zhu, Z.; Wang, D.; Sun, X. Configuration analysis of hydraulic compound transmission device. J. Jilin Univ. (Eng. Ed.) 2022, 52, 2265–2277. [Google Scholar] [CrossRef]
  21. Yang, J.; Li, M.; Sun, S. Research on vehicle road friendliness based on semi-active adaptive suspension system. China Highw. J. 2011, 24, 120–126. [Google Scholar] [CrossRef]
  22. Gao, B.; Wan, K.; Chen, Q.; Wang, Z.; Li, R.; Jiang, Y.; Mei, R.; Luo, Y.; Li, K. Operation mode switching control strategy of heavy hybrid electric vehicle. China Highw. J. 2014, 27, 109–119+126. [Google Scholar] [CrossRef]
  23. Huang, W. Calculation and analysis of engine starting system. For. Mach. Woodwork. Equip. 2021, 49, 65–68. [Google Scholar] [CrossRef]
  24. Lu, N.; Chen, T.; Zheng, H. Research on joint simulation analysis platform based on electromechanical hydraulic system. Mach. Tools Hydraul. 2023, 51, 71–78. [Google Scholar]
  25. Zhu, Z.; Sheng, J.; Zhang, H.; Wang, D.; Chen, L. Prediction of headless rivet installation interference by multivariate nonlinear regression model. J. Xi’an Jiaotong Univ. 2024, 58, 157–166. [Google Scholar]
  26. Cao, F.Y.; Feng, Q.; Yang, C.J. Optimization of clutch switching timing for dual-mode hydraulic mechanical transmission. J. Xi’an Jiaotong Univ. 2021, 55, 86–93. [Google Scholar]
  27. Gao, Z.; Zheng, C.; Zhao, R. A review of research on active safety verification and validation of autonomous vehicles in real and virtual scenarios. J. Jilin Univ. (Eng. Ed.) 2024, 1–19. [Google Scholar] [CrossRef]
Figure 1. Hybrid speed-coupling mode transmission route.
Applsci 14 06288 g001
Figure 2. Hybrid speed-coupling mode transmission route.
Applsci 14 06288 g002
Figure 3. Engine output speed–torque model.
Applsci 14 06288 g003
Figure 4. The electric motor output speed–torque model.
Applsci 14 06288 g004
Figure 5. Battery-equivalent model.
Applsci 14 06288 g005
Figure 6. Clutch engagement process. Note: Δω main and slave plate speed difference (r/min); P is the clutch oil pressure (Pa); P1 is the oil pressure when the clutch is to be engaged (Pa); Pmax is the maximum oil pressure of the clutch, that is, the oil pressure when the clutch is engaged (Pa); TC is the torque transmitted by the clutch (N∙m); Tmax is the maximum torque transmitted by the clutch, that is, the torque when the clutch is engaged (N∙m); t1 is the clutch separation stage (s); t2 is the clutch slipping stage (s); and t3 is the complete coupling point of the clutch (s) [17].
Applsci 14 06288 g006
Figure 7. Complete vehicle model.
Applsci 14 06288 g007
Figure 8. Fuzzy control system.
Applsci 14 06288 g008
Figure 9. Clutch engagement initial oil pressure fuzzy control rule surface.
Applsci 14 06288 g009
Figure 10. Fuzzy control rule surface of clutch oil pressure change rate.
Applsci 14 06288 g010
Figure 11. Control strategy flow.
Applsci 14 06288 g011
Figure 12. Interact diagram.
Applsci 14 06288 g012
Figure 13. Simulation and comparison of the output shaft velocity drop amplitude.
Applsci 14 06288 g013
Figure 14. Output shaft torque simulation comparison.
Applsci 14 06288 g014
Figure 15. Simulation and comparison of output shaft impact strength.
Applsci 14 06288 g015
Figure 16. Result analysis of the output shaft velocity drop amplitude.
Applsci 14 06288 g016
Figure 17. Result analysis of the dynamic load coefficient of the output shaft.
Applsci 14 06288 g017
Figure 18. Impact strength analysis of output shaft.
Applsci 14 06288 g018
Figure 19. Switching time result analysis.
Applsci 14 06288 g019
Figure 20. Comparative analysis of the speed of the three schemes.
Applsci 14 06288 g020
Figure 21. Comparative analysis of the torque of the three schemes.
Applsci 14 06288 g021
Figure 22. Comparative analysis of the impact strength of the three schemes.
Applsci 14 06288 g022
Figure 23. HIL test scheme.
Applsci 14 06288 g023
Table 1. Variance method used to analyze velocity drop amplitude.
OrigindfAdj SSAdj MSF Valuep ValueEminence
Factor A2177.3688.6787.190.009***
Factor B216.268.1290.660.535
Factor C2396.97198.48616.090.000***
Factor D2130.7465.3685.300.022**
Factor E2392.59196.29615.910.000***
Factor F214.047.0190.570.581
Factor G22.751.3740.110.896
Error e12148.0712.339
Note: In the table: when p < 0.01, the significance is ***; when 0.01 ≤ p < 0.05, the significance is **.
Table 2. Variance method used to analyze dynamic load coefficient.
OrigindfAdj SSAdj MSF Valuep ValueEminence
Factor A25.1782.5891.140.353
Factor B24.0192.0090.880.439
Factor C213.2216.6112.900.094*
Factor D219.71519.8754.330.038**
Factor E238.71219.3568.500.005***
Factor F26.63013.3151.460.272
Factor G217.3378.7223.830.052
Error e1227.3372.278
Note: In the table: when p < 0.01, the significance is ***; when 0.01 ≤ p < 0.05, the significance is **; when 0.05 ≤ p < 0.1, the significance is *.
Table 3. Impact strength analyzed by variance method.
OrigindfAdj SSAdj MSF Valuep ValueEminence
Factor A212.7216.3612.080.168
Factor B211.1105.5551.810.205
Factor C243.59121.7967.120.009***
Factor D257.96628.9839.460.003***
Factor E277.67438.83712.680.001***
Factor F22.3471.1730.380.690
Factor G22.0991.0490.340.717
Error e1236.7463.062
Note: In the table: when p < 0.01, the significance is ***.
Table 4. Switching time analyzed by variance method.
OrigindfAdj SSAdj MSF Valuep ValueEminence
Factor A20.2260.1131.670.230
Factor B20.1400.0711.040.384
Factor C20.7240.3625.350.022**
Factor D21.1370.5688.410.005***
Factor E21.6960.84812.540.001***
Factor F20.0440.0220.320.730
Factor G20.0620.0310.460.644
Error e120.8110.068
Note: In the table: when p < 0.01, the significance is ***; when 0.01 ≤ p < 0.05, the significance is **.
Table 5. Comparative analysis of simulation results and test results.
caeiSpeed DropDynamic Load FactorImpact StrengthSwitching Time
sabsE1C3A2D3B1F3E1C3D3F2A3B3C3A1E1F2B1D3E1D3C3A2B2F2
fpEC majorEC majorCED majorEDC major
AD midDF midB midAB mid
BF minorAB minorFA minorF minor
tvbsC1E3A2D3B1F3E1C3D3F2A3B3E1D3C2A3B1F3E1D3C2A3B1F3
fpCEA majorE majorEDC majorED major
D midCD midAB midC mid
BF minorFAB minorF minorABF minor
Note: In the table: ca stands for comparative analysis; ei stands for evaluation index; sa stands for simulation analysis; bs stands for best solution; fp stands for factor priority; tv stands for test verification.
Disclaimer/Publisher’s Note: The statements, opinions and data contained in all publications are solely those of the individual author(s) and contributor(s) and not of MDPI and/or the editor(s). MDPI and/or the editor(s) disclaim responsibility for any injury to people or property resulting from any ideas, methods, instructions or products referred to in the content.

