Article

Multi-Objective Evolutionary Neural Architecture Search with Weight-Sharing Supernet

by
Junchao Liang
1,
Ke Zhu
1,
Yuan Li
2,
Yun Li
3 and
Yuejiao Gong
1,3,*
1
School of Computer Science and Engineering, South China University of Technology, Guangzhou 510006, China
2
School of Computer and Information Engineering, Henan Normal University, Xinxiang 453007, China
3
Shenzhen Institute for Advanced Study, University of Electronic Science and Technology of China, Shenzhen 518110, China
*
Author to whom correspondence should be addressed.
Appl. Sci. 2024, 14(14), 6143; https://doi.org/10.3390/app14146143
Submission received: 28 May 2024 / Revised: 25 June 2024 / Accepted: 1 July 2024 / Published: 15 July 2024
(This article belongs to the Special Issue Evolutionary Computation Meets Deep Learning)

Abstract

:
Deep neural networks have played a crucial role in the field of deep learning, achieving significant success in practical applications. The architecture of neural networks is key to their performance. In the past few years, these architectures have been manually designed by experts with rich domain knowledge. Additionally, the optimal neural network architecture can vary depending on specific tasks and data distributions. Neural Architecture Search (NAS) is a class of techniques aimed at automatically searching for and designing neural network architectures according to the given tasks and data. Specifically, evolutionary-computation-based NAS methods are known for their strong global search capability and have aroused widespread interest in recent years. Although evolutionary-computation-based NAS has achieved success in a wide range of research and applications, it still faces bottlenecks in training and evaluating a large number of individuals during optimization. In this study, we first devise a multi-objective evolutionary NAS framework based on a weight-sharing supernet to improve the search efficiency of traditional evolutionary-computation-based NAS. This framework combines the population optimization characteristic of evolutionary algorithms with the weight-sharing ideas in one-shot models. We then design a bi-population MOEA/D algorithm based on the proposed framework to effectively solve the NAS problem. By constructing two sub-populations with different optimization objectives, the algorithm can effectively explore network architectures of various sizes in complex search spaces. An inter-population communication mechanism further enhances the algorithm’s exploratory capability, enabling it to find network architectures with uniform distribution and high diversity. Finally, we conduct performance comparison experiments on image classification datasets of different scales and complexities. Experimental results demonstrate the effectiveness of the proposed multi-objective evolutionary NAS framework and the practicality and transferability of the introduced bi-population MOEA/D-based NAS method compared to existing state-of-the-art NAS methods.

1. Introduction

In recent years, deep learning has achieved tremendous success in various fields and demonstrated outstanding performance in image classification [1,2,3,4], speech recognition [5], natural language processing, and machine translation [6,7] tasks. Deep neural networks are key to the success of deep learning as they enable the modeling of complex nonlinear relationships through their deep architectures. They can automatically learn and extract crucial and informative features from unstructured data, such as images and texts, rather than using manual feature engineering methods. Therefore, researchers are devoted to designing suitable neural network architectures for deep learning tasks. In previous work, high-performance neural networks were usually designed by professional experts manually, such as the well-known ResNet [3] and DenseNet [4]. However, in many application scenarios, researchers lack sufficient domain knowledge to design such sophisticated network architectures. They are easily constrained by the existing network architecture patterns and find it difficult to design more innovative neural networks. On the other hand, the design of neural network architectures depends on specific tasks and relevant data to some extent. The optimal neural network architecture may vary as the data distribution changes. In such cases, the cost of manually tuning and using trial and error on neural networks becomes relatively high. Based on these challenges, researchers now mainly focus on developing algorithms to automatically design optimal neural network architectures.
Neural Architecture Search (NAS) is a method aimed at automatically searching for and designing optimal neural network architectures based on specific applications and data. It has drawn continuous attention in recent years due to its convenience, flexibility, and effectiveness. To date, NAS methods have obtained neural networks that outperform manually designed ones in various deep learning tasks. Essentially, NAS tries to optimize the hyper-parameters related to neural network architectures, with different optimization objectives for different types of neural networks. For example, for Convolutional Neural Networks (CNNs), NAS optimizes the architecture parameters such as the number of hidden layers, the number of neurons per layer, filter size, and convolution types. For Recurrent Neural Networks (RNNs), the search may focus on the number of hidden layers, the number of neurons per layer, and the number of time steps [8].
Specifically, the overall framework of NAS mainly consists of three key components: search space, search strategy, and performance estimation strategy [9]. The search space defines the scope within which the NAS algorithms search, referring to a collection of candidate network architectures. It plays a crucial role in the performance and efficiency of the searched network architectures. Existing studies typically combine some prior domain knowledge to restrict the search space, which reduces the complexity of the search process and improves efficiency relatively. Next, the search strategy represents the specific algorithms used to explore and develop the optimal network architectures in the search space. A well-designed search strategy can effectively find promising architectures within a vast search space. Then, the network architectures obtained by the search strategy are usually evaluated on the validation data based on a certain performance estimation strategy, which further guides the optimization direction of the search strategy.
In recent years, due to the outstanding performance of evolutionary computation (EC) in solving complex optimization problems, an increasing number of researchers have started to design evolutionary-computation-based NAS methods (also known as EC-NAS) [10,11,12,13,14]. However, since EC-NAS methods are population-based search methods, they need to evaluate the fitness of each individual in the population during the search process. In other words, the performance of each network architecture represented by an individual must be estimated in each evolving iteration. An intuitive performance estimation strategy is to train the searched networks from scratch and evaluate their classification accuracy on validation data. However, due to the large number of individuals in the evolutionary population, the evaluation step typically consumes a significant amount of time, limiting its scalability and practicality. Therefore, current EC-NAS studies mainly focus on designing effective and efficient search strategies and performance estimation strategies to improve the performance of the searched architectures while reducing computational costs.
In this study, we focus on developing a novel EC-NAS method that achieves a trade-off between search effectiveness and efficiency. Specifically, we first design a multi-objective evolutionary NAS framework based on a weight-sharing supernet to effectively reduce the search cost of the population evaluation phase in the traditional EC-NAS method. Additionally, we propose an algorithm based on bi-population MOEA/D to address the potential small model trap problem during the optimization step. This algorithm can explore diverse and high-performance neural network architectures in the large search space.
The contributions of this work are summarized as follows:
  • In this study, we design a multi-objective evolutionary NAS framework based on a weight-sharing supernet. This framework combines the population optimization strategy from evolutionary algorithms with the weight-sharing concept of one-shot models to alternately optimize the weight parameters and the architecture parameters in neural networks. It can explore promising network architectures in complex and large search spaces with high efficiency.
  • We propose a bi-population MOEA/D algorithm within the above EC-NAS framework. By setting up two sub-populations to solve different optimization tasks and incorporating a communication mechanism between the sub-populations, the algorithm can thoroughly explore different regions of the search space and obtain uniformly distributed network architectures with high performance and diversity.
  • Extensive experiments are conducted on several real-world image datasets of varying sizes and complexities. Compared with different types of representative NAS methods, the experimental results validate the efficiency and transferability of the proposed framework and algorithm in searching for effective neural network architectures.
The organization of this paper is as follows: Section 2 reviews the related studies on NAS, especially EC-NAS. Then, Section 3 introduces the multi-objective evolutionary NAS framework based on a weight-sharing supernet. The bi-population MOEA/D-based NAS algorithm is proposed in Section 4, followed by experimental results in Section 5. Finally, Section 6 summarizes and gives the possible future work related to this study.

2. Related Works

According to the adopted search strategies, NAS methods can be categorized into three types [8]: reinforcement-learning-based NAS, gradient-based NAS, and evolutionary-computation-based NAS.

2.1. Reinforcement-Learning-Based Neural Architecture Search

Zoph et al. [15] first proposed a reinforcement-learning-based NAS algorithm and achieved promising results in both image classification and natural language processing tasks. This study demonstrated the potential and practicability of using NAS methods to automatically design network architectures, which was pioneering in the field of NAS. Following this work, early NAS research [16,17,18] mainly used reinforcement learning to design NAS algorithms. Specifically, reinforcement-learning-based NAS methods regard the generation of neural networks as the actions of an agent, and the action space represents the search space in NAS. Then, the network performance on unseen data serves as the reward for this agent. In such a process, the agent interacts with the environment continuously and utilizes a certain learning policy to maximize the reward, which finally completes the search for network architectures. However, most of the reinforcement-learning-based NAS methods typically demand high computational resources. For instance, the NASNet proposed by Zoph et al. requires up to 800 GPUs to perform the whole search process. Due to the high computational costs of reinforcement-learning-based NAS, researchers gradually began to prefer more efficient NAS methods, which prompted the proposal of gradient-based NAS.

2.2. Gradient-Based Neural Architecture Search

Gradient-based NAS methods are renowned for their efficiency in searching for architectures. They primarily focus on optimizing the hyper-parameters and the connectivity patterns of the basic layers in neural networks [19,20]. The most classic ones are DARTS [21] and GDAS [22]. Most reinforcement-learning-based NAS and evolutionary-computation-based NAS methods search in discrete and non-differentiable search spaces. In other words, network architectures are represented in a discrete form. DARTS innovatively introduced a relaxation strategy to make the representation of network architectures continuous. Specifically, the connections between nodes can be directly encoded by indices, or IDs, when using the discrete form. However, in DARTS, all the candidate operations on the connected edges are assigned continuous weights, which are used to compute the weighted feature maps in the network. Combined with the relaxation strategy, DARTS can optimize the architecture parameters in neural networks directly by gradient descent methods that are similar to the optimization of weight parameters.

2.3. Evolutionary-Computation-Based Neural Architecture Search

EC is a type of population-based heuristic paradigm that can explore multiple regions of the search space simultaneously and is not easily trapped in local optima [23]. Therefore, EC is widely applied to solve complex optimization problems. Compared with reinforcement-learning-based NAS, EC-NAS requires fewer computing resources and less search time to find the optimal network architectures. On the other hand, although gradient-based NAS methods have advantages in search efficiency, they need to implement complex gradient-based optimization and often find ill-conditioned architectures due to the improper relationship [8]. Additionally, gradient-based NAS methods usually need to set up a supernet in advance, for which more domain knowledge is required.
As illustrated in Figure 1, EC-NAS follows the basic process of evolutionary computation and consists of three components: population initialization, population updating, and population evaluation strategies. Therefore, EC-NAS studies mainly focused on developing useful strategies for these basic processes of evolutionary computation to address NAS issues.

2.3.1. Population Initialization and Encoding Strategy

In the basic process of EC, it is essential to predefine the optimization space of the algorithm and then initialize the population. In the context of EC-NAS, the search space constrains the optimization of individuals within a certain region. Once the search space is determined, candidate individuals are generated to form the architecture population. More specifically, each individual in the population represents a candidate network architecture in the search space, and each architecture can be encoded as a chromosome by a certain encoding strategy.
A common classification method divides encoding strategies into two categories: fixed-length and variable-length encoding. The fixed-length encoding strategy uses chromosomes of fixed length to represent candidate network architectures, with the length of chromosomes remaining unchanged during population evolution. For example, Xie et al. [24] proposed a genetic CNN for optimizing CNNs with evolutionary algorithms. The genetic CNN uses a fixed-length binary string to represent the connections between nodes in the network. Similarly, DeepMaker [25] adopts fixed-length strings to encode network architectures, which facilitates the subsequent generation of new offspring with single-point crossover. In contrast, variable-length encoding is more flexible and allows the length of the chromosomes to adjust along with the changes in the depth and complexity of networks. LargeEvo [11] proposes a large-scale EC-NAS using a variable-length encoding scheme to adaptively change the encoding length according to the network’s depth. However, this method may make it inapplicable for the traditional operators in EC, like the crossover operators. Thus, Sun et al. [26] proposed the AE-CNN method, which includes novel crossover and mutation operators based on variable-length encoding.

2.3.2. Population Updating Strategy

After initialization, the population continuously evolves, eliminates the worst individuals, and generates new ones, which is generally controlled by a specific population updating strategy. In EC-NAS, the most commonly used methods for population updating are evolutionary algorithms.
In evolutionary algorithms, the key operators involve selection, crossover, and mutation. Specifically, selection operators are mainly used for mating selection and environmental selection. Elitism is one of the most widely used methods that directly selects the best individuals in the population, aiming to preserve the best genes as much as possible. However, it may result in premature convergence. Alternatively, RegularizedEvo [12] employs an aging strategy to update the architecture population. In each iteration, a subset of parents is randomly selected, and the best one is chosen for mutation to generate a new offspring, while the oldest individual in the population is eliminated. Some algorithms tend to preserve individuals with more diversity. For example, Javaheripi et al. [27] selected the parents based on their distance from and difference to the other individuals, similar to the crowding distance in NSGA-II [28].
After selecting parent individuals, crossover and mutation operators can be applied to generate offspring individuals. For the crossover operation, the simplest approach is to use a single-point crossover operator [29], where a segment of the chromosomes of two individuals is exchanged starting from a specific position. Although this method is intuitive and easy to implement, it may disrupt the connectivity of the network architecture in the context of NAS. Another commonly used crossover operator is simulated binary crossover [30], which can be applied in real-valued encoding schemes. On the other hand, mutation operations aim to optimize the population in a more exploratory direction. In discrete encoding schemes, the value on a specific gene can be mutated to another candidate choice, which may represent the replacement of the operation on a specific edge or change the target node of the chosen edge to another. As for continuous encoding, polynomial mutation or Gaussian mutation methods can be used [31,32].
The strategies described above mostly focus on a single objective when evaluating the neural networks, for example, the classification accuracy of image classification tasks. However, in multi-objective EC-NAS [10,13,14,33], more than one metric is considered simultaneously to optimize the networks. These metrics, such as model accuracy and the number of model parameters, are always in conflict with each other. For instance, a network with high accuracy typically has a complex architecture, while a resource-constrained device like a mobile phone makes it hard to afford such computational costs, and the model performance must be sacrificed to some extent. The simplest way to solve multi-objective EC-NAS is to transform the multi-objective problem into a single-objective problem by taking the weighted sum of the given objectives. The other way is to use multi-objective evolutionary algorithms, such as the NSGA-II [28] and MOEA/D [34] algorithms. This kind of method aims to find a Pareto front in the objective space, which can be a good trade-off between multiple conflicting objectives. For example, LEMONADE [13] treats the objective functions as expensive ones and simple ones. This work is devoted to enhancing search efficiency by increasing the evaluation of low-cost objectives and reducing the evaluation of expensive ones. In CARS [14], the researchers found that the traditional NSGA algorithm only tends to search for small models with high accuracy, so they designed a two-stage non-dominated sorting strategy to balance the search for models with different sizes.

2.3.3. Population Evaluation Strategy

Since EC-NAS is a population-based search method, the evaluation of a large number of individuals in the population has become a bottleneck for EC-NAS. Thus, recent studies have made efforts to design useful strategies to accelerate the evaluation process.
Some studies employ knowledge inheritance [35] or network morphism strategies. This kind of method considers that the newly generated offspring may retain some of the same structures as their parents, which allows them to inherit the corresponding network weights. In other words, it is possible for newly generated models to preserve parts of the weight parameters from the trained models to achieve a warm start step [11,18,32,36]. Rather than training the network models from scratch, these methods can substantially accelerate the evaluation process.
Many recent studies [14,21,37] have adopted the idea of the one-shot model [38]. Essentially, the one-shot model is a supernet that contains all the possible nodes and the edge operations of neural networks in the whole search space. A subnet of the supernet represents a candidate network architecture, which is obtained by masking on the supernet, i.e., selecting some of the nodes and edges to form a valid subnet. During the training process, subnets can directly share the weight parameters with the supernet rather than training from scratch. In this way, the calculation cost is greatly reduced. For example, in DARTS, each edge between the feature map nodes in the supernet includes eight optional operations (such as convolutional layers, pooling layers, etc.). Each operation is associated with a weight to indicate its importance. The weight parameters in these eight layers are optimized simultaneously during the training process. Then, the operation with the highest weight will be selected from each node to form a candidate network when evaluating the real performance.
In addition, strategies with surrogate models tend to replace the expensive performance evaluation with a performance predictor. Specifically, the performance predictor is first trained on the training set to capture some useful information from the training data. Then, it utilizes the learned knowledge to make performance predictions for the other unseen network architectures [39,40]. In addition, Rawal et al. [41] proposed a learning curve predictor in which the fitness of individuals in the final iteration is predicted based on their performance in previous iterations. By employing surrogates or predictors, the search efficiency of EC-NAS can also be promoted.
Other types of strategies focus on reducing the fitness evaluation times of individuals during the evolutionary process. For instance, Črepinšek et al. [42] designed Long-Term Memory Assistance (LTMA) to store information throughout the entire evolutionary process. Once an identical individual that has appeared in the history is searched, its fitness value can be directly retrieved from the record, and repeated evaluation is avoided. In this way, computational resources can be considerably saved for further exploration and exploitation in the search space.

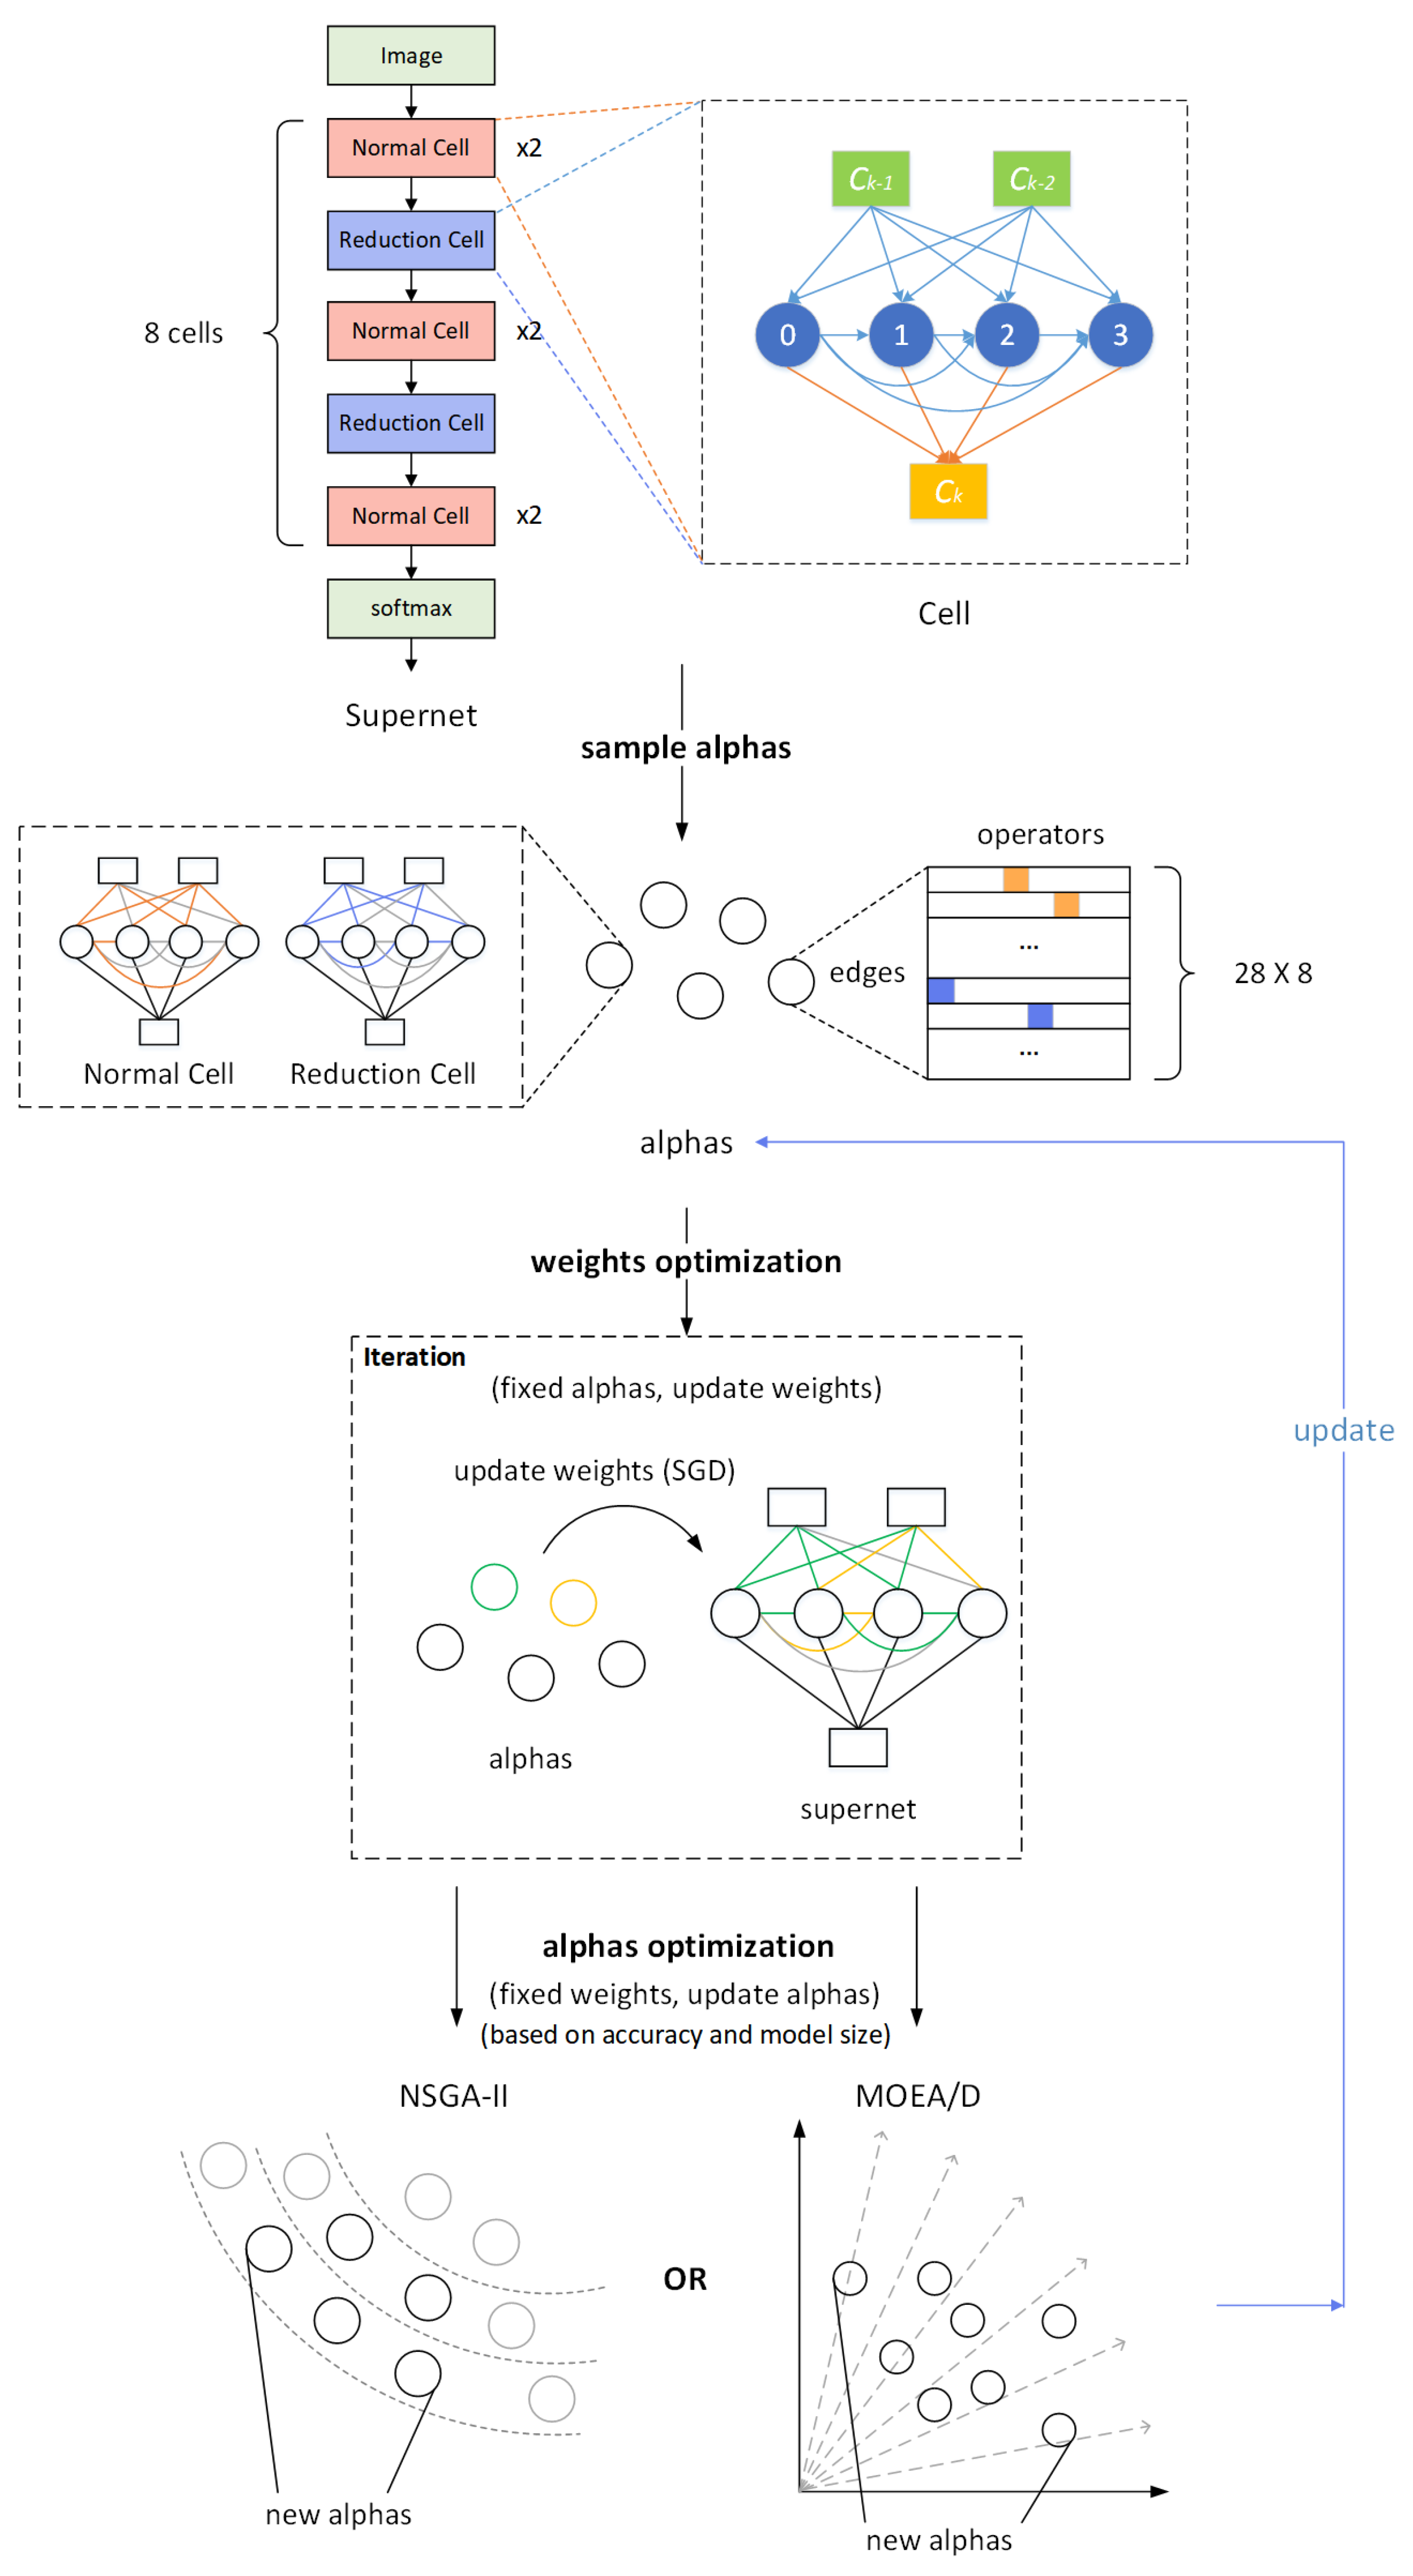
3. Multi-Objective Evolutionary Neural Architecture Search Framework Based on Weight-Sharing Supernet
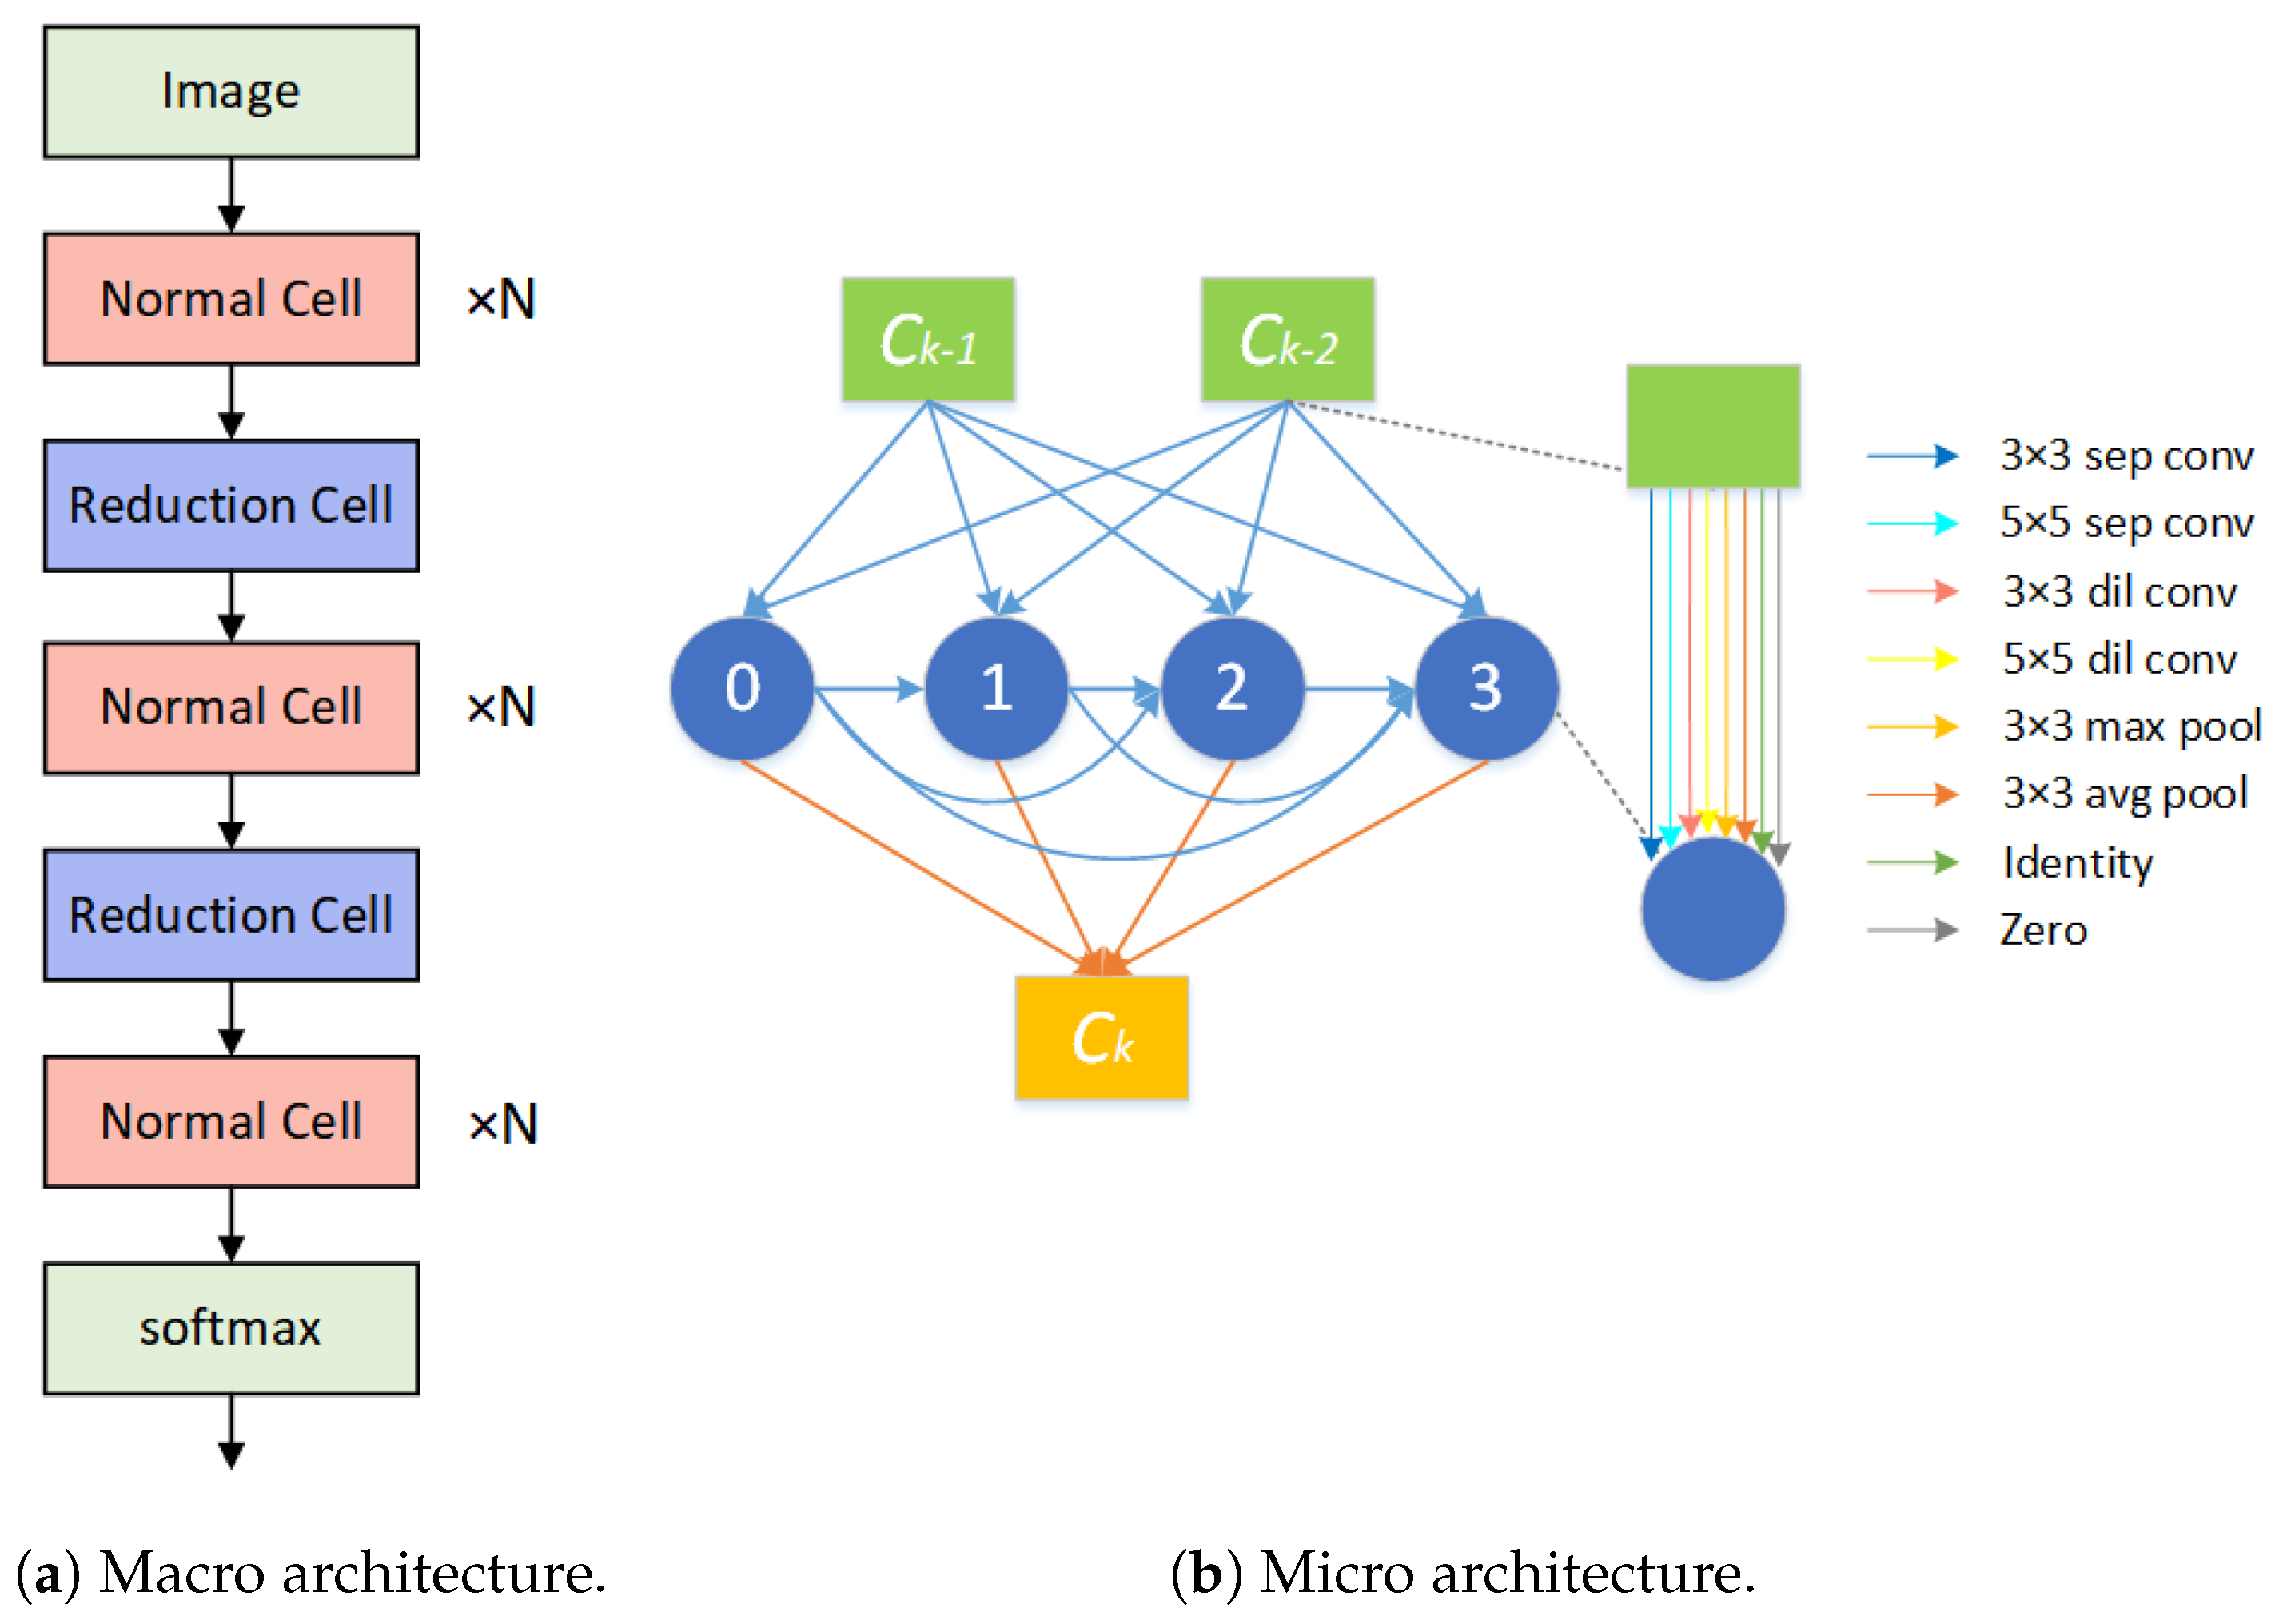
As described above, EC-NAS methods are characterized by their strong global search capability but are limited by their inefficiency in evaluating a large number of individuals in the architecture population. On the other hand, gradient-based NAS often utilizes one-shot models and the weight-sharing strategy to train on a supernet, which can effectively reduce the search time. However, this type of method heavily relies on the correct optimization of gradients, making it difficult to design. Additionally, gradient-based NAS generally outputs network architectures oriented towards a single objective, like classification accuracy, lacking diversity and consideration for the other metrics of neural networks.
In this work, we combine the advantages of evolutionary-computation-based and gradient-based NAS. Specifically, a population strategy in EC is used to optimize and search for diverse candidate network architectures. For the training and evaluation processes, we adopt the idea of one-shot models to optimize the weights of networks. All the possible candidate network architectures are represented by a supernet. In the training stage, a candidate network architecture refers to a subnet masked from the supernet. The weight parameters involved in the masked subnets are continuously updated using stochastic gradient descent (SGD). In the evaluation stage, all the candidate network architectures share the trained weight parameters of the supernet, and there is no need to re-train the networks from scratch. Thus, the candidate networks can be directly evaluated on the validation data, and their performance will further guide the optimization of the evolutionary algorithm. In this framework, the optimization of architecture parameters and weight parameters alternates. In each update period, the weights of the supernet will inherit the weights from the previous period.
Next, we will further elaborate on the proposed framework from the aspects of search space, supernet configuration, and algorithm flow.

3.1. Search Space

In this framework, we adopt the search space designed in DARTS [21]. Since the DARTS search space contains a variety of optional operations, and the constructed architectures can be applicable for both CNNs and RNNs, many existing NAS studies have adopted this search space as well.
The macro design of the DARTS search space refers to the most classic works, like ENAS [43] and NASNet [44]. Figure 2a illustrates the macro network architecture designed for the image classification task using the CIFAR-10 dataset [45]. In fact, the macro architecture in DARTS belongs to the cell-based search space [8], where the neural network is composed of a series of network units. There are two types of units: normal cells and reduction cells. Specifically, normal cells return a feature map of the same dimension, while reduction cells double the number of channels and reduce the height and width of the feature map by half [44]. These two types of network units can have the same architecture or different architectures. For the same type of units, the architectures are identical, but the weight parameters are different. As for the micro architecture in each network unit, the search space is as illustrated in Figure 2b. Intuitively, a network unit can be represented as a directed acyclic graph with seven nodes. Each node stands for a feature map, and the directed edges between nodes represent operations. For network architectures designed for image classification tasks, there are eight optional operations:
  • Convolution: 3 × 3 and 5 × 5 separable convolutions, 3 × 3 and 5 × 5 dilated separable convolutions;
  • Pooling: 3 × 3 max pooling, 3 × 3 average pooling;
  • Others: Identity, zeroize.
Note that each intermediate node can receive the outputs from two preceding nodes as its input.

3.2. Supernet Configuration
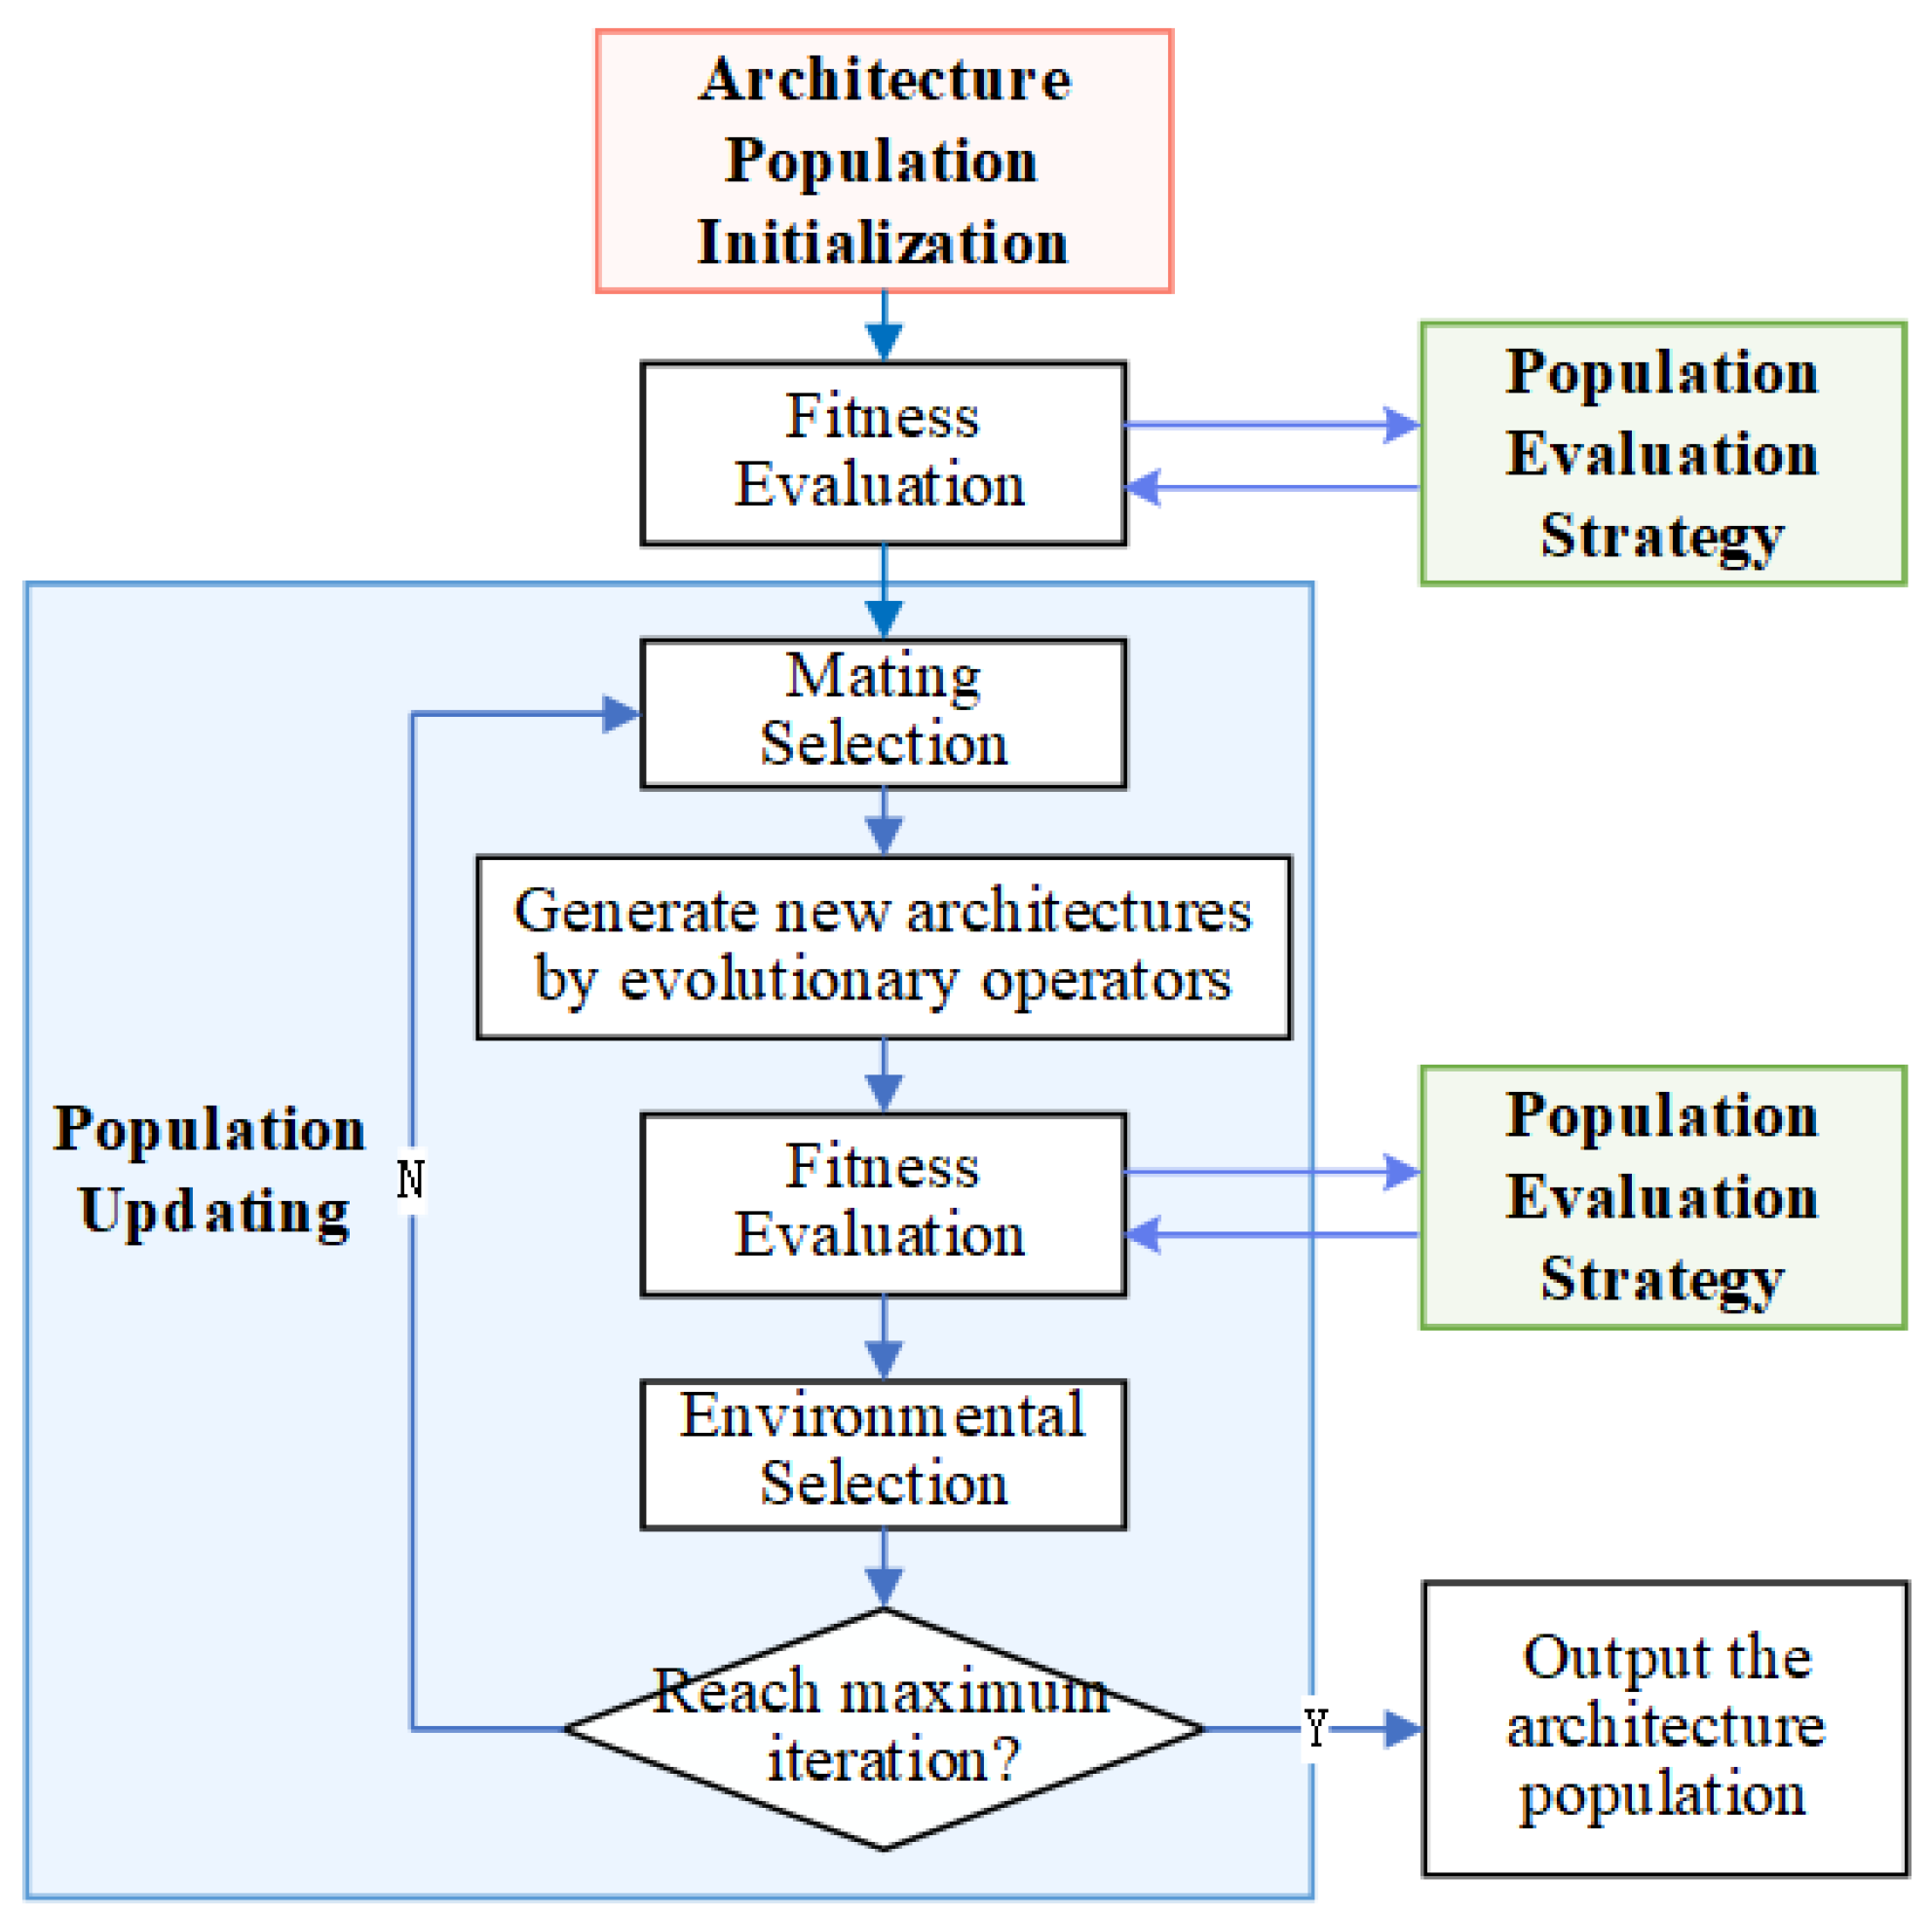
In order to enhance the search efficiency of NAS algorithms, smaller network models are usually utilized to be trained on training data and evaluated on validation data during the search phase. After the search phase, larger network models will be constructed and evaluated on the test data in the final evaluation phase. Following the setup in DARTS, when searching on CIFAR-10, the supernet in our proposed framework is set to contain eight cells, including six normal cells and two reduction cells. The architecture parameters α N for each normal cell are identical, and the architecture parameters α R for each reduction cell are also the same. However, the weight parameters ω on different network units are distinct. Therefore, the objective of the NAS algorithm is to optimize the architecture parameters α N and α R .

3.3. Algorithm Flow

The proposed multi-objective evolutionary NAS framework based on a weight-sharing supernet is illustrated in Figure 3. In this section, we will describe the NAS algorithm flow in this framework, which consists of the search phase and the final evaluation phase. Specifically, the search phase will be elaborated in two parts: encoding and population initialization and population updating and evaluation.

3.3.1. Search Phase: Encoding and Population Initialization

As shown in the upper part of Figure 3, each individual in the population represents a candidate network architecture, which is denoted as α i = ( α N i , α R i ) , i = 0 , , N pop . In other words, the individuals are initialized by random sampling of the edges and the affiliated operations of the normal cell and the reduction cell. Note that the sampling should follow the rule that each network unit contains eight valid edges, and each intermediate node can only choose edges from two of the preceding nodes. Since there are 14 optional edges and 8 optional operations per edge in a network unit, the encoding of an individual can be represented by a 28 × 8 binary matrix (by stacking two 14 × 8 matrices for the normal cell and reduction cell). In Figure 3, the colored squares in the rows of the matrix indicate the selected edges, while the columns represent the chosen operations.
After initializing the population, it is necessary to conduct a warm-up phase for the supernet [46]. This is because, in the search space based on the one-shot model, the weight parameters of the subnets completely depend on the shared parameters of the supernet. Therefore, the prerequisite for correctly approximating the performance of the subnets is that all the subnets contained in the supernet are optimized equally and simultaneously. In the proposed algorithm, a uniform sampling strategy [47] is adopted to initialize the weights of the supernet. The algorithm first conducts E warmup epochs of pre-training on the supernet. For each training batch in each epoch, a subnet is randomly sampled, and the training is performed on this subnet. The corresponding weight parameters on the supernet will be updated synchronously. In this way, the weight parameters on each edge operation of the supernet can be uniformly trained at the beginning, which can avoid overtraining a certain part of the supernet in the early stage that may affect the search direction of the algorithm.

3.3.2. Search Phase: Population Updating and Evaluation

The population updating combines the optimization of weight parameters ω and the optimization of architecture parameters α . Specifically, in each update period, E ω epochs of optimization are performed for the weight parameters, followed by a round of optimization for the architecture parameters. During the search phase, the algorithm will update for N period periods.
As shown in the dashed box in the lower part of Figure 3, weight optimization is performed on the supernet, and mini-batch SGD is used to update the weight parameters. For each training batch in each epoch, the algorithm randomly samples an individual α i A from the population. Then, a subnet can be masked from the supernet based on the encoding matrix contained in this individual to construct a candidate network. During the training process, only the weight parameters contained in the candidate networks will participate in forward and backward propagation. For the example illustrated in Figure 3, the green individual is chosen to train in a given batch. Only the weight parameters of the green edges will be involved in the training and updating process. Therefore, it can be noted that, during the weight optimization, the architecture parameters in the population are fixed and remain unchanged.
On the other hand, architecture optimization mainly occurs within the population, where the weight parameters on the supernet are fixed. After completing E ω epochs of weight optimization, the fitness of individuals in the population will be evaluated. Specifically, the fitness value of an individual is composed of the validation accuracy as well as the model size (approximated by the number of trainable parameters) of the network model represented by the individual. Based on the weight-sharing supernet, each candidate network can directly use the trained weight parameters on the supernet to perform the evaluation.
In each period, after evaluating the fitness, the population will be optimized by evolutionary algorithms. As shown in the bottom part of Figure 3, the proposed framework mainly applies multi-objective evolutionary algorithms such as NSGA-II and MOEA/D to complete the population updating, which will be discussed in Section 4. Then, the updated population will be retained for the next period.

3.3.3. Final Evaluation Phase

The search phase then ends up with N period update periods, and the algorithm will select a subset of individuals in the final population. We adopt a uniform sampling strategy to select the individuals. First of all, individuals in the population are sorted based on their model sizes. Then, individuals will be divided into multiple intervals in terms of model sizes. In each interval, the individual with the highest validation accuracy is chosen for the final validation phase. Finally, the network architectures of the selected individuals will be constructed into larger networks, and their test performance will be evaluated in turn.

4. Multi-Objective Evolutionary Neural Architecture Search Algorithms

In this section, we will provide a detailed explanation of the evolutionary algorithms adopted in the architecture optimization described in Section 3. First of all, two traditional multi-objective evolutionary algorithms (NSGA-II and MOEA/D) will be introduced in the context of NAS. Then, we propose a bi-population MOEA/D-based NAS algorithm that overcomes the limitations of the traditional algorithms. Finally, a brief description of the evolutionary operators used in the proposed algorithm will be provided.

4.1. Traditional Multi-Objective Evolutionary Neural Architecture Search Algorithms

For architecture optimization using traditional NSGA-II, mating selection, crossover, and mutation operators are utilized to generate the offspring population. After evaluating the offspring population, fast non-dominated sorting and crowding distance calculations are performed in the merged population of the parents and the offspring. Then, individuals are selected from the merged population based on the dominance relationship to form a new population, which will be retained for the next period.
On the other hand, for MOEA/D-based architecture optimization, each individual in the population is updated by its neighboring individuals. Specifically, the individual selects some of the neighboring individuals with a certain strategy to generate new offspring through crossover and mutation. Then, the neighboring individuals are updated according to the offspring’s fitness and a specific aggregation function. The updated population will proceed to the next period.

4.2. Bi-Population MOEA/D-Based Neural Architecture Search Algorithm

As analyzed in [21], the DARTS search space contains ( 4 × 10 12 ) 2 10 25 candidate neural network architectures in total. In such a huge search space, we find that the two traditional algorithms discussed above cannot achieve satisfactory results in architecture optimization. In fact, the traditional multi-objective evolutionary algorithms tend to concentrate the early search on smaller models, which may ignore the larger models with similar performance. This observation is termed the small model trap [14], where the evolutionary algorithms tend to select the well-performing small models in the early stages, ignoring the larger models that may outperform the selected small models in the subsequent periods. Thus, individuals representing these large models may be eliminated and cannot participate in the subsequent optimization, which may discard the genes with high potential. To address this issue, CARS [14] made improvements on the traditional NSGA-II algorithm. Specifically, two rounds of non-dominated sorting are performed separately when performing the environmental selection. The first non-dominated sorting is based on the model’s error rate and the model size, followed by the second non-dominated sorting in terms of the reciprocal of the model error rate and the model size. Then, the two Pareto fronts are merged to select the retained individuals. In this way, the algorithm can select both small and large models with high accuracy at the same time in the early stages and maintain a good diversity in the population. Therefore, inspired by this idea, we also make improvements to the traditional MOEA/D and propose a bi-population MOEA/D-based NAS method. MOEA/D can generally better discover well-distributed individuals based on the decomposition strategy compared to NSGA-II. Additionally, MOEA/D has advantages in solving more complex optimization problems.
The main process of the bi-population MOEA/D-based NAS algorithm is shown in Algorithm 1. Specifically, the original population A in the MOEA/D algorithm is split into two sub-populations, namely, A 1 and A 2 . Each sub-population is assigned a reference point, and the weight vectors are shared between the two sub-populations. In sub-population A 1 , the fitness of an individual is defined by the validation error rate ( e r r o r _ r a t e ) and the model size ( m o d e l _ s i z e ) of the represented network architecture, whereas, in sub-population A 2 , the fitness is defined by the validation error rate and 1 m o d e l _ s i z e (in fact, it is only necessary to convert the model size metric to a reverse order compared to the original one. Since the model size will not exceed 0.5 M during the experimental search process, 1 m o d e l _ s i z e is adopted in the proposed algorithm). As a result, reference point Z 1 stores the historical lowest validation error rate and the smallest model size in sub-population A 1 , while reference point Z 2 keeps track of the historical lowest model error rate and the largest model size in sub-population A 2 .
Algorithm 1 Bi-population MOEA/D-based NAS algorithm
Input: 
Number of warm-up epochs E warmup , number of update periods N period , number of weight optimization epochs E ω , population size N pop , the number of neighbours of each weight vectors T, the aggregation function g, the crossover ratio p c and the mutation ratio p m , number of individuals to communicate with the other sub-population N comm .
Output: 
The evolved population after N period periods.
  1:
Initialization Phase:
  2:
Initialize two architecture populations A 1 and A 2 with size N pop / 2 ;
  3:
Generate the global uniform weight vectors W with size N pop / 2 ;
  4:
Select T closest neighbour weight vectors as B ( i ) for each w i W ;
  5:
Initialize the global reference points Z 1 and Z 2 ;
  6:
Warm-up Phase: Train and update the supernet for E warmup epochs with randomly generated individuals;
  7:
Set I 1 ;
  8:
Iteration Phase:
  9:
while I N period do
10:
   Weights optimization: Update the supernet for E ω epochs with individuals in A 1 A 2 ;
11:
   Alphas optimization:
12:
   Evaluate the fitness values for A 1 as F V 1 ( e r r o r _ r a t e and m o d e l _ s i z e ), A 2 as F V 2 ( e r r o r _ r a t e and 1 m o d e l _ s i z e );
13:
   Update Z 1 with F V 1 and update Z 2 with F V 2 ;
14:
   for each α i A 1  do
15:
     Generate an offspring with two randomly sampled neighbours of α i by applying crossover and mutation (with probabilities p c and p m );
16:
     Evaluate the fitness value for the offspring Y as F V Y ;
17:
     Update the reference points Z 1 with F V Y ( e r r o r _ r a t e and m o d e l _ s i z e );
18:
     Update the neighbours of α i with aggregation function g t e ;
19:
   end for
20:
   for each α j A 2  do
21:
     Generate an offspring with two randomly sampled neighbours of α j by applying crossover and mutation (with probabilities p c and p m );
22:
     Evaluate the fitness value for the offspring Y as F V Y ;
23:
     Update the reference points Z 2 with F V Y ( e r r o r _ r a t e and 1 m o d e l _ s i z e );
24:
     Update the neighbours of α j with aggregation function g t e ;
25:
   end for
26:
   Communication phase:
27:
   Exchange N comm individuals between A 1 and A 2 ;
28:
   Update Z 1 and Z 2 in terms of the global minimum error rate;
29:
    I I + 1 ;
30:
end while
31:
return  A 1 , A 2
To further illustrate the motivation of the proposed bi-population MOEA/D algorithm, Figure 4 gives an example of a randomly generated population and its corresponding Pareto fronts based on different sorting metrics. Note that the values of objective functions f 1 and f 2 are set to approximate the model error rate and the model size in the DARTS search space. The left sub-figure illustrates the initial population, where different colors represent different Pareto ranks. It can be noticed that, when applying NSGA-II, individuals marked in red will be prioritized for preservation, which is mainly affiliated with low error rates and small model sizes. On the other hand, individuals with larger model sizes but slightly lower error rates (shown in the dashed box) may be eliminated by the algorithm due to their lower ranking. Similar to in MOEA/D, the individuals will gradually evolve towards the intersection points between the weight vectors and the optimal Pareto front, which may also lead to a preference for smaller models in the early stages of evolution. Thus, it can be inferred that, in large search spaces, the main reason for the small model trap is that parts of networks with significantly different model sizes only show a slight difference in terms of accuracy.
On the contrary, the right sub-figure illustrates the population distribution after reversing f 2 . It can be observed that the larger models from the original population now rank higher on the new Pareto front. In MOEA/D, individuals are guided by a new reference point for optimization. Therefore, by setting up two sub-populations with different optimization objectives and merging the results, the algorithm is able to consider network architectures with different sizes and overcome the issue of the small model trap.
In addition, an inter-population communication stage is introduced to enhance the algorithm’s exploratory capability after the two sub-populations’ optimizations. Specifically, the exchange parameter N comm is set to control the number of individuals exchanged between the two sub-populations in each period. In sub-population A 1 , some sub-problems will obtain individuals with larger model sizes, while the corresponding sub-problems in sub-population A 2 will optimize individuals with a larger ( 1 m o d e l _ s i z e ), i.e., smaller model sizes, as illustrated by the red dashed boxes in Figure 5. Therefore, during the communication, the algorithm exchanges the solutions to these N comm sub-problems between the two sub-populations. In other words, the large models in sub-population A 1 will be exchanged with the small models in sub-population A 2 . In this way, the algorithm is able to explore the intermediate region between the two sub-populations to some extent, avoiding the situation where each sub-population locally converges independently. Furthermore, the sub-populations will share and update the error rate recorded in their own reference point, which enables the sub-populations to perceive the global information.
By introducing the inter-population communication stage, the optimization information can be shared between two sub-populations and prevent them from blindly converging towards their own reference points, in which case the algorithm may output two completely unrelated sub-populations.

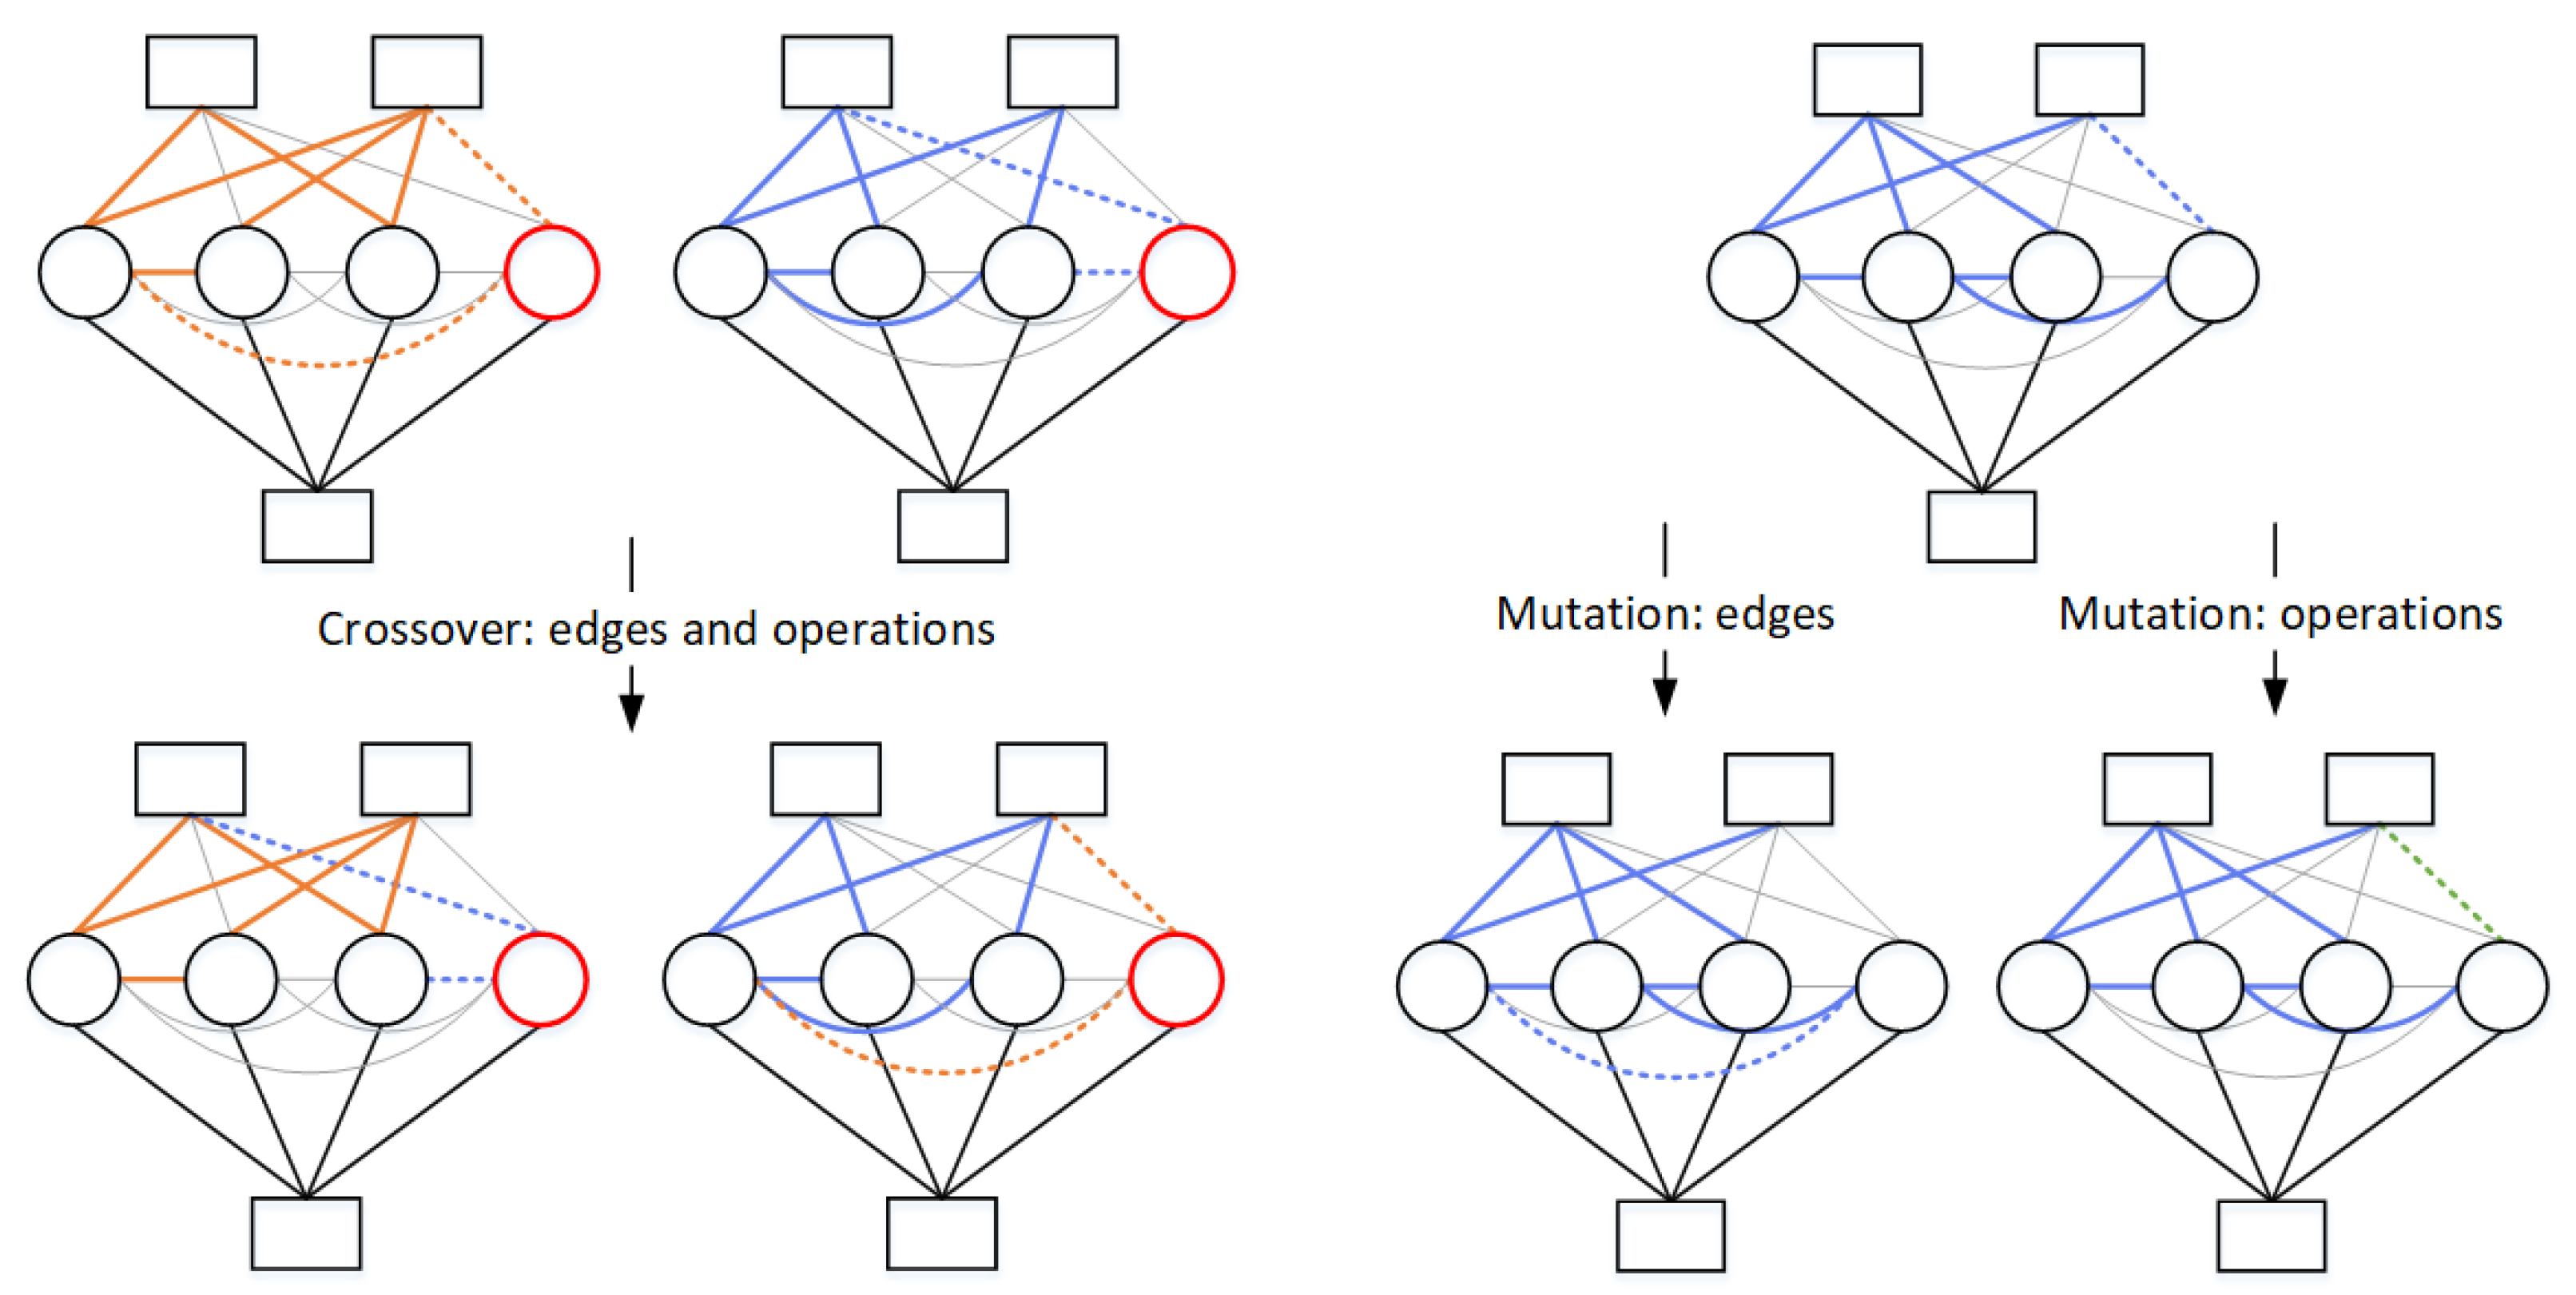
4.3. Evolutionary Operators

The evolutionary operators designed in the proposed algorithms are illustrated in Figure 6. The left side shows an example of crossover operators. In the proposed algorithm, crossover is performed based on the dimension of the nodes. For each intermediate node in a network architecture, there is a certain probability p c that the two edges connected to this node (along with the affiliated operations) will be exchanged with the corresponding edges in the other architecture. The motivation is to maintain the effectiveness of the network architectures after applying the crossover. It is worth noting that crossover operations for normal cells and reduction cells are conducted separately. As for the mutation operation depicted on the right side, it can be divided into edge mutation and operation mutation based on the dimension of the edges. As for an edge, it can mutate to connect with another preceding node or mutate to another optional operation.

5. Experiments

In this section, experiments are conducted to validate the effectiveness of the proposed multi-objective evolutionary NAS framework and the bi-population MOEA/D-based algorithm. First, the search performance of the proposed method on the CIFAR-10 dataset is compared with that of the traditional ones described in Section 3. Then, in terms of the test performance of the searched network architectures on CIFAR-10, we compare the proposed method with the existing representative NAS methods with different strategies in both single-objective and multi-objective dimensions. Finally, the searched network architectures of CIFAR-10 are applied to the more complex Mini-ImageNet dataset to test the transferability of the proposed method.

5.1. Search Performance Comparison on CIFAR-10 Dataset

5.1.1. Experimental Settings

The hyper-parameter settings for the bi-population MOEA/D-based NAS method are shown in Table 1. Specifically, the number of epochs for the warm-up phase is set to 50. The algorithm will update for 45 periods, with 10 epochs of weight optimization in each period. Therefore, for the weight parameters ω , there are 50 + 45 × 10 = 500 epochs of training and updating in total, which is set to the same as CARS for fair comparisons. The overall population size is set at 32, which means each sub-population’s size is 16. Each individual has four neighbors, and the Tchebycheff aggregation function is adopted when updating the neighboring individuals. In the inter-population communication stage, the number of exchanged individuals is set to 3. Note that the adopted values of hyper-parameters are tested and chosen based on the experiments on the widely used NAS benchmark datasets NAS-Bench-101 [48] and NAS-Bench-201 [49]. In these benchmark datasets, all the network architectures in the search space are evaluated in advance, and researchers can efficiently design NAS strategies and tune the hyper-parameters in the algorithm.
To verify the effectiveness of the bi-population MOEA/D-based NAS method, the algorithm is compared with the traditional NSGA-II, the improved NSGA-II (CARS), and the traditional MOEA/D-based NAS. For the CARS algorithm, the population size is set to 32, while the other settings remain the same as in the original work. For the traditional NSGA-II and MOEA/D-based NAS methods, the population size should be set to 16 to simply verify their performance. For NSGA-II, the number of parents is set to 2 in tournament selection, while the crossover and mutation rates are the same as those in Table 1. In MOEA/D, the number of weight vectors is equal to the population size; the other parameters are consistent with those in Table 1, except the traditional MOEA/D does not include communication individuals.
The other settings are listed as follows: For experiments on CIFAR-10, 8 network cells and an initial channel of 16 are used in the search phase. The training and validation sets contain 25,000 samples each with a batch size of 128. During training, a cosine-annealing-based scheduler is adopted, with an initial learning rate of 0.025. Stochastic gradient descent is employed with a momentum of 0.9 and a weight decay of 3 × 10 4 . For the final evaluation phase, the network is constructed with 20 cells, and the initial channels are set to 36. The re-training uses a batch size of 96 and runs for 600 epochs. The settings of the scheduler and the stochastic gradient descent are the same as in the search phase. Additionally, cutout and dropout strategies are applied as in DARTS, with a dropout probability of 0.2. An auxiliary loss function with a weight of 0.4 is also introduced. The search phase of NAS is performed on a single NVIDIA GeForce RTX 3090 GPU. The experiments are coded with Python 3.8.10 and PyTorch 1.8.1.

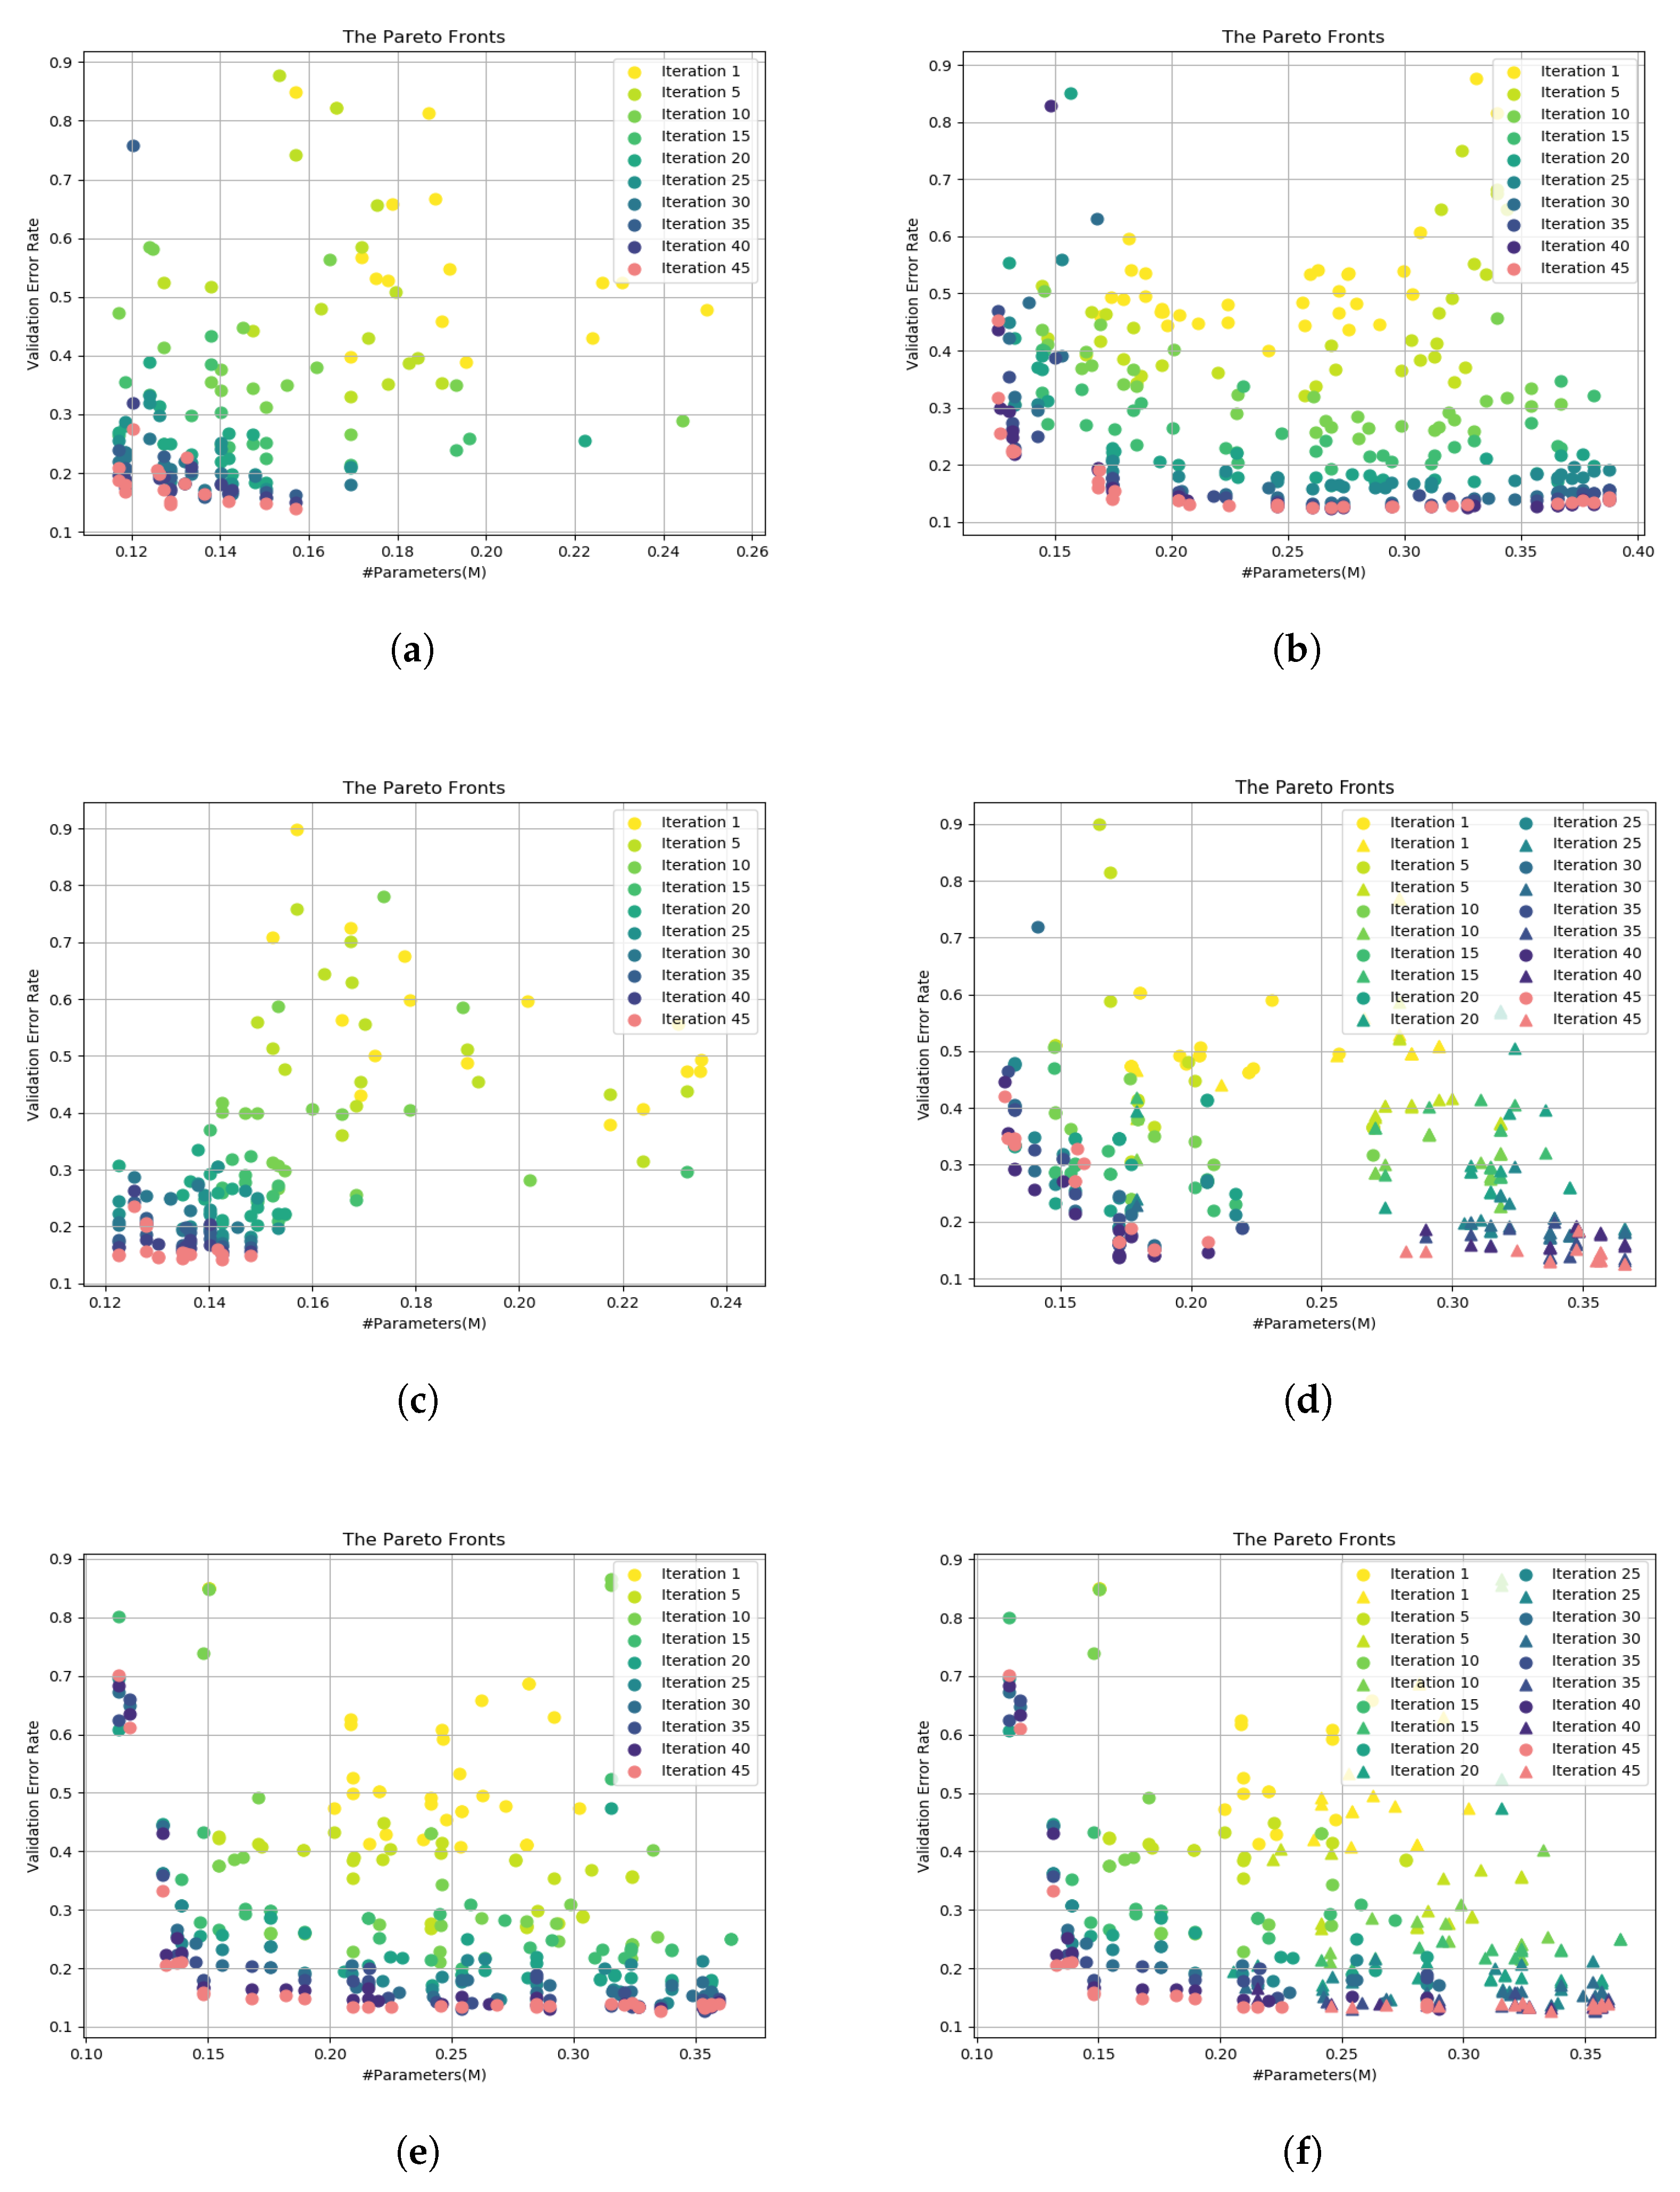
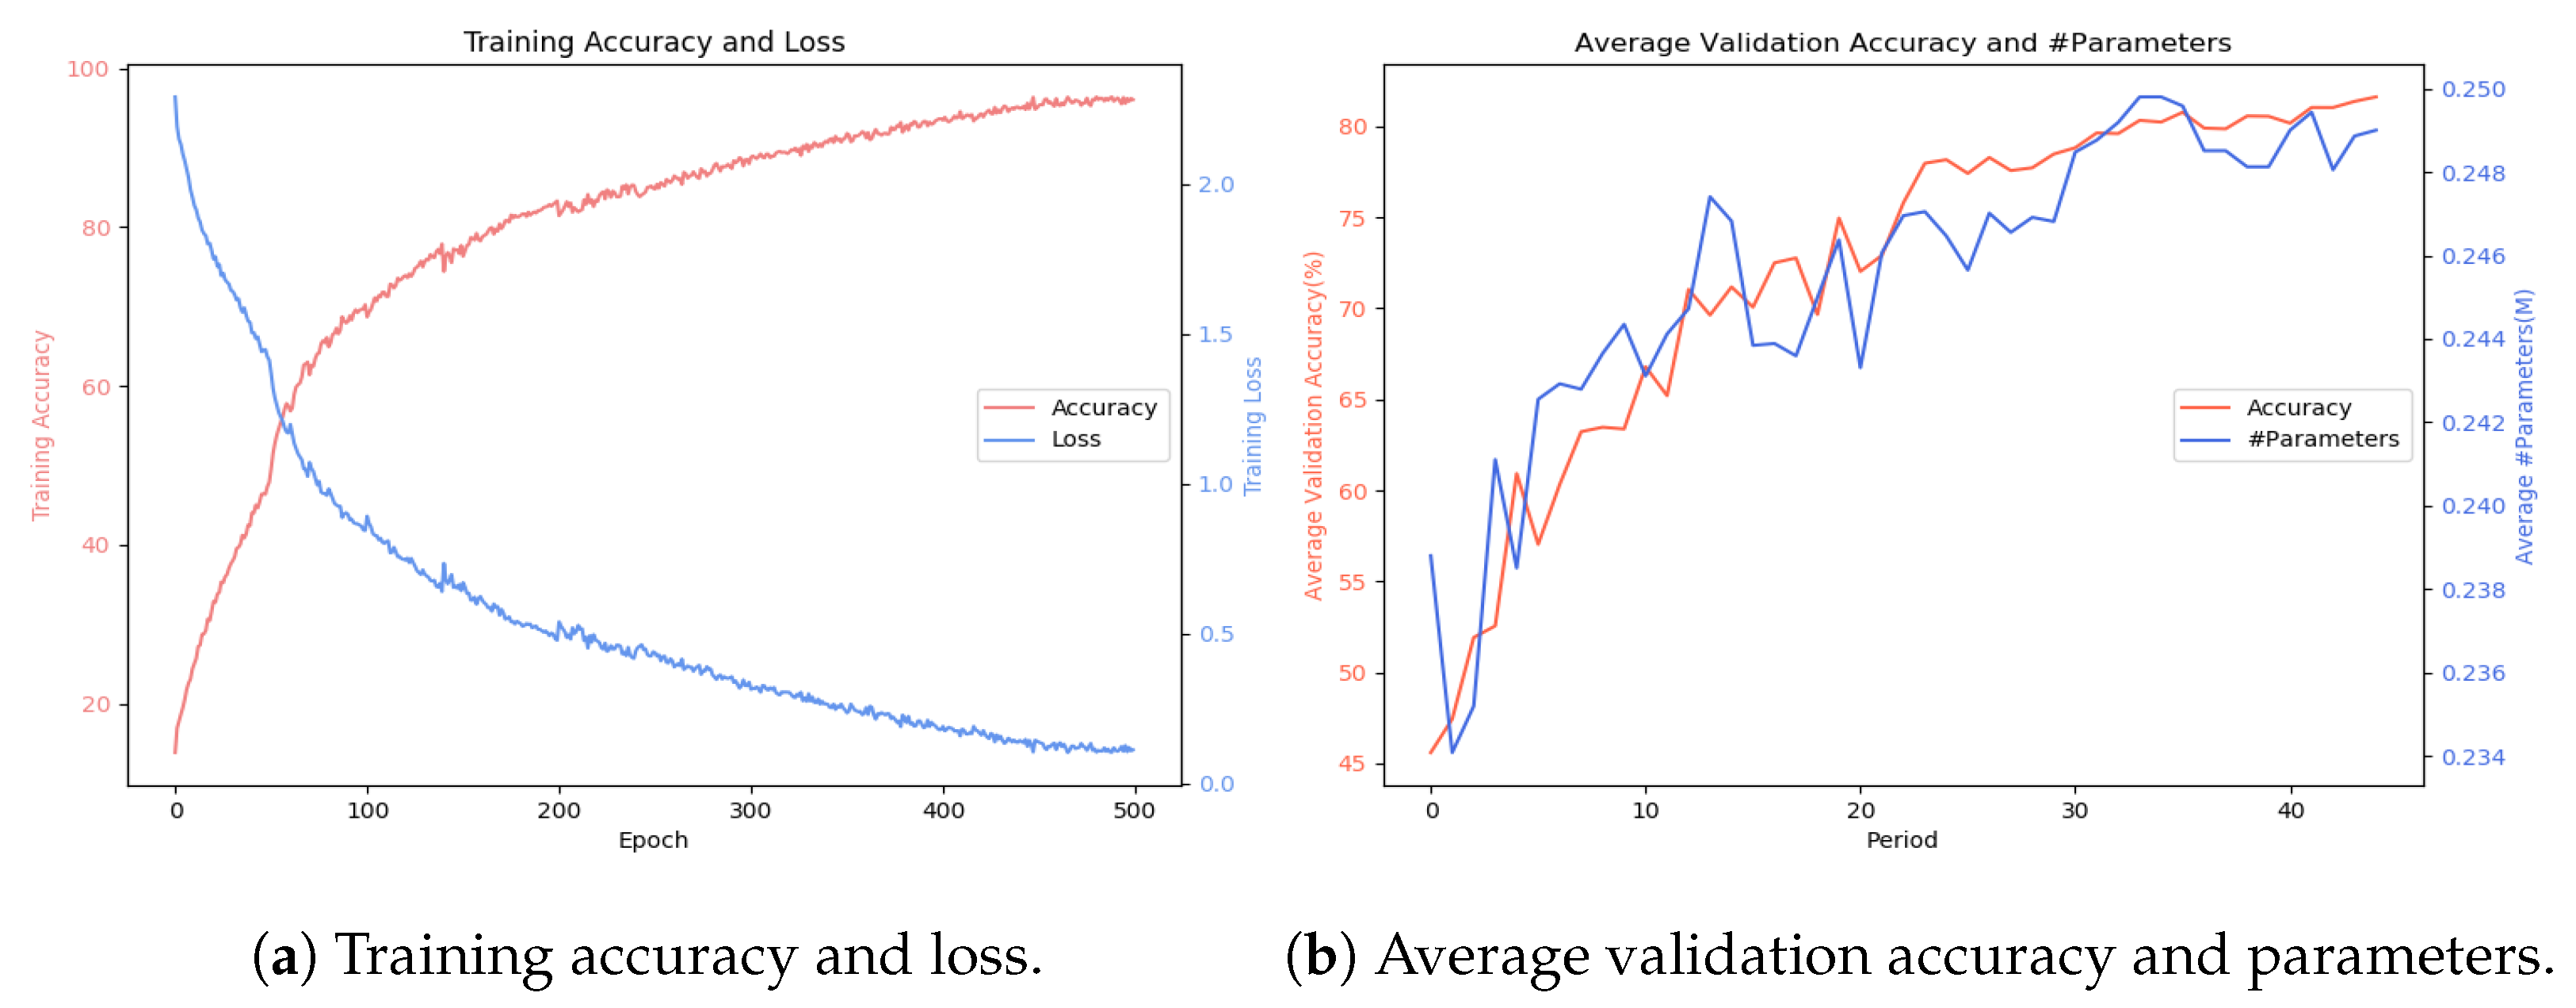
5.1.2. Experimental Results

Figure 7 illustrates the search phase of the multi-objective evolutionary NAS methods based on the proposed framework for CIFAR-10. Specifically, the fitness values of the population are recorded and visualized in different colors every five periods. The population after the last period is visualized in red.
Firstly, it can be observed from Figure 7a,c that applying traditional NSGA-II and MOEA/D algorithms under the proposed framework will lead to bad results. Both algorithms have the small model trap problem, in which the populations prematurely converge to the region of small models with low error rates (with model sizes around 0.12–0.16 M) in the early stages, lacking sufficient exploration of the large models. Subsequent experiments also verify that these small models, which perform well during the search phase, show decreased validation performance on complex datasets.
Further comparison between the NAS method based on the traditional NSGA-II and CARS algorithms (Figure 7b) reveals that the CARS algorithm can balance the search for models with different sizes and maintain good diversity in the population. On the other hand, by observing the Pareto front obtained by CARS, we can preliminarily infer the distribution of network architectures in the DARTS search space. After the model size increases to 0.2 M, the lowest error rate of the models hardly decreases. In this case, the algorithms may ignore the large models with performance similar to the small ones, but these large models may achieve better performance than the small ones on test data. Therefore, in the DARTS search space, the NAS algorithms should intentionally retain some of the well-performing large models.
Figure 7d illustrates the search process of the bi-population MOEA/D NAS method without the communication stage. Compared to Figure 7c, it can be observed that the population exhibits improved exploration in the entire search space. However, the two sub-populations update independently and lack the necessary interaction. As a result, the global population is optimized in two extreme directions, and models with medium sizes (with model sizes around 0.25–0.35 M) are neglected.
To address this issue, the communication stage is appended to the bi-population MOEA/D algorithm. Figure 7e shows the optimization process for the global population. Compared to the one without communication, the bi-population MOEA/D algorithm with communication exhibits a broad exploration range and maintains good diversity in population, achieving results similar to CARS. Figure 7f further visualizes the evolution of the two sub-populations separately, with A 1 represented by dots and A 2 by triangles. It can be observed that A 1 tends to search for small models (with model size < 0.24 M), while A 2 is devoted to exploring large models (with model size > 0.24 M). However, the two sub-populations are not entirely isolated; both sub-populations are able to explore the middle region of the search space. Thus, it can be inferred that, through the communication stage, the exchanged individuals may be optimized towards the new reference point in the other sub-population, which enables the search in the unexplored area between the original sub-populations. Figure 8 gives the training and validation metrics obtained during the whole search phase. For weight optimization, it can be seen from Figure 8a that, during the entire process, the training accuracy gradually increases while the loss decreases. Both of them stabilize at around 500 epochs. For the architecture optimization, Figure 8b visualizes the information of the architecture population in each period. It can be observed that, as the update periods progress, the average validation accuracy increases, and the fluctuation of the average model size gradually decreases. Specifically, the average model sizes in the later periods remain close to the median model size in the entire search space, rather than prematurely converging to a small and limited region as shown in Figure 7c.
To further demonstrate the effectiveness of our proposed algorithm, we also analyze and compare some Quality Indicators (QIs) between the bi-population MOEA/D and CARS algorithms. First, we focus on the diversity of the final population by computing the average distance to the two closest neighbors of each individual. Then, the average distance to the ideal point (which is set as (0, 0)) of each individual is calculated to further measure the quality of the Pareto fronts. In these experiments, our algorithm achieves two metric values of 0.3868 and 0.1195, while CARS achieves 0.1482 and 0.1046. It can be concluded that the two methods obtain Pareto fronts with comparable quality, and ours is capable of searching individuals with higher diversity.
Finally, we compare the metrics in the training process between the CARS algorithm and the bi-population MOEA/D algorithm. As for the search time, the main costs for both algorithms lie in two parts. The first part is the weight optimization, with a total of 500 epochs throughout the entire search phase. The second part is the architecture optimization, with the population to be evaluated in each period. For both the improved NSGA-II algorithm used in CARS and the bi-population MOEA/D algorithm designed in this study, 2 × N pop individuals are required to be evaluated in each period. Under the settings in Table 1, the average search time of both algorithms falls within the range of 46,000–47,000 s, approximately 13 GPU hours (≈0.54 GPU days).
Through the comparison of the search performance on CIFAR-10 between the multi-objective evolutionary NAS methods, it can be concluded that the small model trap indeed exists in the DARTS search space. Using traditional NSGA-II or MOEA/D algorithms will lead to premature convergence, reducing the diversity of the population and neglecting the large models in the search space. Further experiments validate the effectiveness of the bi-population MOEA/D algorithm. By setting different sub-populations and different optimization directions, the small model trap can be effectively addressed. The introduced communication mechanism allows the algorithm to fully explore and develop in a complex and large search space, which is capable of obtaining well-distributed and high-performing network architectures.

5.2. Test Performance Comparison on CIFAR-10 Dataset

In this experiment, we aim to compare the test performance of the network architectures searched by the representative single-objective and multi-objective NAS methods with the proposed bi-population MOEA/D-based NAS method. For single-objective NAS methods, the primary comparison is based on the test error or accuracy rate of the searched architectures. For multi-objective NAS methods, we mainly focus on the test error or accuracy rate of the searched architectures as well as the model size (approximated by the number of trainable parameters).

5.2.1. Comparison Algorithms

The comparison algorithms in this experiment are categorized based on different strategies: reinforcement-learning-based NAS algorithms like ENAS [43] and NASNet-A [44]; gradient-based NAS algorithms like DARTS [21]; and EC-NAS algorithms like AmoebaNet-A [12], hierarchical evolution [50], NSGA-Net [10], LEMONADE [13], and CARS [14]. In addition, the manually designed network DenseNet-BC [4] is included as a benchmark to validate the effectiveness of the algorithms.

5.2.2. Experimental Results

The test performance of the network architectures searched by various NAS methods on the CIFAR-10 dataset is summarized in Table 2. Note that the multi-objective methods are labeled with the abbreviation MO. Additionally, the proposed bi-population MOEA/D-based NAS method is abbreviated as Bi-MOEA/D-NAS, and four well-distributed models are selected to evaluate the test performance.
Overall, it can be observed that the majority of network architectures searched by NAS methods can achieve higher accuracy with smaller model sizes compared to the manually designed DenseNet-BC, which validates the practicability of NAS. Compared with the reinforcement-learning-based NAS methods, Bi-MOEA/D-NAS can discover models with fewer parameters and higher test accuracy than ENAS. Although it achieves slightly lower accuracy compared to NASNet-A with similar model sizes (Bi-MOEA/D-NAS-4), NASNet has higher computational costs (2000 GPU days) than Bi-MOEA/D-NAS (0.5 GPU days). In comparison to the gradient-based DARTS, Bi-MOEA/D-NAS can obtain better network architectures (DARTS-V2 vs. Bi-MOEA/D-NAS-4) in similar model sizes.
Then, we focus on the comparison between various EC-NAS algorithms. AmoebeNet-A and hierarchical evolution, which were proposed early, generally require substantial computational resources to search for the optimal network architectures. In contrast, NSGA-Net, LEMONADE, CARS, and the proposed Bi-MOEA/D-NAS algorithms can improve search efficiency while maintaining search performance. In addition, these methods can search for network architectures of different sizes. Compared to NSGA-Net and LEMONADE, CARS and Bi-MOEA/D-NAS can obtain more diverse architectures in a shorter search time. Comparing CARS with Bi-MOEA/D-NAS, both methods can complete the search process within half a day. In terms of the larger models, Bi-MOEA/D-NAS has a slightly lower performance than CARS (CARS-H vs. Bi-MOEA/D-NAS-4), but it can achieve better performance on the smaller models with similar sizes (CARS-B and CARS-C vs. Bi-MOEA/D-NAS-1 and Bi-MOEA/D-NAS-2).
Therefore, the above experiment demonstrates the potential of EC in solving NAS problems. Furthermore, the results validate the effectiveness and practicality of the proposed Bi-MOEA/D-NAS method. Compared to the other representative NAS method, Bi-MOEA/D-NAS can efficiently excavate diverse models with high accuracy in a short search time.

5.3. Test Performance Comparison on Mini-ImageNet Dataset

In practical applications, data will usually present a more complex distribution. Thus, this experiment tries to evaluate the transferability and scalability of the optimal network architectures searched in Section 5.2 by applying them to the ImageNet dataset [51]. However, due to the large scale of ImageNet, training a single neural network model generally requires three days with eight NVIDIA Tesla V100 GPUs [14,37]. Consequently, we choose the Mini-ImageNet [52], which is a subset of the ImageNet, for the test performance evaluation.

5.3.1. Experimental Settings

Mini-ImageNet contains 60,000 images selected from ImageNet which are divided into 100 categories, and each category contains 600 images with an image size of 224 × 224 . The training set includes 64 categories with 38,400 images, the validation set includes 16 categories with 9600 images, and the test set includes 20 categories with 12,000 images. Since only the training and test steps are required, the datasets are merged and then randomly shuffled with an 8:2 split for the training and the test sets. Therefore, the network architectures are trained with 48,000 images and tested on 12,000 images.
Following the settings in DARTS and NASNet, the final network architectures in the Mini-ImageNet experiment are constructed with 14 cells, which were searched for CIFAR-10. The number of training epochs is set to 250, with the batch size being 128. The weight decay in the stochastic gradient descent is set to 3 × 10 5 , and the initial learning rate is 0.1, decaying with a factor of 0.97 after every epoch.

5.3.2. Comparison Algorithms

Since most of the representative NAS methods are evaluated on ImageNet, in this experiment, we only compare the performance of NAS methods that have made their searched network architectures publicly available. This includes methods based on reinforcement-learning-based NAS like NASNet; gradient-based NAS methods like DARTS (DARTS-V2 is adopted in this experiment) and GDAS-LEVEL2 [22]; and EC-NAS methods like AmoebaNet-A and CARS. Also, manually designed networks like ResNet34 [3] and MobileNet-V2 [53] are included. Note that the training of these two manually designed networks follows their common settings (reference from https://github.com/PaddlePaddle/PaddleClas (accessed on 1 March 2024), in which ResNet34 is trained for 120 epochs, and MobileNet-V2 is trained for 240 epochs).

5.3.3. Experimental Results

The test performance of the network architectures on the Mini-ImageNet dataset is shown in Table 3. It can be observed that the manually designed networks exhibit high performance. Among the four models found by the proposed algorithm, three achieve higher Top-1 classification accuracy with slightly larger model sizes than MobileNet. Compared to ResNet34, Bi-MOEA/D-NAS-2, Bi-MOEA/D-NAS-3, and Bi-MOEA/D-NAS-4 can achieve higher Top-1 classification accuracy and competitive Top-5 classification accuracy with a smaller model size.
For NASNet based on reinforcement learning, Bi-MOEA/D-NAS-2, Bi-MOEA/D-NAS-3, and Bi-MOEA/D-NAS-4 show slightly lower Top-1 accuracy but higher Top-5 accuracy in the classification tasks. More importantly, the search efficiency of Bi-MOEA/D-NAS improves by about three orders of magnitude compared to NASNet. On the other hand, for gradient-based methods like DARTS-V2 and GDAS-LEVEL2, Bi-MOEA/D-NAS is able to find network architectures that are superior in terms of accuracy and model size.
Among the architectures searched by EC-NAS, Bi-MOEA/D-NAS-4 achieves higher classification accuracy than AmoebaNet-A with a similar model size and shorter search time. Additionally, various models provided by CARS with model sizes similar to AmoebaNet-A are trained and evaluated for fair comparison. The results show that, on the Mini-ImageNet dataset, even the smallest model in Bi-MOEA/D-NAS outperforms CARS-G, while CARS-G performs worse than AmoebaNet-A with similar model sizes.
Therefore, the experiments on Mini-ImageNet demonstrate that the proposed Bi-MOEA/D-NAS method can apply network architectures searched in simpler datasets to more complex datasets and achieve good test results, which further indicates its transferability. However, there is still room for improvement in the network architectures found by the algorithm compared to parts of manually designed networks.

6. Conclusions

This paper explores the NAS problem by utilizing multi-objective evolutionary algorithms. Specifically, a multi-objective evolutionary NAS framework based on a weight-sharing supernet is designed that combines the characteristics of EC-NAS with gradient-based NAS. In this framework, the candidate network architectures are regarded as the individuals in the population. In addition, the idea of the one-shot model is combined, where all the network architectures are treated as subnets on a weight-sharing supernet. By sharing the weight parameters of the supernet, the population evaluation’s efficiency is significantly improved. To prevent the evolutionary algorithms from prematurely converging to the small model region due to the small model trap during the search phase, we further propose a bi-population MOEA/D-based NAS method. This method divides the original population in the traditional MOEA/D into two sub-populations, which optimize toward different directions to achieve the simultaneous search for models with different sizes. Furthermore, the introduced communication mechanism between sub-populations further ensures that the algorithm can sufficiently explore the entire search space. Experiments on CIFAR-10 and Mini-ImageNet datasets validate the effectiveness and transferability of the proposed method.
In the future, we may consider expanding the proposed NAS framework and method to other search spaces. Although the proposed NAS method can reduce the time consumed by the population evaluation to a large extent, this process still accounts for a significant portion of the running time. Thus, we may consider adopting surrogate models to achieve quick predictions of the network’s performance. Lastly, this work only focuses on the search for CNNs, while, in practical applications, there are also requirements for designing other networks like RNNs. Therefore, multiple search spaces may be adopted to design various types of neural networks in future work.

Author Contributions

Methodology, J.L. and Y.G.; formal analysis, J.L.; investigation, J.L.; writing—original draft preparation, J.L. and K.Z.; writing—review and editing, J.L., K.Z., Y.L. (Yuan Li) and Y.G.; supervision, Y.L. (Yun Li) and Y.G.; funding acquisition, Y.L. (Yun Li) and Y.G. All authors have read and agreed to the published version of the manuscript.

Funding

This work was supported in part by the Guangdong Regional Joint Funds for Basic and Applied Research under grant 2021B1515120078, in part by the Guangdong Natural Science Funds for Distinguished Young Scholars under grant 2022B1515020049, in part by the National Natural Science Foundation of China under grant 62276100, and in part by the TCL Young Scholars Program.

Data Availability Statement

The data presented in this study are available on request from the corresponding author.

Conflicts of Interest

The authors declare no conflicts of interest.

References

  1. Krizhevsky, A.; Sutskever, I.; Hinton, G.E. Imagenet classification with deep convolutional neural networks. Adv. Neural Inf. Process. Syst. 2012, 25, 1097–1105. [Google Scholar] [CrossRef]
  2. Simonyan, K.; Zisserman, A. Very deep convolutional networks for large-scale image recognition. arXiv 2014, arXiv:1409.1556. [Google Scholar]
  3. He, K.; Zhang, X.; Ren, S.; Sun, J. Deep residual learning for image recognition. In Proceedings of the IEEE Conference on Computer Vision and Pattern Recognition, Las Vegas, NV, USA, 27–30 June 2016; pp. 770–778. [Google Scholar]
  4. Huang, G.; Liu, Z.; Van Der Maaten, L.; Weinberger, K.Q. Densely connected convolutional networks. In Proceedings of the IEEE Conference on Computer Vision and Pattern Recognition, Honolulu, HI, USA, 21–26 July 2017; pp. 4700–4708. [Google Scholar]
  5. Zhang, Y.; Chan, W.; Jaitly, N. Very deep convolutional networks for end-to-end speech recognition. In Proceedings of the 2017 IEEE International Conference on Acoustics, Speech and Signal Processing (ICASSP), New Orleans, LA, USA, 5–9 March 2017; IEEE: New York, NY, USA, 2017; pp. 4845–4849. [Google Scholar]
  6. Wu, Y.; Schuster, M.; Chen, Z.; Le, Q.V.; Norouzi, M.; Macherey, W.; Krikun, M.; Cao, Y.; Gao, Q.; Macherey, K.; et al. Google’s neural machine translation system: Bridging the gap between human and machine translation. arXiv 2016, arXiv:1609.08144. [Google Scholar]
  7. Devlin, J.; Chang, M.W.; Lee, K.; Toutanova, K. Bert: Pre-training of deep bidirectional transformers for language understanding. arXiv 2018, arXiv:1810.04805. [Google Scholar]
  8. Liu, Y.; Sun, Y.; Xue, B.; Zhang, M.; Yen, G.G.; Tan, K.C. A survey on evolutionary neural architecture search. IEEE Trans. Neural Networks Learn. Syst. 2021, 34, 550–570. [Google Scholar] [CrossRef]
  9. Elsken, T.; Metzen, J.H.; Hutter, F. Neural architecture search: A survey. J. Mach. Learn. Res. 2019, 20, 1–21. [Google Scholar]
  10. Lu, Z.; Whalen, I.; Boddeti, V.; Dhebar, Y.; Deb, K.; Goodman, E.; Banzhaf, W. Nsga-net: Neural architecture search using multi-objective genetic algorithm. In Proceedings of the Genetic and Evolutionary Computation Conference, Prague, Czech Republic, 13–17 July 2019; pp. 419–427. [Google Scholar]
  11. Real, E.; Moore, S.; Selle, A.; Saxena, S.; Suematsu, Y.L.; Tan, J.; Le, Q.V.; Kurakin, A. Large-scale evolution of image classifiers. In Proceedings of the International Conference on Machine Learning, PMLR, Sydney, Australia, 6–11 August 2017; pp. 2902–2911. [Google Scholar]
  12. Real, E.; Aggarwal, A.; Huang, Y.; Le, Q.V. Regularized evolution for image classifier architecture search. In Proceedings of the AAAI Conference on Artificial Intelligence, Honolulu, HI, USA, 27 January–1 February 2019; Volume 33, pp. 4780–4789. [Google Scholar]
  13. Elsken, T.; Metzen, J.H.; Hutter, F. Efficient multi-objective neural architecture search via lamarckian evolution. arXiv 2018, arXiv:1804.09081. [Google Scholar]
  14. Yang, Z.; Wang, Y.; Chen, X.; Shi, B.; Xu, C.; Xu, C.; Tian, Q.; Xu, C. Cars: Continuous evolution for efficient neural architecture search. In Proceedings of the IEEE/CVF Conference on Computer Vision and Pattern Recognition, Seattle, WA, USA, 13–19 June 2020; pp. 1829–1838. [Google Scholar]
  15. Zoph, B.; Le, Q.V. Neural architecture search with reinforcement learning. arXiv 2016, arXiv:1611.01578. [Google Scholar]
  16. Baker, B.; Gupta, O.; Naik, N.; Raskar, R. Designing neural network architectures using reinforcement learning. arXiv 2016, arXiv:1611.02167. [Google Scholar]
  17. Liu, Y.; Jia, X.; Tan, M.; Vemulapalli, R.; Zhu, Y.; Green, B.; Wang, X. Search to distill: Pearls are everywhere but not the eyes. In Proceedings of the IEEE/CVF Conference on Computer Vision and Pattern Recognition, Seattle, WA, USA, 13–19 June 2020; pp. 7539–7548. [Google Scholar]
  18. Cai, H.; Chen, T.; Zhang, W.; Yu, Y.; Wang, J. Efficient architecture search by network transformation. In Proceedings of the AAAI Conference on Artificial Intelligence, New Orleans, LA, USA, 2–7 February 2018; Volume 32. [Google Scholar]
  19. Cai, H.; Zhu, L.; Han, S. Proxylessnas: Direct neural architecture search on target task and hardware. arXiv 2018, arXiv:1812.00332. [Google Scholar]
  20. Ahmed, K.; Torresani, L. Maskconnect: Connectivity learning by gradient descent. In Proceedings of the European Conference on Computer Vision (ECCV), Munich, Germany, 8–14 September 2018; pp. 349–365. [Google Scholar]
  21. Liu, H.; Simonyan, K.; Yang, Y. Darts: Differentiable architecture search. arXiv 2018, arXiv:1806.09055. [Google Scholar]
  22. Dong, X.; Yang, Y. Searching for a robust neural architecture in four gpu hours. In Proceedings of the IEEE/CVF Conference on Computer Vision and Pattern Recognition, Long Beach, CA, USA, 15–20 June 2019; pp. 1761–1770. [Google Scholar]
  23. Darwish, A.; Hassanien, A.E.; Das, S. A survey of swarm and evolutionary computing approaches for deep learning. Artif. Intell. Rev. 2020, 53, 1767–1812. [Google Scholar] [CrossRef]
  24. Xie, L.; Yuille, A. Genetic cnn. In Proceedings of the IEEE International Conference on Computer Vision, Venice, Italy, 22–29 October 2017; pp. 1379–1388. [Google Scholar]
  25. Loni, M.; Sinaei, S.; Zoljodi, A.; Daneshtalab, M.; Sjödin, M. DeepMaker: A multi-objective optimization framework for deep neural networks in embedded systems. Microprocess. Microsyst. 2020, 73, 102989. [Google Scholar] [CrossRef]
  26. Sun, Y.; Xue, B.; Zhang, M.; Yen, G.G. Completely automated CNN architecture design based on blocks. IEEE Trans. Neural Networks Learn. Syst. 2019, 31, 1242–1254. [Google Scholar] [CrossRef] [PubMed]
  27. Javaheripi, M.; Samragh, M.; Javidi, T.; Koushanfar, F. GeneCAI: Gene tic evolution for acquiring c ompact AI. In Proceedings of the 2020 Genetic and Evolutionary Computation Conference, Cancún, Mexico, 8–12 July 2020; pp. 350–358. [Google Scholar]
  28. Deb, K.; Pratap, A.; Agarwal, S.; Meyarivan, T. A fast and elitist multiobjective genetic algorithm: NSGA-II. IEEE Trans. Evol. Comput. 2002, 6, 182–197. [Google Scholar] [CrossRef]
  29. Mitchell, M. An Introduction to Genetic Algorithms; MIT Press: Cambridge, MA, USA, 1998. [Google Scholar]
  30. Deb, K.; Agrawal, R.B. Simulated binary crossover for continuous search space. Complex Syst. 1995, 9, 115–148. [Google Scholar]
  31. Sun, Y.; Xue, B.; Zhang, M.; Yen, G.G. Evolving deep convolutional neural networks for image classification. IEEE Trans. Evol. Comput. 2019, 24, 394–407. [Google Scholar] [CrossRef]
  32. Lorenzo, P.R.; Nalepa, J. Memetic evolution of deep neural networks. In Proceedings of the Genetic and Evolutionary Computation Conference, Kyoto, Japan, 15–19 July 2018; pp. 505–512. [Google Scholar]
  33. Lu, Z.; Whalen, I.; Dhebar, Y.; Deb, K.; Goodman, E.D.; Banzhaf, W.; Boddeti, V.N. Multiobjective evolutionary design of deep convolutional neural networks for image classification. IEEE Trans. Evol. Comput. 2020, 25, 277–291. [Google Scholar] [CrossRef]
  34. Zhang, Q.; Li, H. MOEA/D: A multiobjective evolutionary algorithm based on decomposition. IEEE Trans. Evol. Comput. 2007, 11, 712–731. [Google Scholar] [CrossRef]
  35. Zhang, C.; Shao, H.; Li, Y. Particle swarm optimisation for evolving artificial neural network. In Proceedings of the SMC 2000 Conference Proceedings, 2000 IEEE International Conference on Systems, Man and Cybernetics, ‘Cybernetics Evolving to Systems, Humans, Organizations, and Their Complex Interactions’ (cat. no. 0. IEEE), Nashville, TN, USA, 8–11 October 2000; Volume 4, pp. 2487–2490. [Google Scholar]
  36. Fielding, B.; Zhang, L. Evolving image classification architectures with enhanced particle swarm optimisation. IEEE Access 2018, 6, 68560–68575. [Google Scholar] [CrossRef]
  37. He, C.; Ye, H.; Shen, L.; Zhang, T. Milenas: Efficient neural architecture search via mixed-level reformulation. In Proceedings of the IEEE/CVF Conference on Computer Vision and Pattern Recognition, Seattle, WA, USA, 13–19 June 2020; pp. 11993–12002. [Google Scholar]
  38. Brock, A.; Lim, T.; Ritchie, J.M.; Weston, N. Smash: One-shot model architecture search through hypernetworks. arXiv 2017, arXiv:1708.05344. [Google Scholar]
  39. Sun, Y.; Wang, H.; Xue, B.; Jin, Y.; Yen, G.G.; Zhang, M. Surrogate-assisted evolutionary deep learning using an end-to-end random forest-based performance predictor. IEEE Trans. Evol. Comput. 2019, 24, 350–364. [Google Scholar] [CrossRef]
  40. Lu, Z.; Deb, K.; Goodman, E.; Banzhaf, W.; Boddeti, V.N. Nsganetv2: Evolutionary multi-objective surrogate-assisted neural architecture search. In Proceedings of the Computer Vision—ECCV 2020: 16th European Conference, Glasgow, UK, 23–28 August 2020; Proceedings, Part I 16. Springer: Berlin/Heidelberg, Germany, 2020; pp. 35–51. [Google Scholar]
  41. Rawal, A.; Miikkulainen, R. From nodes to networks: Evolving recurrent neural networks. arXiv 2018, arXiv:1803.04439. [Google Scholar]
  42. Črepinšek, M.; Liu, S.H.; Mernik, M.; Ravber, M. Long term memory assistance for evolutionary algorithms. Mathematics 2019, 7, 1129. [Google Scholar] [CrossRef]
  43. Pham, H.; Guan, M.; Zoph, B.; Le, Q.; Dean, J. Efficient neural architecture search via parameters sharing. In Proceedings of the International Conference on Machine Learning, PMLR, Stockholm, Sweden, 10–15 July 2018; pp. 4095–4104. [Google Scholar]
  44. Zoph, B.; Vasudevan, V.; Shlens, J.; Le, Q.V. Learning transferable architectures for scalable image recognition. In Proceedings of the IEEE Conference on Computer Vision and Pattern Recognition, Salt Lake City, UT, USA, 18–23 June 2018; pp. 8697–8710. [Google Scholar]
  45. Krizhevsky, A.; Hinton, G. Learning Multiple Layers of Features from Tiny Images. 2009. Available online: http://www.cs.utoronto.ca/~kriz/learning-features-2009-TR.pdf (accessed on 30 January 2024).
  46. Zheng, H.; An, K.; Ou, Z. Efficient neural architecture search for end-to-end speech recognition via straight-through gradients. In Proceedings of the 2021 IEEE Spoken Language Technology Workshop (SLT), Online Conference, 19–22 January 2021; IEEE: New York, NY, USA, 2021; pp. 60–67. [Google Scholar]
  47. Guo, Z.; Zhang, X.; Mu, H.; Heng, W.; Liu, Z.; Wei, Y.; Sun, J. Single path one-shot neural architecture search with uniform sampling. In Proceedings of the Computer Vision–ECCV 2020: 16th European Conference, Glasgow, UK, 23–28 August 2020; Proceedings, Part XVI 16. Springer: Berlin/Heidelberg, Germany, 2020; pp. 544–560. [Google Scholar]
  48. Ying, C.; Klein, A.; Christiansen, E.; Real, E.; Murphy, K.; Hutter, F. Nas-bench-101: Towards reproducible neural architecture search. In Proceedings of the International Conference on Machine Learning, PMLR, Long Beach, CA, USA, 9–15 June 2019; pp. 7105–7114. [Google Scholar]
  49. Dong, X.; Yang, Y. Nas-bench-201: Extending the scope of reproducible neural architecture search. arXiv 2020, arXiv:2001.00326. [Google Scholar]
  50. Liu, H.; Simonyan, K.; Vinyals, O.; Fernando, C.; Kavukcuoglu, K. Hierarchical representations for efficient architecture search. arXiv 2017, arXiv:1711.00436. [Google Scholar]
  51. Deng, J.; Dong, W.; Socher, R.; Li, L.J.; Li, K.; Fei-Fei, L. Imagenet: A large-scale hierarchical image database. In Proceedings of the 2009 IEEE Conference on Computer Vision and Pattern Recognition, Miami, FL, USA, 20–25 June 2009; pp. 248–255. [Google Scholar]
  52. Russakovsky, O.; Deng, J.; Su, H.; Krause, J.; Satheesh, S.; Ma, S.; Huang, Z.; Karpathy, A.; Khosla, A.; Bernstein, M.; et al. Imagenet large scale visual recognition challenge. Int. J. Comput. Vis. 2015, 115, 211–252. [Google Scholar] [CrossRef]
  53. Howard, A.G.; Zhu, M.; Chen, B.; Kalenichenko, D.; Wang, W.; Weyand, T.; Andreetto, M.; Adam, H. Mobilenets: Efficient convolutional neural networks for mobile vision applications. arXiv 2017, arXiv:1704.04861. [Google Scholar]
Figure 1. EC-NAS basic framework.
Applsci 14 06143 g001
Figure 2. Search space of DARTS.
Applsci 14 06143 g002
Figure 3. The proposed multi-objective evolutionary NAS framework.
Applsci 14 06143 g003
Figure 4. An example of population distribution and the corresponding Pareto fronts.
Applsci 14 06143 g004
Figure 5. An example of weight vectors and sub-populations.
Applsci 14 06143 g005
Figure 6. Evolutionary operators based on the DARTS search space.
Applsci 14 06143 g006
Figure 7. Visualization of the search phase of the multi-objective evolutionary NAS methods for CIFAR-10. (a) Based on traditional NSGA-II; (b) based on improved NSGA-II (CARS); (c) based on traditional MOEA/D; (d) based on bi-population MOEA/D (without communication); (e) based on bi-population MOEA/D (with communication, visualized by the global population); (f) based on bi-population MOEA/D (with communication, visualized by the sub-populations).
Applsci 14 06143 g007
Figure 8. The training and validation metrics during the search phase of bi-population MOEA/D algorithm (with communication).
Applsci 14 06143 g008
Table 1. The hyper-parameter settings for the bi-population MOEA/D-based NAS algorithm.
ParametersDescriptionValue
E warmup Number of warm-up epochs50
N period Number of update periods45
E ω Number of weight optimization epochs per period10
N pop Population size32
N w Number of weight vectors16
TNumber of neighbours4
g ( · ) Aggregation function g t e
p c Crossover rate0.5
p m Mutation rate0.1
N comm Number of exchanged individuals3
Table 2. Test performance of the searched network architectures on CIFAR-10.
ArchitectureTest Error (%)#Params (M)Search Cost
(GPU Days)
Search Method
DenseNet-BC3.4625.6-Manual design
ENAS2.914.24Reinforcement learning
NASNet-A2.653.32000Reinforcement learning
DARTS-V13.003.31.5Gradient based
DARTS-V22.763.34Gradient based
AmoebaNet-A3.123.13150Evolution
Hierarchical evolution3.7515.7300Evolution
NSGA-Net-13.853.38Evolution (MO)
NSGA-Net-22.5026.84Evolution (MO)
LEMONADE-13.691.180Evolution (MO)
LEMONADE-23.054.780Evolution (MO)
LEMONADE-32.5813.180Evolution (MO)
CARS-B2.872.70.4Evolution (MO)
CARS-C2.842.80.4Evolution (MO)
CARS-E2.863.00.4Evolution (MO)
CARS-H2.663.30.4Evolution (MO)
Bi-MOEA/D-NAS-12.802.530.5Evolution (MO)
Bi-MOEA/D-NAS-22.862.710.5Evolution (MO)
Bi-MOEA/D-NAS-32.852.880.5Evolution (MO)
Bi-MOEA/D-NAS-42.723.260.5Evolution (MO)
Table 3. Test performance of the network architectures on Mini-ImageNet.
ArchitectureTop-1
Acc (%)
Top-5
Acc (%)
#Params
(M)
Search Cost
(GPU Days)
Search Method
ResNet3476.8891.7321.34-Manual Design
MobileNet-V276.7792.462.35-Manual Design
NASNet77.2591.375.242000Reinforcement Learning
DARTS-V274.9790.784.604Gradient Based
GDAS-LEVEL274.8490.835.470.21Gradient Based
AmoebaNet-A76.7691.104.653150Evolution
CARS-C75.2090.744.070.4Evolution (MO)
CARS-E75.2690.944.260.4Evolution (MO)
CARS-F75.9290.794.420.4Evolution (MO)
CARS-G76.1491.344.560.4Evolution (MO)
Bi-MOEA/D-NAS-176.4691.363.730.5Evolution (MO)
Bi-MOEA/D-NAS-276.9991.383.960.5Evolution (MO)
Bi-MOEA/D-NAS-376.8991.404.170.5Evolution (MO)
Bi-MOEA/D-NAS-477.1091.584.660.5Evolution (MO)
Disclaimer/Publisher’s Note: The statements, opinions and data contained in all publications are solely those of the individual author(s) and contributor(s) and not of MDPI and/or the editor(s). MDPI and/or the editor(s) disclaim responsibility for any injury to people or property resulting from any ideas, methods, instructions or products referred to in the content.

