


Investigation Lubricity Performance of Lubricating Oil Used in Marine Diesel Engine—Fuel Injection Pump

Abstract
1. Introduction
2. Materials and Methods
2.1. Oil Samples
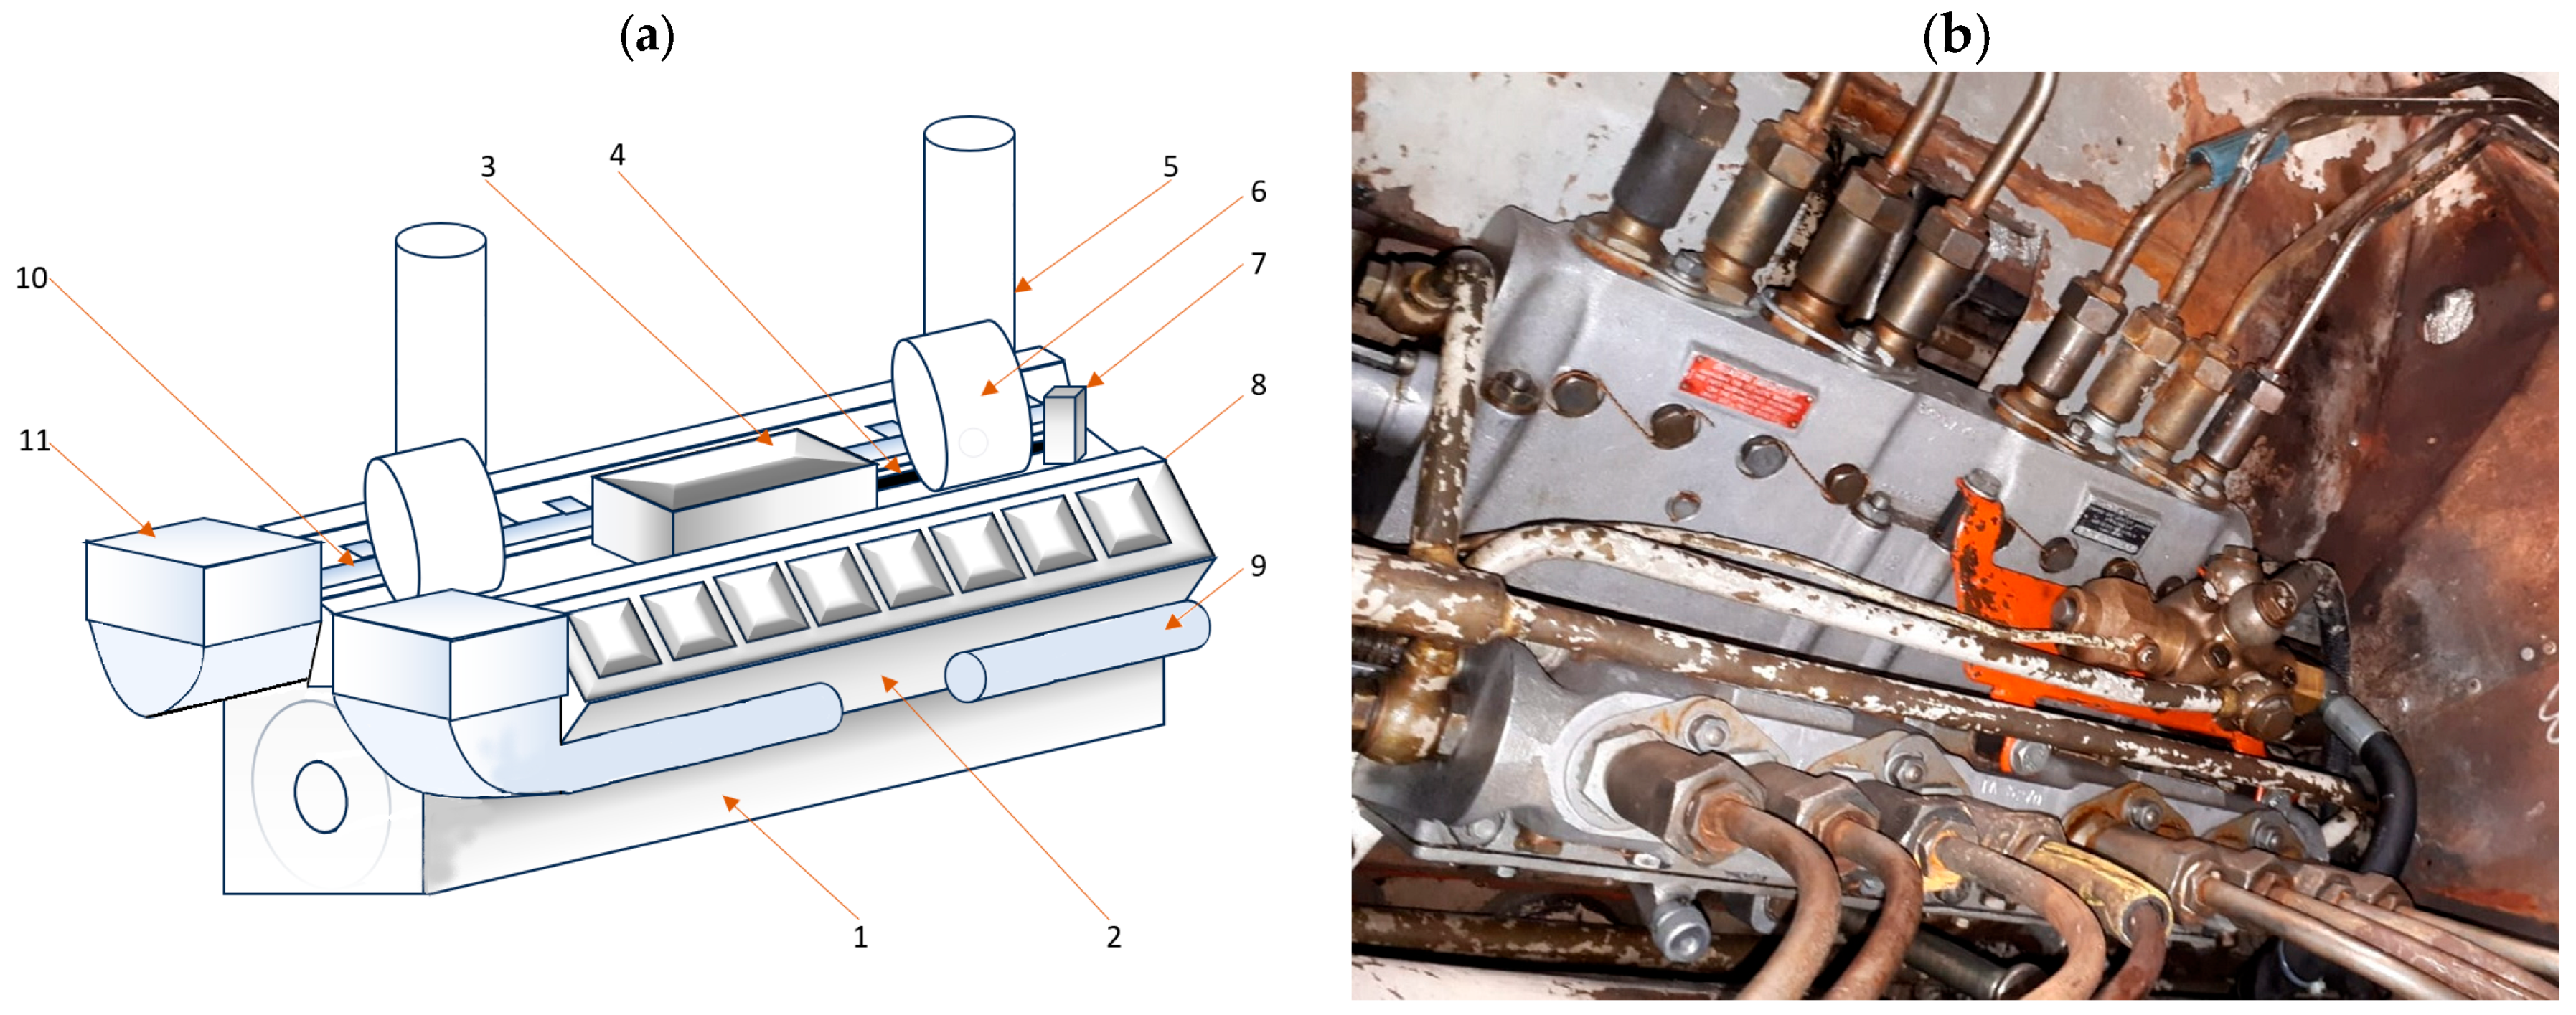
2.2. Laboratory Equipment Used for Oil Test
- load increase rate: 409 N/s;
- spindle speed: 500 rpm;
- initial load–maximum load: 0–7200 N;
- test time: 18 s;
- lubrication method: immersion.
3. Results and Discussion
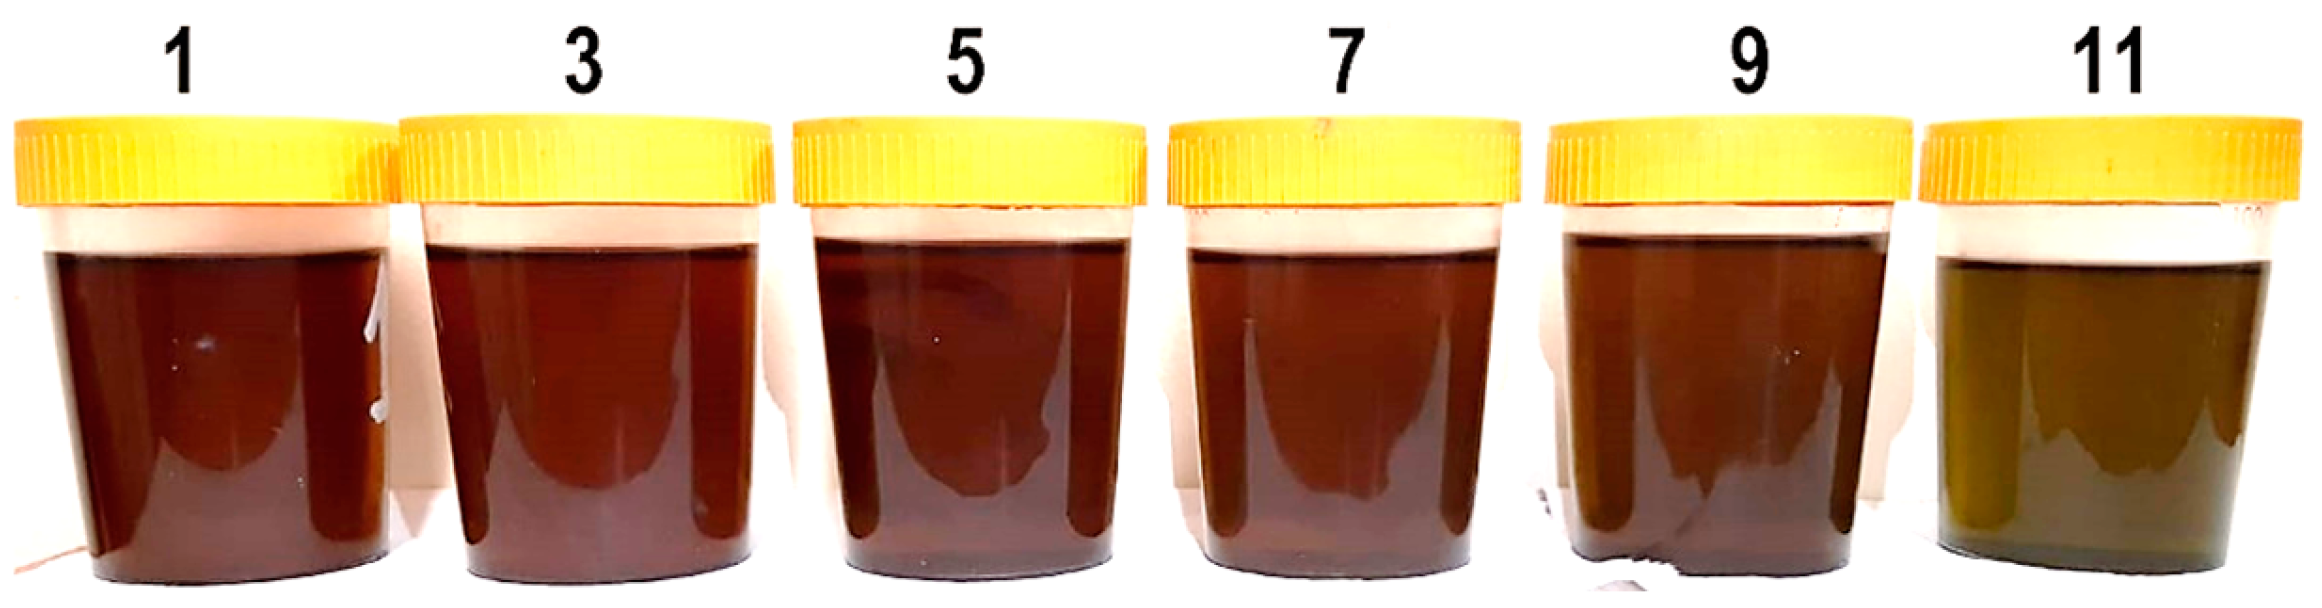
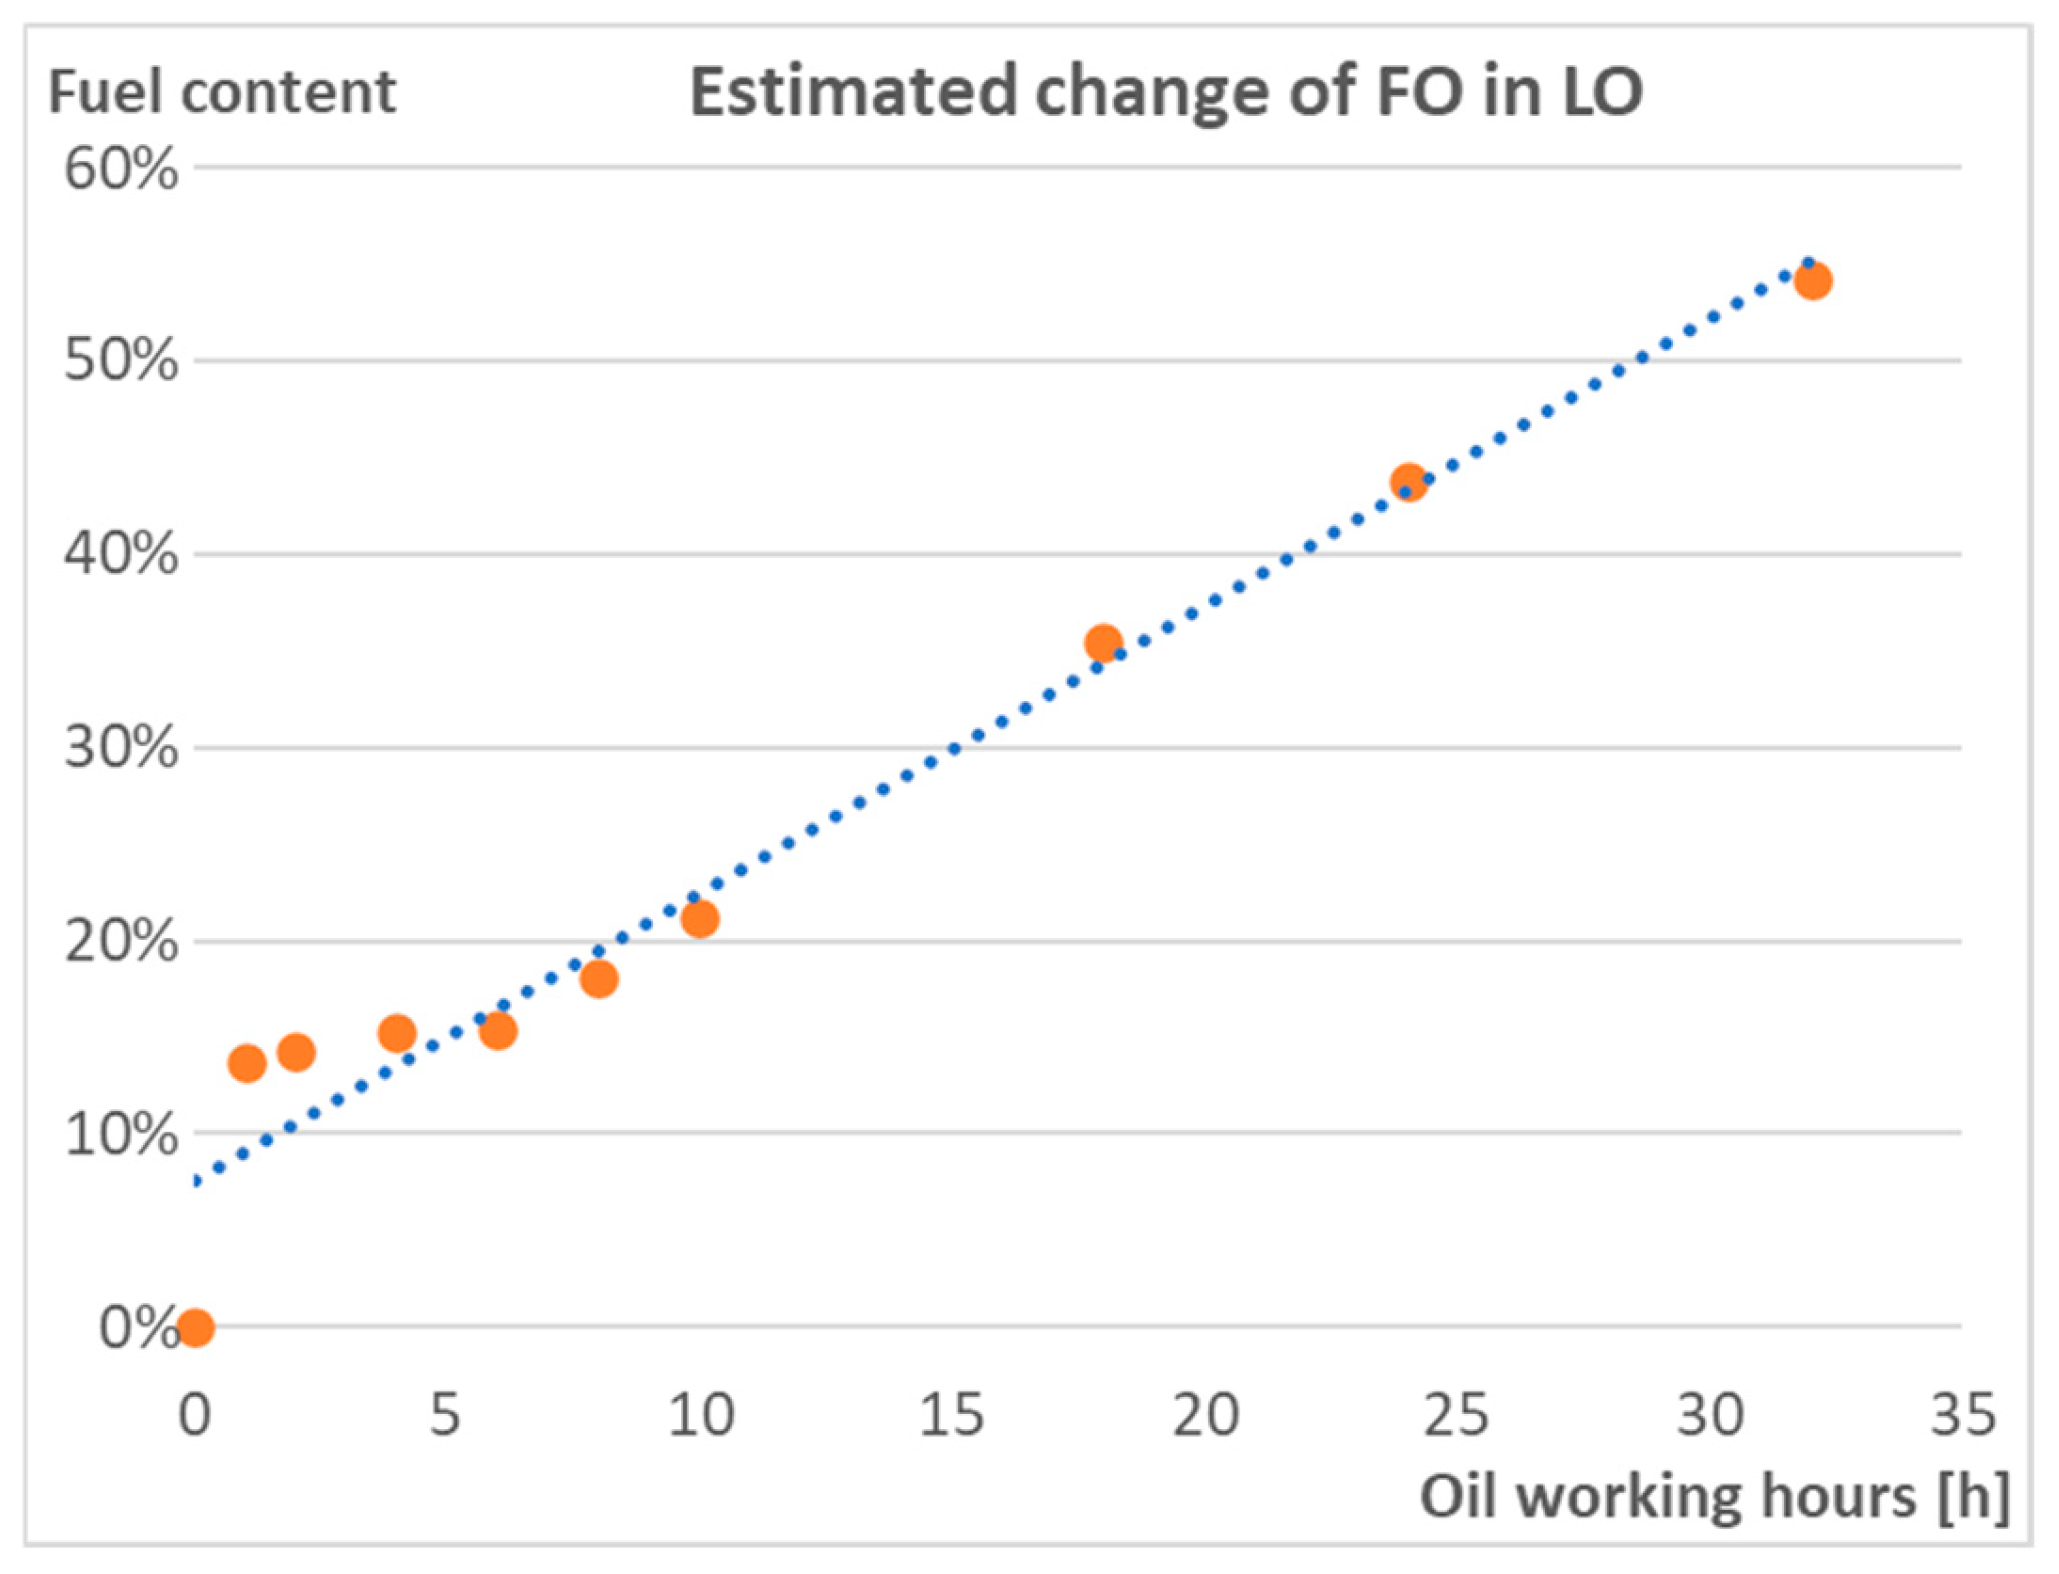
3.1. Density and Fuel Content in Oil
- qLO—quantity of Lubricating Oil (Fresh Oil) = 1.8 in liters,
- qFO—quantity of Fuel Oil in liters,
- qUO—quantity of Used Oil in liters,
- ρLO—Lubricating Oil density = 0.8886 g/cm3 (the density of fresh oil measured in the laboratory, which is consistent with the oil manufacturer’s data),
- ρFO—Fuel Oil density = 0.8317 g/cm3 [23],
- ρUO—Used Oil density in g/cm3.

| Oil Working Period | Lubricating Oil Density at 15 °C | Fuel Oil Quantity | Fuel Oil Quantity (Volume) |
|---|---|---|---|
| [g/cm3] | [L] | [%] | |
| Fresh oil | 0.8886 | 0 | 0.0% |
| after 1 h | 0.8749 | 0.5708 | 13.7% |
| after 2 h | 0.8744 | 0.5986 | 14.2% |
| after 4 h | 0.8723 | 0.7227 | 15.3% |
| after 6 h | 0.8708 | 0.8194 | 15.4% |
| after 8 h | 0.8689 | 0.9532 | 18.1% |
| after 10 h | 0.8645 | 1.3226 | 21.3% |
| after 18 h | 0.8625 | 1.5253 | 35.5% |
| after 24 h | 0.8614 | 1.6485 | 43.8% |
| after 32 h | 0.8577 | 2.1392 | 54.3% |
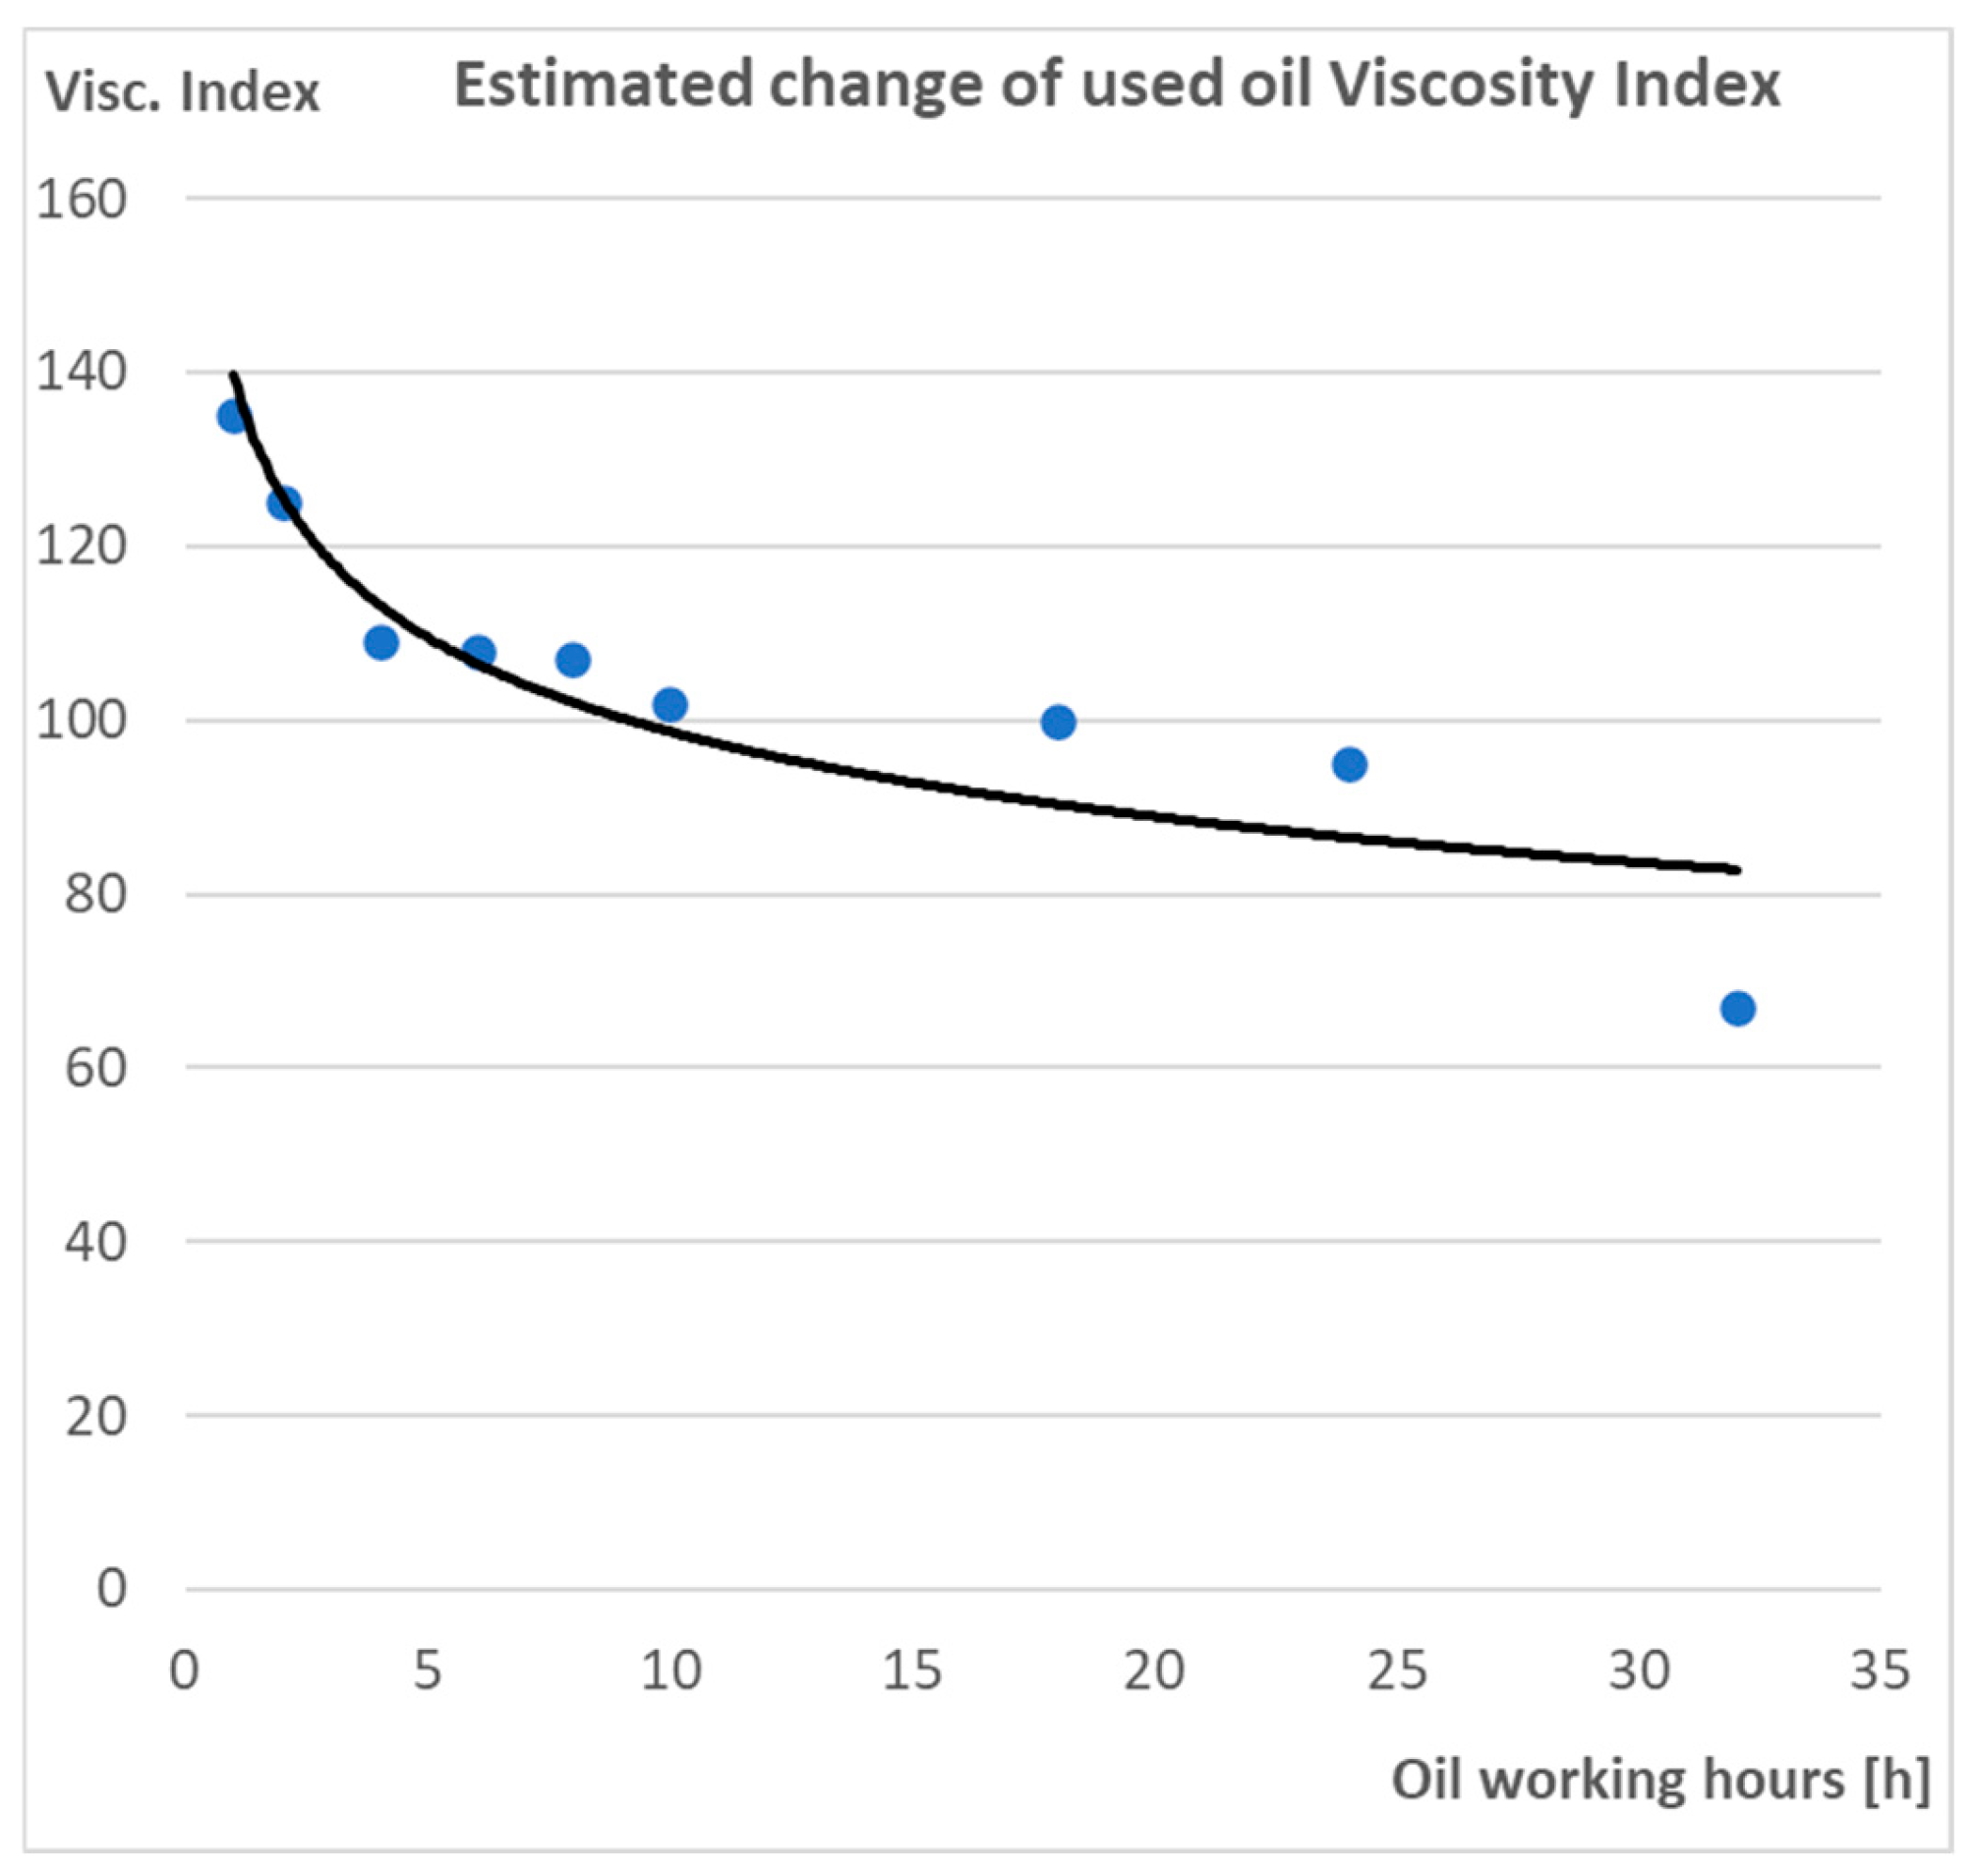
3.2. Viscosity and Viscosity Index
- Low—under 3,
- Medium—35 to 80,
- High—80 to 110,
- Very high—above 110.
3.3. Four-Ball Rolling Contact Fatigue Test
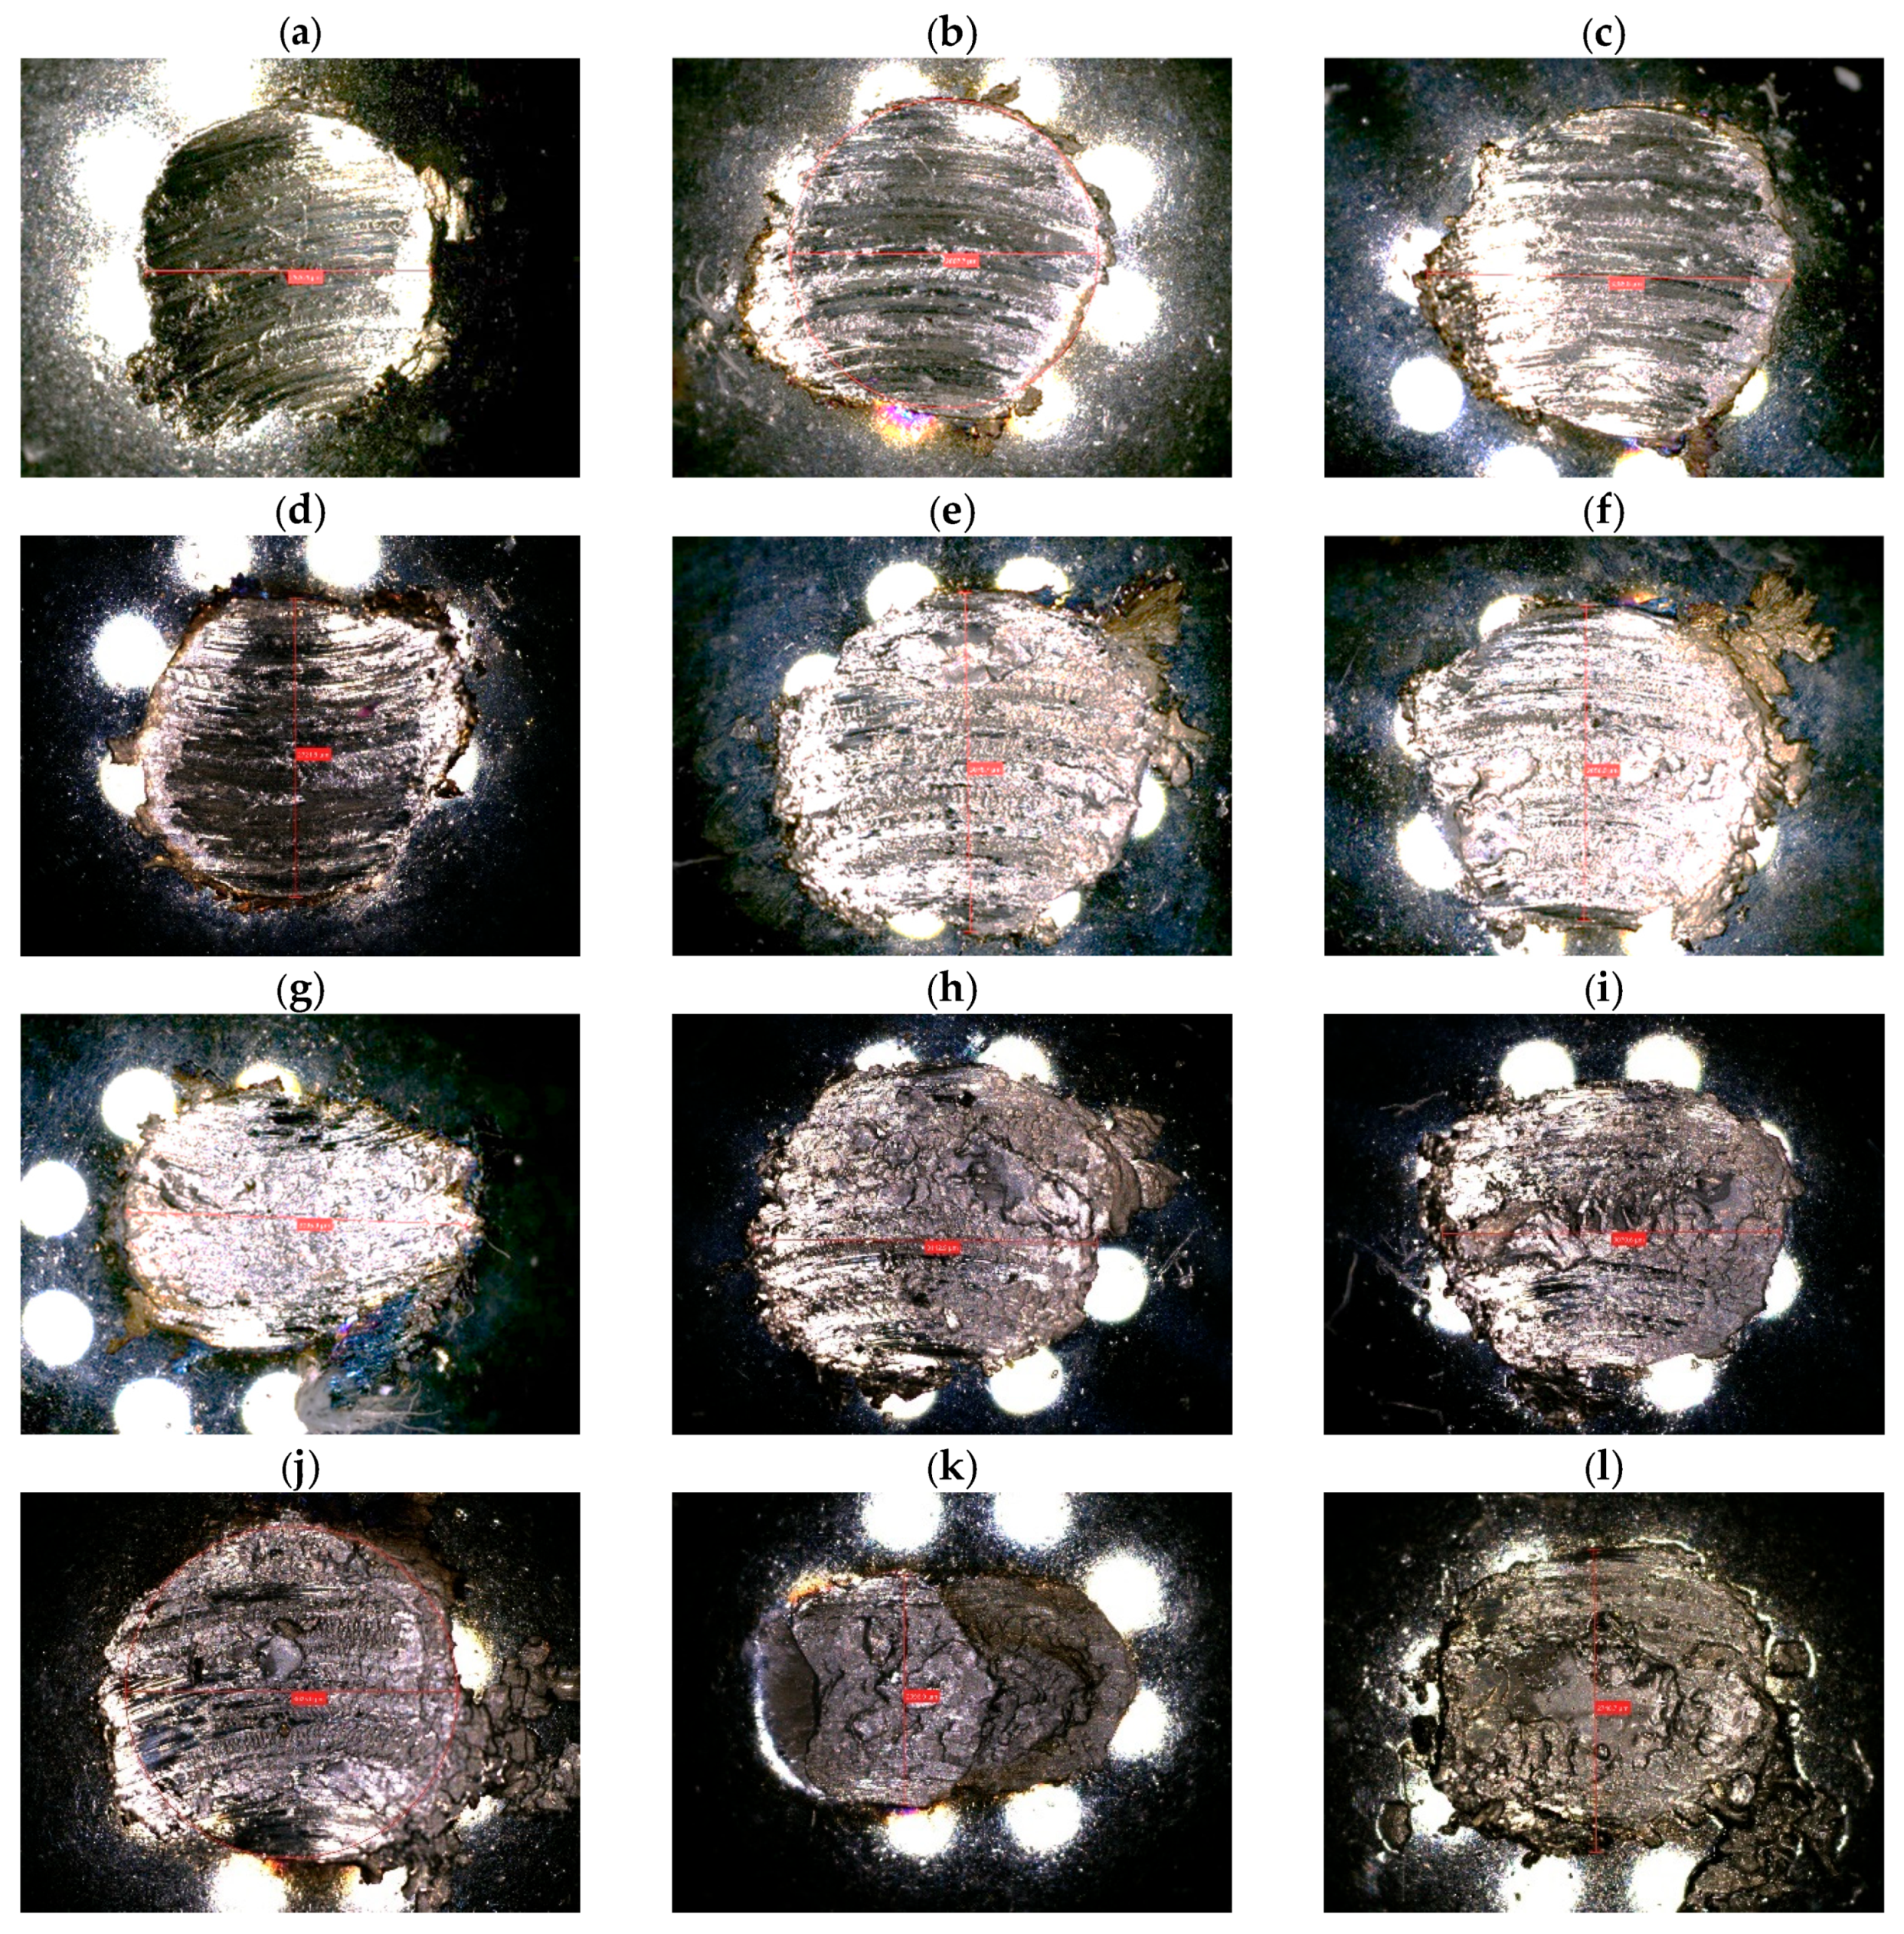
3.4. Four-Ball Antiwear Test
- d—average diameter of the wear scar on the balls [mm];
- 0.52—coefficient resulting from the distribution of forces in the four-ball friction node;
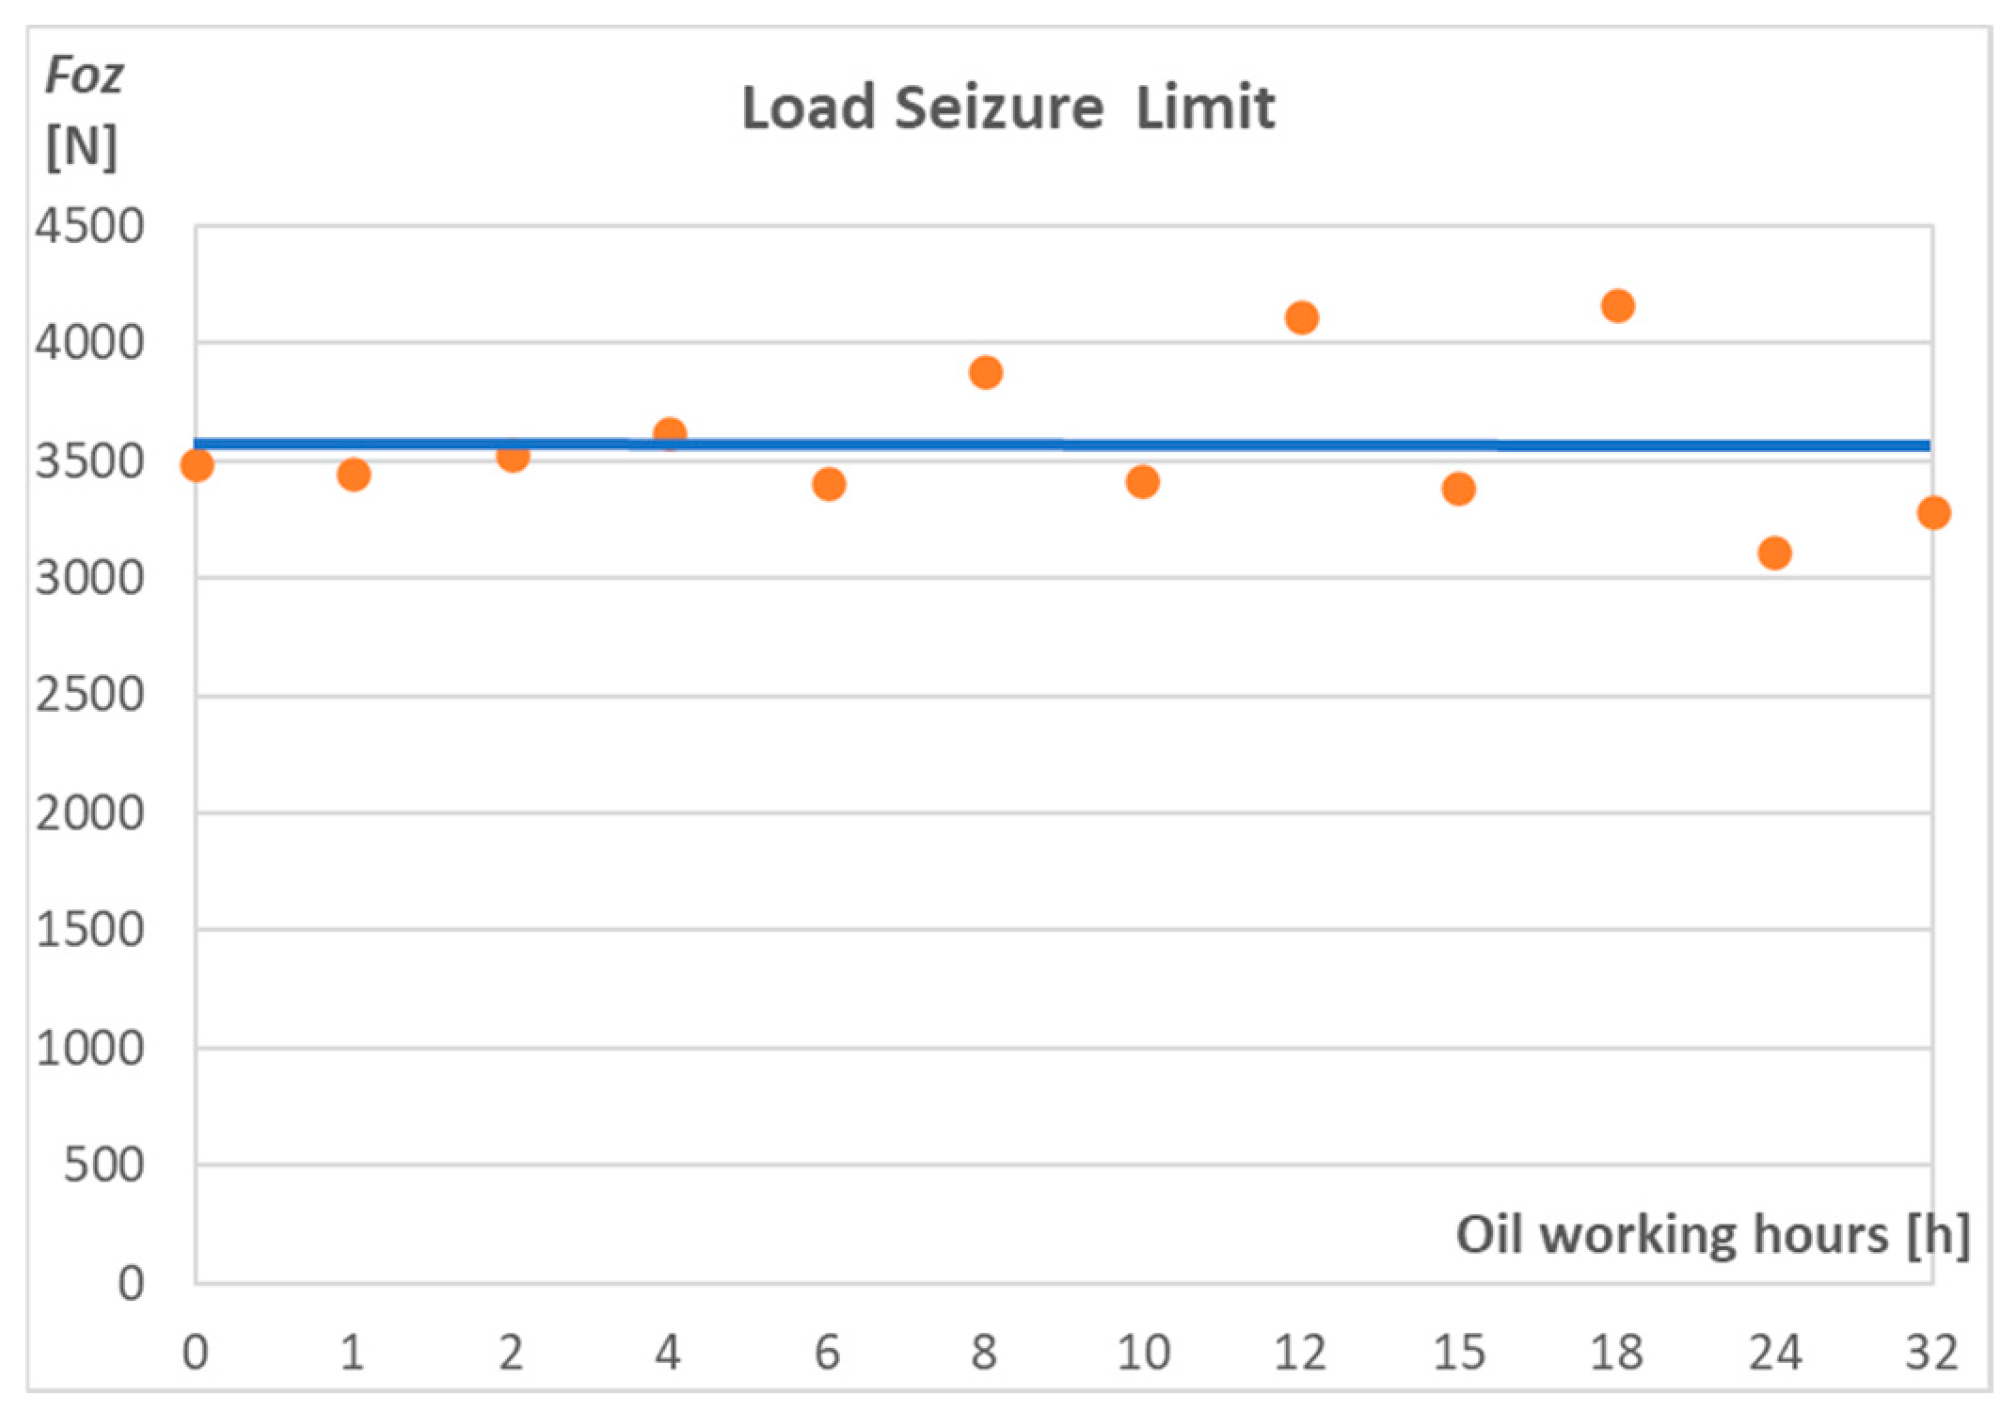
- Foz—load seizure limit for each sample.
4. Conclusions
- Due to the dilution of oil with fuel, the viscosity index decreased significantly up to 50% for 32 oil operating hours but it remained at a very high or high level (according to ISO grades) for most of the samples. Only oil that worked for 32 h reached the VI medium level.
- The increasing amount of fuel oil in the base lubricating oil reduced the antiwear and antifriction performance by decreasing viscosity to 16% at 50 °C and 29% at 100 °C if compared to fresh oil.
- At the same time, there is no visible effect of diluting the oil with fuel, even on the load seizure limit, where the average value of approximately 3600 N does not change with the amount of fuel in the oil (Figure 10).
- To ensure proper reliability of the lubricating properties of the oil, it is necessary to determine the optimal oil change interval. This can be achieved by closely monitoring the actual physical-chemical condition of the oil.
- The condition of the fuel injection pump significantly impacts the rate of degradation of the lubricating oil.
- In this specific case, due to the observation of lubricating oil being diluted by fuel, it is strictly recommended to adjust the oil change intervals from the manufacturer’s recommendation of 100 h to a more frequent schedule (e.g., every 24 h or less).
- Alternatively, the oil could be replaced with the one of higher viscosity. However, this could require a re-examination of the oil properties.
- Because the design of this pump is a special solution used currently in marine engines, the results of these tests cannot be applied directly to all marine engines. However, the general conclusions will apply to any situation in which the lubricating oil is diluted with fuel.
Funding
Institutional Review Board Statement
Informed Consent Statement
Data Availability Statement
Conflicts of Interest
Nomenclature
| TDC | Top dead center |
| Cc | Cubic centimeter |
| FO | Fuel oil |
| HTHS | High-temperature high shear |
| CCS | Structural viscosity |
| TPEO | Trunk piston engine oil |
| API | American Petroleum Institute |
| MGO | Marine gas oil |
| ASTM | American Society for Testing and Materials |
| PN-EN | Poland and Europe Standard |
| MW | Mega watts |
| AC | Alternating current |
| BDN | Bunker delivery note |
| LO | Lubrication oil volume [liters] |
| UO | Used oil volume [liters] |
| ρLO | Gravimetric density of lubrication oil [kg/m3] |
| ρFO | Gravimetric density of fuel oil [kg/m3] |
| ρUO | Gravimetric density of used oil [kg/m3] |
| qLO | Mass of lubrication oil (fresh oil) [kg] |
| qFO | Mass of fuel oil [kg] |
| qUO | Mass of used oil [kg] |
| VI | Viscosity index [-] |
| Ft | Seizure load index (SLI) [N] |
| Foz | Force for limit seizure load (LSL) [N] |
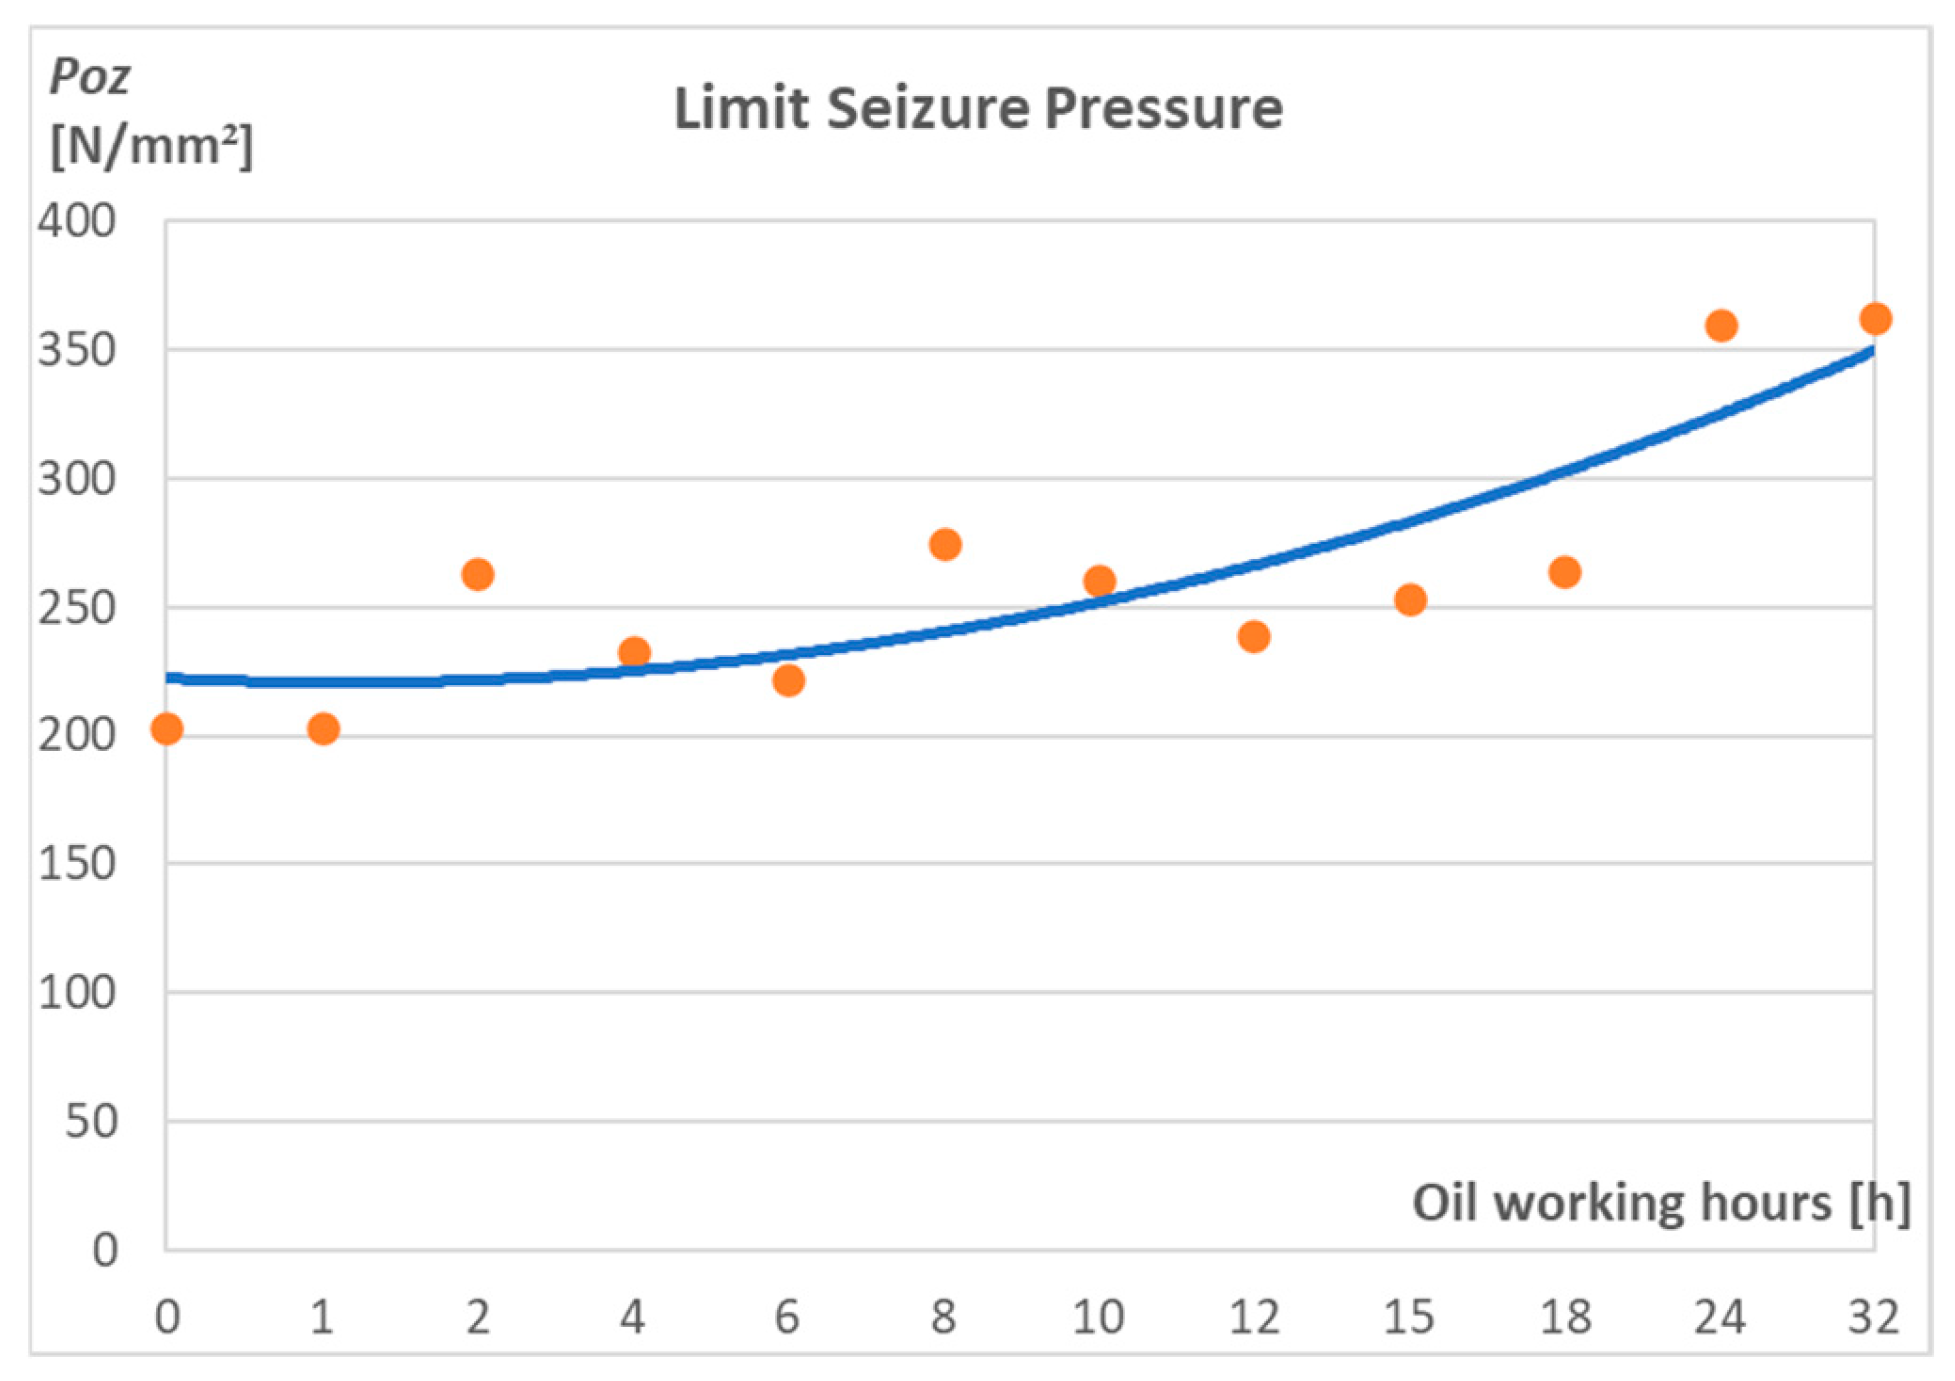
| pos | Pressure for limit seizure pressure (LSP) [N/mm2] |
References
- Szabó, Á.I.; Tóth, D.; Leskó, M.Z.; Hargitai, H. Investigation of the Applicability of Y2O3–ZrO2 Spherical Nanoparticles as Tribological Lubricant Additives. Lubricants 2022, 10, 152. [Google Scholar] [CrossRef]
- Abril, S.O.; Piero Rojas, J.; Flórez, E.N. Numerical Methodology for Determining the Energy Losses in Auxiliary Systems and Friction Processes Applied to Low Displacement Diesel Engines. Lubricants 2020, 8, 103. [Google Scholar] [CrossRef]
- Pérez, A.T.; Mark, H. Low-Cost Oil Quality Sensor Based on Changes in Complex Permittivity. Sensors 2011, 11, 10675–10690. [Google Scholar] [CrossRef] [PubMed]
- Zhou, Y.; Li, W.; Stump, B.C.; Connatser, R.M.; Lazarevic, S.; Qu, J. Impact of Fuel Contents on Tribological Performance of PAO Base Oil and ZDDPHu. Lubricants 2018, 6, 79. [Google Scholar] [CrossRef]
- Kaminski, P. Experimental Investigation into the Effects of Fuel Dilution on the Change in Chemical Properties of Lubricating Oil Used in Fuel Injection Pump of Pielstick PA4 V185 Marine Diesel Engine. Lubricants 2022, 10, 162. [Google Scholar] [CrossRef]
- Hu, T.; Teng, H.; Luo, X.; Chen, B. Impact of Fuel Injection on Dilution of Engine Crankcase Oil for Turbocharged Gasoline Direct-Injection Engines. SAE Int. J. Engines 2015, 8, 1107–1116. [Google Scholar] [CrossRef]
- Splitter, D.; Burrows, B.; Lewis, S. Direct Measurement and Chemical Speciation of Top Ring Zone Liquid During Engine Operation; SAE Technical Paper 2015-01–0741; SAE: Warrendale, PA, USA, 2015. [Google Scholar] [CrossRef]
- Ajayi, O.O.; Lorenzo-Martin, C.; Fenske, G.; Corlett, J.; Murphy, C.; Przesmitzki, S. Bioderived Fuel Blend Dilution of Marine Engine Oil and Impact on Friction and Wear Behavior. J. Tribol. 2016, 138, 021603. [Google Scholar] [CrossRef]
- Khuong, L.S.; Masjuki, H.H.; Zulkifli, N.W.M.; Mohamad, E.N.; Kalam, M.A.; Alabdulkarem, A.; Arslan, A.; Mosarof, M.H.; Syahir, A.Z.; Jamshaid, M. Effect of Gasoline–Bioethanol Blends on the Properties and Lubrication Characteristics of Commercial Engine Oil. RSC Adv. 2017, 7, 15005–15019. [Google Scholar] [CrossRef]
- Song, B.H.; Choi, Y.H. Investigation of variations of lubricating oil diluted by post-injected fuel for the regeneration of CDPF and its effects on engine wear. J. Mech. Sci. Technol. 2008, 22, 2526–2533. [Google Scholar] [CrossRef]
- Urzędowska, W.; Stępień, Z. Wybrane zagadnienia dotyczące zmian właściwości silnikowego oleju smarowego w eksploatacji. Nafta-Gaz 2012, 12, 1102–1110. [Google Scholar]
- Brazhenko, V. The influence of contaminated hydraulic fluid on the relative volume flow rate and the wear of rubbing parts of the aviation plunger pump. Aviation 2019, 23, 43–47. [Google Scholar] [CrossRef]
- Agoston, A.; Ötsch, C.; Jakoby, B. Viscosity Sensors for Engine Oil Condition Monitoring—Application and Interpretation of Results. Sens. Actuators A Phys. 2005, 121, 327–332. [Google Scholar] [CrossRef]
- Fernández-Feal, M.; Sánchez-Fernández, L.R.; Pérez-Prado, J.R. Study of Metal Concentration in Lubricating Oil with Predictive Purposes. Curr. J. Appl. Sci. Technol. 2018, 27, 1–12. [Google Scholar] [CrossRef]
- Kral, J.; Konecny, B.; Madac, K.; Fedorko, G.; Molnar, V. Degradation and Chemical Change of Longlife Oils Following Intensive Use in Automobile Engines. Measurement 2014, 50, 34–42. [Google Scholar] [CrossRef]
- Sani, A.S.A.; Sahab, A.; Abd Rahim, E.; Talib, N.; Kamdani, K.; Rahim, M.Z. Performance Evaluation of Palm-Olein TMP Ester Containing Hexagonal Boron Nitride and an Oil Miscible Ionic Liquid as Bio-Based Metalworking Fluids. J. Mech. Eng. 2017, 4, 223–234. [Google Scholar]
- Adem, G. Providing Eligibility Criteria on Turbocharger Filter Silencer Design Processes. J. ETA Marit. Sci. 2013, 1, 15–22. [Google Scholar]
- TPEO Engine Oil—Product Description and Application—Marinol RG1240. Available online: https://lotosoil.pl/upload/oil/import/17661_Marinol%20TPEO%20%2012_ed5_EN.pdf (accessed on 11 March 2022).
- Pielstick PA4 V185 Manual; French Societé d’Etudes de Machines Thermiques: Paris, France, 1975.
- ISO 12185:2024; Crude Petroleum, Petroleum Products and Related Products—Determination of Density—Laboratory Density Meter with an Oscillating U-Tube Sensor. ISO: Geneva, Switzerland, 2024. Available online: https://www.iso.org/standard/82592.html (accessed on 30 April 2024).
- Haake-Mars-Rheometer-Brochure-623-2138. Available online: https://assets.thermofisher.com/TFS-Assets/MSD/brochures/haake-mars-rheometer-brochure-623-2138.pdf (accessed on 14 March 2022).
- T-02U Universal Four-Ball Tribotester—Technical Characteristic. Available online: https://www.itee.lukasiewicz.gov.pl/images/karty/tribologia/Karta_T-02_ang.pdf (accessed on 30 April 2022).
- Fuel Banker Delivery Note, RIG Platform, Baltic Beta.
- Standard Test Method for Kinematic Viscosity of Transparent and Opaque Liquids (and Calculation of Dynamic Viscosity). Available online: https://cdn.standards.iteh.ai/samples/109123/f1e4837804b84d10bda98b05e0cbf41a/ASTM-D445-21.pdf (accessed on 21 December 2021).
- ISO Viscosity Grades. Available online: https://www.machinerylubrication.com/Read/213/iso-viscosity-grades (accessed on 30 April 2022).
- SAE Viscosity Grades for Engine Oils. Available online: https://www.gofurthergofs.com/Portals/0/Assets/Knowledge/Whitepapers/SAE-Viscosity-Grades-for-Engine-Oils.pdf (accessed on 30 April 2022).
- Calculate Viscosity Index. Available online: https://www.tribonet.org/wiki/viscosity-index/ (accessed on 14 March 2022).
- ASTM D2270-10(2016); Standard Practice for Calculating Viscosity Index from Kinematic Viscosity at 40 °C and 100 °C. ASTM: West Conshohocken, PA, USA, 2016. Available online: https://www.astm.org/d2270-10r16.html (accessed on 30 April 2022).
- Calculator for Viscosity Index (VI) According to ASTM D2270 and ISO 2909. Available online: https://wiki.anton-paar.com/en/astm-d2270-viscosity-index-vi-from-40c-and-100c/ (accessed on 30 April 2022).


| Sample number | 1 | 2 | 3 | 4 | 5 | 6 | 7 | 8 | 9 | 10 | 11 |
| Intervals [h] for total oil replacement in pump crankcase | 0 | 1 | 2 | 4 | 6 | 8 | 10 | 12 | 18 | 24 | 32 |
| Oil Working Period | Trace Diameter | Load Seizure Index Ft | Load Seizure Limit Foz | Limit Seizure Pressure poz |
|---|---|---|---|---|
| [mm] | [N] | [N] | [N/mm2] | |
| Fresh oil | 2.762 | 2106 | 3484 | 203 |
| After 1 h | 2.923 | 1571 | 3445 | 203 |
| After 2 h | 2.464 | 2165 | 3529 | 264 |
| After 4 h | 2.673 | 1939 | 3616 | 233 |
| After 6 h | 2.777 | 1568 | 3405 | 222 |
| After 8 h | 2.707 | 2054 | 3882 | 275 |
| After 10 h | 2.617 | 1703 | 3412 | 261 |
| After 12 h | 2.982 | 2194 | 4113 | 239 |
| After 18 h | 2.634 | 2015 | 3385 | 254 |
| After 24 h | 2.760 | 2078 | 4168 | 264 |
| After 32 h | 2.096 | 1618 | 3118 | 360 |
Disclaimer/Publisher’s Note: The statements, opinions and data contained in all publications are solely those of the individual author(s) and contributor(s) and not of MDPI and/or the editor(s). MDPI and/or the editor(s) disclaim responsibility for any injury to people or property resulting from any ideas, methods, instructions or products referred to in the content. |
© 2024 by the author. Licensee MDPI, Basel, Switzerland. This article is an open access article distributed under the terms and conditions of the Creative Commons Attribution (CC BY) license (https://creativecommons.org/licenses/by/4.0/).
Share and Cite
Kaminski, P. Investigation Lubricity Performance of Lubricating Oil Used in Marine Diesel Engine—Fuel Injection Pump. Appl. Sci. 2024, 14, 6148. https://doi.org/10.3390/app14146148
Kaminski P. Investigation Lubricity Performance of Lubricating Oil Used in Marine Diesel Engine—Fuel Injection Pump. Applied Sciences. 2024; 14(14):6148. https://doi.org/10.3390/app14146148
Chicago/Turabian StyleKaminski, Piotr. 2024. "Investigation Lubricity Performance of Lubricating Oil Used in Marine Diesel Engine—Fuel Injection Pump" Applied Sciences 14, no. 14: 6148. https://doi.org/10.3390/app14146148
APA StyleKaminski, P. (2024). Investigation Lubricity Performance of Lubricating Oil Used in Marine Diesel Engine—Fuel Injection Pump. Applied Sciences, 14(14), 6148. https://doi.org/10.3390/app14146148