Article

Effects of Fly Ash and Graphene Oxide in Cement Mortar Considering the Local Recycled Material Context

1
Faculty of Technical Fundamental, University of Transport Technology, Hanoi 11407, Vietnam
2
Urban Infrastructure Faculty, Mien Tay Construction University, Vinh Long 85100, Vietnam
3
Civil Engineering Faculty, Mien Tay Construction University, Vinh Long 85100, Vietnam
4
Faculty of Civil Engineering, Thuy Loi University, Hanoi 115000, Vietnam
5
Department of Bridge Engineering, Tongji University, Shanghai 200092, China
6
Shanghai QiZhi Institute, Shanghai 200232, China
7
Department of Civil Engineering, ISISE, ARISE, University of Minho, 4800-058 Guimarães, Portugal
*
Author to whom correspondence should be addressed.
Appl. Sci. 2024, 14(14), 6140; https://doi.org/10.3390/app14146140
Submission received: 12 June 2024 / Revised: 10 July 2024 / Accepted: 11 July 2024 / Published: 15 July 2024

Abstract

:
Construction materials are at the forefront of global economic development as they provide the foundation for the infrastructure of other industries, with cementitious materials being predominantly used in construction projects. To promote sustainable development, alternative materials are added to cement mortar to increase durability and reduce emissions. In this regard, graphene oxide (GO) and fly ash (FA) are two alternative materials commonly used in cement mortar, which are readily available or are just the waste from other local material production. With different ratios, the amount of GO and FA can affect the properties of cement mortar positively or negatively. This study aims to determine the effects of GO and FA on cement mortar mixtures under material conditions. Research results show that 10 wt% FA and 0.036 wt% GO will give cement mortar the best physical and mechanical properties while ensuring other necessary properties, such as workability. When increasing FA to 30 wt% or GO to 0.05 wt%, the strength of the mortar mixture tends to decrease. Another issue is that the specific surface area of graphene is very high, which poses a significant challenge when uniform dispersion in the cement paste mixture is required. Polycarboxylate combined with a specific mixing sequence has demonstrated good dispersibility and high stability. Through this research, it is demonstrated that the addition of GO and FA has the potential for sustainable development of the construction industry by considering the contexts of the local recycled cementitious replacement materials.

1. Introduction

Cement materials are the most commonly used materials for construction, and they have high compression resistance, rich shaping ability, and high economic efficiency. Nevertheless, the primary constraints of this kind of material are low tensile strength, poor deformation tolerance, and insufficient resistance to cracking. In this regard, various reinforcing materials, including steel, fibers, and more recently nanomaterials, are the focus of numerous research attempts aimed at resolving these issues. By impeding the development of microcracks, the conventional reinforcements using steel fiber can enhance tensile strength. On the other hand, nanoparticles offer superior reinforcing by managing nano-level cracks during their early stages, preventing their progression into microcracks. Nanoparticles are becoming more extensively used due to their capacity to function as particles in mortar and grout and as pore inserts to generate dense microstructures, which is facilitated by their enormous surface area. Nevertheless, the 0-dimensional nanocomposite is unable to retain cracks because of its low aspect ratio, which results in a lack of reinforcing effect. Nanoparticles are confined to the nanoscale range (typically less than 100 nm) in all three spatial dimensions. They do not extend significantly in any dimension, essentially making them point-like. In this scene, graphene oxide exhibits abundant surface properties, such as excellent solubility in water and the capacity to regulate microstructural alterations in cement mortar. Therefore, GO has recently become a promising alternative for reinforcing composite cement and other structural materials at the nanoscale.
Recently, a compilation of the results of 46 research studies on compressive strength and 28 others on flexural strength on cement-based materials presented the GO content optimal for each study [1]. The results show that the optimal GO content commonly used in studies is in the range of 0.01–2.5% by weight of cement. The outstanding reinforcement of mortar by nano GO lies in the high interfacial adhesion of GO to cement mortar [2]. Graphene oxide has been included in the mortar mixture, which results in some small cracks with some branches. These cracks are trapped and are unable to pass through the sheets of graphene, in contrast to conventional mortar, in which cracks typically run in a straight fashion. The in-plane growth of micro-cracks is prevented and redirected by graphene oxide [3]. GO is involved in the modification of the crystal form of cement hydration products, the enhancement of the internal porosity of cement paste and aggregate transition zones, and the adjustment of the hydration process results to establish a stable microstructure. The waterproofing and durability in cement-based substances are enhanced by the lower density of the internal microstructure, which impedes the corrosion of Cl, SO42−, and other corrosive ions [4]. It was shown that GO enhances the corrosion resistance of cement-based substances by altering the density of their internal structure and diminishing the pore volume through SEM and also power spectroscopy analysis. It has been reported that mortars containing 0.01% GO are five times more efficient in reducing the penetration of chloride than ordinary mortars [5]. Also, adding GO to cement mortar will accelerate the hydration reaction [6]. Similarly, electron spectroscopy and isothermal calorimetry show that GO quickly absorbs Ca2+ in the early stages [7]. Together, these investigations demonstrate that GO sheets that contain groups of carboxylic acids can establish a robust interfacial adhesion to cement mortar. It leads to the mechanical behavior of cement reinforcement by GO being significantly enhanced [8,9,10].
Nevertheless, the use of GO in cement-based materials still has some limitations that should be considered, especially workability, dispersion capacity, and the mass production of GO. Workability is always an essential characteristic of mortar mixtures in general. Numerous researchers acknowledge the drawbacks of construction that result from the incorporation of GO. It is due to the hydrophilic functional groups or extensive surface area of GO, which can absorb a significant amount of water during the construction process [1]. Nevertheless, the primary reason for the detrimental impact of GO on the fluidity of the mortar is the significant quantity of free water that the flocculation process captures [11]. In a similar manner, the Van der Waals attraction of the nanosheets causes the cement particles to adhere to one another, thereby decreasing the fluidity of the mixture. GO is deposited on the surface of the cement particles [12]. In terms of the dispersion capacity of GO in a cement mixture, numerous studies that have been conducted thus far have demonstrated that the addition of a modest quantity of GO can significantly improve the mechanical characteristics of cement-based substances. However, dispersing GO well in the mixture is always a challenge [13,14,15] because this directly affects the mechanical properties and durability of the composite material. Alternatively, if GO flocculation occurs, it will result in the formation of voids and zones of low strength within the mixture. It will have detrimental impacts on the material’s qualities. In addition, the mass production of GO is also a question mark that needs to be harmonized with the local context of cement-based materials. Generally, new materials must compensate for the expenses related to cultural, production, and training adjustments. If the specified criteria are not fulfilled, the utilization of the novel substance, notwithstanding its exceptional performance, is restricted in its potential uses, with no exemption for GO specifically.
Meanwhile, many studies have shown that fly ash (FA) is a common mineral additive and is often used to improve workability and increase the strength of mortar and conventional concrete [16,17]. However, some properties of fly ash also need to be noted before being put into use. Type F fly ash was selected according to ASTM C618 due to its widespread use in construction materials and its compatibility with the cementitious matrix. Derived from bituminous and anthracite coals, Type F fly ash has a lower calcium content compared to Type C fly ash, making it more suitable for the specific objectives of this study, which aims to enhance the mechanical properties and durability of cement mortar. Loss on ignition (LOI) is the total content of unburned carbon residue. The most adverse effect of using fly ash with a high carbon content is the need for a higher water demand, which creates more porosity upon hardening, thereby reducing compressive strength compared to standard mixtures. To ensure good performance, fly ash must be processed so that the loss on ignition content is less than 6%, as specified by ASTM C618. Therefore, this paper focuses on investigating the effects of GO and FA on the workability and durability of mortar. The correlation between each parameter is also analyzed and discussed using experimental and mathematical methods.

2. The Use of GO and FA in the Cement Mortar

2.1. Graphene Oxide Dispersion

Numerous methods have been employed for homogenizing nanomaterials in mixtures, including ultrasonic treatment, high-shear combination, and electromagnetic agitation. Surfactants are substances, and surface modifications are also used to achieve this end. Nevertheless, the dispersion of GO in a solution comprising Ca2+ is challenging due to the chemical reactions across carboxyl groups for GO with Ca2+, making it difficult to achieve using physical methods. Meanwhile, using chemicals can cause incompatibility with the hydration reactions. Furthermore, the chemical transformation process is complex and time-consuming, and requires expensive instruments. Recent research has shown that the utilization of polycarboxylate (PCE) as a surfactant can effectively disperse graphene oxide (GO) in calcium hydroxide (Ca(OH)2) during the cement hydration process [18].

2.2. Content and Mixing Sequence of PCE with GO

Prior research has shown that the proportion of PCE relative to GO is a crucial factor in achieving effective dispersion of GO. If the content of PCE is insufficient, it cannot adequately coat the exterior of GO and cannot provide a strong enough repulsive force to counteract the force produced by Van der Waals across the GO sheets. On the contrary, if the PCE/GO ratio is too high, microparticles will form, resulting in GO agglomeration.
The cause lies in the oxygen-containing functional groups within the structure of graphene oxide (GO). These groups, such as hydroxyl (-OH) and carboxyl (-COOH), impart high hydrophilicity to GO, making it prone to absorbing water and forming agglomerates. This differs from other graphite materials that are more hydrophobic and less prone to agglomeration.
It is suggested that GO cannot be distributed in a cement solution when the mass ratio is equal to 1. However, when the ratio is increased from 2 to 5, GO is able to disperse effectively in the cement mortar [19]. Similarly, the ratio should be equal to 3, which is considered optimal for good GO dispersion in alkaline solutions [20]. Meanwhile, it is also suggested that the optimal PCE/GO ratio found in the study was 1:1 [21]. It can be seen that the ratio of PCE/GO depends on the concentration of PCE and GO, so it is necessary to determine this ratio for each material used. Still, the degree of GO dispersion can be tested within the PCE/GO ratio range (by mass) of 1–3.
The mixing sequence needs to be considered to avoid the flocculation of GO. Research by Zlu et al. [18] shows that mixing GO and PCE first helps GO to disperse nicely in cement (Figure 1), whereas, without PCE, GO is clearly agglomerated.

2.3. Effects of Fly Ash

Fly ash’s spherical size and low water demand have been considered as factors that can contribute to improving the fluidity of cement paste. Fly ash presence harms the flocculation structure, releasing free water and leading to increased mobility and reduced viscosity and yield stress [6]. The explanation for this phenomenon may be that the fly ash particle size is excellent, so it fills the pores. It leads to a more compact arrangement of the particles in the mixture, resulting in a decreased capacity to absorb force among the clumped cement particles. As a result, the structure of the clumps becomes less dense and more prone to being destroyed. Moreover, fly ash has a smooth, spherical shape, creating increased mobility between particles. At the same time, the flocculation of GO is reduced.

2.4. Mixing Process

The very high characteristic surface area of GO particles, together with the unique properties of nanometer-sized GO particles, makes GO dispersion more difficult. Therefore, unique dispersion methods, such as mixing using ultrasonic devices, may be required, which significantly increases the fabrication cost. To ensure that the mixed samples have uniform material composition and that GO particles are dispersed in the mortar with a high degree of stability, this study proposes a mixing process based on reference to previous research and experience from the test mixing process, as follows:
  • Firstly, during the GO suspension preparation, the GO was diluted with 30% of the necessary volume of water, followed by the addition of the PCE additive, and stirred at high speed to disperse the GO particles evenly for 3 min;
  • Batch mix cement, fly ash, sand for 3 min;
  • Add 70% of water into the mixing batch, mixing the cement mixture, fly ash, and water for 2 min;
  • Next, add the prepared GO mixture into the mixing batch and mix for 2 min until the mixture is homogeneous;
  • Rest the mixer for 1 min, and then mix again for 2 min to avoid loss of slump and ensure mixture uniformity.
The mixing diagram of material components is shown in Figure 2 below:

3. Experiment Setup

3.1. Materials Used

  • Cement: the cement used is Portland cement type I (Table 1). The mineralization components meet the requirements and are highly stable (SO3 < 3.5% and LOI < 6%). The physical and mechanical criteria have been verified according to the supplier’s quality certificate and meet the technical requirements. Ordinary Portland cement was used in this research, having a compressive strength after 28 days of ≥40 MPa. The density of the cement is 3.15 g/cm3.
  • Standard sand: ISO standard sand used for experiments.
  • Water for experiments is clean water used for domestic purposes.
  • Fly ash is used as type F according to ASTM C618 (Table 2), meeting standards for use as construction materials. The density of fly ash is 2.64 g/cm3.
  • The graphene oxide (GO) used in the experiment is Graphene Oxide II of Jining Leadernano Tech, and it possesses the components shown in Table 3 and Figure 3.
  • PCE: A mixture of water-based modified polycarboxylate from Sika, which is light brown in color.

3.2. Methods and Experimental Standards

The mortar mixture is made according to the regulations in standard TCVN 6016:2021 (National Standard of Vietnam). The experimental process was conducted at the Expressway Testing Center (LAS 72) of the University of Transport Technology and Thuy Loi University with complete and tested equipment (Figure 4).
  • Preparing the mold: Ensure the mold has standard dimensions (40 mm × 40 mm × 160 mm). Clean the mold thoroughly and apply a release agent to the inner surfaces.
  • Sample maintenance: Once the sample is cast, it is kept in the mold and stored in a curing chamber at a temperature lasting 27 °C and a relative humidity lasting 95% for 24 h. Once the mold is eliminated, the samples are then submerged in water at a constant temperature of 27 °C until the end of the experiment or stored in maintenance cabinets.
  • After the curing period, compressive and flexural strength tests were conducted according to the standards.
A flexural testing machine capable of loading up to 5 kN, with an error no greater than 2%, and with a load increasing speed of 10–50 N/s was used. The compressor was loaded with load increments of 2400 N/s until the sample failed.
Afterward, the broken halves of the prisms were tested by applying the load on the side faces in contact with the mold to determine the compressive strength of the sample. The side faces of the half-prisms should be positioned in the center of the press plate with an alignment deviation of no more than ±0.5 mm and placed lengthwise so that the end face of the prism protrudes approximately 10 mm beyond the press plate or the auxiliary press plate. The load should be increased gradually at a rate of (2400 ± 200) N/s throughout the test until the specimen fails.

3.3. Component Design and Experiments

The mortar mixture is made according to the regulations in standard TCVN 6016:2021 (National Standard of Vietnam). The volume ratio of binder to standard sand is 1:3, each test batch includes 450 g of binder and 1350 g of standard sand, the amount of water is 225 g, and the ratio of water to binder is 0.5. The amount of fly ash to be replaced ranges from 0 to 30% of the total mass of cement and fly ash. The amount of GO replaced by the % weight of the total mass of cement and fly ash selected in the experiment ranged from 0–0.06%, and the PCE/GO ratio was 4.5:1.
The experimental process was conducted at the Expressway Testing Center (LAS 72) of the University of Transport Technology and Thuy Loi University with complete and tested equipment (Figure 4). The quantity of material is presented in Table 4 below:
Minitab19 software was used to design a General Full Factorial and analyze results. Input variables of experimental design comprised three variables:
  • Variable 1 (days): 3 days; 7 days; 28 days;
  • Variable 2 (GO), calculated by % weight of cement and fly ash: 0%, 0.01%, 0.02%, 0.03%, 0.04%, and 0.05%;
  • Variable 3 (Fly ash), calculated by % weight of cement and fly ash: 0%, 15%, and 30%;
  • Number of samples for one mixture: 3 samples;
  • Total number of experiments: 3 × 6 × 3 × 3= 162 (samples).
The investigation yielded data for two goals: compressive strength and flexural strength. Following the production of the mortar tests, both their flexural and compressive strengths were assessed in accordance with established standards.

4. Results and Discussion
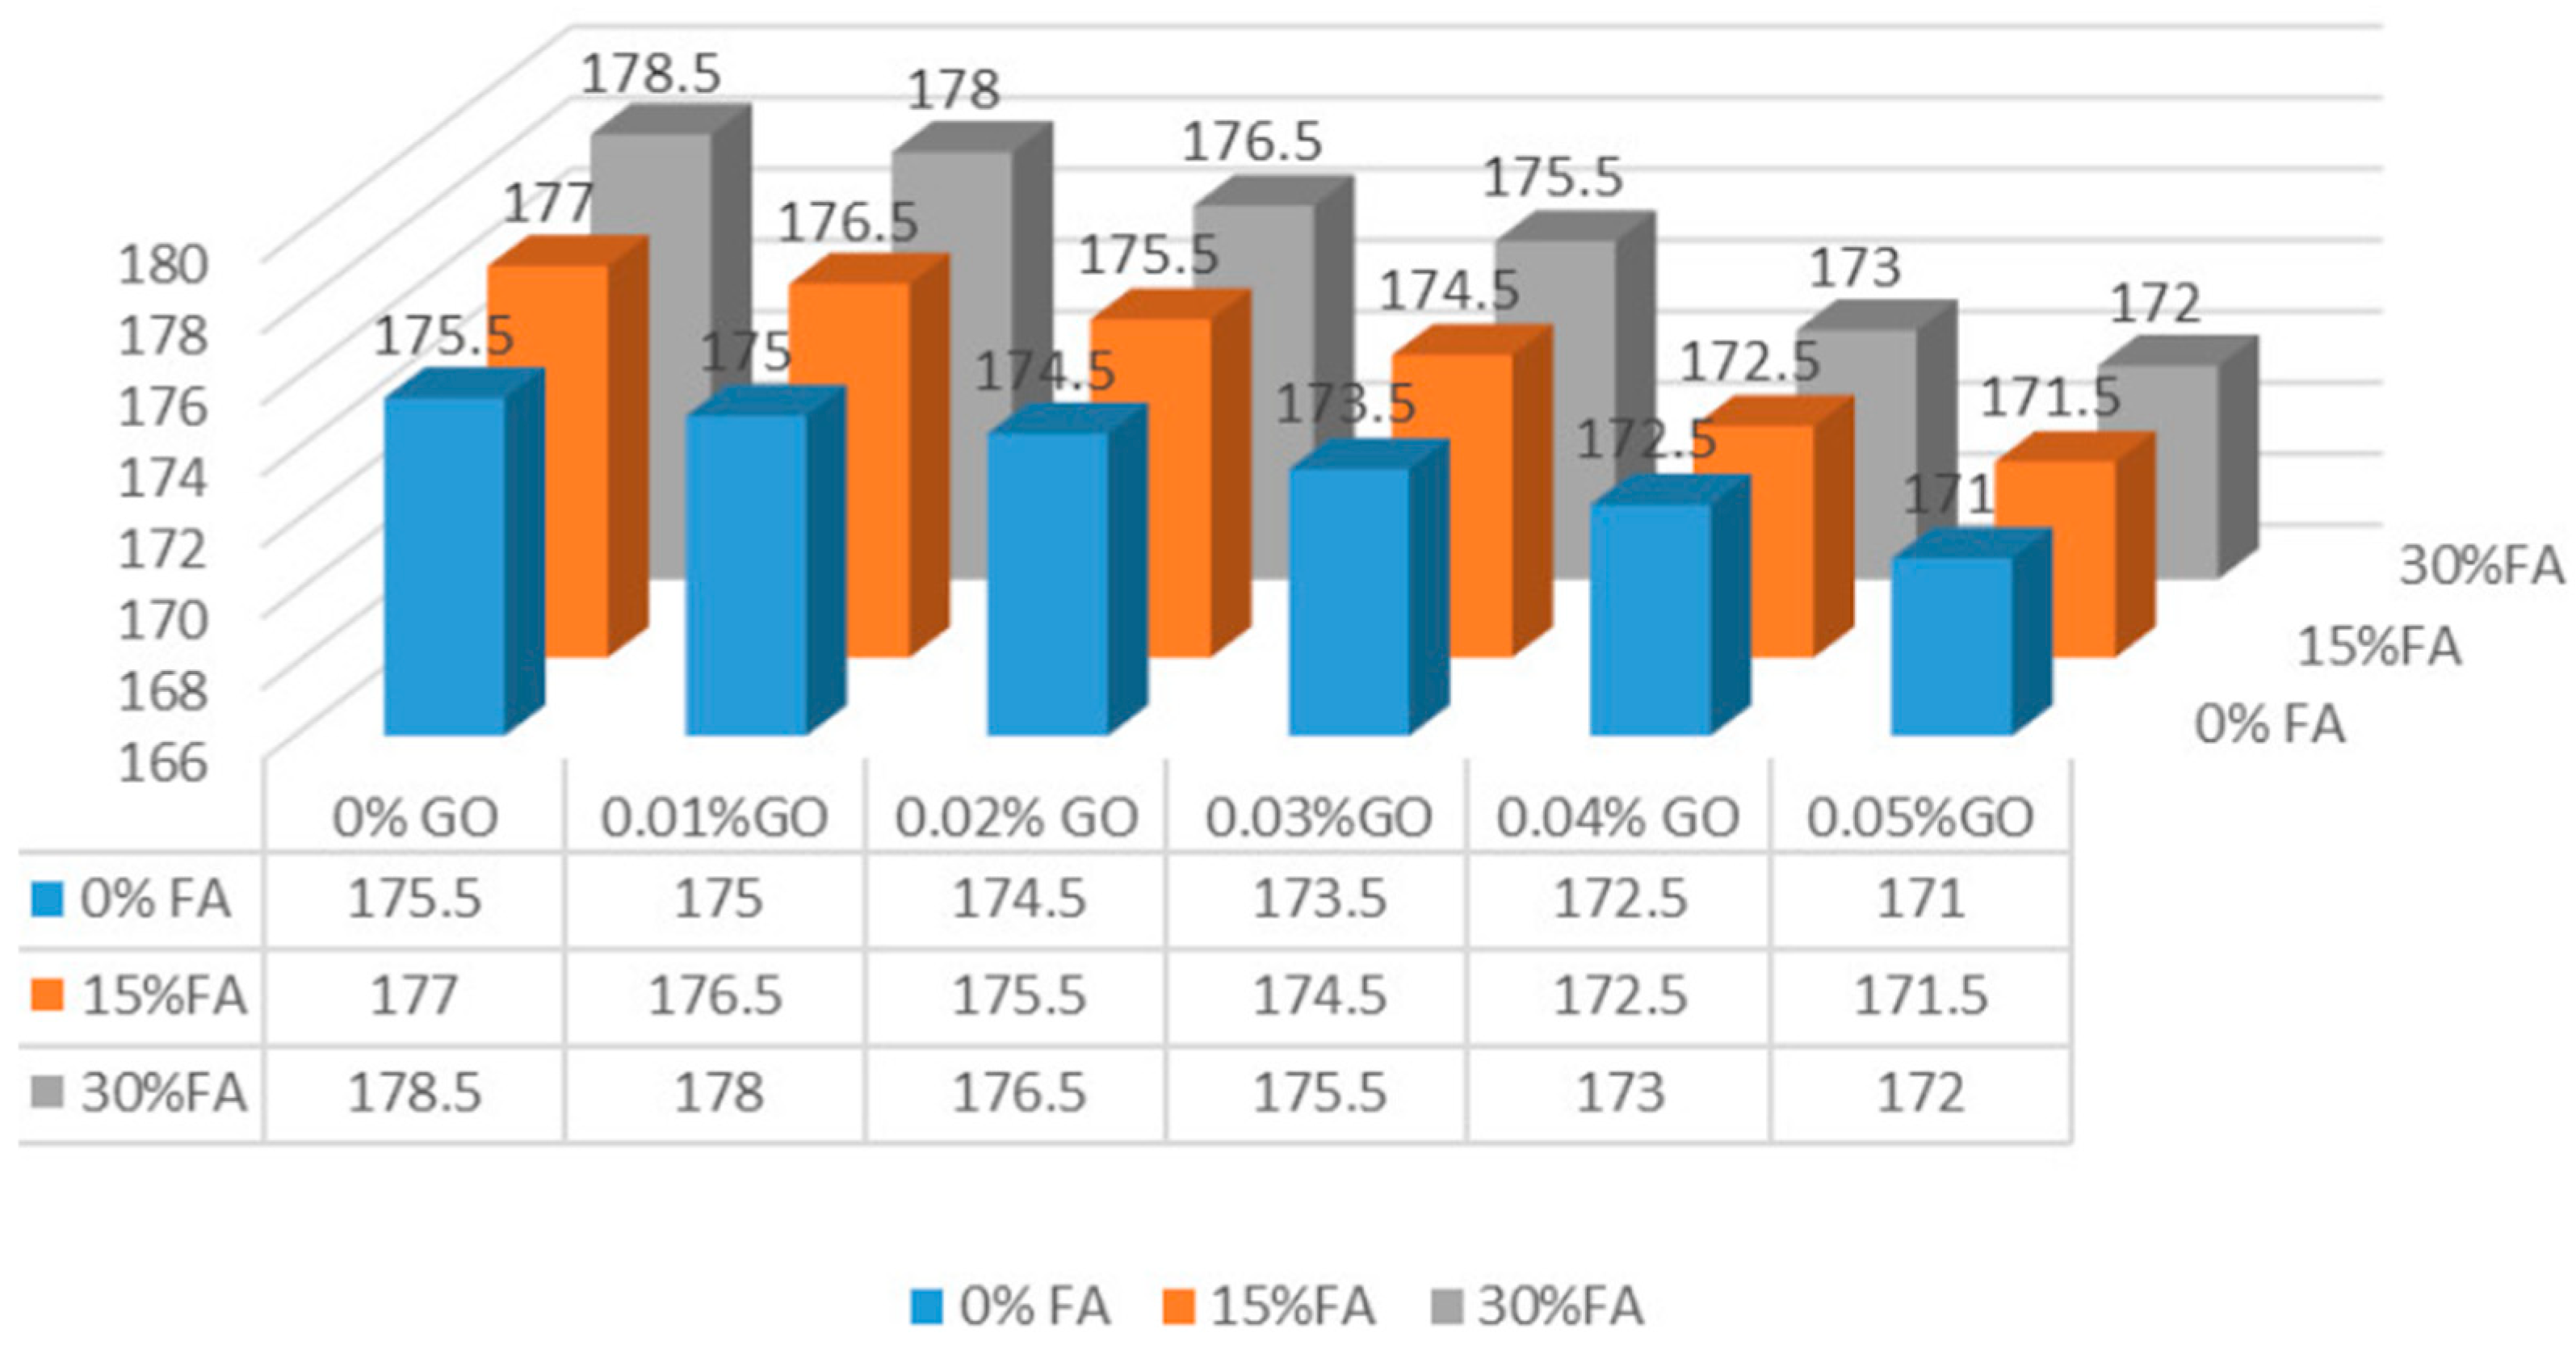
The results were acquired and are presented in Table 5 below.

4.1. Workability

Workability refers to the degree of ease with which a cement mortar mixture flows and consolidates. It has a significant impact on the durability of the mixture once it hardens. Inadequate fluidity can result in the consolidation of newly mixed cement mortar, leading to the creation of voids, hence diminishing the mechanical characteristics of the mortar.
Cement hydration is a chemical reaction that occurs when cement comes into contact with water, leading to the formation of cement paste that binds the aggregates together. The calcium salt composition and pH level of cement also significantly affect the workability and flocculation of the mixture, as researched [9,10]. A high-pH environment (around 12–13) is necessary for the proper hydration of cement. If the pH is too low, the hydration process can be slowed down or disrupted, affecting the workability of the mortar. A proper pH ensures that the cement particles are adequately dispersed in the mix, leading to a more uniform and workable mortar. If the pH is not optimal, it can result in poor dispersion of the cement particles, making the mortar either too stiff or too fluid, both of which are undesirable for workability.
Regarding the workability of the mortar mixture, the results from Table 6 and Figure 5 clearly showed that the addition of fly ash has slightly increased the fluidity. These results were quite close to the recent research [21], which pointed out that the workability of mortar mixtures when changing GO content was not significantly different, namely using GO from 0.01 wt% to 0.03 wt%. This change was only significant when GO increased above 0.04 wt%. It also partly reveals the limitations of GO [11,12] and also shows that adding fly ash is appropriate [22]. Due to its smooth and spherical structure, fly ash increases the filling and lubricating effect, which partly overcomes the limited workability of the mixture in the presence of GO.

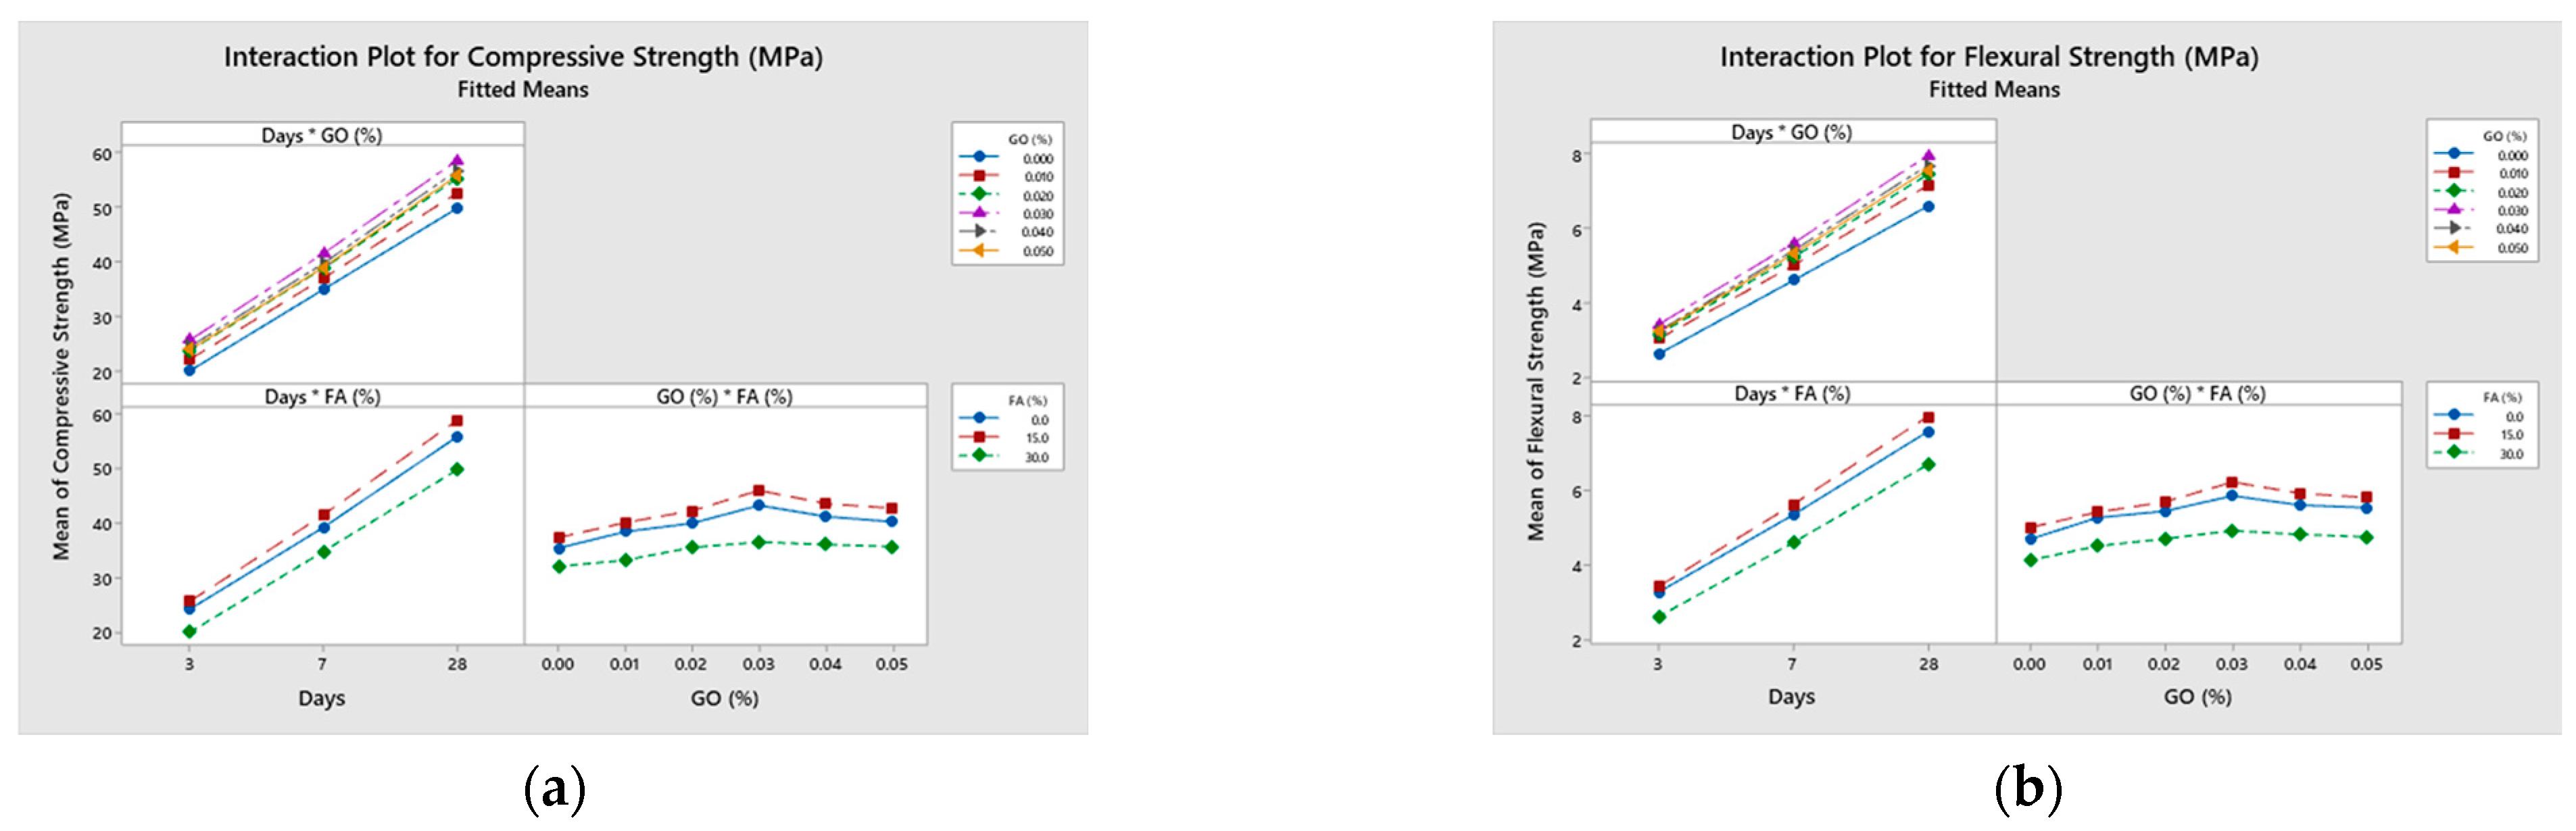
4.2. Evaluate the Influence of Main Factors

Figure 6a,b show the apparent influence of each factor on the compressive and flexural strength of cement mortar. This figure revealed that there had been a sharp increase in strength from 3 days to 7 days, especially 28 days later.
Considering the influence of fly ash, both graphs show a slight change. The strength of mortar tends to rise when the FA used changes from 0 to 15 wt%. However, at 30 wt% usage, both compressive and flexural strength decreases, and the graph slopes sharply downward.
Meanwhile, when the proportion of cement weight grows, the amount of GO used remains very tiny, ranging from 0.01 wt% to 0.02 wt%. It leads to an increase in strength, with the flexural strength curve being steeper than the compressive strength curve. This trend continues to increase sharply (very steep graph) when GO up to 0.03 wt% is used. It is also consistent with other studies in the world [12,22,23,24,25]. However, with 0.04 wt% and 0.05 wt% of GO dosages, the compressive and flexural strengths both decrease very clearly. This decrease when the crystals of the cement hydrate can explain the increase in the content of GO agglomerate. While the presence of PCE and FA in the mixture aids in the dispersion of cement particles and the release of trapped water in flocculated cement, it is essential to ensure that the level of GO does not exceed 0.04 wt%. According to research by some authors, GO content should be in the range of 0.02 wt%–0.01 wt% [24], and some other studies have found that GO use up to 0.08% is still reasonable for compressive strength, but some other properties tend to decrease, as researched by [6].
The interaction plots in Figure 7 show all of the graphs of the samples with segments with different slopes compared to the graph of the standard sample. Hence, the interaction effect between the variables in each cell was significant. However, the assessment based on observing the graphs gives quick qualitative results. To have a more specific conclusion, it is necessary to consider the quantitative characteristics below.

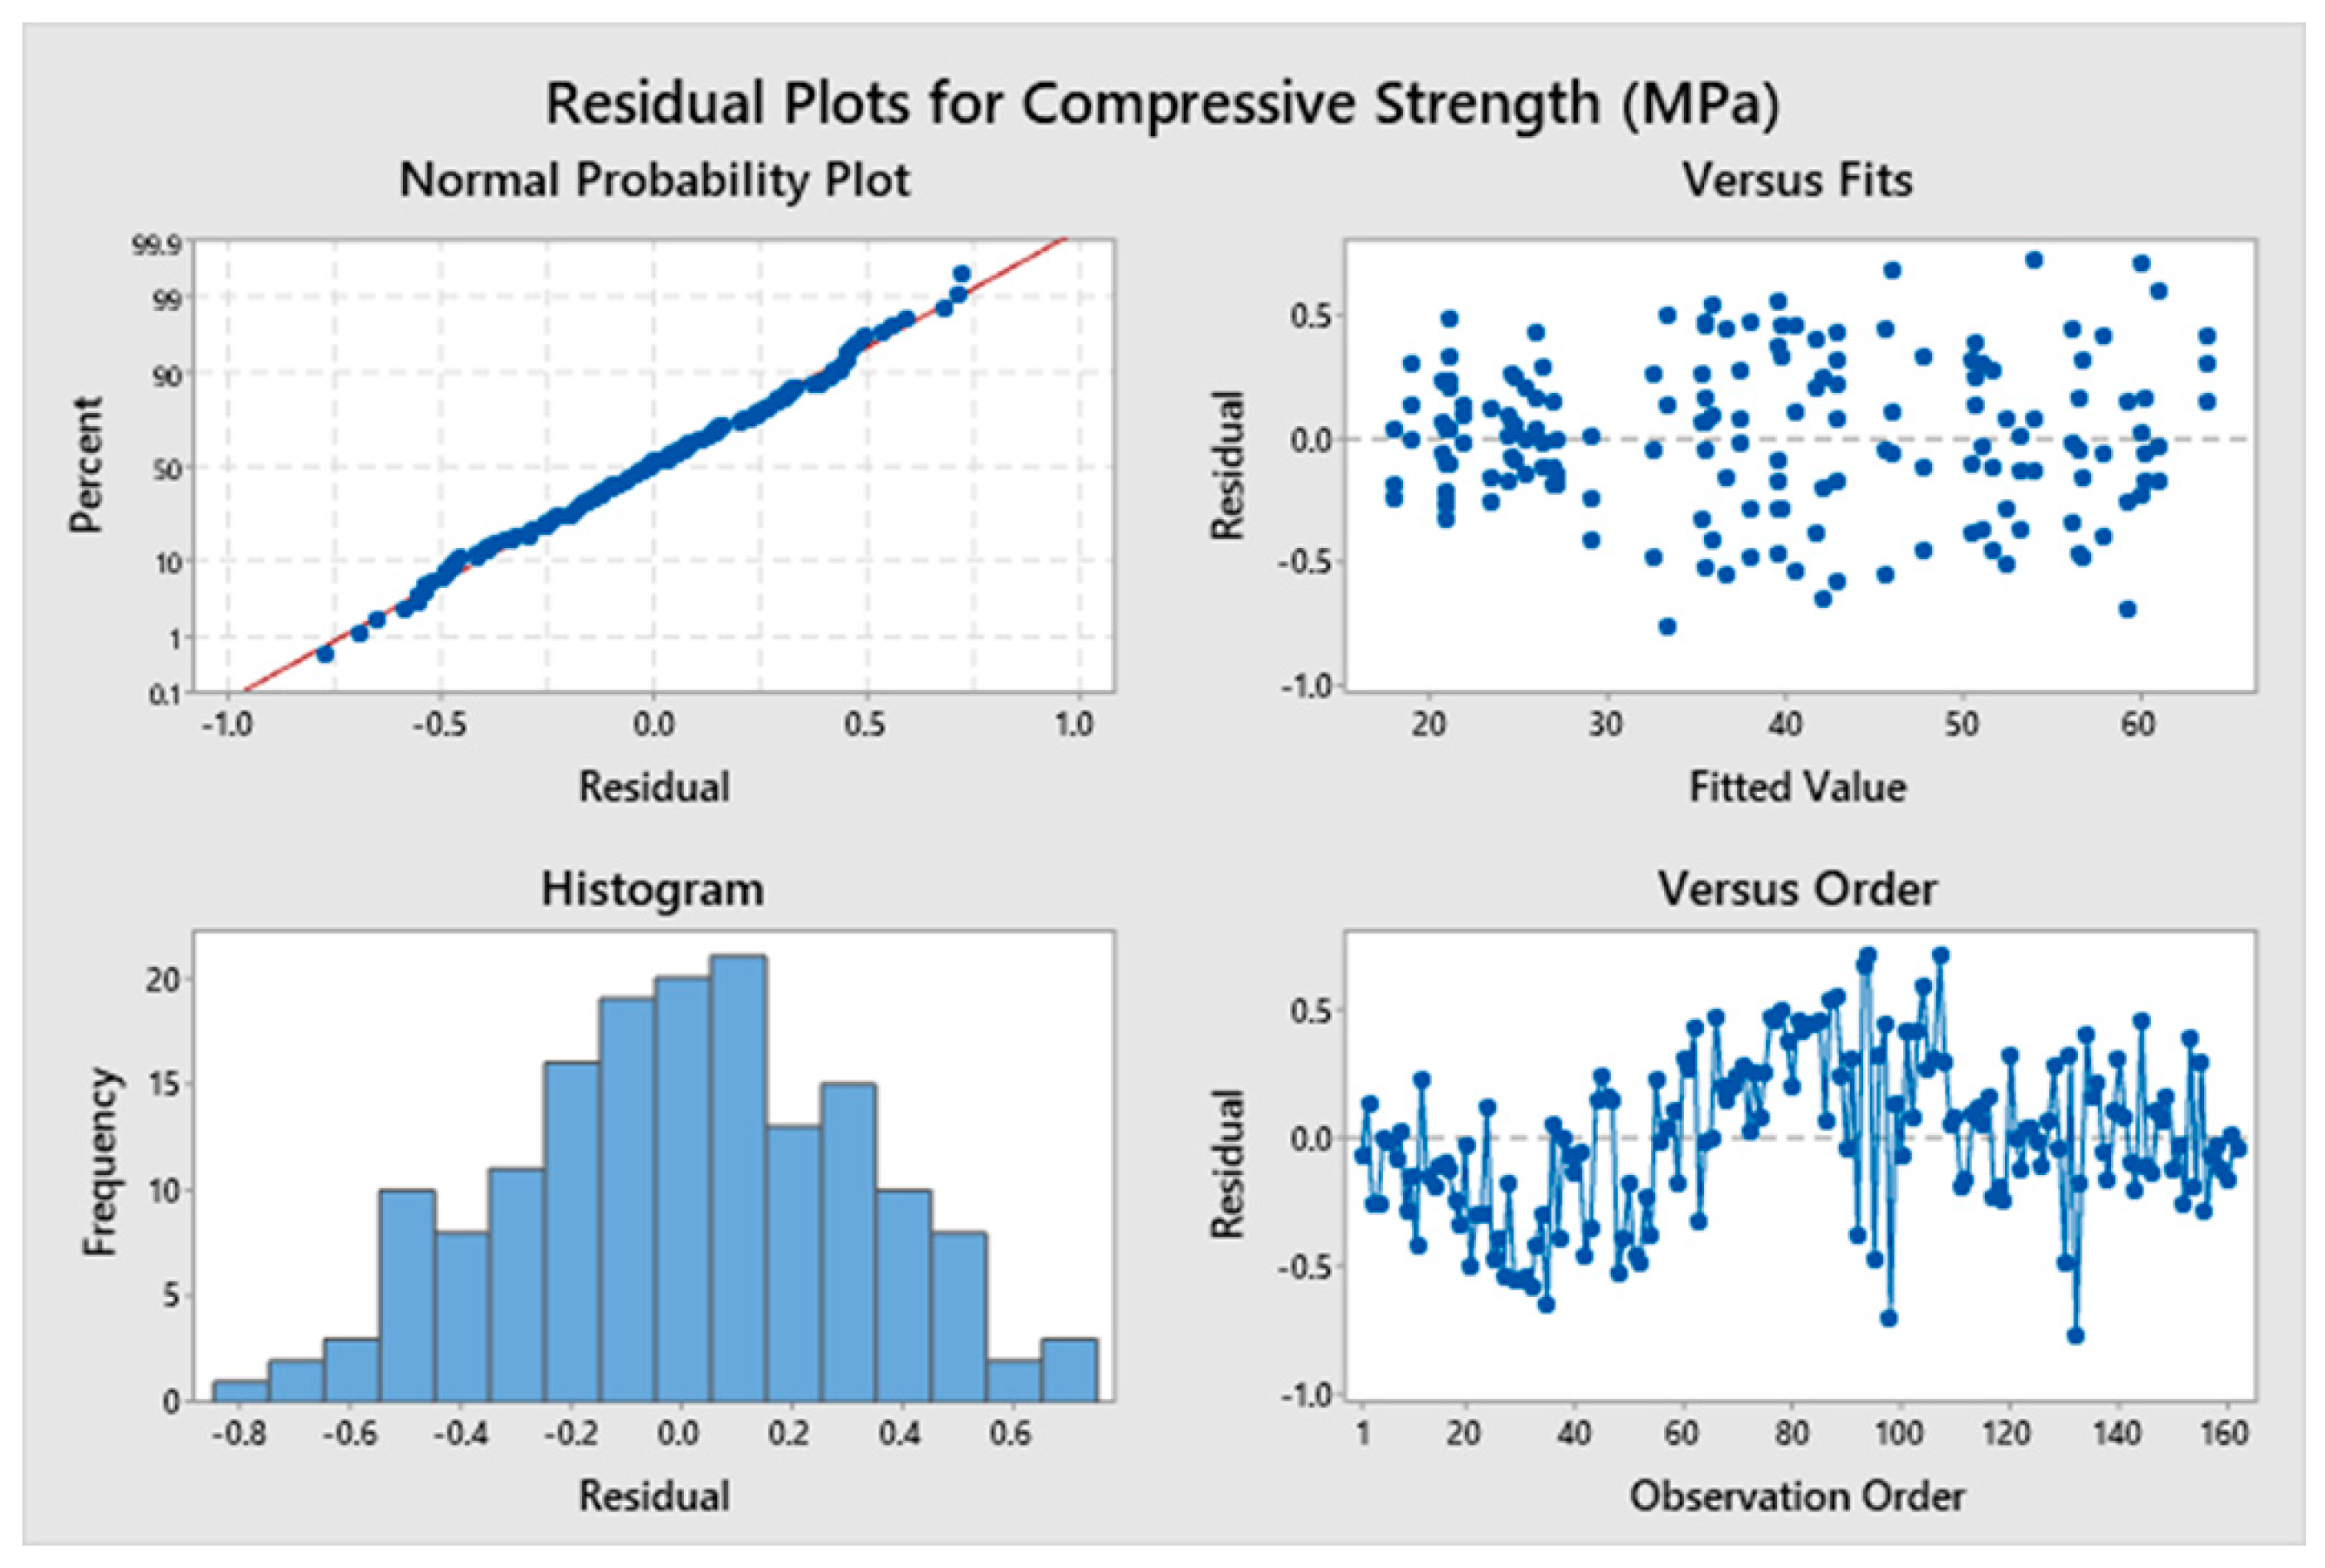
4.3. Compressive Strength

The Design of Experiments and statistical analysis with Minitab 19 software at 95% confidence were used. Variance analysis of the compressive strength gave results as shown in Table 7 and Figure 8 of the residuals for the plots of the regression model.
When performing a lack-of-fit test in regression analysis, the p-value helps to determine whether the model adequately fits the data. From Table 7, the lack-of-fit having a p-value of 0.126 suggests that there was no significant evidence to reject the null hypothesis, which states that the model does not lack fit. In other words, the p-value indicates that the model fits the data adequately at a common significance level (α = 0.05). In addition, Figure 8 also provides a typical residual plot quite close to line zero and indicates that the model’s predictions were generally accurate, as the residuals (differences between observed and predicted values) were small. Thus, the experimental results show that the input factors and their interaction terms significantly affected the compressive strength with high statistical confidence.
Regression Function:
Based on the experimental results, the regression model is constructed depending on the researcher’s choice to ensure the model’s appropriateness.
In this research, to build the regression function based on the provided context, constructing a multiple regression model that takes into account the compressive strength (Y1), the influencing factors (GO, fly ash (FA), and days (t)), and their interaction terms was necessary.
Y1 = β0 + β1t + β2FA + β3GO + β4t2 + β5FA2 + β6GO2 + β7(t⋅FA) + β8(t⋅GO) + β9(FA⋅GO) +ϵ
where Y1 = compressive strength (MPa); t = time (in days); FA = fly ash content (in %); GO = graphene oxide content (in %); β0, β1, β2, …, β9 = regression coefficients; ϵ = error term.
The regression equation for the compressive strength of mortar was expressed as shown in Equation (1) below with statistically significant variables, such as a p value < 0.05, R-sq = 99.43%, and R-sq(adj) = 99.39%.
Y1 = 5.889 + 351.3 GO + 0.5128 FA + 5.0089 t − 5319 GO2 − 0.020838 FA2 − 0.12128 t2
− 0.765 GO × FA + 2.026 GO × t − 0.002487 FA × t
Regression Equation (1) revealed the following observations:
  • The most significant positive influencing factor on the compressive strength of mortar was the content of GO with a considerable influence weight of (+351.3), which means that under the condition that other variables did not change, if the compressive strength of mortar includes 0.01% GO, the strength of mortar increases by 3.513 MPa.
  • Similarly, other factors that had a significant influence on the compressive strength of mortar include FA content and time (days) with influence weights of (+0.5128) and (+5.0089), respectively. Compressive strength changes significantly over time, which is true for all types of cement mortar in general. Here, when the time increases by 1 day, the strength of the mortar will also be increased on average by 5.0089 MPa. Meanwhile, if FA (fly ash) increases by 1%, the strength also increases by 0.5128 MPa.
  • Interestingly, when these independent variables are of higher order, specifically of the second order in Equation (1), the influence weights are all negative. However, if these terms are removed, the equation has a relatively low R value and some variables will not be statistically significant.
Thus, the regression Equation (1) also clearly showed the influence of the factors and their content according to the quantitative method.
Futhermore, Table 5 shows that the compressive strength of hardened mortar changes clearly over time, and the growth rate at each time was also different. What is also noteworthy is that in the early stage (3 days), the growth level was relatively high for mortar samples with GO, reaching the highest value of about 37.2%. In comparison, at 7 and 28 days, it only came to about 28.79% and 26.81%, respectively, compared to the control sample, which did not have GO and fly ash in the mixture. Thanks to the presence of oxygen-rich functional groups on the surface, GO accelerates the hydration process of cement and also helps form crystals, so the compressive strength of the mortar is higher and develops strongly at the beginning. Additionally, compared to the strength at 28 days, at 3 days, the strength ranged from 38.5% to 44.3% depending on the proportions of graphene oxide (GO) and fly ash (FA) in the mix. By 7 days, the compressive strength has noticeably increased, ranging from 69.66% to 71.37%. However, the compositions that achieved the fastest and slowest rate of strength gain did not have the same proportions in the mix.
  • For mortar samples containing GO, the strength change is also apparent depending on the GO content and fly ash content used. The compressive strength for mortar samples with a GO content changed sharply from the usage level of 0.01 wt% up to 0.03 wt%, reaching the highest level. It is worth noting that when increasing the GO content to more than 0.04 wt% and 0.05 wt%, the compressive strength does not increase but tends to decrease. The results of this study are similar to other studies around the world, such as [22,23,24,25].
  • For samples with both GO and fly ash added to the mixture, the amount of fly ash used also significantly affects the strength when this amount increased too much (specifically, in this study, 30 wt%), which again leads to a decrease in the sample’s intensity. However, with a reasonable usage content (15 wt%), fly ash has shown its effectiveness, not only improving workability but also the C-S-H pozzolanic reaction between SiO2 and Ca(OH)2 components, which is related to the pore-filling mechanism. Additionally, the structure of the mixture is tighter, contributing to significantly improving the strength of the mortar. Many studies around the world have confirmed the existence of fly ash. In addition, at 28 days, this effect is even more apparent; fly ash has displayed its advantageous features.
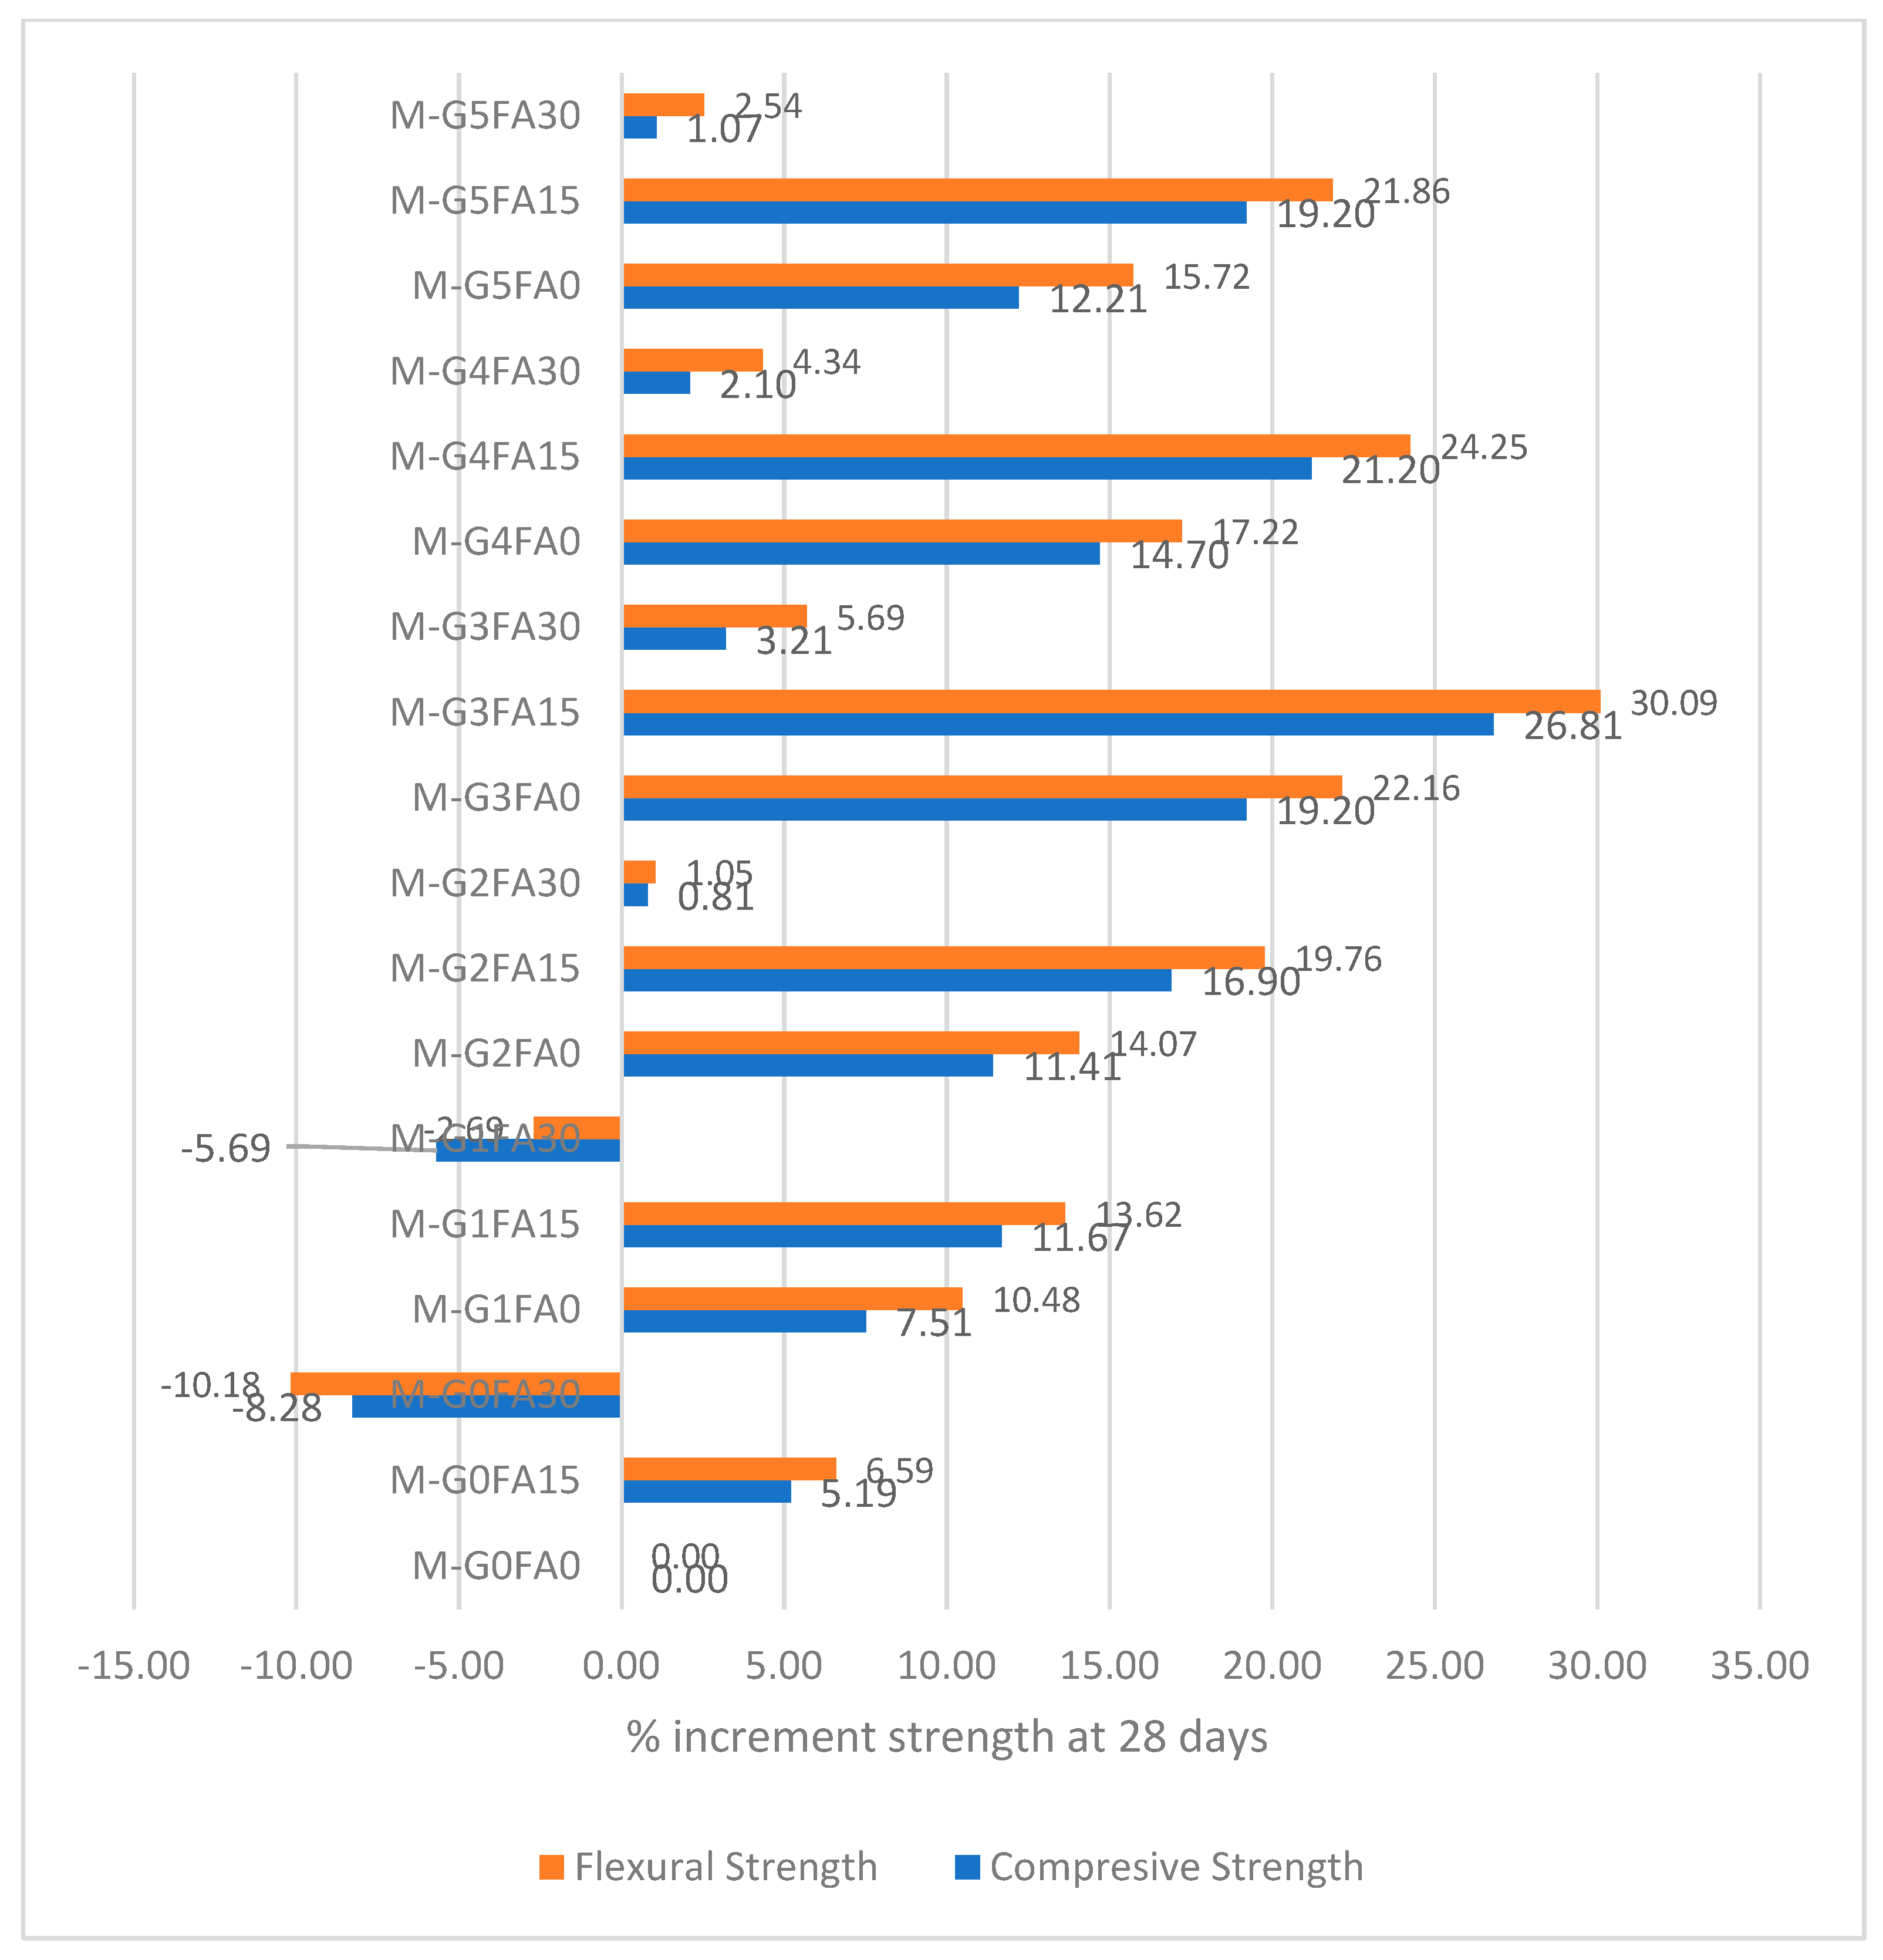
  • The mortar sample containing 0.03 wt% GO and varying amounts of fly ash had the highest compressive strength compared to the other samples. When 15 wt% fly ash was added, the maximum value of the compressive strength at 28 days was 63.99 MPa (an increase of 26.81% more than the control sample), and compared to the sample using zero fly ash, it only reached 60.15 MPa. In contrast, when fly ash content was used up to 30 wt% in the mixture, the compressive strength decreased sharply to only 52.08 MPa (a slight increase of 3.21% compared to the control sample). Therefore, the addition of GO has dramatically enhanced the compressive strength of the sample. This improvement can be attributed to the chemical interaction that occurs between the cation combination of GO and calcium, which improves the contact between GO and cement mortar. As a result, the interfacial transition zone becomes denser.

4.4. Flexural Strength

The Design of Experiments and statistical analysis with Minitab 19 software at 95% confidence level and α = 5% significance level were used. Variance analysis of flexural strength gave results as shown in Table 8 and Figure 9 of the residuals for the plots of the regression model.
In Table 8, the lack of fit with p = 1 is much more significant than the significance α = 0.05, meaning that the model displayed suitable experimental data. In addition, Figure 9 also provided a typical residual plot quite close to line zero.
Regression equation:
As with building the regression equation for compressive strength, the flexural strength (Y2) also has a relationship with the variables time, GO, and fly ash.
The regression equation for the compressive strength of mortar was expressed as shown in Equation (2) below with the statistically significant variables, p value < 0.05, R-sq = 98.86%, and R-sq(adj) = 98.79%:
Y2 = 0.7038 + 52.34 GO + 0.06898 FA + 0.6836 t − 788.1 GO2 − 0.002917 FA2 − 0.016618 t2 − 0.1296 GO × FA + 0.3299 GO × t − 0.000276 FA × t
where Y2 = flexural strength (MPa); t = time (in days); FA = fly ash content (in %); GO = Graphene oxide content (in %).
Regression Equation (2) revealed the following observations:
  • The factor with the most significant positive impact on flexural strength was also the percentage of GO with a considerable influence weight of (+52.34), which means that under the condition that other variables did not change when considered with 0.01% GO, then the flexural strength of the mortar will be increased by 0.5234 MPa.
  • Additionally, the flexural strength of mortar was significantly affected by time and fly ash content with an influence weight of (+0.6836) and (+0.06898), respectively. For every additional day, the flexural strength increases by 0.6836 MPa, while for every 1% increase in fly ash content, the flexural strength increases by 0.06898 MPa.
Furthermore, the results in Table 5 also show that the rate of increase in flexural strength of the samples at 3 and 7 days compared to 28 days was different depending on the component content in the mixture. Specifically, at 3 days, the flexural tensile strength reached approximately 38.31% to 43.87%, while at 7 days, it reached 66.71% to 71.49%.
For mortar samples containing GO, the change in flexural strength was also clear depending on the GO content and fly ash content used. The flexural strength for mortar samples with a GO content also changed remarkably from the usage level of 0.01 wt% up to 0.03 wt%, reaching the highest level. It is worth noting that when increasing the GO content to higher than 0.04 wt% and 0.05 wt%, the flexural strength tended to decrease, similar to the results of the compressive strength. The flexural strength within the mortar is directly correlated with its overall strength, but the parameters of the interfacial transition zone influence the compressive strength. The improvement in bending strength can be explained by the fact that GO has a large surface area, so the contact area between GO and cement increases, helping to improve transmission efficiency.
The mortar sample containing 0.03 wt% GO and varying amounts of fly ash had the highest flexural strength among all of the other samples. When 15 wt% fly ash was added, the maximum value of flexural strength at 28 days was 8.69 MPa (an increase of 30.09% more than the control sample), while, when using zero fly ash, it only reached 8.16 MPa. In contrast, when a fly ash content of up to 30wt% was used in the mixture, the flexural strength declined to only 7.06 MPa (a slight increase of 5.69% compared to the control sample).
With an extensive surface area, adding GO to the mortar mixture has dramatically improved the bond interface. The result was the increased strength of the mortar after curing. However, the reasonable rate of using GO content in many studies around the world is not the same. Within the scope of this study, it shows that the amount of GO used at 0.03 wt% gave the most reasonable results. When the amount of GO employed was increased to 0.05 wt%, the strength that existed in the mortar showed a tendency to decline, possibly because of the aggregation of GO. However, when the fly ash content was too much, precisely 30 wt% in this study, the strength development trend decreased clearly compared to samples with the same amount of GO.

4.5. Evaluation Increment Strength of Hardened Mortar

Figure 10 provides the results obtained from the percentage of increment strength of hardened cement mortar at 28 days. The inclusion of graphene oxide (GO) in the mixture resulted in a noticeable rise in both compressive and flexural strength. Furthermore, GO had a more pronounced impact on flexural strength compared to compressive strength.
The chart shows that the level of change in compressive and flexural strength of the mortar samples was quite similar at 28 days of age. Additionally, the chart also shows that the flexural strength had a higher increase in intensity than the compressive strength compared to the standard sample (M-GOFAO); specifically, the highest increase in flexural and compressive strength at the M-G3FA15 sample was 30.09% and 26.81%, respectively, for each type. This result was also quite close compared to recent studies [21,24].
At sample locations with GO components in the mixture, the level of strength increase was obvious, and was highest when the GO content used was 0.03 wt%. The intensity tended to increase when the GO content changed from 0.01 wt% to 0.03 wt%. Surprisingly, the intensity tended to decrease when increasing to 0.04 wt% and 0.05 wt%.
Considering the aspect of fly ash in the mixture, the most reasonable content to use was 15 wt%, but if too much was used, about 30 wt%, the intensity tends to decrease clearly. In the sample with 0.03 wt% GO content and 30 wt% fly ash, the increase was only about 5.69% for flexural strength and 3.21% for compressive strength. This growth rate was not significant, and the change in intensity was not high compared to the control sample. Even with samples without GO or 0.01 wt% GO and 30 wt% fly ash in the mixture, there is an apparent decrease in strength, as in samples M-G0FA30 and M-G1FA30. Most other samples, when the GO content increased, had a minimal difference in intensity compared to the control sample. Thus, the above experimental results partly prove the influence of GO and fly ash. The findings align with the pertinent study findings in the literature [20,22,24], which suggest that the inclusion of GO and FA leads to a significant increase in both compressive and flexural strength compared to the control sample. Additionally, study [24] notes that the compressive strength and the flexural strength decreased when the GO content was 0.05 wt%.
This is not unexpected compared to previous studies on mortar with fly ash, where the amount of FA used was high (precisely 30%, in this study). At 28 days, the fly ash displayed its properties, and the compressive and flexural strengths of mortar M-G0FA30 (0 wt% GO and 30 wt% FA) were also much lower than those of the control sample. Meanwhile, the mortar sample M-G0FA15 (0 wt% GO and 15 wt% FA) had a slight increase in strength compared to the control sample, namely 6.59% and 5.19% for flexural strength and compressive strength, respectively. This may be due to the reasonable amount of fly ash used. The result was also partly explained by the fact that fly ash participated in and promoted its role at a late stage. The increase in the long-term strength over time of concrete with fly ash is due to the pozzolanic reaction between Ca(OH)2 produced from the hydration reaction of Portland cement continuing to react with the silica oxide (SiO2) in the ash. Flying to form C-S-H gel contributes to the increase in intensity.

4.6. Determine the Optimal Content of Ingredients

The multilinear regression equations show that the mechanical properties of mortar depend on time, GO, FA, and the interaction between these factors. It is necessary to determine the appropriate content of GO and FA to ensure the best strength on time with 95% reliability to serve the production of concrete in the following experiment.
The regression Equations (1) and (2) indicate that the relationship functions have extreme values because the coefficients of the second-order terms are less than 0. We can easily determine the extremum of the function. Assuming the considered range, 0 ≤ GO ≤ 0.05 wt%, 0 ≤ FA ≤ 30 wt%, 3 ≤ time ≤ 28 days, we can find the extreme values of the functions Y1 and Y2 as follows:
Determine the optimal values of the variables to achieve the maximum compressive strength from Equation (1):
Y 1 G O = 351.3 10638 G O 0.765 F A + 2.206 t = 0 Y 1 F A = 0.5128 0.041676 F A 0.765 G O 0.002487 t = 0 Y 1 t = 5.0089 0.24256 t + 2.206 G O 0.002487 F A = 0 = > GO = 0 . 036246 % FA = 10 . 39512 % t = 20 . 84631 d a y s
Determine the optimal values of the variables to achieve the maximum flexural strength from Equation (2):
Y 2 GO = 52.34 1576.2 GO 0.1296 FA + 0.3299 t = 0 Y 2 FA = 0.06898 0.005384 FA 0.1296 GO 0.000276 t = 0 Y 2 t = 0.6836 0.033236 t + 0.3299 GO 0.000276 FA = 0 = > G O = 0.036746 % F A = 10.02801 % t = 20.84952 d a y s
Thus, from the obtained results (3) and (4), it was shown that both equations had quite similar optimal variables.
The optimal values of the variables are as follows:
GO = 0.036 wt%; FA = 10 wt%; t = 20 days
The values of each of the response for these settings are as follows:
Y1 = 67.1681 MPa and Y2 = 10.14661 MPa
In many cases, the experimenter has to optimize a number of responses at the same time. The challenge when handling multiple responses is that there may be conflicting objectives due to the different requirements of each response. The experimenter needs to find a solution that satisfies each requirement as much as possible without significantly affecting any other requirement. To address multi-response optimization, desirability functions [26] are used.
Each ith response is assigned a desirability function, di, where the value of di varies between 0 and 1. The function, di, is defined differently based on the objective of the response. If the response is to be maximized, then di is defined as follows:
d i = 0 y i < L y i L T L ω   L   y i T 1 y i > T
where T represents the target value of the ith response, yi, L represents the acceptable lower limit value for this response, and ω represents the weight. When ω = 1, the function di is linear. If ω > 1, then more importance is placed on achieving the target for the response, yi. When ω < 1, less weight is assigned to achieving the target for the response, yi.
Assume that the experimenter wants to have a target compressive strength value of 68, although any value of compressive strength greater than 60 is acceptable. Then the desirability function for yield is as follows:
d 1 = 0   Y 1 < 60 67.1681 60 68 60 1   60   Y 1 1   Y 1 > 68 68
d1 = 0.896012
For flexural strength, assume the experimenter aims for a high flexural strength with values between 8 and 10.
d2 = 1 (since Y2 > 10)
Once a desirability function is defined for each of the responses, assuming that there are responses, an overall desirability function is obtained as follows:
D = ( d 1 r 1 . d 2 r 2 d m rm ) 1 / ( r 1 + r 2 + + rm )
where r represents the importance of each response. The greater the value of ri, the more important the response with respect to the other responses. The objective is to now find the settings that return the maximum value of D.
Then, the overall desirability is as follows:
D = ( 1 ( 0.896012 ) ) 1 / 2 = 0.9467
The desirability function ranges from 0 to 1, where 1 indicates the most desirable outcome and 0 indicates a completely undesirable outcome. Therefore, a higher desirability value is better.
Thus, D > 0.8 is generally considered very good in most practical applications.
Although the current study was based on a small sample within experiment limitations, the findings suggest that a 0.036 wt% GO and 10 wt% FA solution ensures the best strength over 20 days. In practice, compressive strength is typically evaluated at 28 days of age. Strength develops over time, so at this point, the strength will tend to achieve higher values. These optimal solutions are also very consistent with the results in regression Equations (1) and (2), showing the influence of variables and their content. This finding was in agreement with the current research [24], which points out the amount used when the FA dosage was below 15 wt%.

5. Conclusions

The present study was designed to determine the effect of graphene oxide and fly ash, as well as provide an overview of the critical role of GO in cementitious materials in recent studies. This paper presents a concise summary of significant findings and potential future developments as follows:
  • The dispersion of GO in the mixture significantly affected the properties of the mortar, so the use of PCE and the mixing process should be experimented with to select the most suitable method.
  • The addition of FA to the mortar mixture contributed to significantly improving the workability and reducing the unfavorable voids when the mortar hardens, leading to increased strength, both compressive and flexural. Fly ash, along with graphene oxide, exhibited a distinct benefit in mitigating the respective limitations of one another. It suggests that using FA is a cost-effective and efficient approach to attain the desired characteristics in cement-based materials.
  • Although the results fluctuated differently compared to previous studies, the general trend was quite similar: the flexural strength had a higher growth rate than the compressive strength, and this also partly showed the superior properties of GO in the mixture.
  • Within the scope of this study, the results show that 10 wt% FA and 0.036 wt% GO gave the best results not only in physical and mechanical properties but also in other necessary properties.
  • At the same time, it also shows that by adding too much FA (up to 30 wt%) or increasing GO dosage to 0.05 wt%, the strength of the mortar mixtures tended to decrease.
The scope of this study was limited in terms of using modern microstructure equipment for analysis, leading to reducing the visual picture of fly ash and the GO effect on mortar samples. In addition, some other properties of the mortar mixture need to be evaluated, such as tensile strength, shrinkage, and waterproofing ability. These limitations could be usefully explored in our future studies.

Author Contributions

Conceptualization, N.T.T.N., T.V.N., V.Q.V., M.Q.T., J.M. and S.N.D.; methodology, N.T.T.N., T.V.N., V.Q.V., M.Q.T., J.M., Y.X., K.K.N. and S.N.D.; software, N.T.T.N., T.V.N., M.Q.T., H.T.D. and K.K.N.; validation, N.T.T.N., T.V.N., M.Q.T., H.T.D. and K.K.N.; formal analysis, J.M., Y.X. and S.N.D.; investigation, N.T.T.N., T.V.N., V.Q.V., M.Q.T., J.M. and S.N.D.; resources, N.T.T.N., T.V.N., M.Q.T. and H.T.D.; data curation, N.T.T.N., T.V.N., M.Q.T. and H.T.D.; writing—original draft preparation, N.T.T.N., T.V.N., V.Q.V., Y.X., M.Q.T., H.T.D., J.M., K.K.N. and S.N.D.; writing—review and editing, N.T.T.N., Y.X., J.M. and S.N.D.; visualization, N.T.T.N., T.V.N., M.Q.T., H.T.D. and K.K.N.; supervision, Y.X., M.Q.T., J.M. and S.N.D.; project administration, Y.X., M.Q.T., J.M. and S.N.D.; funding acquisition, Y.X., M.Q.T., J.M. and S.N.D. All authors have read and agreed to the published version of the manuscript.

Funding

This Research is funded by University of Transport Technology (UTT) under grant number ĐTTĐ2023-15.

Institutional Review Board Statement

Not applicable.

Informed Consent Statement

Not applicable.

Data Availability Statement

The data presented in this study are available on request from the corresponding author due to the host institution’s rules.

Acknowledgments

This Research is funded by University of Transport Technology (UTT) under grant number ĐTTĐ2023-15. The paper is supported by the Project to Attract Foreign Experts (G2023133018L) from the Ministry of Science and Technology of China. Minh Q. Tran acknowledges the support by the doctoral grant reference PRT/BD/154268/2022, financed by Portuguese Foundation for Science and Technology (FCT), under the MIT Portugal Program (2022 MPP2030-FCT).

Conflicts of Interest

The authors declare no conflicts of interest.

References

  1. Zhao, L.; Guo, X.; Song, L.; Song, Y.; Dai, G.; Liu, J. An Intensive Review on the Role of Graphene Oxide in Cement-Based Materials. Constr. Build. Mater. 2020, 241, 117939. [Google Scholar] [CrossRef]
  2. Wang, M.; Wang, R.; Yao, H.; Farhan, S.; Zheng, S.; Du, C. Study on the Three Dimensional Mechanism of Graphene Oxide Nanosheets Modified Cement. Constr. Build. Mater. 2016, 126, 730–739. [Google Scholar] [CrossRef]
  3. Pan, Z.; He, L.; Qiu, L.; Korayem, A.H.; Li, G.; Zhu, J.W.; Collins, F.; Li, D.; Duan, W.H.; Wang, M.C. Mechanical Properties and Microstructure of a Graphene Oxide–Cement Composite. Cem. Concr. Compos. 2015, 58, 140–147. [Google Scholar] [CrossRef]
  4. Wang, Q.; Qi, G.D.; Wang, Y.; Zheng, H.Y.; Shan, S.H.; Lu, C.X. Research Progress on the Effect of Graphene Oxide on the Properties of Cement-Based Composites. New Carbon Mater. 2021, 36, 729–750. [Google Scholar] [CrossRef]
  5. Mohammed, A.; Sanjayan, J.G.; Duan, W.H.; Nazari, A. Incorporating Graphene Oxide in Cement Composites: A Study of Transport Properties. Constr. Build. Mater. 2015, 84, 341–347. [Google Scholar] [CrossRef]
  6. Li, W.; Li, X.; Chen, S.J.; Liu, Y.M.; Duan, W.H.; Shah, S.P. Effects of Graphene Oxide on Early-Age Hydration and Electrical Resistivity of Portland Cement Paste. Constr. Build. Mater. 2017, 136, 506–514. [Google Scholar] [CrossRef]
  7. Lu, Z.; Li, X.; Hanif, A.; Chen, B.; Parthasarathy, P.; Yu, J.; Li, Z. Early-Age Interaction Mechanism between the Graphene Oxide and Cement Hydrates. Constr. Build. Mater. 2017, 152, 232–239. [Google Scholar] [CrossRef]
  8. Kedir, A.; Gamachu, M.; Alex, A.G. Cement-Based Graphene Oxide Composites: A Review on Their Mechanical and Microstructure Properties. J. Nanomater. 2023, 2023, 6741000. [Google Scholar] [CrossRef]
  9. Mu, S.; Yue, J.; Wang, Y.; Feng, C. Electrical, Piezoresistive and Electromagnetic Properties of Graphene Reinforced Cement Composites: A Review. Nanomaterials 2021, 11, 3220. [Google Scholar] [CrossRef]
  10. Lavagna, L.; Massella, D.; Priola, E.; Pavese, M. Relationship between Oxygen Content of Graphene and Mechanical Properties of Cement-Based Composites. Cem. Concr. Compos. 2021, 115, 103851. [Google Scholar] [CrossRef]
  11. Shang, Y.; Zhang, D.; Yang, C.; Liu, Y.; Liu, Y. Effect of Graphene Oxide on the Rheological Properties of Cement Pastes. Constr. Build. Mater. 2015, 96, 20–28. [Google Scholar] [CrossRef]
  12. Wang, M.; Wang, R.; Yao, H.; Wang, Z.; Zheng, S. Adsorption Characteristics of Graphene Oxide Nanosheets on Cement. RSC Adv. 2016, 6, 63365–63372. [Google Scholar] [CrossRef]
  13. Kang, D.; Seo, K.S.; Lee, H.Y.; Chung, W. Experimental Study on Mechanical Strength of GO-Cement Composites. Constr. Build. Mater. 2017, 131, 303–308. [Google Scholar] [CrossRef]
  14. Li, X.; Korayem, A.H.; Li, C.; Liu, Y.; He, H.; Sanjayan, J.G.; Duan, W.H. Incorporation of Graphene Oxide and Silica Fume into Cement Paste: A Study of Dispersion and Compressive Strength. Constr. Build. Mater. 2016, 123, 327–335. [Google Scholar] [CrossRef]
  15. Korayem, A.H.; Tourani, N.; Zakertabrizi, M.; Sabziparvar, A.M.; Duan, W.H. A Review of Dispersion of Nanoparticles in Cementitious Matrices: Nanoparticle Geometry Perspective. Constr. Build. Mater. 2017, 153, 346–357. [Google Scholar] [CrossRef]
  16. Nguyen, T.T.N.; Nguyen, A.T.; Vu, Q.V.; Ngo, V.T.; Lam, T.Q.K. The Strength of Fly Ash Concrete of Experimental Design. Mag. Civ. Eng. 2022, 109, 10911. [Google Scholar] [CrossRef]
  17. Hou, P.K.; Kawashima, S.; Wang, K.J.; Corr, D.J.; Qian, J.S.; Shah, S.P. Effects of Colloidal Nanosilica on Rheological and Mechanical Properties of Fly Ash–Cement Mortar. Cem Concr Compos 2013, 35, 12–22. [Google Scholar] [CrossRef]
  18. Lu, Z.; Hanif, A.; Ning, C.; Shao, H.; Yin, R.; Li, Z. Steric Stabilization of Graphene Oxide in Alkaline Cementitious Solutions: Mechanical Enhancement of Cement Composite. Mater. Des. 2017, 127, 154–161. [Google Scholar] [CrossRef]
  19. Zhao, L.; Guo, X.; Liu, Y.; Ge, C.; Chen, Z.; Guo, L.; Shu, X.; Liu, J. Investigation of Dispersion Behavior of GO Modified by Different Water Reducing Agents in Cement Pore Solution. Carbon 2018, 127, 255–269. [Google Scholar] [CrossRef]
  20. Wang, Q.; Qi, G.; Zhan, D.; Wang, Y.; Zheng, H. Influence of the Molecular Structure of a Polycarboxylate Superplasticiser on the Dispersion of Graphene Oxide in Cement Pore Solutions and Cement-Based Composites. Constr. Build. Mater. 2021, 272, 121969. [Google Scholar] [CrossRef]
  21. Yan, X.; Zheng, D.; Yang, H.; Cui, H.; Monasterio, M.; Lo, Y. Study of Optimizing Graphene Oxide Dispersion and Properties of the Resulting Cement Mortars. Constr. Build. Mater. 2020, 257, 119477. [Google Scholar] [CrossRef]
  22. Wang, Q.; Cui, X.; Wang, J.; Li, S.; Lv, C.; Dong, Y. Effect of Fly Ash on Rheological Properties of Graphene Oxide Cement Paste. Constr. Build. Mater. 2017, 138, 35–44. [Google Scholar] [CrossRef]
  23. Chintalapudi, K.; Pannem, R.M.R. Strength Properties of Graphene Oxide Cement Composites. Mater. Today Proc. 2021, 45, 3971–3975. [Google Scholar] [CrossRef]
  24. Wang, Y.; Yang, J.; Ouyang, D. Effect of Graphene Oxide on Mechanical Properties of Cement Mortar and Its Strengthening Mechanism. Materials 2019, 12, 3753. [Google Scholar] [CrossRef] [PubMed]
  25. Lv, S.; Ma, Y.; Qiu, C.; Sun, T.; Liu, J.; Zhou, Q. Effect of Graphene Oxide Nanosheets of Microstructure and Mechanical Properties of Cement Composites. Constr. Build. Mater. 2013, 49, 121–127. [Google Scholar] [CrossRef]
  26. Derringer, G.; Suich, R. Simultaneous Optimization of Several Response Variables. J. Qual. Technol. 1980, 12, 214–219. [Google Scholar] [CrossRef]
Figure 1. The effect of PCE in GO dispersion: (a) the effect of mixing order on the degree of GO dispersion [18]; (b) an image of GO after being dispersed in water and PCE.
Applsci 14 06140 g001
Figure 2. Mixing diagram of GO–FA cement mortar.
Applsci 14 06140 g002
Figure 3. Image of graphene oxide used in research.
Applsci 14 06140 g003
Figure 4. The experimental process: (a) determining the flexural strength; (b) mortar sample maintenance cabinet.
Applsci 14 06140 g004
Figure 5. The relationship between FA and GO content and workability.
Applsci 14 06140 g005
Figure 6. The main factors affecting this are (a) compressive strength and (b) flexural strength.
Applsci 14 06140 g006
Figure 7. Interaction plot of factors on (a) compressive strength and (b) flexural strength.
Applsci 14 06140 g007
Figure 8. DoE on compressive strength of hardened cement paste.
Applsci 14 06140 g008
Figure 9. DoE on flexural strength of hardened cement mortar.
Applsci 14 06140 g009
Figure 10. Percentage of increment strength at 28 days.
Applsci 14 06140 g010
Table 1. Chemical compositions of cement (wt.%).
SiO2Al2O3Fe2O3CaOMgOSO3Na2OK2Of-CaO LOI
21.655.253.4265.00.061.800.250.720.1252.82
Table 2. Chemical compositions of fly ash (wt.%).
SiO2Al2O3Fe2O3SO3LOI
58.722.626.060.155.05
Table 3. Physical properties of GO.
TypeThicknessSizePurityState
Industrial GO<5 nm3–10 μm>97 wt%Brown powder
Table 4. Quantities of materials used.
NoMix
Designation
Cement
(g)
FA
(g)
Standard
Sand (g)
Water
(g)
GO
(wt.%)
1M-G0FA0450013502250.00
2M-G1FA0450013502250.01
3M-G2FA0450013502250.02
4M-G3FA0450013502250.03
5M-G4FA0450013502250.04
6M-G5FA0450013502250.05
7M-G0FA15382.567.513502250.00
8M-G1FA15382.567.513502250.01
9M-G2FA15382.567.513502250.02
10M-G3FA15382.567.513502250.03
11M-G4FA15382.567.513502250.04
12M-G5FA15382.567.513502250.05
13M-G0FA3031513513502250.00
14M-G1FA3031513513502250.01
15M-G2FA3031513513502250.02
16M-G3FA3031513513502250.03
17M-G4FA3031513513502250.04
18M-G5FA3031513513502250.05
Table 5. Test results of compressive and flexural strength of mortar samples.
NoMix
Designation
DaysCompressive
Strength CS
(MPa)
Stdev.
of CS
(MPa)
Flexural
Strength FS
(MPa)
Stdev.
of FS
(MPa)
1M3G0FA0320.690.1462.690.156
2M3G0FA15322.650.1602.870.176
3M3G0FA30317.820.1522.270.159
4M3G1FA0323.330.1933.200.18
5M3G1FA15324.590.1743.300.224
6M3G1FA30319.030.1592.550.2
7M3G2FA0324.620.1743.310.156
8M3G2FA15326.220.2003.420.252
9M3G2FA30320.580.1022.700.16
10M3G3FA0327.080.1923.580.306
11M3G3FA15328.750.2123.800.186
12M3G3FA30321.350.1242.800.28
13M3G4FA0325.440.1803.410.259
14M3G4FA15326.910.1803.570.287
15M3G4FA30321.020.1512.670.278
16M3G5FA0324.740.1753.380.252
17M3G5FA15326.390.2163.510.314
18M3G5FA30320.710.1372.680.184
19M7G0FA0735.330.3064.680.114
20M7G0FA15738.600.3005.010.085
21M7G0FA30732.400.3774.090.16
22M7G1FA0737.990.5065.190.163
23M7G1FA15740.020.4545.320.087
24M7G1FA30733.320.6534.460.167
25M7G2FA0739.380.4315.370.121
26M7G2FA15741.870.4155.630.096
27M7G2FA30735.570.5134.640.066
28M7G3FA0742.930.3065.780.154
29M7G3FA15745.500.5006.140.146
30M7G3FA30736.470.5034.870.114
31M7G4FA0740.550.5075.540.127
32M7G4FA15742.870.4655.850.129
33M7G4FA30735.980.4754.800.129
34M7G5FA0739.650.4445.460.131
35M7G5FA15741.900.4505.740.03
36M7G5FA30735.700.2654.710.131
37M28G0FA02850.460.3576.680.161
38M28G0FA152855.110.3907.120.12
39M28G0FA302846.280.3946.000.235
40M28G1FA02854.250.4487.380.236
41M28G1FA152857.120.4047.590.122
42M28G1FA302847.590.3966.500.244
43M28G2FA02856.220.3987.620.176
44M28G2FA152859.800.4568.000.137
45M28G2FA302850.870.1256.750.091
46M28G1FA02860.930.2188.160.221
47M28G1FA152864.900.4788.690.206
48M28G1FA302852.080.3027.060.166
49M28G4FA02857.880.4097.830.177
50M28G4FA152861.160.4108.300.18
51M28G4FA302851.520.3706.970.189
52M28G5FA02856.620.4017.730.184
53M28G5FA152860.150.4928.140.04
54M28G5FA302851.000.3376.850.186
Table 6. Workability of mixture samples.
NoMix
Designation
GO
(%)
FA
(%)
Workability (mm)
1M-G0FA000175.5
2M-G0FA15015177.0
3M-G0FA30030178.5
4M-G1FA00.010175.0
5M-G1FA150.0115176.5
6M-G1FA300.0130178.0
7M-G2FA00.020174.5
8M-G2FA150.0215175.5
9M-G2FA300.0230176.5
10M-G3FA00.030173.5
11M-G3FA150.0315174.5
12M-G3FA300.0330175.5
13M-G4FA00.040172.5
14M-G4FA150.0415172.5
15M-G4FA300.0430173.0
16M-G5FA00.050171.0
17M-G5FA150.0515171.5
18M-G5FA300.0530172.0
Table 7. Analysis of variance of compressive strength.
SourceDegrees of FreedomAdjusted Sum of SquaresAdjusted Mean of SquaresF-Valuep-Value
Model3329,293.8887.77235.910.000
Linear929,153.23239.226,404.290.000
Days226,906.713,453.3109,663.360.000
GO (%)5810.2162.01320.880.000
FA (%)21436.3718.15853.730.000
2-Way Interactions24140.65.947.770.000
Days × GO (%)1035.73.629.130.000
Days × FA (%)456.514.1115.180.000
GO (%) × FA (%)1048.44.839.440.000
Error12815.70.1
Lack-of-Fit203.30.21.430.126
Pure Error10812.40.1
Total16129,309.5
Table 8. Analysis of variance of flexural strength.
SourceDFAdj SSAdj MSF-Valuep-Value
Model33554.49216.803588.220.000
Linear9551.70661.3012145.980.000
Days2502.641251.3208798.090.000
GO (%)518.0283.606126.220.000
FA (%)231.03715.519543.270.000
2-Way Interactions242.7860.1164.060.000
Days × GO (%)101.0810.1083.790.000
Days × FA (%)41.0570.2649.250.000
GO (%) × FA (%)100.6480.0652.270.018
Error1283.6560.029
Lack-of-Fit200.0660.0030.101.000
Pure Error1083.5900.033
Total161558.149
Disclaimer/Publisher’s Note: The statements, opinions and data contained in all publications are solely those of the individual author(s) and contributor(s) and not of MDPI and/or the editor(s). MDPI and/or the editor(s) disclaim responsibility for any injury to people or property resulting from any ideas, methods, instructions or products referred to in the content.

