Article

Enhanced Photoacoustic Spectroscopy Integrated with a Multi-Pass Cell for ppb Level Measurement of Methane

1
Centre for Optical and Electromagnetic Research, National Engineering Research Center for Optical Instruments, College of Optical Science and Engineering, Ningbo Innovation Center, Zhejiang University, Hangzhou 310058, China
2
Taizhou Research Institute, Zhejiang University, Taizhou 318000, China
3
Department of Electromagnetic Engineering, School of Electrical Engineering, KTH Royal Institute of Technology, SE-100 44 Stockholm, Sweden
*
Authors to whom correspondence should be addressed.
Appl. Sci. 2024, 14(14), 6068; https://doi.org/10.3390/app14146068
Submission received: 15 June 2024 / Revised: 3 July 2024 / Accepted: 3 July 2024 / Published: 11 July 2024

Abstract

A compact photoacoustic spectroscopy system integrated with a non-coaxial multi-pass cell was developed for improving the instrument performance in the measurement of methane. The multi-pass cell with compact light spot mode was proposed for concentrating the light radiation within a limited space, which effectively reduces the instrument dimension. A distributed feedback (DFB) laser with a central wavelength of 1653 nm was employed to excite the photoacoustic signal of methane. A total of 21 round trips of reflection were achieved in an acoustic resonant cavity with a radius of 4 mm and a length of 36 mm. Four microphones were installed around the cavity to collect the signal. An 11-fold enhancement of the photoacoustic signal was achieved through the multi-pass cell, compared to a single-pass cell with dimension of 10 cm. The system was used to measure different concentrations of methane, which showed good linearity. The continuous detection of 10 ppm methane gas was carried out for 6000 s. The Allan standard deviation analysis indicates that the limit of detection of the system was 5.7 ppb with an optimum integration time of 300 s.

1. Introduction

In recent years, greenhouse gases and air pollutants have drawn more and more attention. Many air pollutants, such as sulfide, methane, and carbon dioxide, not only cause harm to the living environment of human beings, but also directly threaten human health. Methane accounts for around 30% of the rise in global temperatures since the industrial revolution [1] and is related to intestinal diseases and colonic fermentation [2]. Therefore, high-sensitivity measurement of methane can advance our understanding of global warming and is beneficial for the medical diagnosis process.
Gas detection mainly includes electrochemical methods and optical methods. For electrochemical methods, on-chip multisensor arrays comprised of graphene derivatives have attracted significant attention due to their predicted low power consumption, high selectivity, and sensitivity [3,4]. Optical methods, including non-dispersive infrared (NDIR) [5], tunable laser spectroscopy (TDLAS) [6,7,8,9], photoacoustic spectroscopy (PAS) [10,11], and photothermal spectroscopy (PTS) [12], are commonly used in gas detection due to advantages of high sensitivity, fast response, and strong selectivity [13]. Raman signal or hyperspectral measurement or imaging can also be used for detecting gas concentration or distributions [14,15,16]. PAS is widely used in the in situ detection of various gases with the merits of high sensitivity and low cost [17,18,19]. Many schemes have been reported for further improving the instrument performance of the PAS sensor. A quartz tuning fork with high Q-factor was used to detect acoustic signals [20,21]. However, quartz-enhanced photoacoustic spectroscopy (QEPAS) is highly dependent on the beam quality of the light source, and the quartz tuning fork is easily damaged and needs to be replaced regularly, which limits its application. Photoacoustic signals are positively correlated with the power of the light source. Previous investigations used erbium-doped fiber amplification (EDFA) technology or coupling in a multi-pass cell to increase the excitation light power in the PA cell to achieve higher sensitivity [22,23]. Zhang et al. reported a wavelength-modulated differential PAS sensor with a Raman fiber amplifier enhancing the light power by ~35.48 times [24]. Han et al. coupled a PAS system to a Herriott-type multi-pass cell with a length of 160 mm using two mirrors with a diameter of 25 mm, which realized 18 reflections of the beam [25]. Ma et al. reported a multi-channel retroreflective cavity PAS, using a pair of prisms to realize four reflections and an amplification of the PA signal by 3.65 times [23]. Pan et al. proposed a high-sensitivity acetylene detection system using an ellipsoidal multi-pass cell based on opposing dual light sources to realize a nested structure of double circular spot rings with equal size, symmetry, and uniform distribution [26]. Chen et al. positioned the laser for oblique incidence on the side wall of the resonant cavity, making it reflect multiple times on the inner wall of the cavity to enhance the absorption of the gas, and obtained a photoacoustic signal amplitude equivalent to 6.4 times that of a single-pass unit [27]. Zhao et al. designed and implemented a multi-pass differential photoacoustic cell for hydrogen sulfide detection in sulfur hexafluoride background gas [28].
Although a multi-pass cell (MPC) can enhance photoacoustic signals, the large dimension of MPC cooperates with a large diameter of the acoustic resonator, which reduces the quality factor of the resonant cavity. In this paper, a simple multi-pass cell structure with a single-line spot pattern is proposed. The multi-pass cell is composed of two non-coaxial concave mirrors. In our design, the light rays are confined within the same plane and exhibit a funnel-shaped distribution, which can achieve a smaller resonator radius than in the traditional Herriott cell. Methane was measured using the compact PAS system, and continuous measurement of methane demonstrated a low detection limit of 5.7 ppb in 300 s.

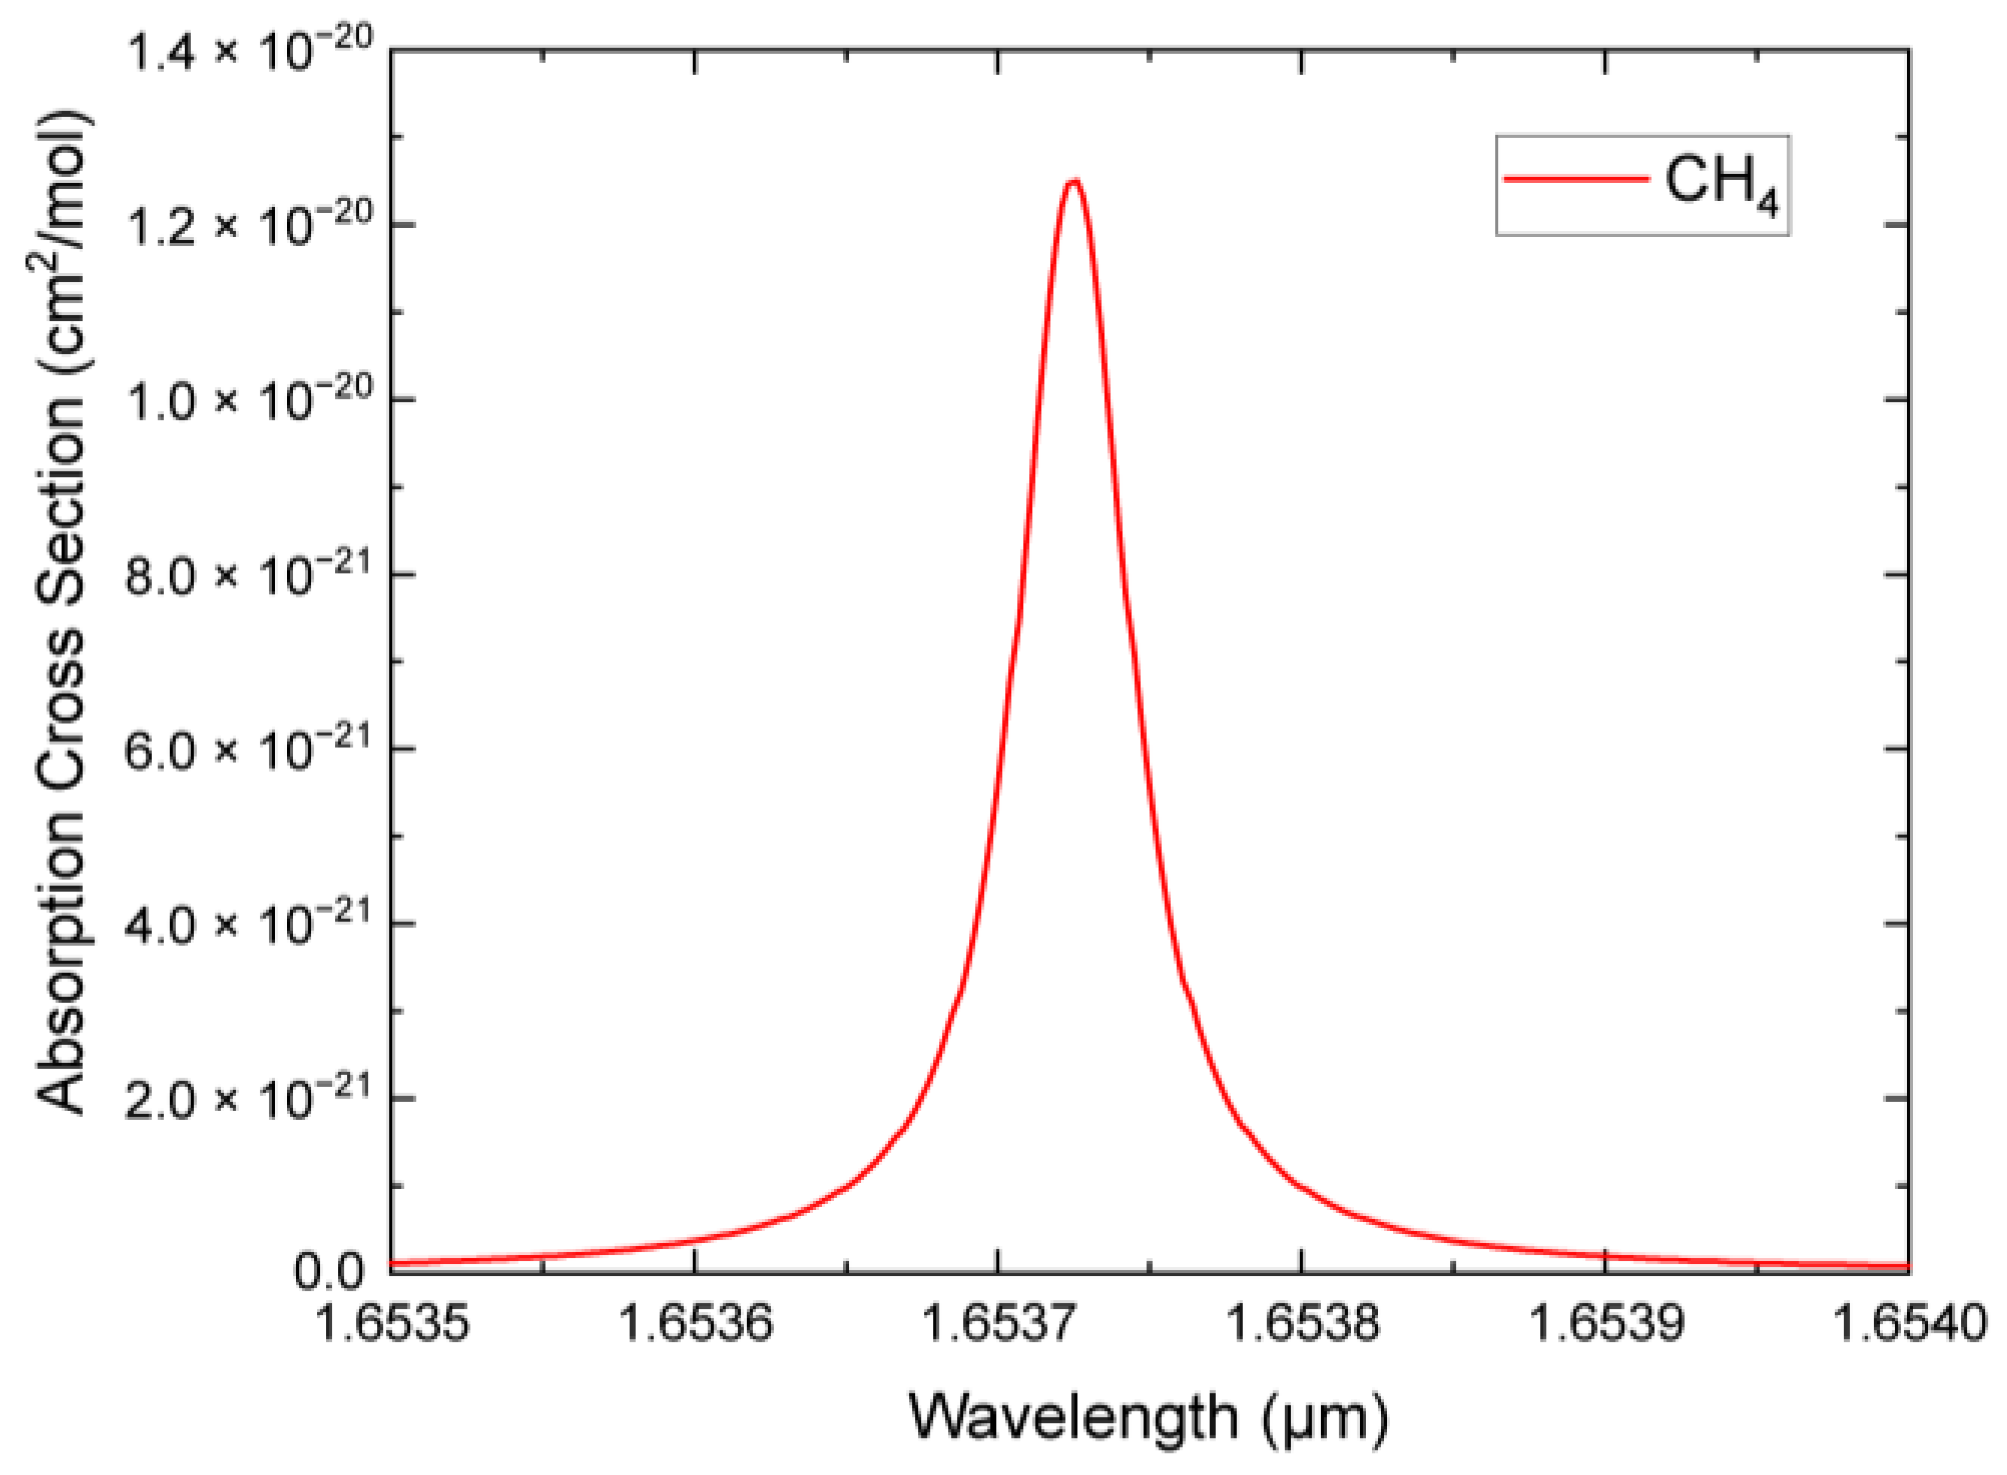
2. Measurement Principle of Photoacoustic Spectroscopy

Wavelength modulation spectroscopy is widely used in various spectroscopy systems to reduce noise interference. In wavelength modulation photoacoustic spectroscopy, the second-harmonic PAS signal (S2f) is used to infer the target gas concentration by the following expression [29]:
S 2 f = S m c F I 0 c o s ( ψ ) × H 2 ( v 0 )
where S m is the microphone sensitivity, c is the trace gas concentration, F is the PAS cell constant, I 0 is the light intensity of laser, ψ is the phase difference between the driving signal and the laser amplitude modulation,   v 0 is absorption line center, and H 2 is the second-harmonic magnitude derived from the Fourier cosine series expansion of the absorption profile at the absorption line center. This formula indicates that the signal intensity is directly determined by the cell constant (see Formula (3) below) and the intensity of the laser beam.
The acoustic signal within a resonator highly depends on the spatial overlap between the propagating laser beam and the pressure distribution of the nth acoustic eigenmode of the resonator. The amplitude ( A n ) of the nth intrinsic mode component sound pressure signal generated by light absorption is expressed by the following formula [30]:
A n = C n ( ω n ) α W L
where C n ( ω n ) denotes the sensitivity of the PA resonator at a given resonance frequency, W L denotes the light power, and α is the absorption coefficient.
The cell constant C n at the resonance frequency ω n of the nth eigenmode can be written as [30]:
C n ( ω n ) = ( σ 1 ) L F n p n ( r M ) V c e l l Q n ω n
where σ is the adiabatic coefficient of the gas, L is the absorption length, F n is the normalized overlap integral, p n ( r M ) is the dimensionless eigenmode distribution, V c e l l is the volume of the cavity, and Q n is the quality factor of the resonance. The sound pressure is inversely proportional to an effective cross-section defined by L V c e l l . For a cylindrical PA cell, L V c e l l is equal to its cross-sectional area, which is positively correlated with radius of resonant cavity.

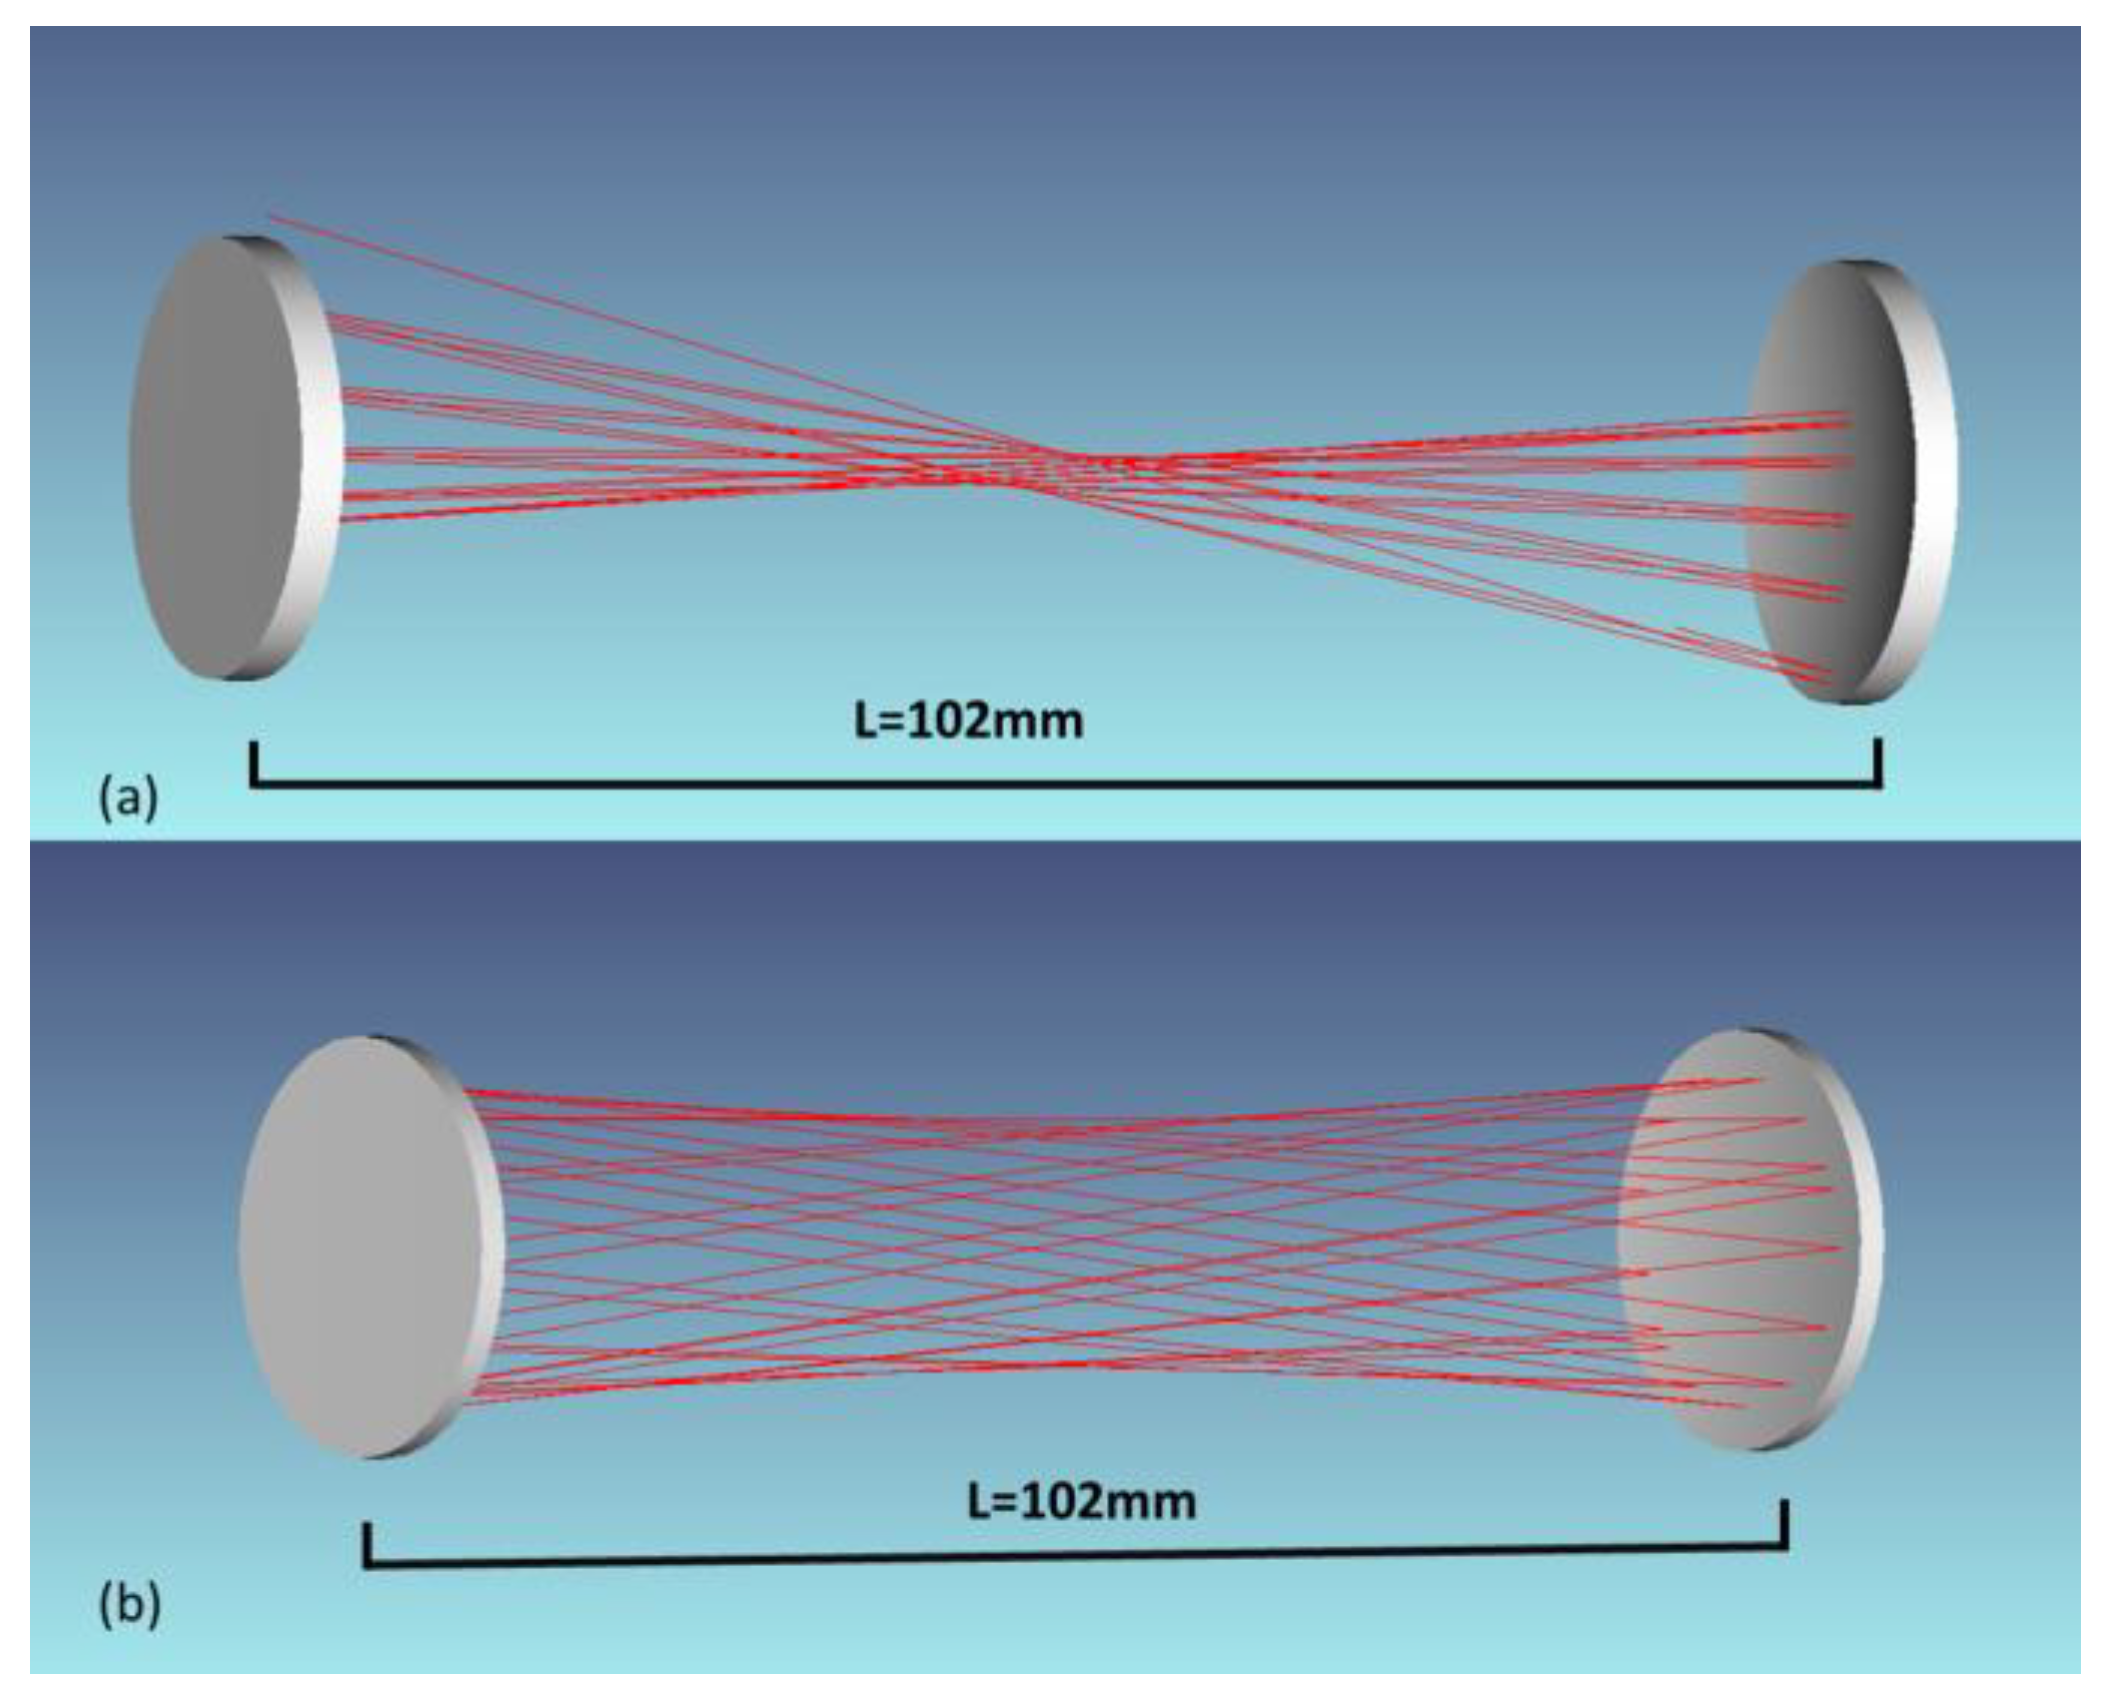
3. Integration of an Acoustic Resonator with a Multi-Pass Cell
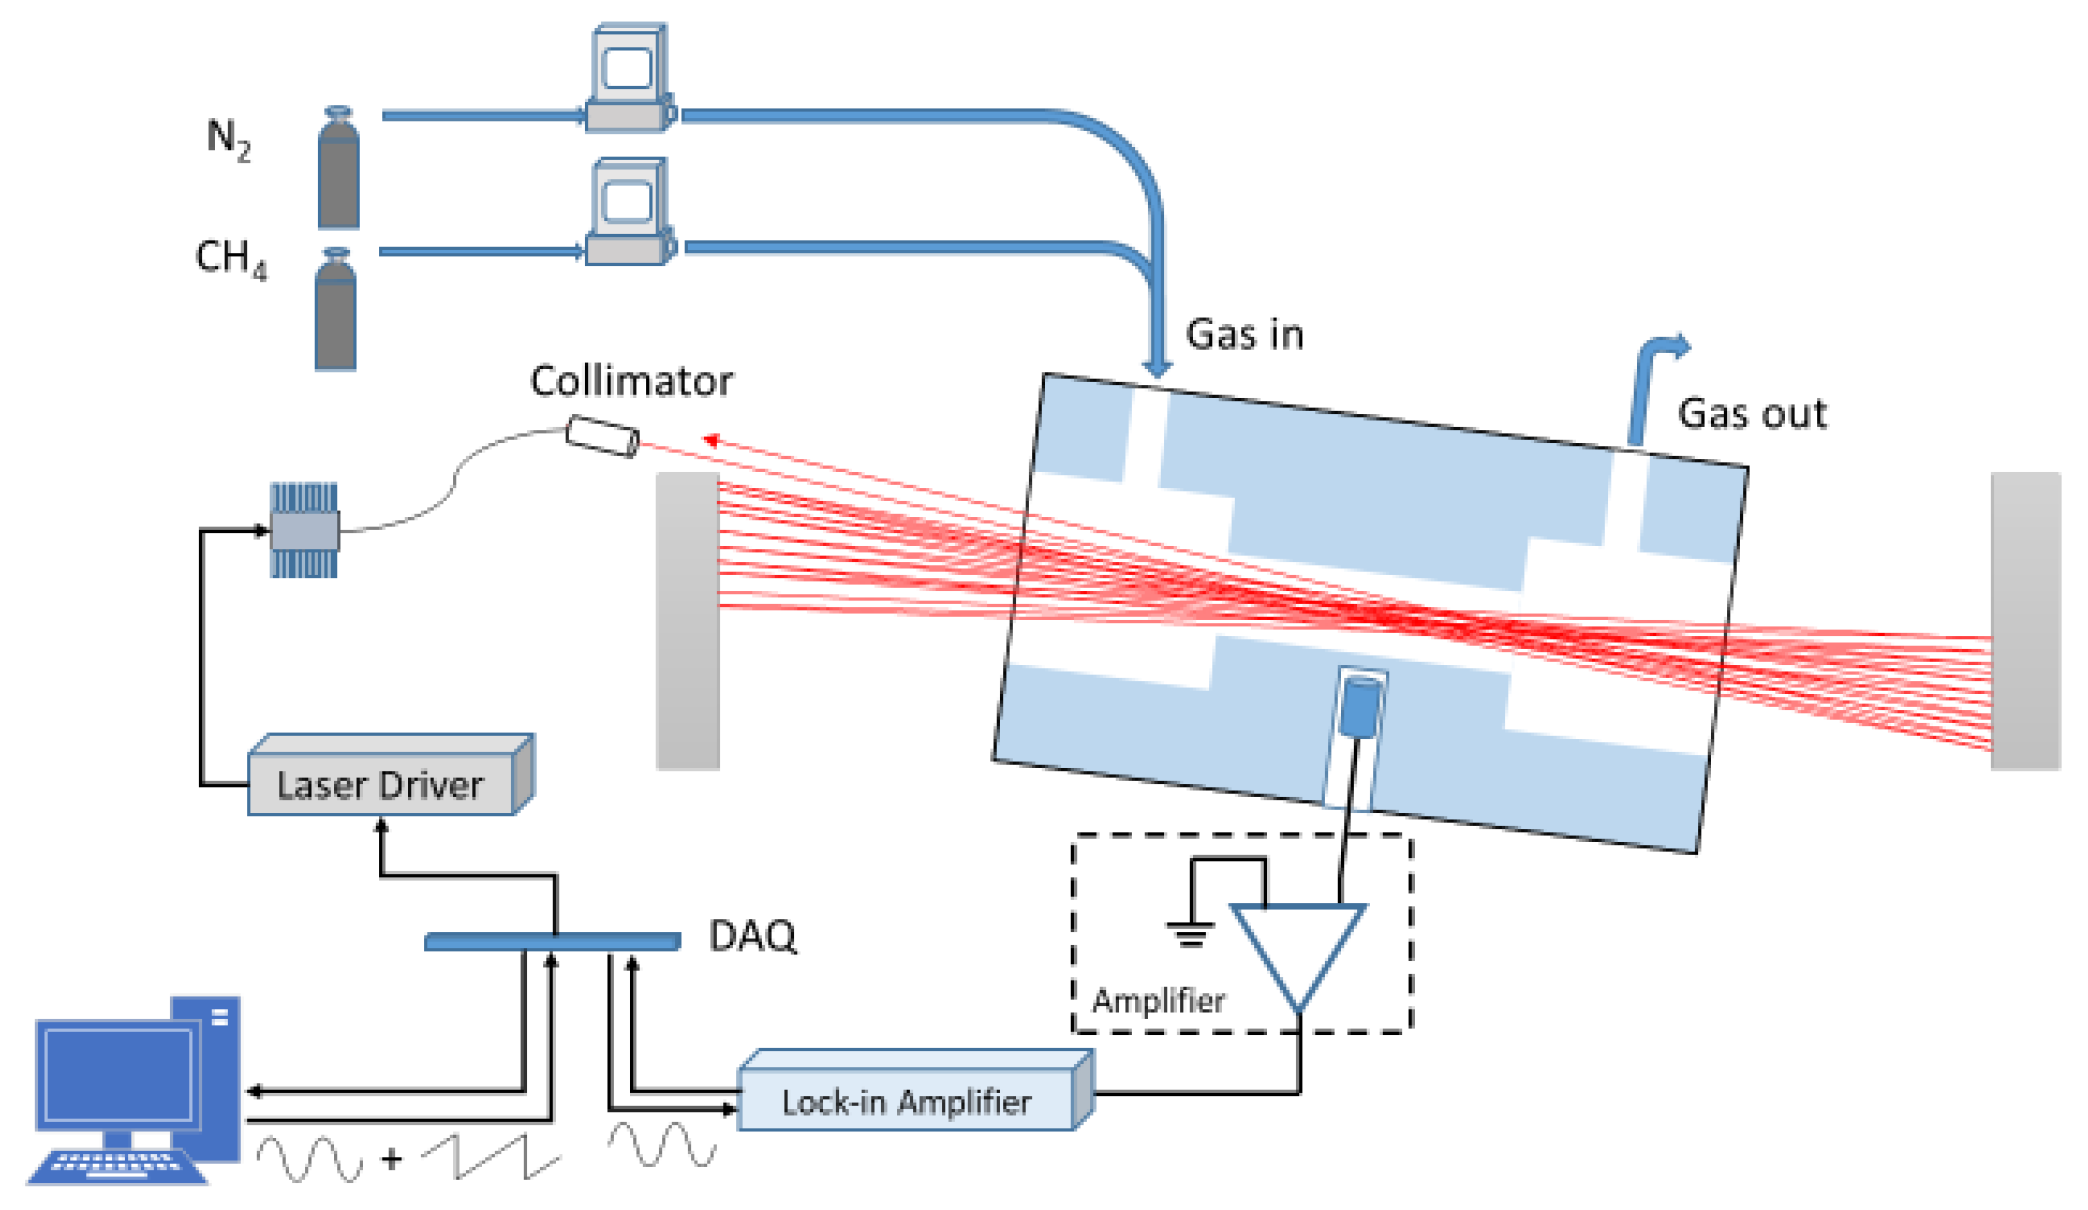
Different shapes of resonant cavities exhibit different distributions of sound pressure. In this work, considering the integration of the acoustic resonator and the multi-pass cell, we chose to construct a relatively simple cylindrical resonant cavity (with two window elements at the two ends in Figure 3 below). From Formulas (2) and (3), it can be concluded that both light power and cavity size can affect the amplitude of sound pressure. For a photoacoustic system based on a multi-pass cell, the light power is determined by factors such as the laser power and the total number of reflections of the laser beam. Increasing the total number of reflections will lead to higher optical power. Regarding the dimensions of the resonant cavity, from Formula (3) one sees that the cell constant of a cylindrical resonant cavity is inversely proportional to its cross-sectional area. To obtain stronger photoacoustic signals, it is essential to maximize the total number of passes within a smaller resonant cavity. The total number of reflections and the radius of the photoacoustic cell should be optimized when designing a multi-pass photoacoustic system.
Figure 1 shows the relationship between the total light power and the total number of reflections of the laser beam in a multi-pass cell when the loss of each window element is 0.3% (i.e., the transmission coefficient is 99.7% for each of the two window elements). As the total number of reflections increases, the total light power continues to rise. However, due to the presence of losses, the rate of the increase of the total light power progressively slows down. Excessive reflection counts will diminish the gain achieved with each reflection. Figure 1 indicates that the reflectivity of the mirror has a significant impact on the system performance. Higher reflectivity means less loss and stronger gain. In the experiment, considering the cost factor, we chose silver-coated mirrors to build the multi-pass cell (the reflectivity of the silver-coated mirrors is about 95%). If a narrowband mirror of higher reflectivity is chosen, the system performance can be further improved. Certainly, the ability of higher reflectivity to enhance the system performance is limited by the losses of window elements and scattering.
A multi-pass cell composed of two silver-coated mirrors (M1 and M2) with a diameter of 25.4 mm and a radius of curvature of 50.8 mm was designed to form a single-line spot pattern. The incident position was set near the edge of the mirror M1. With the distance of the two mirrors and the incident angle setting as 102 mm and 14.6°, the laser beam was reflected 21 times in a limited area at the center of the multi-pass cell.
To visually demonstrate the differences between the designed multi-pass cell and the traditional Herriot cell, we also designed a traditional Herriot cell which has the same size as the designed multi-pass cell. Simulations for both designs were then conducted using ZEMAX (R1.03). Figure 2 shows the optical path diagram of the designed multi-pass cell and the traditional Herriot cell. In the structure shown in Figure 2a, the light spots are distributed in a linear pattern, whereas in the traditional Herriot cell shown in Figure 2b, the light spots exhibit a ring-shaped distribution. As can be seen from Figure 2, compared to the traditional Herriot cell, our multi-pass cell has a more concentrated light distribution. This allows us to make the diameter of the resonant cavity smaller, often implying better performance.
The proposed configuration of MPC combined with a compact acoustic resonator with a radius of 8 mm and a length of 36 mm results in high instrument performance. Figure 3a shows the structure and light path of the multi-pass cell and the corresponding photoacoustic cell. The acoustic resonant cavity in the photoacoustic cell shows a length of 36 mm and a radius of 4 mm, and buffer cells with a length of 12 mm and a radius of 12 mm are arranged on both sides of the resonant cavity to reduce noise. Figure 3b shows the photograph of the multi-pass cell and the photoacoustic cell.

4. Experiment Setup

The schematic diagram of the developed PAS system with a multi-pass cell is depicted in Figure 4. A 1653 nm laser (DFB1653, Sichuan Zhiyuanguang Electronics Technology, Chengdu, China) was used as the excitation source. Figure 5 shows the performance of the DFB laser measured by an optical spectrum analyzer (AQ6317, ANDO Electric, Tokyo, Japan). The emitting wavelength of the DFB laser is tuned from 1652.8 nm to 1654.4 nm with the injected current from 70 to 170 mA at the temperature of 23.89 °C. The corresponding light power is changed from 9 to 24 mW. The temperature and current of the DFB laser were precisely controlled by a laser driver (TED200 and LDC205, Thorlabs, Newton, MA, USA). An analog modulation signal combined with a low-frequency sawtooth and a high-frequency sine wave was generated by a data acquisition card (USB-6211, National instrument, Austin, TX, USA) and imposed on the laser driver. A fiber collimator with a focal length about 20 mm was employed to collimate the laser beam. The collimated laser beam enters from the edge of one side of the reflecting mirror at a designed incident angle, and then exits the photoacoustic system after 21 round trips of reflection.
Methane has strong absorption intensity at 1653 nm. At 1653.72 nm, its absorption cross-section reaches 1.25 × 10⁻²⁰ cm2/mol. Figure 6 shows the absorption cross-section of methane at 1653.5–1654 nm (the data are simulated by the HITRAN database) [31]. To cover the absorption line of methane at 1653 nm, the temperature and current of the laser were precisely controlled by the laser driver.
A pair of mirrors coated with protective silver were used in the multi-pass system. To minimize the loss of light intensity, two ultraviolet fused silica lenses coated with SWIR antireflection film (900~1700 nm) were selected as the window of PA cell. The PA cell was made of stainless steel with a resonant frequency of 4560 Hz. Four microphones (FG-23329-P07, Knowles, Itasca, IL, USA) were installed in the center of the resonant cavity. All four microphones were connected with a preamplifier circuit to obtain stronger signals. The microphone signal was amplified and sent to a phase-locked amplifier (LIA-BVD-150-L, Femto, Berlin, Germany). The photoacoustic signal was demodulated using the lock-in amplifier with a reference sine signal generated by the data acquisition card. The air inlet and outlet of PA cell were set at the left and right buffer tanks. Two mass flow controllers (GM50A013103SMM020, MKS Instruments, Andover, MA, USA) with a maximum flow rate of 1 L/min and an error of 1 mL/min were used to control the proportion and speed of incoming gas.

5. Experiment Results and Analysis

To reduce the influence of noise, we employed wavelength modulation photoacoustic spectroscopy in the experiments. The modulation signal to the laser, which consists of a high-frequency modulated sine wave and a low-frequency sawtooth wave signal, was generated by the data acquisition card (USB-6211, National Instrument, Austin, TX, USA). The sawtooth wave signal with a frequency of 0.1 Hz was used to slowly change the laser wavelength to cover the absorption line of methane. The frequency of the high-frequency modulated sine wave was determined by the resonant frequency of the resonator. To obtain the second-harmonic signal, the resonant frequency of the resonator was set as 2280 Hz. Meanwhile, the sine wave was also sent to the phase-locked amplifier (LIA-BVD-150-L, Femto, Berlin, Germany) as a reference signal. The sound signal was collected by the microphone and demodulated through the phase-locked amplifier, and then the demodulated second-harmonic signal was sent to the computer through the data acquisition card.

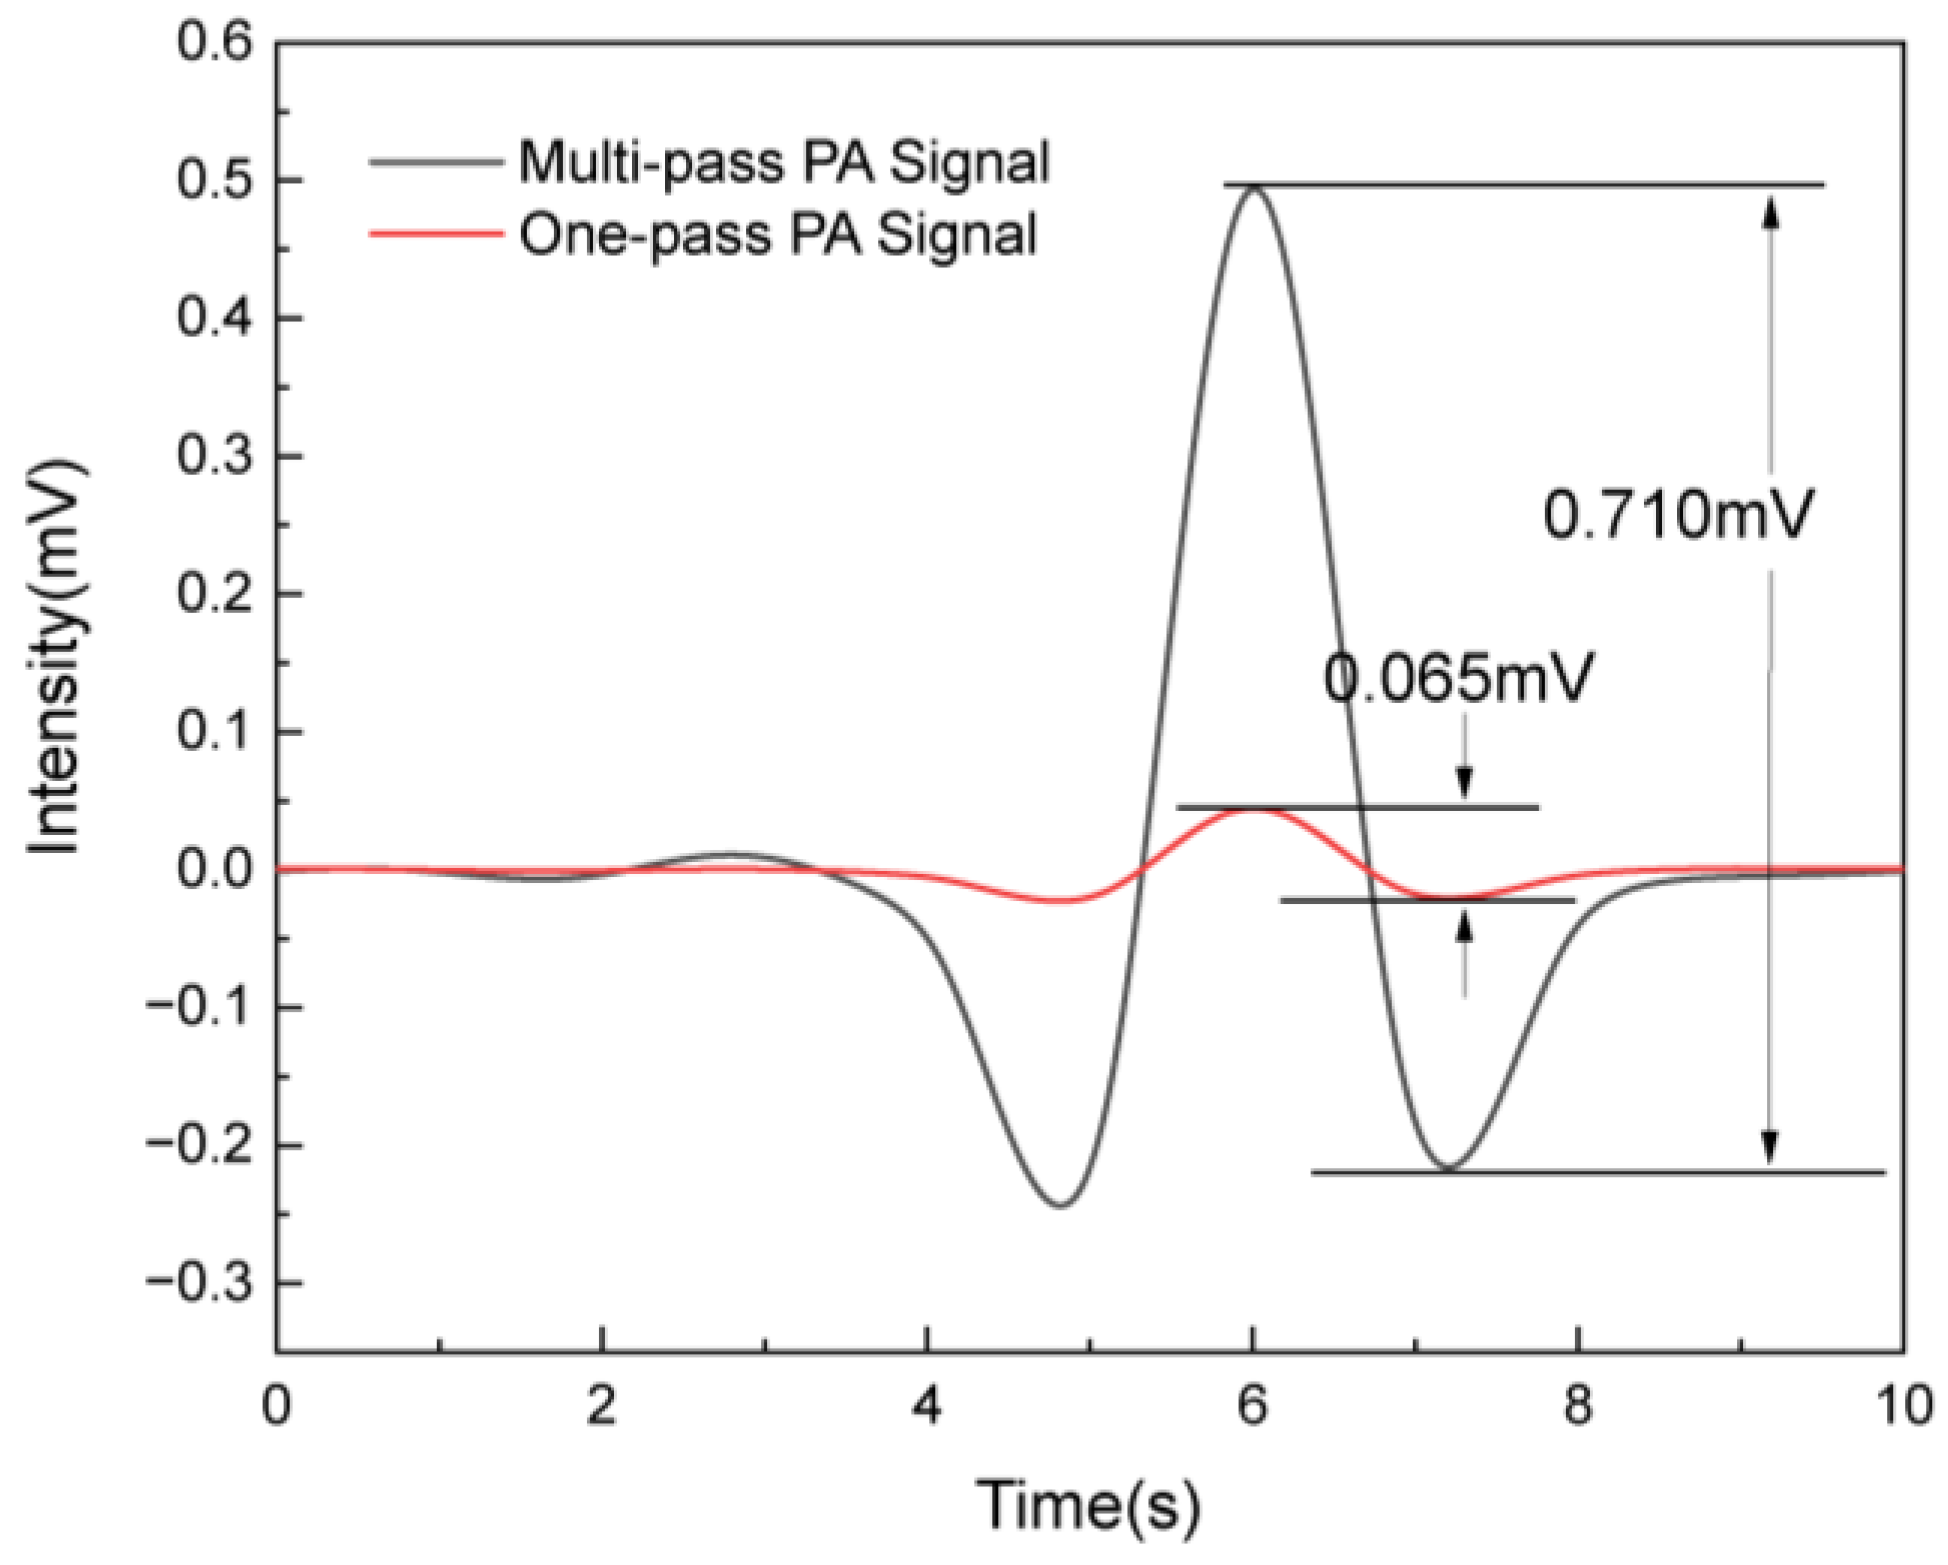
5.1. Enhancement of PA Signal Using MPC

Figure 7 shows the enhancement of the photoacoustic signal using the compact multi-pass cell in the measurement of 10 ppm methane. The photoacoustic signal obtained by the resonant cavity (which has a radius of 4 mm and a length of 36 mm) without a multi-pass cell was 0.065 mV, and the photoacoustic signal obtained by the same resonant cavity was 0.710 mV when using a multi-pass cell. The multi-pass cell enhanced the photoacoustic signal of methane by about 11 times. The light intensity in the resonant cavity should be about 12.83 times that of the case without multi-pass cells after taking into account of the silver-plated mirror reflectivity of 95% and the light loss due to the windows in the PA cell. This is close to an 11-fold enhancement of the photoacoustic signal in the experimental results. The enhancement factor of the multi-pass cell is slightly less than the theoretical value, which might be due to the additional loss caused by scattering and excess absorption during the propagation. The experimental results indicate that using a multi-pass cell can significantly enhance the magnitude of the photoacoustic signal.
Compared to a traditional Herriott cell, our multi-pass cell could achieve the same number of reflections in a smaller resonant cavity. For the Herriott cell shown in Figure 2b, the cavity radius may need to be designed to be 10 mm or larger. According to Formula (3), a smaller cavity radius provides stronger signal intensity and better detection performance.

5.2. Linearity of CH4 PA Signal

Different methane gas concentrations were obtained by diluting the standard methane gas (100 ppm) using two mass flow controllers (MFCs). One MFC was employed to control the pure nitrogen, while the other MFC was for methane. Figure 8 shows the recorded second-harmonic signal of different methane concentrations demodulated from the lock-in amplifier. Ten different concentrations of methane (from 10 ppm to 100 ppm) and pure nitrogen were measured. The linear regression result of the signal intensity versus the concentration of methane is shown in Figure 9. A good linear relationship between the signal intensity and the methane concentration (y = 0.0074*x − 0.0070, R2 = 0.999) was evident.

5.3. Allan Variance

Continuous measurement of methane within a duration of 6000 s was carried out to evaluate the stability of the PAS system. Through two MFCs, the flow rates of the pure nitrogen and methane were set at a ratio of 9:1. The methane concentration is constant at ~10 ppm. The time resolution of measurement was 10 s, and a total of 600 data points were obtained during a measurement time of 6000 s. The measurement results are shown in Figure 10. The system achieved a detection sensitivity of 0.116 ppm with an average time of 10 s. A linear black line is indicated in Figure 10, which shows the minimization of white noise at a low integration time and provides a minimum of Allan deviation 5.7 ppb at an optimal integration time of 300 s.

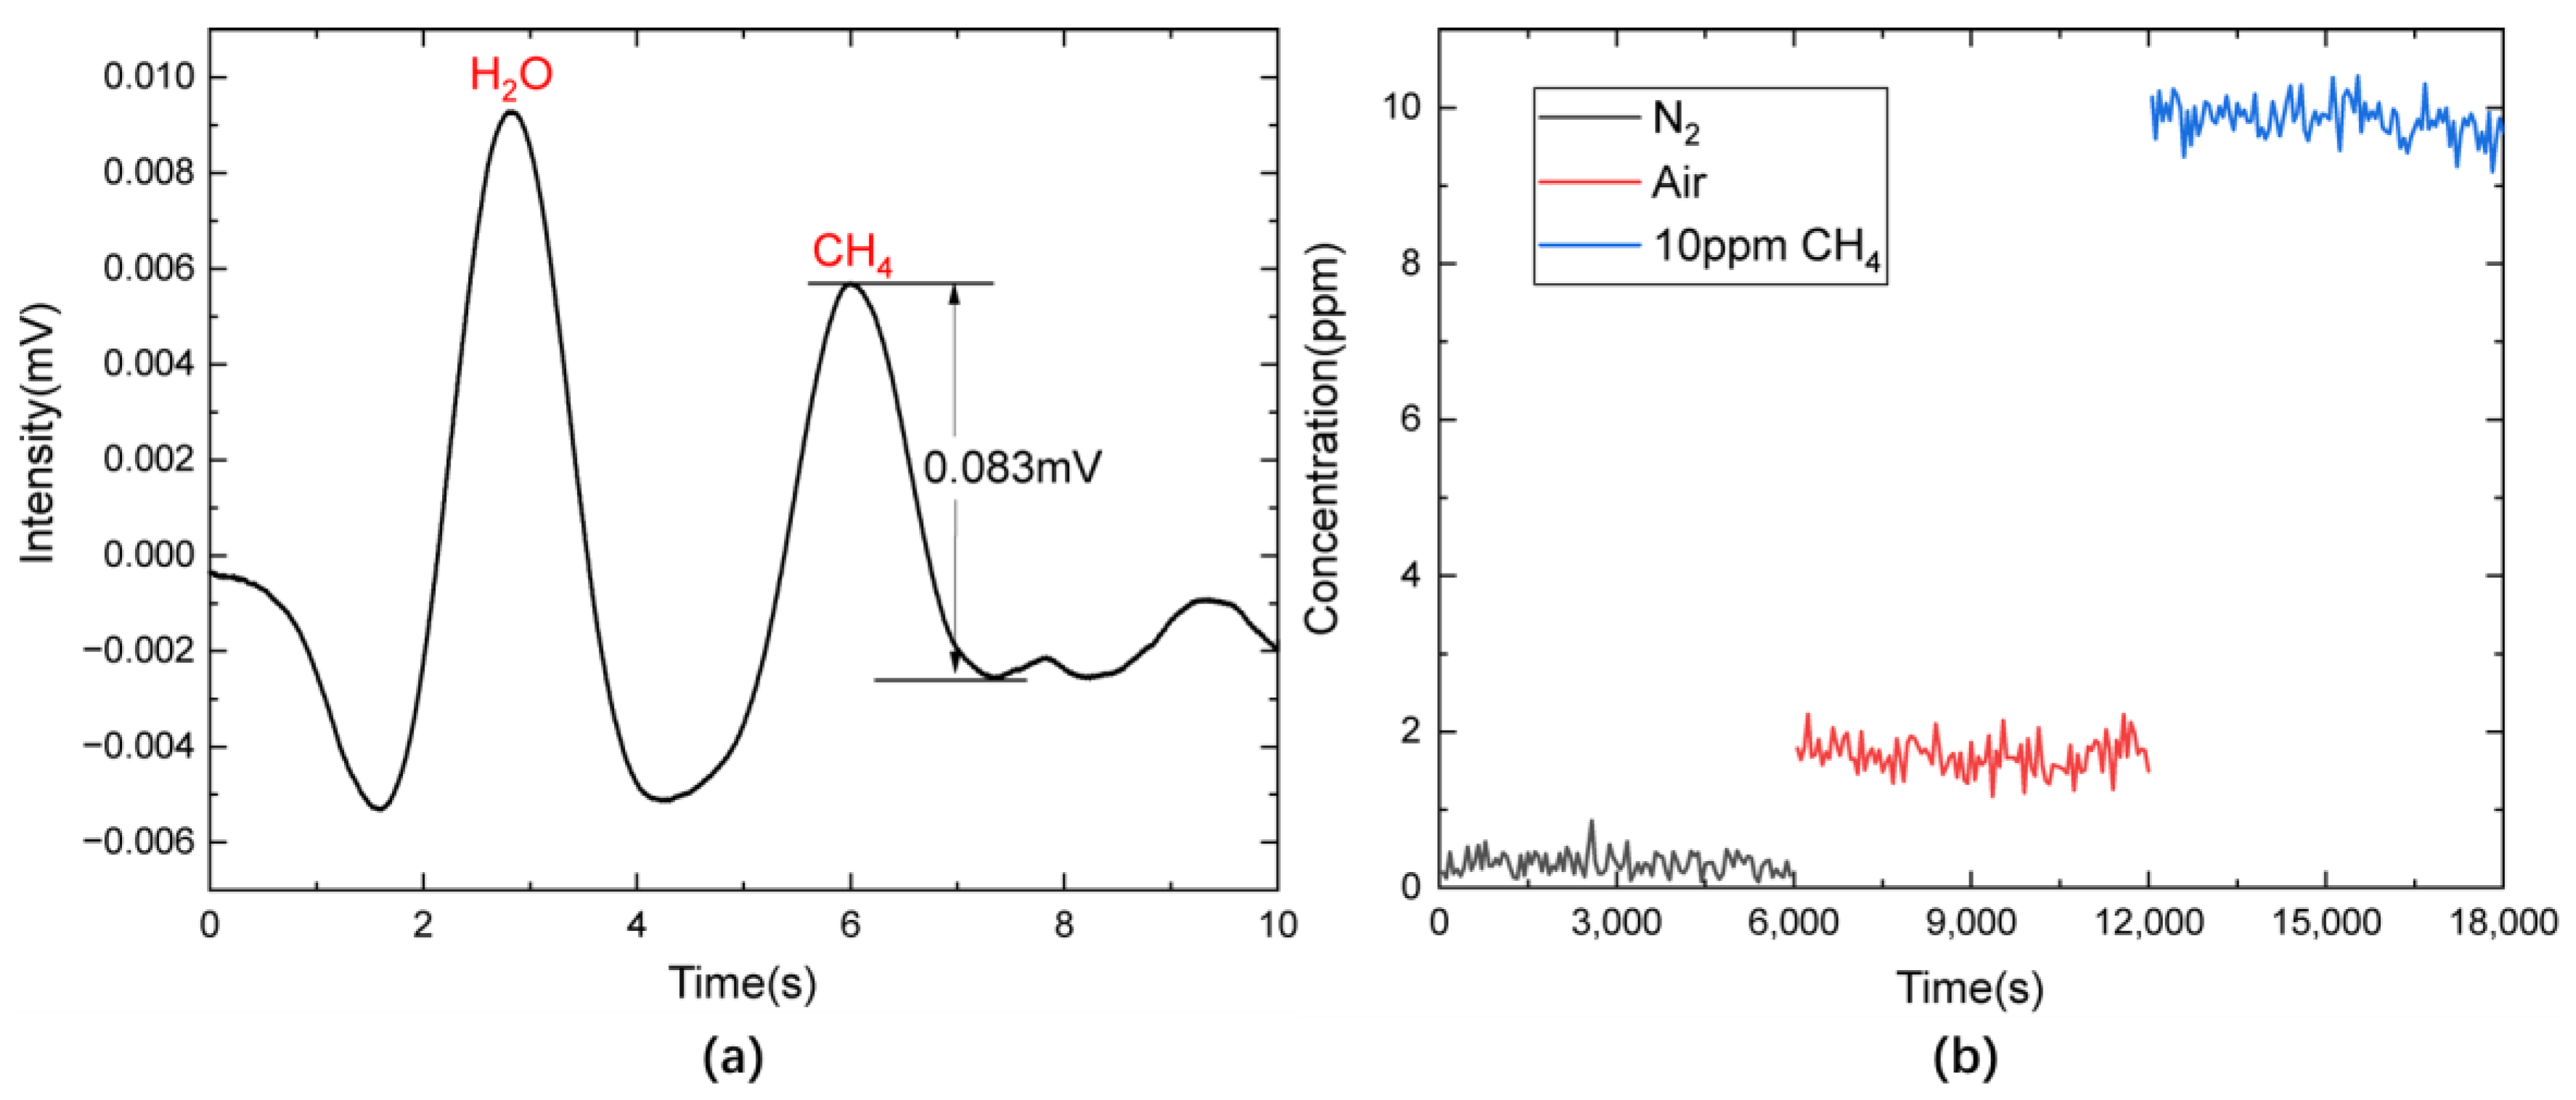
5.4. Measurement of CH4 in the Atmosphere

Atmospheric methane was measured using the developed PAS system. Figure 11a shows the measurement of methane in the air, which shows two peaks: one peak on the right corresponding to the methane absorption line at 1653.72 nm, and another peak on the left related to the water absorption line at 1653.50 nm. The peak corresponding to the absorption peak of the measured methane is 0.083 mV, and the methane concentration is calculated to be 2.07 ppm. The result shows that the system is capable of detecting methane in the air. Figure 11b presents a continuous measurement of 0 ppm methane (nitrogen), atmospheric methane, and 10 ppm methane in the PA cell within a measurement duration of 5 h, which validated the developed MPC-PA (multi-pass cell photoacoustic spectroscopy) sensor. The signal-to-noise ratio of photoacoustic signal in the measurement of 10 ppm methane was determined to be 32.0, which results in a limit-of-detection of 0.313 ppm in 10 s.

6. Conclusions

In this paper, a compact photoacoustic spectroscopy system-based multi-pass cell was developed for methane gas detection. To concentrate the radiation within a limited space, a multi-pass cell composed of two non-coaxial mirrors with a diameter of 25.4 mm and a radius of curvature of 50.8 mm was designed. A total of 21 reflections occurred in the developed multi-pass cell, which cooperated with an acoustic resonant cavity with a radius of 4 mm and a length of 36 mm. The developed PA cell with the developed MPC presented a compact dimension with a total length of 102 mm. An 11-fold enhancement in photoacoustic signal was obtained through the multi-pass cell. PA signals with different methane concentrations shows a good linear relationship. The detection sensitivity of 0.114 ppm and 5.7 ppb was achieved with the average time of 10 s and 300 s, respectively, which shows the excellent detection performance of the system. The developed MPC-PA sensor was validated by atmospheric methane measurement and presented a long period of stability and a high sensitivity in the detection of methane. In addition, although this multi-pass cell may not offer significant advantages over the traditional Herriott cell in TDLAS, due to the optical path being confined within a plane, it can still be employed in QEPAS systems.

Author Contributions

Conceptualization, S.H., G.W. and L.W.; Methodology, L.W., T.Z., Y.H. and Y.Z.; software, L.W. and Y.Z.; Validation, L.W. and Y.H.; data curation, L.W.; formal analysis, L.W. and T.Z.; funding acquisition, S.H.; Investigation, L.W., Y.H. and Y.Z.; resources, S.H.; supervision, S.H. and G.W.; Writing—original draft, L.W.; Writing—review and editing, S.H. and G.W. All authors have read and agreed to the published version of the manuscript.

Funding

This research was funded by “Pioneer” and “Leading Goose” R&D Program of Zhejiang Province (2022C03051, 2023C03135), Ningbo Natural Science Foundation (2022J159), the Key Research and Development Program of Zhejiang Province (Grant Nos. 2021C03178), Zhejiang Provincial Natural Science Foundation of China (LQ22F050014), National Natural Science Foundation of China (Grant No. 62305290). National Key Research and Development Program of China (Grant Nos. 2022YFC3601002 and 2022YFC2010003), and Ningbo Science and Technology Project (2023Z179).

Institutional Review Board Statement

Not applicable.

Informed Consent Statement

Not applicable.

Data Availability Statement

The raw data supporting the conclusions of this article will be made available by the authors on request.

Acknowledgments

The authors are grateful to Julian Evans, Zhang Tie, Yan Huang and Yuhao Zheng for valuable discussion and help.

Conflicts of Interest

The authors declare no conflicts of interest.

References

  1. Global Methane Tracker 2023. Available online: https://www.iea.org/reports/global-methane-tracker-2023 (accessed on 30 June 2024).
  2. Roccarina, D.; Lauritano, E.C.; Gabrielli, M.; Franceschi, F.; Ojetti, V.; Gasbarrini, A. The Role of Methane in Intestinal Diseases. Am. J. Gastroenterol. 2010, 105, 1250–1256. [Google Scholar] [CrossRef] [PubMed]
  3. Rabchinskii, M.K.; Sysoev, V.V.; Varezhnikov, A.S.; Solomatin, M.A.; Struchkov, N.S.; Stolyarova, D.Y.; Ryzhkov, S.A.; Antonov, G.A.; Gabrelian, V.S.; Cherviakova, P.D.; et al. Toward On-Chip Multisensor Arrays for Selective Methanol and Ethanol Detection at Room Temperature: Capitalizing the Graphene Carbonylation. ACS Appl. Mater. Interfaces 2023, 15, 28370–28386. [Google Scholar] [CrossRef] [PubMed]
  4. Rabchinskii, M.K.; Sysoev, V.V.; Glukhova, O.E.; Brzhezinskaya, M.; Stolyarova, D.Y.; Varezhnikov, A.S.; Solomatin, M.A.; Barkov, P.V.; Kirilenko, D.A.; Pavlov, S.I.; et al. Guiding Graphene Derivatization for the On-Chip Multisensor Arrays: From the Synthesis to the Theoretical Background. Adv. Mater. Technol. 2022, 7, 2101250. [Google Scholar] [CrossRef]
  5. Tan, X.C.; Zhang, H.; Li, J.Y.; Wan, H.W.; Guo, Q.S.; Zhu, H.B.; Liu, H.; Yi, F. Non-dispersive infrared multi-gas sensing via nanoantenna integrated narrowband detectors. Nat. Commun. 2020, 11, 5245. [Google Scholar] [CrossRef] [PubMed]
  6. Lou, X.T.; Somesfalean, G.; Svanberg, S.; Zhang, Z.G.; Wu, S.H. Detection of elemental mercury by multimode diode laser correlation spectroscopy. Opt. Express 2012, 20, 4927–4938. [Google Scholar] [CrossRef] [PubMed]
  7. Lin, H.Z.; Lou, X.T.; Zhong, W.J.; He, S.L. Continuous monitoring of elemental mercury employing low-cost multimode diode lasers. Meas. Sci. Technol. 2015, 26, 085501. [Google Scholar] [CrossRef]
  8. Lou, X.T.; Zhang, T.; Lin, H.Z.; Gao, S.Y.; Xu, L.J.; Wang, J.N.; Wan, L.; He, S.L. Detection of gaseous elemental mercury using a frequency-doubled green diode laser. Opt. Express 2016, 24, 27509–27520. [Google Scholar] [CrossRef] [PubMed]
  9. Lin, H.Z.; Gao, F.; Ding, Y.J.; Yan, C.S.; He, S.L. Methane detection using scattering material as the gas cell. Appl. Opt. 2016, 55, 8030–8034. [Google Scholar] [CrossRef] [PubMed]
  10. Li, F.M.; Zhang, T.; Wang, G.X.; He, S.L. Simultaneous Detection of CO2 and N2O Based on Quartz-Enhanced Photothermal Spectroscopy by Using NIR and MIR Lasers. Prog. Electromagn. Res. M 2023, 118, 137–149. [Google Scholar] [CrossRef]
  11. Zhang, T.; Xing, Y.X.; Wang, G.X.; He, S.L. High Sensitivity Continuous Monitoring of Chloroform Gas by Using Wavelength Modulation Photoacoustic Spectroscopy in the Near-Infrared Range. Appl. Sci. 2021, 11, 6992. [Google Scholar] [CrossRef]
  12. Mohebbifar, M.R. High-sensitivity detection and quantification of CHCl3 vapors in various gas environments based on the photoacoustic spectroscopy. Microw. Opt. Technol. Lett. 2019, 61, 2234–2241. [Google Scholar] [CrossRef]
  13. Xing, Y.; Wang, G.; Zhang, T.; Shen, F.; Meng, L.; Wang, L.; Li, F.; Zhu, Y.; Zheng, Y.; He, N.; et al. VOC Detections with Optical Spectroscopy. Prog. Electromagn. Res. 2022, 173, 71–92. [Google Scholar] [CrossRef]
  14. Yan, D.; Popp, J.; Frosch, T. Analysis of Fiber-Enhanced Raman Gas Sensing Based on Raman Chemical Imaging. Anal. Chem. 2017, 89, 12269–12275. [Google Scholar] [CrossRef]
  15. Jiao, C.; Lin, Z.; Xu, Y.; He, S. Noninvasive Raman Imaging for Monitoring Mitochondrial Redox State in Septic Rats. Prog. Electromagn. Res. 2022, 175, 149–157. [Google Scholar] [CrossRef]
  16. Luo, J.; Lin, Z.J.; Xing, Y.X.; Forsberg, E.; Wu, C.D.; Zhu, X.H.; Guo, T.B.A.; Wang, G.X.; Bian, B.L.; Wu, D.; et al. Portable 4D Snapshot Hyperspectral Imager for Fastspectral and Surface Morphology Measurements. Prog. Electromagn. Res. 2022, 173, 25–36. [Google Scholar] [CrossRef]
  17. Jiang, Y.M.; Zhang, T.; Wang, G.X.; He, S.L. A Dual-Gas Sensor Using Photoacoustic Spectroscopy Based on a Single Acoustic Resonator. Appl. Sci. 2021, 11, 5224. [Google Scholar] [CrossRef]
  18. Wang, G.X.; Zhang, T.; Jiang, Y.M.; He, S.L. Compact photoacoustic spectrophone for simultaneously monitoring the concentrations of dichloromethane and trichloromethane with a single acoustic resonator. Opt. Express 2022, 30, 7053–7067. [Google Scholar] [CrossRef]
  19. Huang, Y.; Zhang, T.; Wang, G.X.; Xing, Y.X.; He, S.L. Wavelength-modulated photoacoustic spectroscopy sensor for multi-gas measurement of acetone, methane, and water vapor based on a differential acoustic resonator. Appl. Phys. Lett. 2023, 122, 111105. [Google Scholar] [CrossRef]
  20. Kosterev, A.A.; Bakhirkin, Y.A.; Curl, R.F.; Tittel, F.K. Quartz-enhanced photoacoustic spectroscopy. Opt. Lett. 2002, 27, 1902–1904. [Google Scholar] [CrossRef]
  21. Ma, Y.F. Review of Recent Advances in QEPAS-Based Trace Gas Sensing. Appl. Sci. 2018, 8, 1822. [Google Scholar] [CrossRef]
  22. Yin, X.K.; Dong, L.; Wu, H.P.; Ma, W.G.; Zhang, L.; Yin, W.B.; Xiao, L.T.; Jia, S.T.; Tittel, F.K. Ppb-level H2S detection for SF6 decomposition based on a fiber-amplified telecommunication diode laser and a background-gas-induced high-Q photoacoustic cell. Appl. Phys. Lett. 2017, 111, 031109. [Google Scholar] [CrossRef]
  23. Ma, Y.F.; Qiao, S.D.; He, Y.; Li, Y.; Zhang, Z.H.; Yu, X.; Tittel, F.K. Highly sensitive acetylene detection based on multi-pass retro-reflection-cavity-enhanced photoacoustic spectroscopy and a fiber amplified diode laser. Opt. Express 2019, 27, 14163–14172. [Google Scholar] [CrossRef]
  24. Zhang, T.; Wang, L.H.; Huang, Y.; He, H.J.; He, S.L.; Wang, G.X. Ppb-level methane detection sensitivity based on a homemade Raman fiber amplifier and differential photoacoustic technology. Appl. Opt. 2023, 62, 6464–6471. [Google Scholar] [CrossRef]
  25. Han, L.; Chen, X.L.; Xia, H.; Pang, T.; Zhang, Z.R.; Wu, B.; Sun, P.S.; Cui, X.J.; Li, Z.; Wang, Y.; et al. A photocoustic spectroscopy system for gas detection based on the multi-pass cell. In Proceedings of the Conference on Advanced Sensor Systems and Applications VII, Beijing, China, 12–14 October 2016. [Google Scholar]
  26. Pan, H.; Wang, Q.Y.; Zhang, C.; Li, Z.G.; Shan, P.; Ma, Z.H. High-sensitivity acetylene detection system using ellipsoid multi-pass cell (EMPC) based on the opposite dual optical source. Infrared Phys. Technol. 2021, 118, 103874. [Google Scholar] [CrossRef]
  27. Chen, K.; Liu, S.; Zhang, B.; Gong, Z.F.; Chen, Y.W.; Zhang, M.; Deng, H.; Guo, M.; Ma, F.X.; Zhu, F.; et al. Highly sensitive photoacoustic multi-gas analyzer combined with mid-infrared broadband source and near-infrared laser. Opt. Lasers Eng. 2020, 124, 105844. [Google Scholar] [CrossRef]
  28. Zhao, X.Y.; Guo, M.; Cui, D.Y.; Li, C.X.; Qi, H.C.; Chen, K.; Ma, F.X.; Huang, J.Y.; Zhang, G.Y.; Zhao, J.K. Multi-pass Differential Photoacoustic Sensor for Real-Time Measurement of SF6 Decomposition Component H2S at the ppb Level. Anal. Chem. 2023, 95, 8214–8222. [Google Scholar] [CrossRef]
  29. Wang, Z.L.; Tian, C.W.; Liu, Q.; Chang, J.; Zhang, Q.D.; Zhu, C.G. Wavelength modulation technique-based photoacoustic spectroscopy for multipoint gas sensing. Appl. Opt. 2018, 57, 2909–2914. [Google Scholar] [CrossRef]
  30. Miklós, A.; Hess, P.; Bozóki, Z. Application of acoustic resonators in photoacoustic trace gas analysis and metrology. Rev. Sci. Instrum. 2001, 72, 1937–1955. [Google Scholar] [CrossRef]
  31. Gordon, I.E.; Rothman, L.S.; Hargreaves, R.J.; Hashemi, R.; Karlovets, E.V.; Skinner, F.M.; Conway, E.K.; Hill, C.; Kochanov, R.V.; Tan, Y.; et al. The HITRAN2020 molecular spectroscopic database. J. Quant. Spectrosc. Radiat. Transf. 2022, 277, 107949. [Google Scholar]
Figure 1. The relationship between the total light power and the total number of reflections when the loss of window elements is 0.3%.
Applsci 14 06068 g001
Figure 2. Schematic diagram of the optical path of the designed multi-pass cell and a traditional Herriot cell of the same size. (a) The simulation result of the designed multi-pass cell. (b) The simulation result of the traditional Herriot cell of the same size.
Applsci 14 06068 g002
Figure 3. (a) Schematic diagram of the designed photoacoustic cell. (b) Image of the designed photoacoustic cell.
Applsci 14 06068 g003
Figure 4. Schematic diagram of the multi-pass cell photoacoustic system.
Applsci 14 06068 g004
Figure 5. The laser wavelength and the output power tuned by the injected current of the experiment at the temperature of 23.89 °C.
Applsci 14 06068 g005
Figure 6. The absorption cross-section value of methane from 1653.5 nm to 1654 nm.
Applsci 14 06068 g006
Figure 7. The photoacoustic signal enhanced by the multi-pass cell and the single-pass photoacoustic signal at 10 ppm methane concentration.
Applsci 14 06068 g007
Figure 8. 2f signals of different concentrations of methane.
Applsci 14 06068 g008
Figure 9. Linear regression results of methane concentration and signal intensity.
Applsci 14 06068 g009
Figure 10. The results of 6000 s of continuous measurement of methane concentration and the corresponding Allan–Werle analysis of variance.
Applsci 14 06068 g010
Figure 11. Measurement result of air and continuous measurement for different gases. (a) 2f PA signal of air. (b) Continuous measurement results of nitrogen, air, and 10 ppm methane.
Applsci 14 06068 g011
Disclaimer/Publisher’s Note: The statements, opinions and data contained in all publications are solely those of the individual author(s) and contributor(s) and not of MDPI and/or the editor(s). MDPI and/or the editor(s) disclaim responsibility for any injury to people or property resulting from any ideas, methods, instructions or products referred to in the content.

