Article

Extraction of Coal Mine Surface Collapse Information and Design of Comprehensive Management Model Based on Multi-Source Remote Sensing—Taking Zhaogu Mining Area as Example

School of Surveying and Land Information Engineering, Henan Polytechnic University (HPU), Jiaozuo 454003, China
*
Author to whom correspondence should be addressed.
Appl. Sci. 2024, 14(14), 6055; https://doi.org/10.3390/app14146055
Submission received: 15 June 2024 / Revised: 7 July 2024 / Accepted: 8 July 2024 / Published: 11 July 2024
(This article belongs to the Special Issue Intelligent Computing and Remote Sensing—2nd Edition)

Abstract

:
Large-scale exploitation of underground mineral resources causes surface collapse, reduces land use efficiency, and brings a series of ecological and environmental problems. This is significantly important for the ecological restoration work of mining areas to accurately extract the subsidence range and depth of coal mine surface and formulate the regulation model suitable for coal mine subsidence areas. In this research, we used Differential Interferometric Synthetic Aperture Radar (D-InSAR) technology to extract the subsidence range of the Zhaogu Mining Area in Henan Province based on multi-source remote sensing data. We constructed the Spectral-Spatial Residual Network (SSRN) to classify the land use information within the subsidence range. Finally, we constructed a fuzzy comprehensive evaluation model based on the improved G1 method that assesses the extent of land damage in the subsidence area. Additionally, a suitable governance model for the subsidence area in the Zhaogu Mining Area is proposed. The results can provide technical support and data reference for the comprehensive treatment of subsidence in the Zhaogu Mining Area.

1. Introduction

Coal resources, being a significant worldwide energy mineral resource, are highly valued by many countries due to their abundant reserves and affordable cost. However, extensive exploitation of coal resources disrupts soil stability, resulting in surface collapse. The occurrence of extensive surface subsidence will result in the devastation of terrestrial vegetation and other valuable resources, posing a significant threat to the regular productivity and livelihood of the local population [1]. At the same time, due to the occupation and destruction of a large area of land, the habitat environment has been destroyed, resulting in the reduction in biodiversity and the disturbance of ecological functions in the mining area. The completion and operation of the Zhaogu Mining Area has benefited the local economy and employment of inhabitants. As a result of prolonged coal mining operations, numerous zones of subsidence have been created within the mine. The coal seam beneath the Zhaogu Mining Area is of greater thickness, leading to a more significant degree of subsidence. Consequently, certain regions have become perpetually flooded, as reported by Xiao W et al. [2]. This has resulted in severe harm to the local land resources. A management model for the subsidence land in the Zhaogu Mining Area is proposed based on the extent of damage caused by subsidence and the conditions of the mine area. This model takes into account the different types of land use and provides technical support and data reference for the comprehensive management of the subsidence area in the Zhaogu Mining Area.
During the initial phase, Chinese researchers mostly integrated remote sensing photos, visually analyzed them, and incorporated them with on-site research to detect and extract areas of coal mine surface subsidence [3,4]. The utilization of optical remote sensing image data, following the processes of image fusion, analysis, interpretation, and field verification, has demonstrated a certain level of efficacy in identifying coal mine subsidence areas. However, this method is primarily effective in detecting surface deformations in large subsidence areas, while identifying smaller deformations proves to be more challenging. With the rapid advancement of radar remote sensing technology in recent years, with no spatiotemporal limitations and high penetration capabilities [5], researchers both domestically and internationally have started utilizing synthetic aperture radar (SAR) data to investigate surface subsidence. Remote sensing technology has led to the advancement and widespread application of advanced InSAR technology in measuring deformation fields related to mining, volcanoes, earthquakes, and glaciers [6]. Carnec and Delacourt [7] employed InSAR technology to measure the surface subsidence of a coal mine in close proximity to Gardanne, France. The observed surface subsidence was found to be closely correlated with the mining activities taking place in that particular coal mine. The progress of the working face is more uniform and aligns closely with the actual measurements taken on the ground. Zhu Jianjun et al. [8] investigated the use of InSAR technology for monitoring surface deformation in coal mines and analyzed the strengths and weaknesses of D-InSAR and Satellite-Based Augmentation System-Interferometric Synthetic Aperture Radar (SBAS-InSAR) technology. Radar remote sensing imagery was utilized as the data source, and SBAS technology was employed to determine the subsidence of the Lengshuijiang mining area. Wang Lei et al. [9] proposed a predictive method for subsidence basins by combining the InSAR technique and genetic algorithm.
Remote sensing photos offer extensive spectrum data and are frequently utilized for land use extraction. A multitude of scholars both domestically and internationally have utilized remote sensing data, including Landsat, MODIS, Sentinel, domestic high-resolution remote sensing data, and environmental satellite data, for the purpose of categorizing land use information [10,11,12,13,14]. With the continuous development of machine learning and the arrival of the big data era, deep learning has been gradually applied to many fields such as computer vision [15,16], communication signal processing [17,18], and natural language processing [19,20] and has achieved many important research results. Various research has shown [21,22] that convolutional neural networks are capable of producing accurate outcomes for the categorization and extraction of remote sensing imageries. Li Wei et al. [23] introduced a feature extractor that utilizes convolutional neural networks to learn distinctive representations from pairs of pixels. They also employed a voting method to refine the classification results. In contrast, Chen Yushi et al. [24] employed a 3D convolutional neural network to directly extract profound spectral-spatial features from unprocessed remote sensing images, resulting in favorable classification outcomes.
The predominant method of coal mining in China is underground mining. Coal mining activities result in the formation of a significant region of subsidence on the surface [25]. In their 2010 study, Zhang Jianwei et al. [26] examined the classification models for coal mining subsidence in Huaibei City, reviewed the current issues with subsidence treatment, and offered a solution. In their 2014 study, Zhang Ruiya et al. [27] proposed four distinct approaches for reclaiming and managing coal mining subsidence deep waterlogging areas. These approaches include comprehensive cultivation, plain reservoir construction, wetland ecological park establishment, and leisure and sightseeing tourism development. The authors developed these modes based on the specific distribution patterns of subsidence waterlogging in China and a thorough analysis of the associated damage characteristics. Xu Guojing et al. [28] suggested developing an all-encompassing fishery management model that combines aquaculture and ecological tourism in the waters of the subsidence area in southern Shandong Province. Zhang Lina et al. [29] proposed a fishery restoration management model that takes into account the existing conditions of the coal mining subsidence area in Jining City.
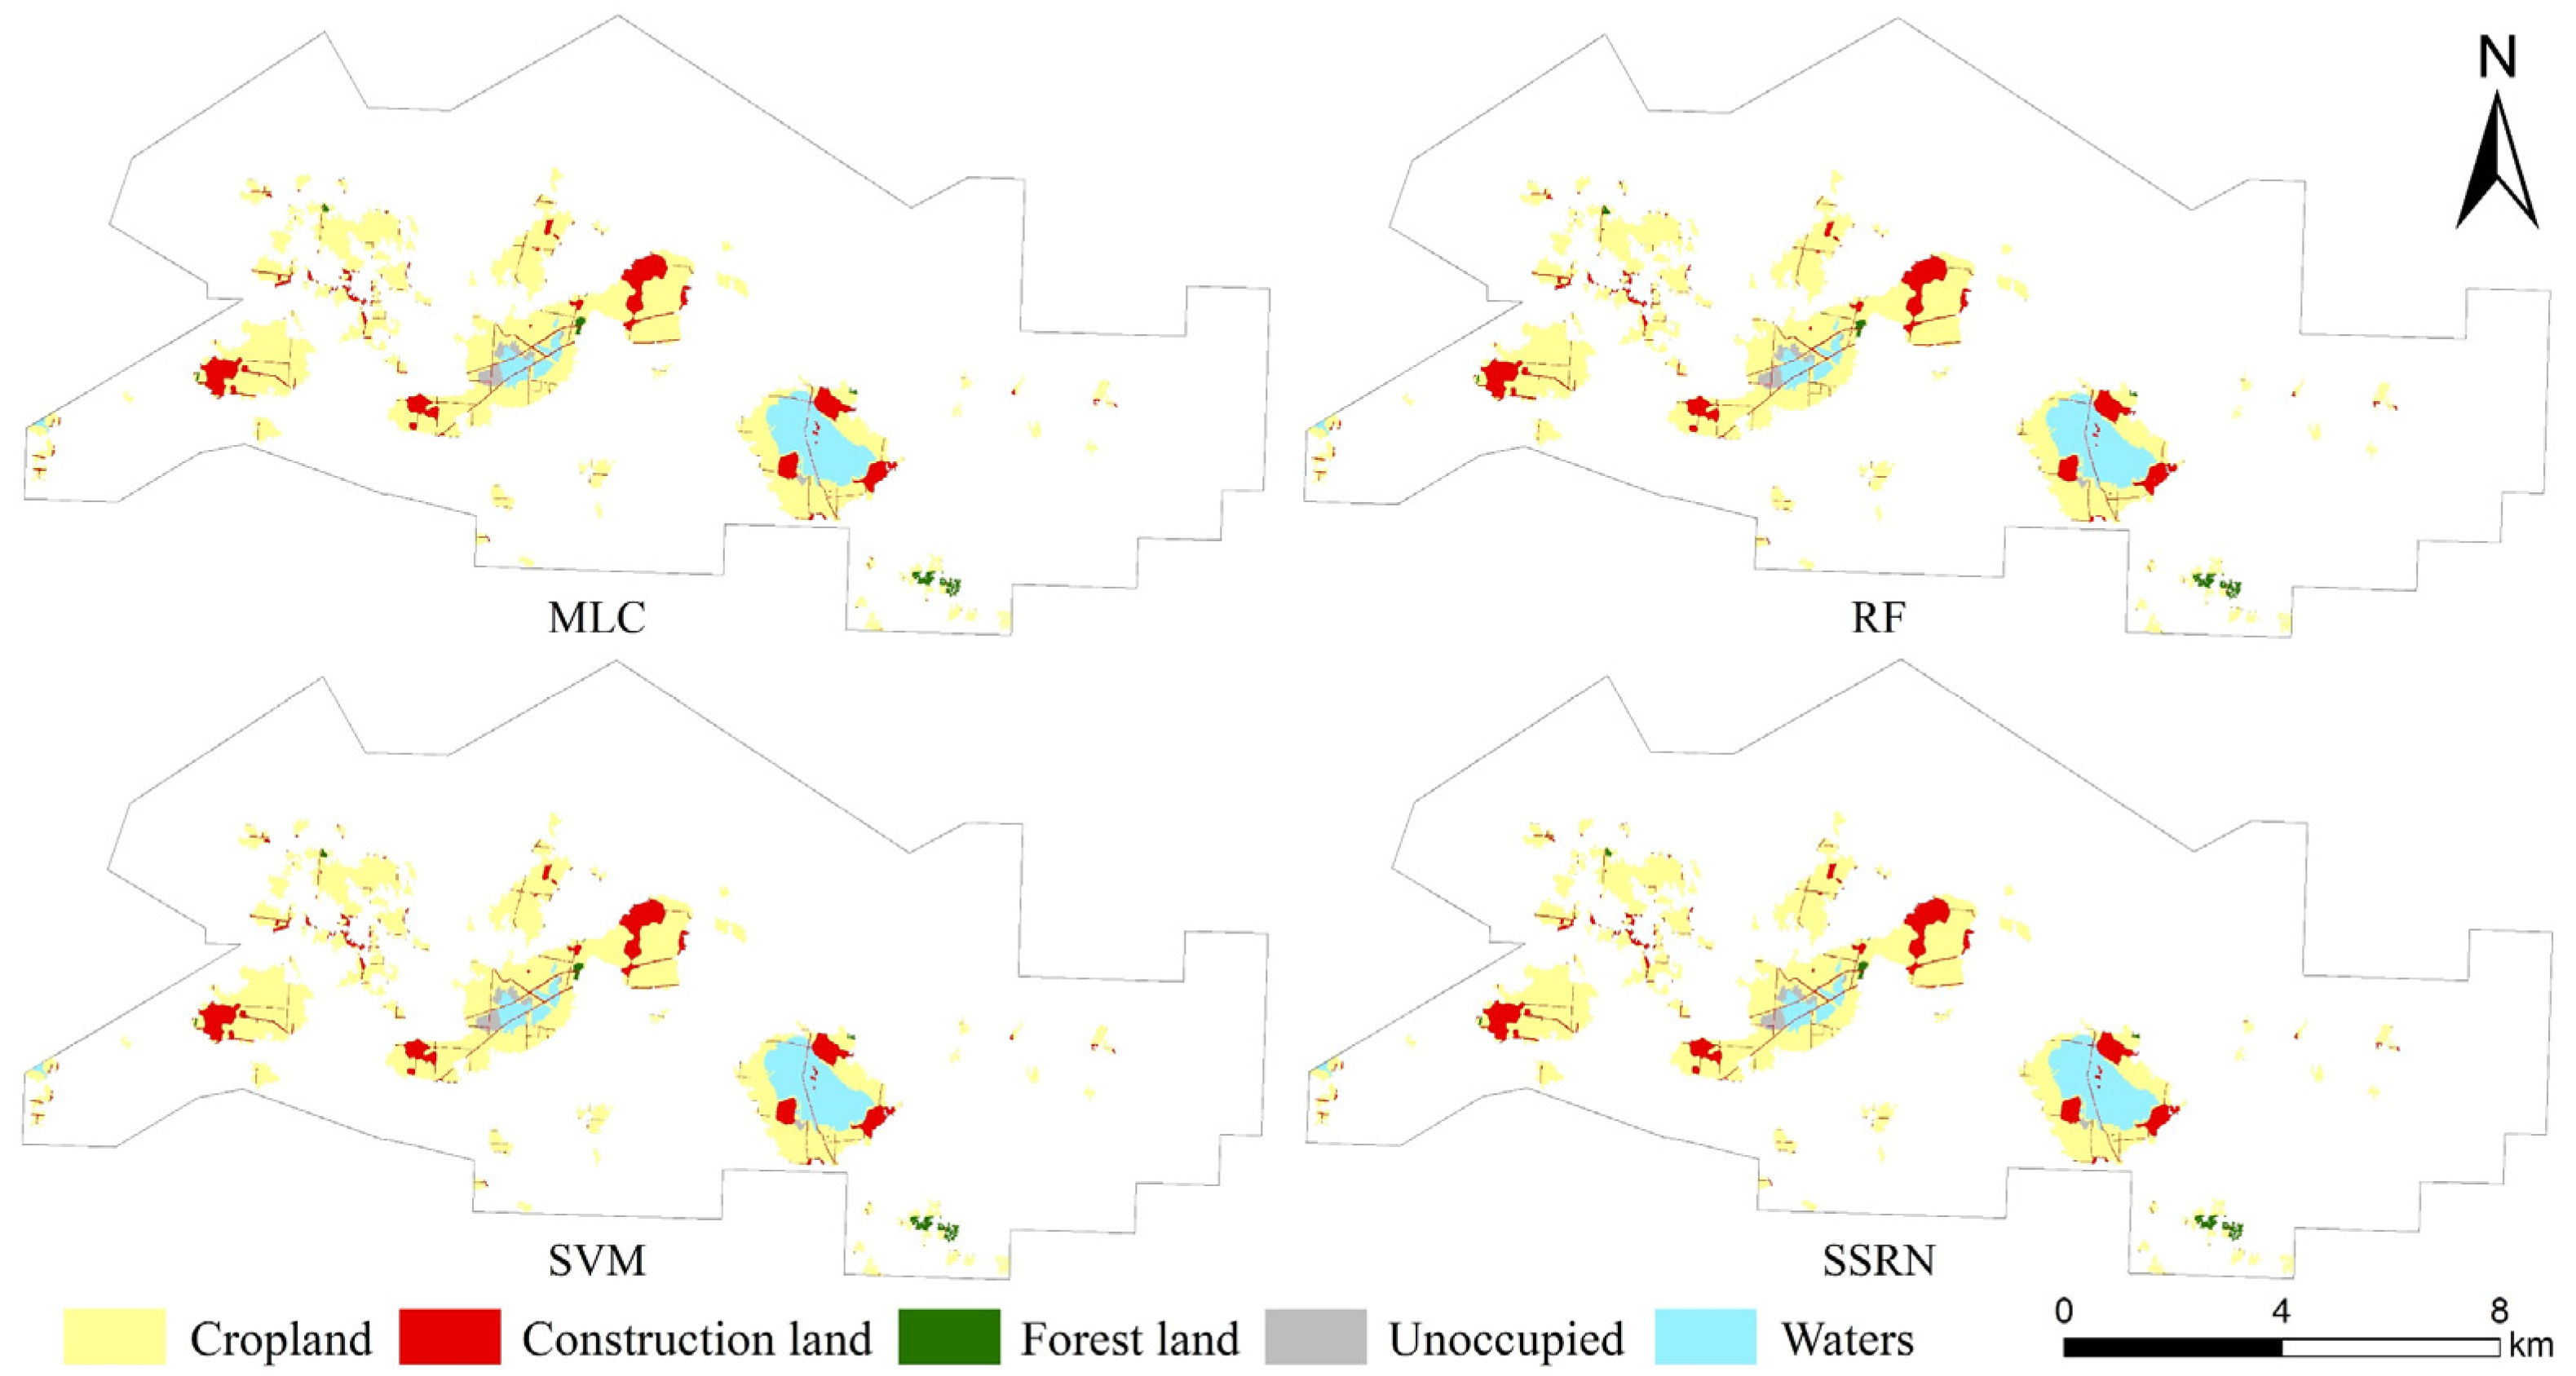
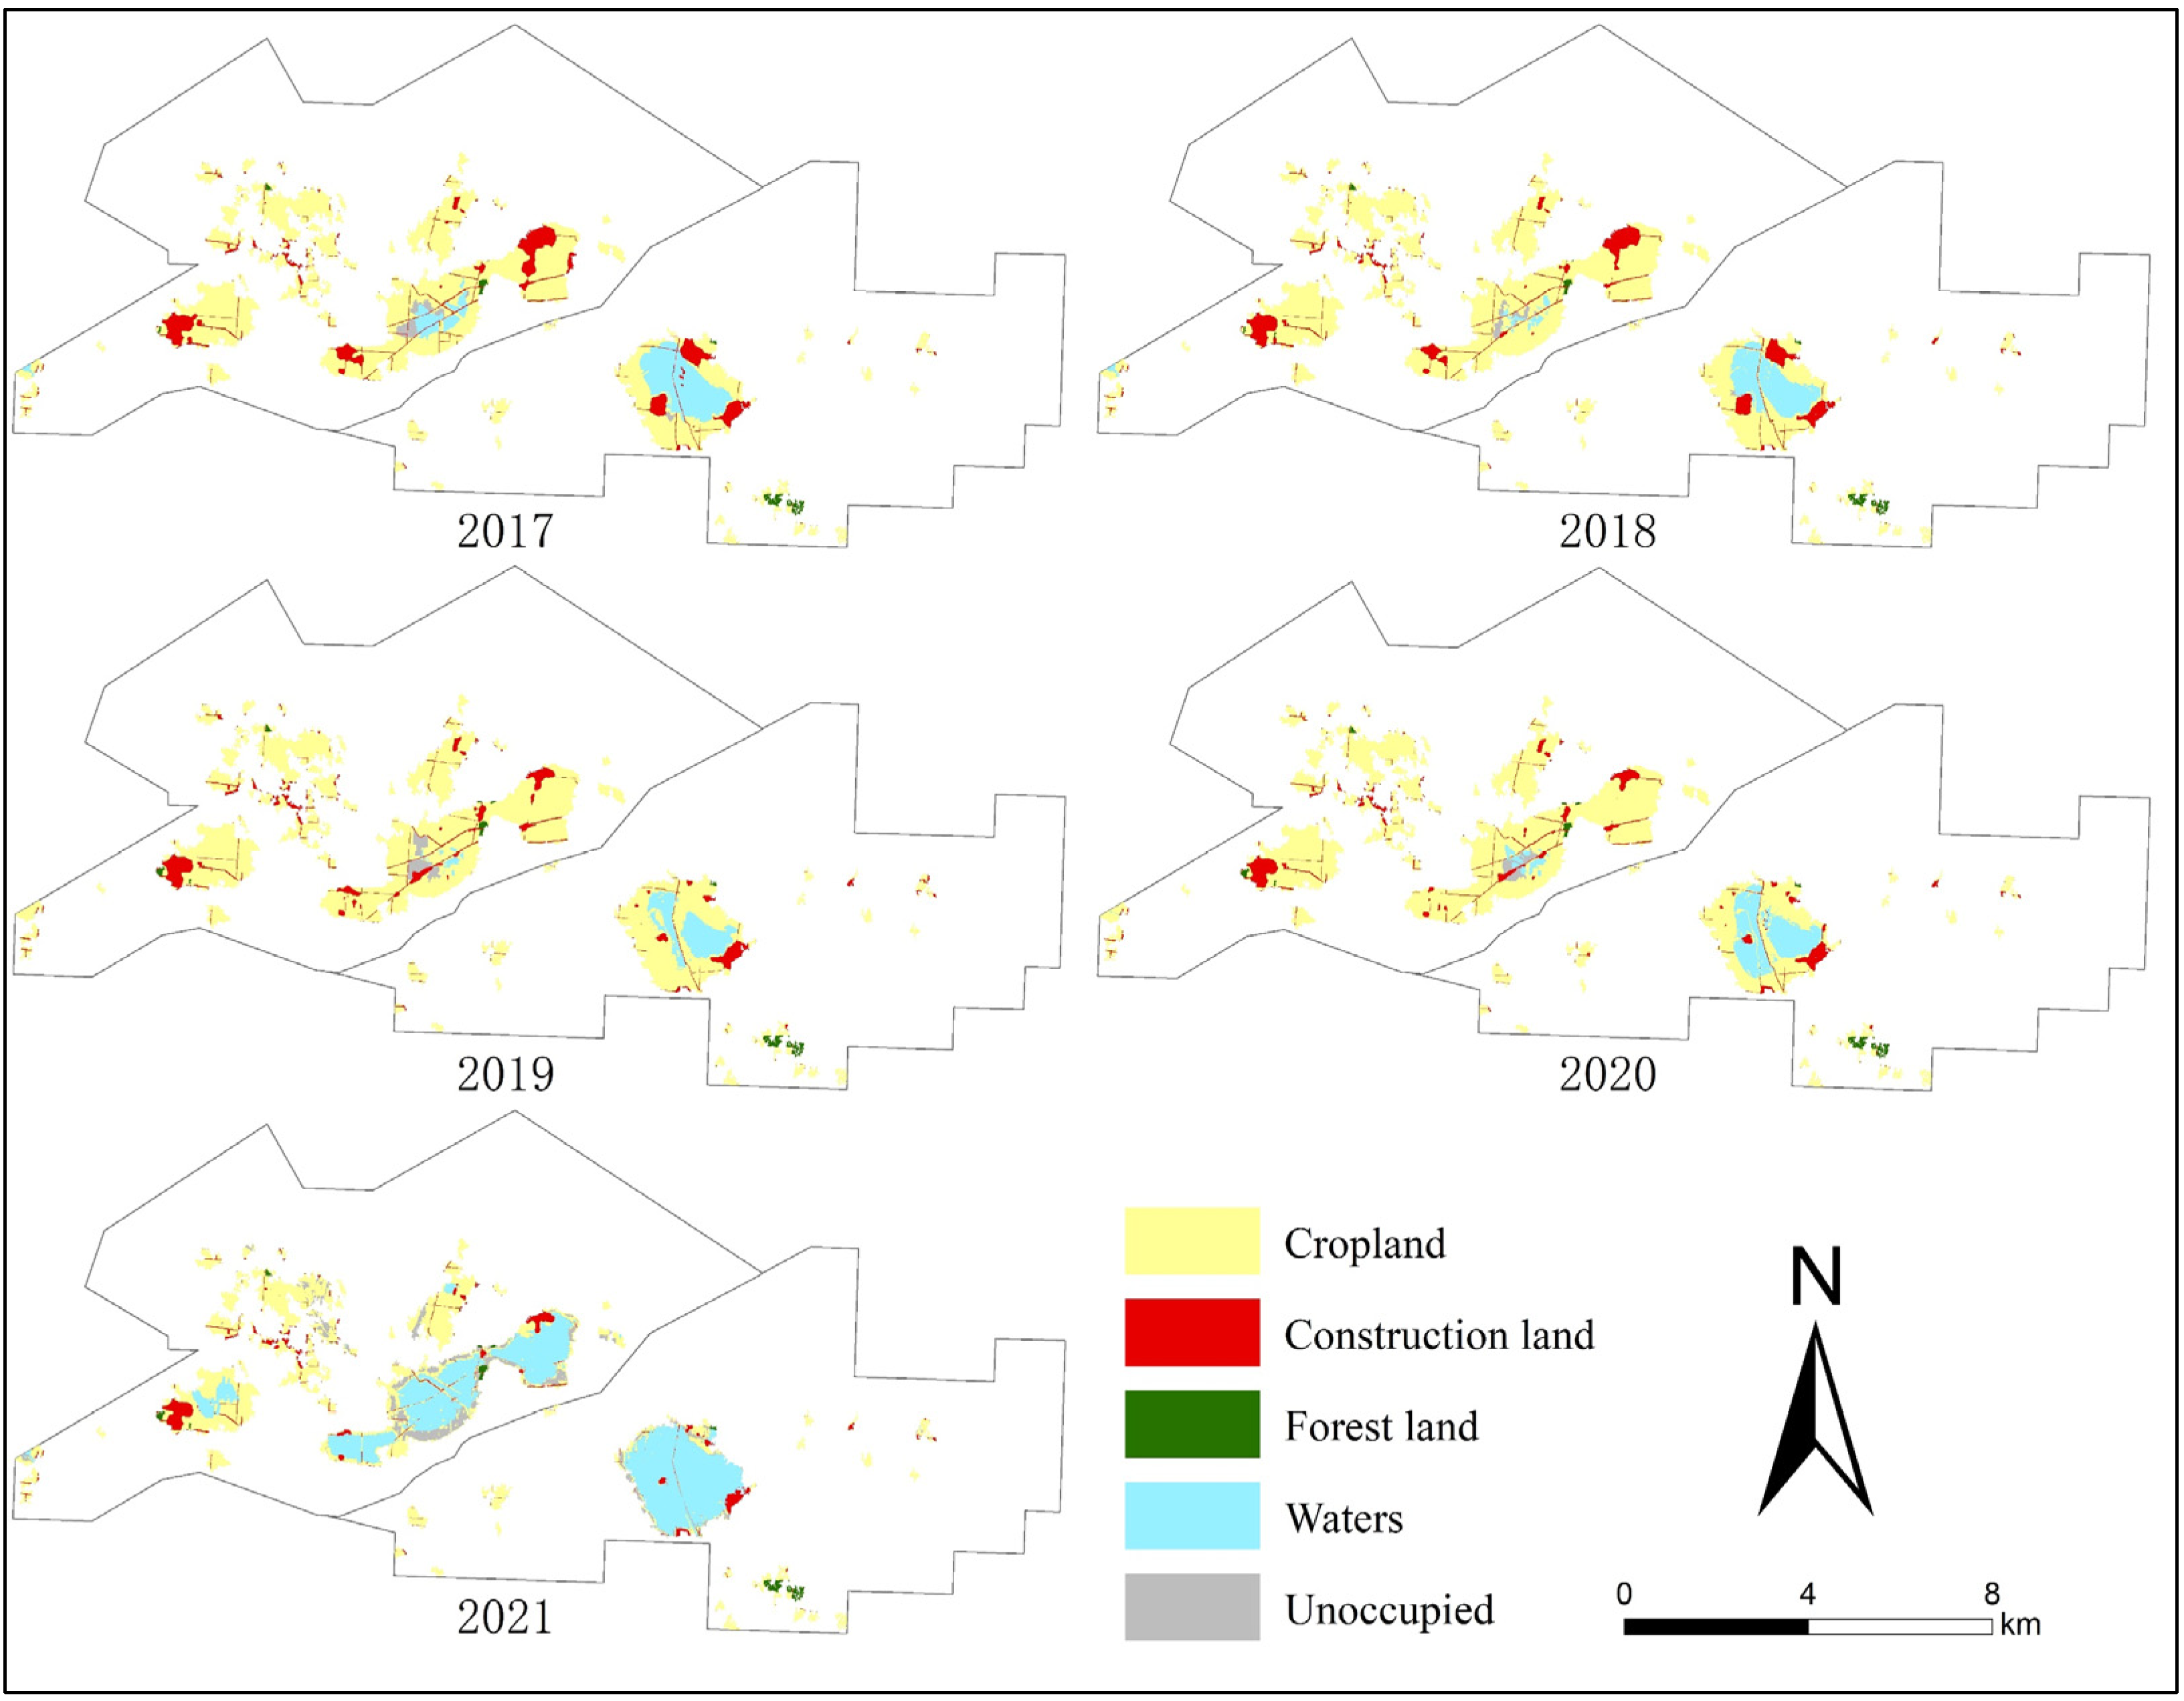
This paper utilizes Sentinel-1 radar images as a data source and applies D-InSAR technology to process the images in order to extract the surface collapse range and collapse depth of the Zhaogu Mining Area. Additionally, it compensates for the lack of continuous-time optical remote sensing images of the study area by using multi-source remote sensing images from Sentinel-2 and GF-1. Furthermore, it constructs SSRN (Spectral-Spatial Residual Network Modeling) with improved classification accuracy. A deep learning model was developed to categorize the land use data in the collapse zone of the research area. Building upon this, a fuzzy comprehensive evaluation model was created using the improved G1 method to accurately assess the extent of land degradation in the collapse zone. Therefore, a governance model specifically designed for the subsidence zone in the study area is suggested. This model aims to offer technical assistance and data resources for the management of the subsidence zone in the Zhaogu Mining Area.

2. Materials and Methods

2.1. Overview of the Study Area

The Zhaogu Mining Area is situated in the southern foothills of the Taihang Mountain, to the east of the Jiaozuo Coal Field. It falls under the administrative jurisdiction of Huixian City, Xinxiang City, Henan Province. The area is home to two coal mines, namely Zhaogu No.1 and Zhaogu No.2. The geographical coordinates are within the range of 113°33′00″ to 113°48′00″ east longitude and 35°22′00″ to 35°28′30″ north latitude, as shown in Figure 1. The research area has a total area of 151.45 km2. Zhaogu No.1 Mine is located at geographical coordinates ranging from 113°33′00″ to 113°44′19″ E and 35°23′00″ to 35°28′30″ N. It covers a total area of 81.66 km2. The construction began on June 19, 2005, and was completed. The cumulative resource reserves amount to 373 million tons, with recoverable reserves totaling 177 million tons. The annual design production capacity stands at 2.4 million tons, and the estimated service life is 56.9 years. The Zhaogu No.2 Mine is located at longitude 113°37′40″~113°48′00″ E and latitude 35°22′00″~35°26′30″ N, covering a total area of 69.79 km2. Construction of the mine began on 9 January 2007, and it was officially completed and put into production on 23 April 2011. The mine has a total resource reserve of 339 million tons, with 140 million tons being recoverable. It has an annual design production capacity of 1.8 million tons and a service life of 55.5 years.

2.2. Data Sources and Preprocessing

The data utilized in this work primarily comprise remote sensing image data, digital elevation model (DEM) data, vector data, and socio-economic data. Remote sensing image data encompass multiple sources of data, such as radar and optical image data. Table 1 displays the fundamental details of the data. The data utilized in this study are the C-band Synthetic Aperture Radar (SAR) data from Sentinel-1, a satellite operated by the European Space Agency (ESA) accessible at https://www.esa.int/, accessed on 10 October 2022. The duration of the revisit is 12 days. Single Look Complex (SLC) data stripping was performed at a resolution of 5 m × 5 m. The Interferometric Wide Swath (IW) has a resolution of 5 m by 20 m. A total of 152 Sentinel-1 photos captured between 1 January 2017 and 30 December 2021 (with a time frame of 1824 days) were selected to extract surface subsidence in the study area. The European Space Agency (ESA) acquired optical remote sensing picture data from satellites such as Sentinel-2 and GF-1, namely the Sentinel-2A and Sentinel-2B, throughout the months of July and August in the years 2017, 2018, 2019, and 2021. Due to the unavailability of Sentinel-2 images on the ESA platform for the research region between July and August 2020, the decision was made to use domestic GF-1 multi-spectral data from July 2020 instead with the resolution being similar to that of Sentinel-2. The data were acquired via the China Centre for Resources Satellite Data and Application, accessible at https://www.cresda.com/, accessed on 10 October 2022. The DEM data, acquired from the United States Geological Survey (USGS) at a resolution of 30 × 30 m, serves as supplemental data for the aim of eliminating the terrain phase in the interferogram.
The data obtained above underwent preprocessing. The vector data coordinate system was uniformly converted to the WGS-84 coordinate system. Baseline estimation and data cropping preprocessing were performed on Sentinel-1A. The open-source plug-in Sen2Cor and SNAP software (v.10.0.0) were utilized to preprocess the Sentinel-2 remote sensing image data for atmospheric, terrain, cirrus corrections, and re-sampling. Additionally, the China Satellites, a homemade remote sensing image plug-in in the ENVI software (v.5.0.3), was employed for the radiometric calibration and atmospheric correction of GF-1.

2.3. Research Methodology

2.3.1. D-InSAR Technology Fundamentals

Differential Interferometric Synthetic Aperture Radar (D-InSAR) is an advanced technique that utilizes different time-phase SAR images of the same area to measure and analyze small ground surface deformations through differential interference. This technology is an extension of InSAR and is used to obtain precise information about ground movements [30]. Differential Interferometric Synthetic Aperture Radar (D-InSAR) employs two-track, three-track, and four-track approaches based on the required number of images. Due to its practicality and widespread use in many applications [31,32], this paper selects the two-track approach of differential interferometry for processing radar data in D-InSAR. This method only requires two radar images. The phase information of the interferogram acquired using the D-InSAR technique can be represented by the following equation for φ :
φ = φ d e f + φ t o p o + φ f l a t + φ a t m + φ n o i s e
where φ d e f indicates that land surface is along the line of sight of the satellite observation (LOS) phase of deformation in this direction; φ t o p o indicates the topographic phase of the target point; φ f l a t indicates the flat earth phase; φ a t m indicates the delayed phase due to atmospheric effect; and φ n o i s e indicates other noise phases.

2.3.2. Spectral-Spatial Residual Network Modeling

The Spectral-Spatial Residual Network (SSRN) is an end-to-end deep learning network. The Spectral Residual block and Spatial Residual block in the network iteratively acquire discriminative features from the spectral and spatial characteristics of multispectral images. SSRN is a supervised deep learning framework designed to address the decline in accuracy of deep learning models. The residual blocks establish a connection with each of the other 3D convolutional layers by identity mapping, which enables the efficient propagation of gradients during backpropagation. Furthermore, Zhong Zilong et al. [33] incorporated batch normalization into every convolutional layer to standardize the learning process and enhance the classification performance of the trained model. This research utilizes a framework that enables the continuous extraction of spectral and spatial information for pixel-level multispectral classification, given that multispectrum is comprised of one spectrum and two spatial dimensions. Figure 2 illustrates the components of the SSRN, which include a spectral feature learning section, a spatial feature learning section, an average pooling layer, and a fully connected layer. The SSRN mitigates the phenomena of accuracy degradation by incorporating jump connections between each alternate layer, so creating a continuous block of residuals in the hierarchical feature representation layer.

2.3.3. Improvement of Fuzzy Comprehensive Evaluation Model of G1 Method

The challenge of rating the importance of indicators can be addressed by using a centralized decision-making approach that takes into account fuzzy opinions, as suggested by Wang Shidong et al. [34]. This work proposes the use of fuzzy opinion centralized decision-making in the G1 technique to address the challenge of unifying opinions on ranking indicators. Additionally, a fuzzy comprehensive assessment model is developed based on the improved G1 approach. The precise procedure for utilizing the enhanced G1 method to ascertain the weights of indicators is outlined below:
Centralized decision-making on the ranking of indicators based on fuzzy opinions, ranking the indicators in the land damage factor in order of importance and consulting a number of experts. Establishment of expert groups M = m (person), expressing m kinds of opinions:
V = { v 1 , v 2 , , v m }
where v i is the I sequence of comments, a certain ordering of the elements in U .
If u is in the k t h position in the i t h opinion v i , then B i ( u ) = n k ;
B ( u ) = i = 1 m B i ( u )
where B ( u ) is the Borda number of u . All elements of the damage factor u can be sorted by the size of the Borda number. This ranking is a more reasonable opinion after pooling the opinions; therefore, the ranking relationship for determining the level of importance of the indicator is
u 1 * > u 2 * > > u m *
The ratio of importance between neighboring indicators u k 1 and u k in the G1 method is r k . Since the Borda number reflects the relative importance between neighboring indicators, a value can be assigned to r k based on the ratio of Borda number of neighboring indicators:
r k = B ( k 1 ) B ( k ) , k = m , m 1 , , 3 , 2
where B k is the Borda number score for the indicator in the first position. The relative importance of the indicators can be calculated based on the ranking among the previous indicators.
If the rational assignment of r k from Equation (5) satisfies r k 1 > 1 r k , then there is
ω m * = [ 1 + k = 2 m i = k m r i ] 1 , ω k 1 * = r k ω k * , k = m , m 1 , , 3 , 2
where ω k * is the weight of the Kth indicator. The weights of the indicators are found according to Equation (6), and the vector of weights of the indicators in the factor set is
W = ( w 1 , w 2 , , w m )
where w 1 is the weight of factor set u 1 * ; w 2 is the weight of factor set u 2 * ; and w m is the weight of factor set u m * .

3. Results

3.1. Analysis of Extraction Results by D-InSAR

3.1.1. Verification of Extraction Accuracy of D-InSAR Technology

Initially, a total of 152 radar images captured by the ESA’s Sentinel-1A satellite between 6 January 2017 and 23 December 2021 were subjected to two-track differential interferometry processing. The primary stages comprise merging image pairs, aligning images, estimating the baseline, generating interferograms, applying filters and calculating coherence, removing the leveled phase and terrain phase, unwrapping the phase, and geocoding. The outliers and incoherent regions of interference data in the study area are processed after the D-InSAR processing stage to obtain the surface deformation of the study area. To validate the precision of the D-InSAR technology’s extraction, 50 elevation sites inside and above the effect range of the goaf in the mining area were chosen for verification based on an examination of the real conditions, as depicted in Figure 3. Utilizing Real-Time Kinematic (RTK) technology, we conducted measurements to quantify the extent of surface subsidence at 50 specific locations over the period from 5 March 2021 to 10 April 2021. Furthermore, the collapse magnitude is compared to the interference outcomes of three sets of interference image pairs (5 March 2021–17 March 2021, 17 March 2021–29 March 2021, 29 March 2021–10 April 2021) in the year 2021, as depicted in Table 2. When choosing leveling points, locations that are not water-logged within the influence range of the goaf are selected due to the presence of water-logged areas in the mining site.
In this paper, root mean square error (RMSE) and determination coefficient (R2) are used as accuracy verification indices to evaluate the accuracy of D-InSAR results. The calculation methods are as follows:
(1) Root Mean Square Error (RMSE): Quantifies the discrepancy between the observed value and the actual value, more sensitive to outliers in the data. Greater measurement precision is achieved with fewer errors. The formula is shown below.
R M S E = i = 1 n ( H i h i ) 2 N
where H i represents the value of the measured data at the leveling point, h i represents the interference result of D-InSAR, N represents the number of level points. According to Equation (8), the data in Table 2 can be calculated as 0.76 cm, with a small error, indicating that the measurement accuracy of D-InSAR technology is high, and the D-InSAR results are consistent with reality.
(2) Determination coefficient (R2): a statistic reflecting the goodness of fit of the model. The correlation between the observed value and the actual value can be obtained more intuitively. The closer R 2 is to 1, the better the regression equation fits. The formula is as follows:
R 2 = 1 i = 1 n ( H i h i ) 2 i = 1 n ( H i h ¯ i ) 2
where H i represents the value of the measured data at the leveling point, hi represents the interference result of D-InSAR, and n represents the number of level points. Based on Equation (9), the data in Table 2 are computed, revealing that R 2 is 0.89, a value close to 1. This indicates that D-InSAR technology has a high level of measurement accuracy, and the findings obtained align well with the actual conditions.

3.1.2. Mining Subsidence Depth Extraction Results

By superimposing the experimental data from phase 152 and isolating the range of collapse in the superimposed results, we can determine the total amount of surface collapse in the research area from 2017 to 2021, as depicted in Figure 4. The findings indicate that the highest degree of surface collapse observed in the study region was 417.77 cm between 2017 and 2021. The areas experiencing significant collapse within the Zhaogu Mining Area are concentrated in the southwestern and central sections of the mine, as well as the southern portion of the Zhaogu No.2 Mine. Additionally, there are clusters of collapse basins located in the central part of the Zhaogu No.1 Mine, as well as the southwestern and southern regions of the Zhaogu No.2 Mine. The subsided depression in the mine is situated above the air-mining zone, and its extent is greater than that of the air-mining region. In the Zhaogu Mining Area, the stratum is thicker than the coal. The mining method used is called multi-layer horizontal mining, where the coal seams are divided into layers based on their levels, and mining is performed layer by layer. This results in a deeper mining area underground. However, when the surface of the mining area collapses beyond a certain depth, the surrounding soil loses its support and collapses downward. As a result, the range of ground surface collapse is larger than the actual mining area.
In the Zhaogu No.1 Mine, the southwestern part of Jitun Township has experienced a collapse with a surface depression of over 350 cm in its central area. The central area of Zhaogu Township forms the largest collapse basin in the mine, with an area of 637.36 hm2. The depth of this collapse area is deeper, ranging from −417.77 cm to −200.00 cm, with the dominant depth being in this range.
The southern section of Beiyunmen Township, located within the Zhaogu No.2 Mine, is experiencing the most severe collapse condition. After applying D-InSAR processing, it was determined that there is no collapse volume within the affected area. This is due to the fact that this specific region is consistently unstable and waterlogged. As a result, it lacks consistency during D-InSAR processing, leading to a complete absence of meaningful results following the D-InSAR processing. Adjacent to the perennial waterlogged area is the periphery of the collapse basin, characterized by a non-waterlogged collapsed region.
Because there is a permanent water body that experiences subsidence in Beiyunmen Town of Zhaogu No. 2 Mine, it is not possible to determine the exact amount of deformation. However, this location is categorized as a subsidence area, and its location is illustrated in Figure 5.

3.1.3. Mining Subsidence Depth Classification

This research aims to provide a more scientific and intuitive understanding of the subsidence in mining areas. To do this, the subsidence region is classified based on the depth of surface deformation in the mining area. The study monitors the subsidence for a duration of five years. The subsidence level is classified based on the degree of surface collapse in the mining area over this period. There are four levels of subsidence: Level I (>300 cm), Level II (200–300 cm), Level III (100–200 cm), and Level IV (0–100 cm). This research classifies the collapse grade of the permanently waterlogged region in collapse basin No. 5 as Level II. Figure 6 shows the collapse classification diagram.
To quantitatively assess the extent of each level of subsidence, the surface area of each level was measured and recorded in Table 3. The data in this table reveal that the mining area has the highest share of Level I sinking area, followed by Level III and II. The fraction of the Level IV subsidence area is the smallest. The Level I subsidence area covers 544.26 hm2, representing 28.94% of the total subsidence area. The Level II subsidence area covers 433.83 hm2, accounting for 23.06% of the total. The Level III subsidence area covers 475.02 hm2, representing 25.25% of the total. Lastly, the Level IV subsidence area covers 427.88 hm2, accounting for 22.75% of the total.
Table 4 presents the statistics regarding the area of each subsidence level in Zhaogu No.1 Mine and Zhaogu No.2 Mine. Overall, the subsidence area and depth of subsidence in Zhaogu No.1 Mine are greater than those in Zhaogu No.2 Mine. The reason for this is twofold. Firstly, the Zhaogu No.1 Mine was completed and commissioned in May 2009, which is earlier than the completion date of the Zhaogu No.2 Mine in April 2011. Secondly, the Zhaogu No.1 Mine has a larger annual design production capacity of 2.4 million tons per annum, compared to the Zhaogu No.2 Mine’s capacity of 1.8 million tons per annum.

3.2. Extraction of Land Use Information on Collapsed Areas

3.2.1. SSRN Extraction Accuracy Verification

To validate the authenticity of SSRN, it was compared to typical machine learning classification models, namely Maximum Likelihood Classification (MLC), Random Forest (RF), and Support Vector Machine (SVM). The aforementioned techniques were employed to categorize the data pertaining to land use within the designated research region in the year 2017, with the outcomes being visually presented in Figure 7.
Overall accuracy (OA), average accuracy (AA), and the Kappa coefficient (Kappa) are utilized as metrics to evaluate the effectiveness of multispectral categorization. Overall Accuracy is the proportion of correctly classified multispectral pixels to the total number of pixels in the test data set. AA stands for the average accuracy across all categories. The Kappa coefficient is a metric utilized to assess the agreement between classification outcomes and the ground truth, which can be employed to quantify the accuracy of classification. This research utilizes OA, AA, and Kappa coefficients to assess the classification accuracy of the SSRN model. The values of OA, AA, and kappa can be computed using the following equations [35]:
O A = s u m ( d i a g ( M ) ) / s u m ( M )
A A = m e a n ( d i a g ( M ) ) / s u m ( M , 2 )
K a p p a = O A ( s u m ( M , 1 ) × s u m ( M , 2 ) ) / ( s u m ( M ) ) 2 1 ( s u m ( M , 1 ) × s u m ( M , 2 ) ) / ( s u m ( M ) ) 2
where d i a g ( M ) R N × 1 is the vector of the diagonal elements of the M, s u m ( ) R 1 represents the sum of all the elements of the matrix, s u m ( , 1 ) R 1 × N represents the sum of the elements of each column, s u m ( , 2 ) R N × 1 represents the sum of the elements in each row, and m e a n ( ) R 1 represents the average of all the elements.
To enhance the precision of the statistical evaluation, the experiment described above was replicated five times, and the final result was determined by calculating the average value. The outcomes are shown in Table 5:
The results demonstrate that the SSRN utilized in this study achieves superior classification accuracy in extracting information from multi-spectral data, as compared to classic machine learning models such as MLC, RF, and SVM.

3.2.2. Results of Land Use Information Extraction in Subsidence Area

The SSRN deep learning model is utilized to classify the land use information in the study area from 2017 to 2021. By doing so, we can obtain the land use information specifically within the collapse area of the study area, as shown in Figure 8. Based on this, we proceed to count the land use information within the collapse area of both the Zhaogu No.1 Mine and Zhaogu No.2 Mine separately.
Figure 9 illustrates that between 2017 and 2021, the subsidence area covered a total of 1880.99 hm2. The primary land use types in this region were cultivated land, built-up land, and water area. Between 2017 and 2020, the cultivated land area in the subsidence area exhibited a consistent pattern, with the cultivated land covering over 70% of the total subsidence area. The yearly fluctuations in built-up land, forest land, water area, and idle land in the subsidence area were minimal, indicating a consistent pattern of stability. During the period of 2020–2021, there were substantial changes in the land use patterns in subsidence areas. These changes are primarily characterized by a major decrease in the area of cultivated land and a notable increase in the areas of water and idle land. The percentage of cultivated land area declined from 79.18% to 42.95%, while the percentage of water area rose from 10.23% to 41.65%. Additionally, the percentage of idle land area climbed from 1.01% to 8.1%. The substantial expansion of the water surface in the subsidence region in 2021 can be primarily attributed to the intense precipitation event that occurred locally between 17 July and 23 July 2021. This event resulted in a rise in groundwater levels, the creation of waterlogged areas, and the conversion of various land types, predominantly arable land, into water bodies. Furthermore, as a consequence of the abundant precipitation in the region, the rainwater effectively removed the surface vegetation in the mining zone, leading to a significant expansion of the idle land area.
Figure 10 shows that the collapse area of Zhaogu No. 1 Mine is 1294.04 hm2, whereas the collapse area of Zhaogu No. 2 Mine is 586.95 hm2. The subsidence areas of Zhaogu No. 1 Mine and Zhaogu No. 2 Mine were relatively unchanged from 2017 to 2020, indicating a consistent and stable pattern. The cultivated land area in the Zhaogu No. 1 Mine subsidence region constitutes over 80% of the total area, while the water area makes up between 1% and 3%. In the Zhaogu No. 2 Mine subsidence area, the cultivated land area accounts for almost 50%, while the water area comprises more than 25%. Due to the presence of both permanent and seasonal waterlogging areas in the mining site, Zhaogu No. 2 Mine experiences more severe waterlogging compared to Zhaogu No. 1 Mine, primarily because of its lower elevation. Consequently, Zhaogu No. 2 Mine is prone to the formation of permanent waterlogged areas, which occupy a larger proportion of the site. During the period of 17 July to 23 July 2021, the subsidence areas of Zhaogu No. 1 Mine and Zhaogu No. 2 Mine experienced significant changes in land use types. These changes are similar to those observed in the subsidence areas of Zhaogu Mine. The main changes include a substantial decrease in cultivated land area and a substantial increase in water and idle land area. Among the two mines, Zhaogu No. 2 Mine has a higher rate of increase in water area (34.89%) compared to Zhaogu No. 1 Mine (28.77%). Additionally, the unused land area is also showing a trend of increase. The rate of idle land expansion in Zhaogu No. 1 Mine (7.57%) exceeds that in Zhaogu No. 2 Mine (4.85%) due to the elevation of groundwater produced by excessive rainfall. The previously non-waterlogged area in the southwest of Jitun Township in Zhaogu No. 1 Mine has now become a permanently waterlogged area, with significant changes in the water coverage.

3.3. Results of the Land Damage Assessment

When choosing indicators for assessing land damage, it is important to thoroughly evaluate the specific conditions of the subsidence area. Indicators that accurately reflect the extent of land damage in the subsidence area should be selected, taking into account the results of on-site assessments. The primary types of collapses in the research area are collapse basins and collapse waterlogging. The waterlogged areas within the collapse zones should be effectively exploited to enhance water utilization efficiency. When assessing the extent of land damage in the non-waterlogged areas within the collapse zone, the first factor to consider should be the index of collapse depth. The land damage evaluation indexes in the Zhaogu Mining Area, as indicated in Table 6, were selected based on the study findings of Li Lei [36] and Xi Baoshun [37].
The land damage evaluation results in the subsidence area were utilized to create a vectorized thematic map using ArcGIS (v.10.6.1), as shown in Figure 11. The land damage in the subsidence area was categorized into three levels: minor damage, moderate damage, and severe damage. The size of every level of damage was quantified and recorded in Table 7. Minor damage refers to a situation where the land has suffered just slight damage that does not significantly impact its normal functioning. Moderate damage refers to a situation where the damage inflicted on the land is more severe and has a significant impact on its overall functionality. Severe damage refers to the significant destruction of land, resulting in the loss of its original functionality.
Table 7 reveals that the waterlogged region within the subsidence zone measures 783.36 hm2, or 41.65% of the total area of the subsidence zone. The extent of land destruction within the collapse zone is mostly characterized by minor and moderate levels, which collectively make up 55.16% of the entire area of the collapse zone. The minor damage region covers 437.67 hm2, which is 23.27% of the subsidence zone. The moderate damage area is 599.85 hm2, accounting for 31.89% of the subsidence zone. The severe damage area covers 60.11 hm2, representing 3.19% of the subsidence zone.
The damage degree of different types of land in subsidence zones is determined by combining the land use information in those areas. Table 8 displays the findings of the classification of damage degree for different types of land in places affected by subsidence. The extent of damage to agricultural land, construction land, and idle land is primarily categorized as mild or moderate, with relatively fewer instances of severe damage.

3.4. Comprehensive Management Model for Collapsed Area

3.4.1. Design of Comprehensive Treatment Scheme for Subsidence Area

(1) Overall design of land reclamation direction scheme
Table 9 provides details on the reclamation plans for the damaged sites within the subsidence area while considering the natural conditions of the subsidence area, economic factors, the degree of difficulty of engineering construction, and the degree of land damage.
(2) Design of comprehensive treatment scheme for subsidence water area
Based on the size, water quality, and where the waterlogged region is located, the area is categorized under intense agriculture, become an ecotourism site, converted into a fish and lotus joint zone, and fishing-photovoltaic complementary. A complete approach for managing subsidence regions is developed by combining natural restoration with artificial intervention.
Deep excavation and shallow padding: In order to fill, stabilize, compact, and level areas that are more than 5 hm2 or have a collapse depth greater than 1 m, deep excavation and shallow padding are performed. This involves terraceing the area, excavating the earth, and then transferring it to the shallower collapse areas.
Aquaculture model with integrated systems: The collapse region of Jitun Township in Zhaogu Yiming has become a waterlogged area with a depth of 1–3 m due to the rising groundwater level caused by the heavy rainfall in 2021. Ponds are dug for fish farming, aquatic plants are planted on top of the water, and fruit trees are planted in the surroundings. The ponds are designed and planned according to the standard of one pond area of 8–10 mu at a depth of 2–3 m and an expanded single pond area of 10–20 mu at a depth of 1–2 m.
Ecotourism: With a water level of 1–3.5 m, a big waterlogged area of 365.34 hm2, and proximity to the city—all of which are areas with intensive human activities—the waterlogged area in Zhaogu Township is an ideal location for a wetland park. A wetland park is an organic hybrid of a wetland and a park, exhibiting both the traits of the former and the qualities of the latter. A massive collapse lake has formed as a result of the water that has collected in the extensive water surface collapse area within Beiyunmen Township, which is 1.5–3 m deep, with even deeper water in the surrounding area. The collapsed sites’ lakes were meticulously planned taking into account the distinct natural and cultural features of the coal mining region, including collapsed waters, mineral springs, and local customs and culture.
Fish and lotus joint zone: Management in locations with standing water depths below 1 m is based on the “fish and lotus joint zone” approach.
Fishing-photovoltaic complementary: “Fishing-photovoltaic complementary” refers to the combination of fishery farming and photovoltaic power generation. In the fish pond above the water surface of the photovoltaic panel array, photovoltaic panels below the waters can be used for fish and shrimp farming, the formation of the new “on the power generation, under the fish” power generation model.

3.4.2. Comprehensive Management Planning for Collapsed Areas

The management model designed for the comprehensive management of the coal mining subsidence area in Zhaogu Mining Area indicates the following results: the village relocation area in the non-waterlogged region of the subsidence area is 72.11 hm2; the road rehabilitation area covers 39.83 hm2; there is a potential for reclaiming 1178.75 hm2as cropland; 74.68 hm2 can be reclaimed as woodland; and an additional 74.68 hm2 can be reclaimed as forestland. The extent of excavation in the “digging deep” region is 235.24 hm2, whereas the extent of filling in the “shallow padding“ area is 267 hm2. A total of 783.36 hm2 of the waterlogged area in the subsidence area will undergo treatment. After the treatment, the water utilization area in the waterlogged area will be reduced to 516.36 hm2. Out of this, 130.51 hm2 will be allocated for integrated farming, another 130.51 hm2 for ecological farming, and the remaining 130.51 hm2 will also be used for ecological farming. The area for eco-tourism is 144.27 hm2, the area for the fish and lotus joint zone is 96.27 hm2, and the area for the fishery-photovoltaic park is 145.31 hm2. The management plan for the collapsed region is presented in Figure 12. Annually, this plan can yield direct and indirect economic advantages and ecological and social benefits to the Zhaogu Mining Area. Additionally, it can serve as a valuable reference for future management of subsidence areas.

4. Discussion

(1) Subsidence depth extraction based on D-InSAR technique
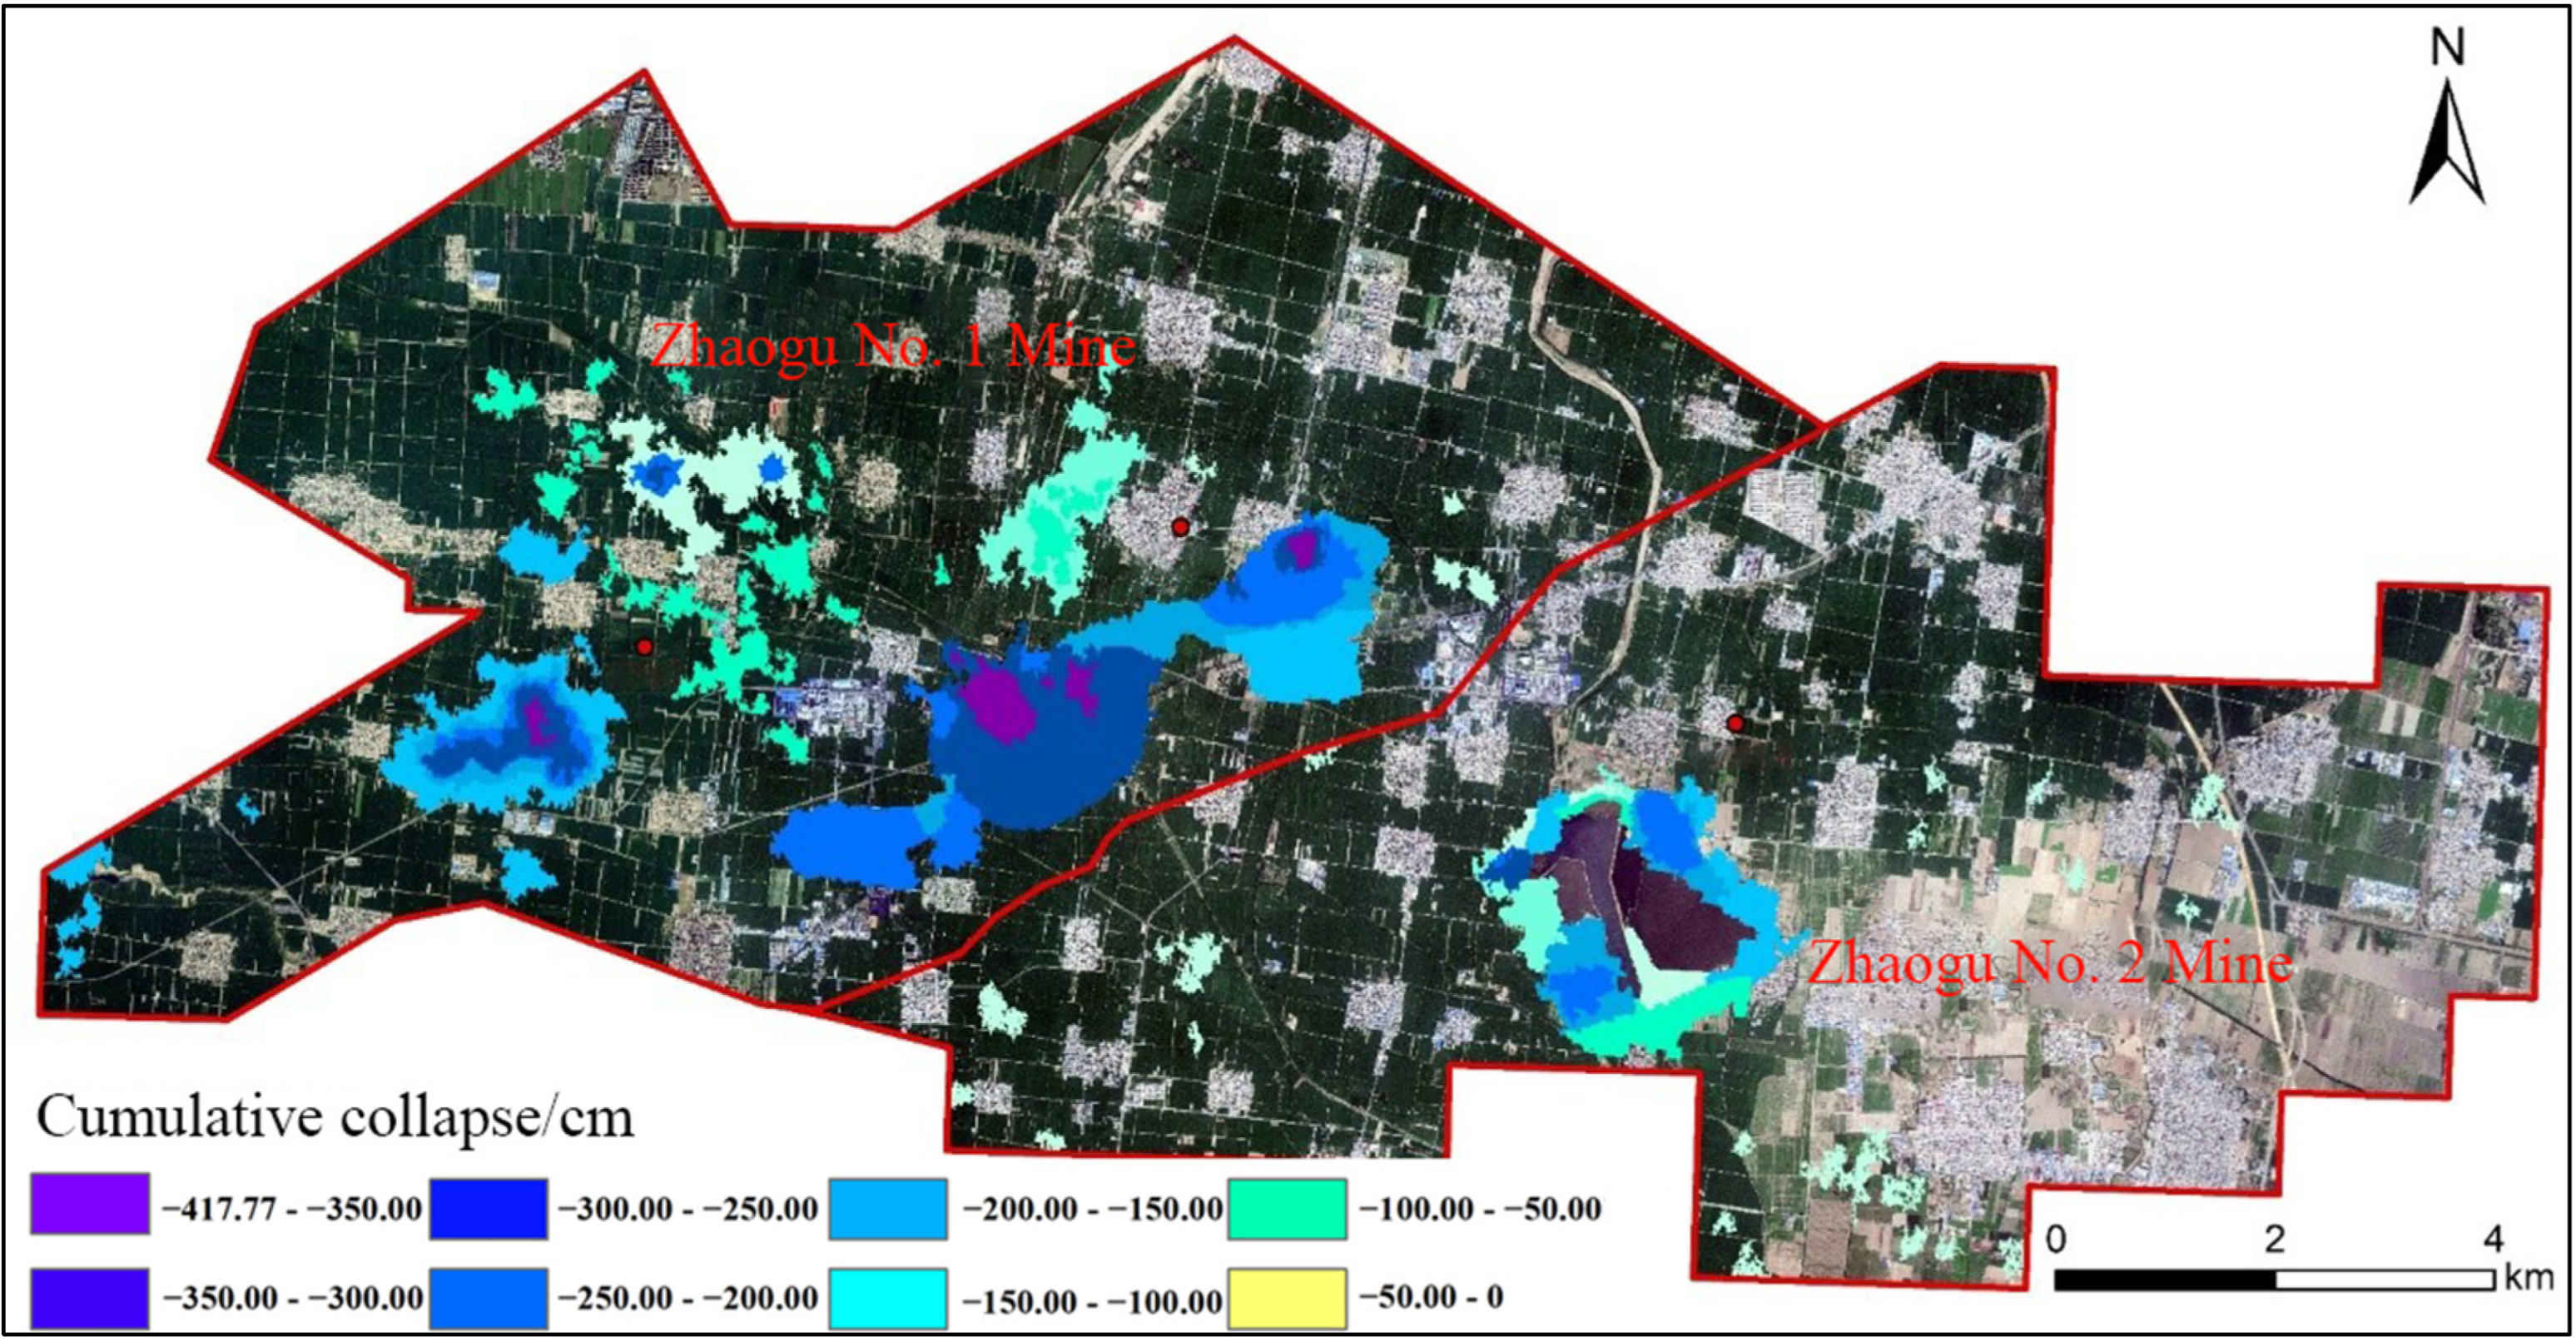
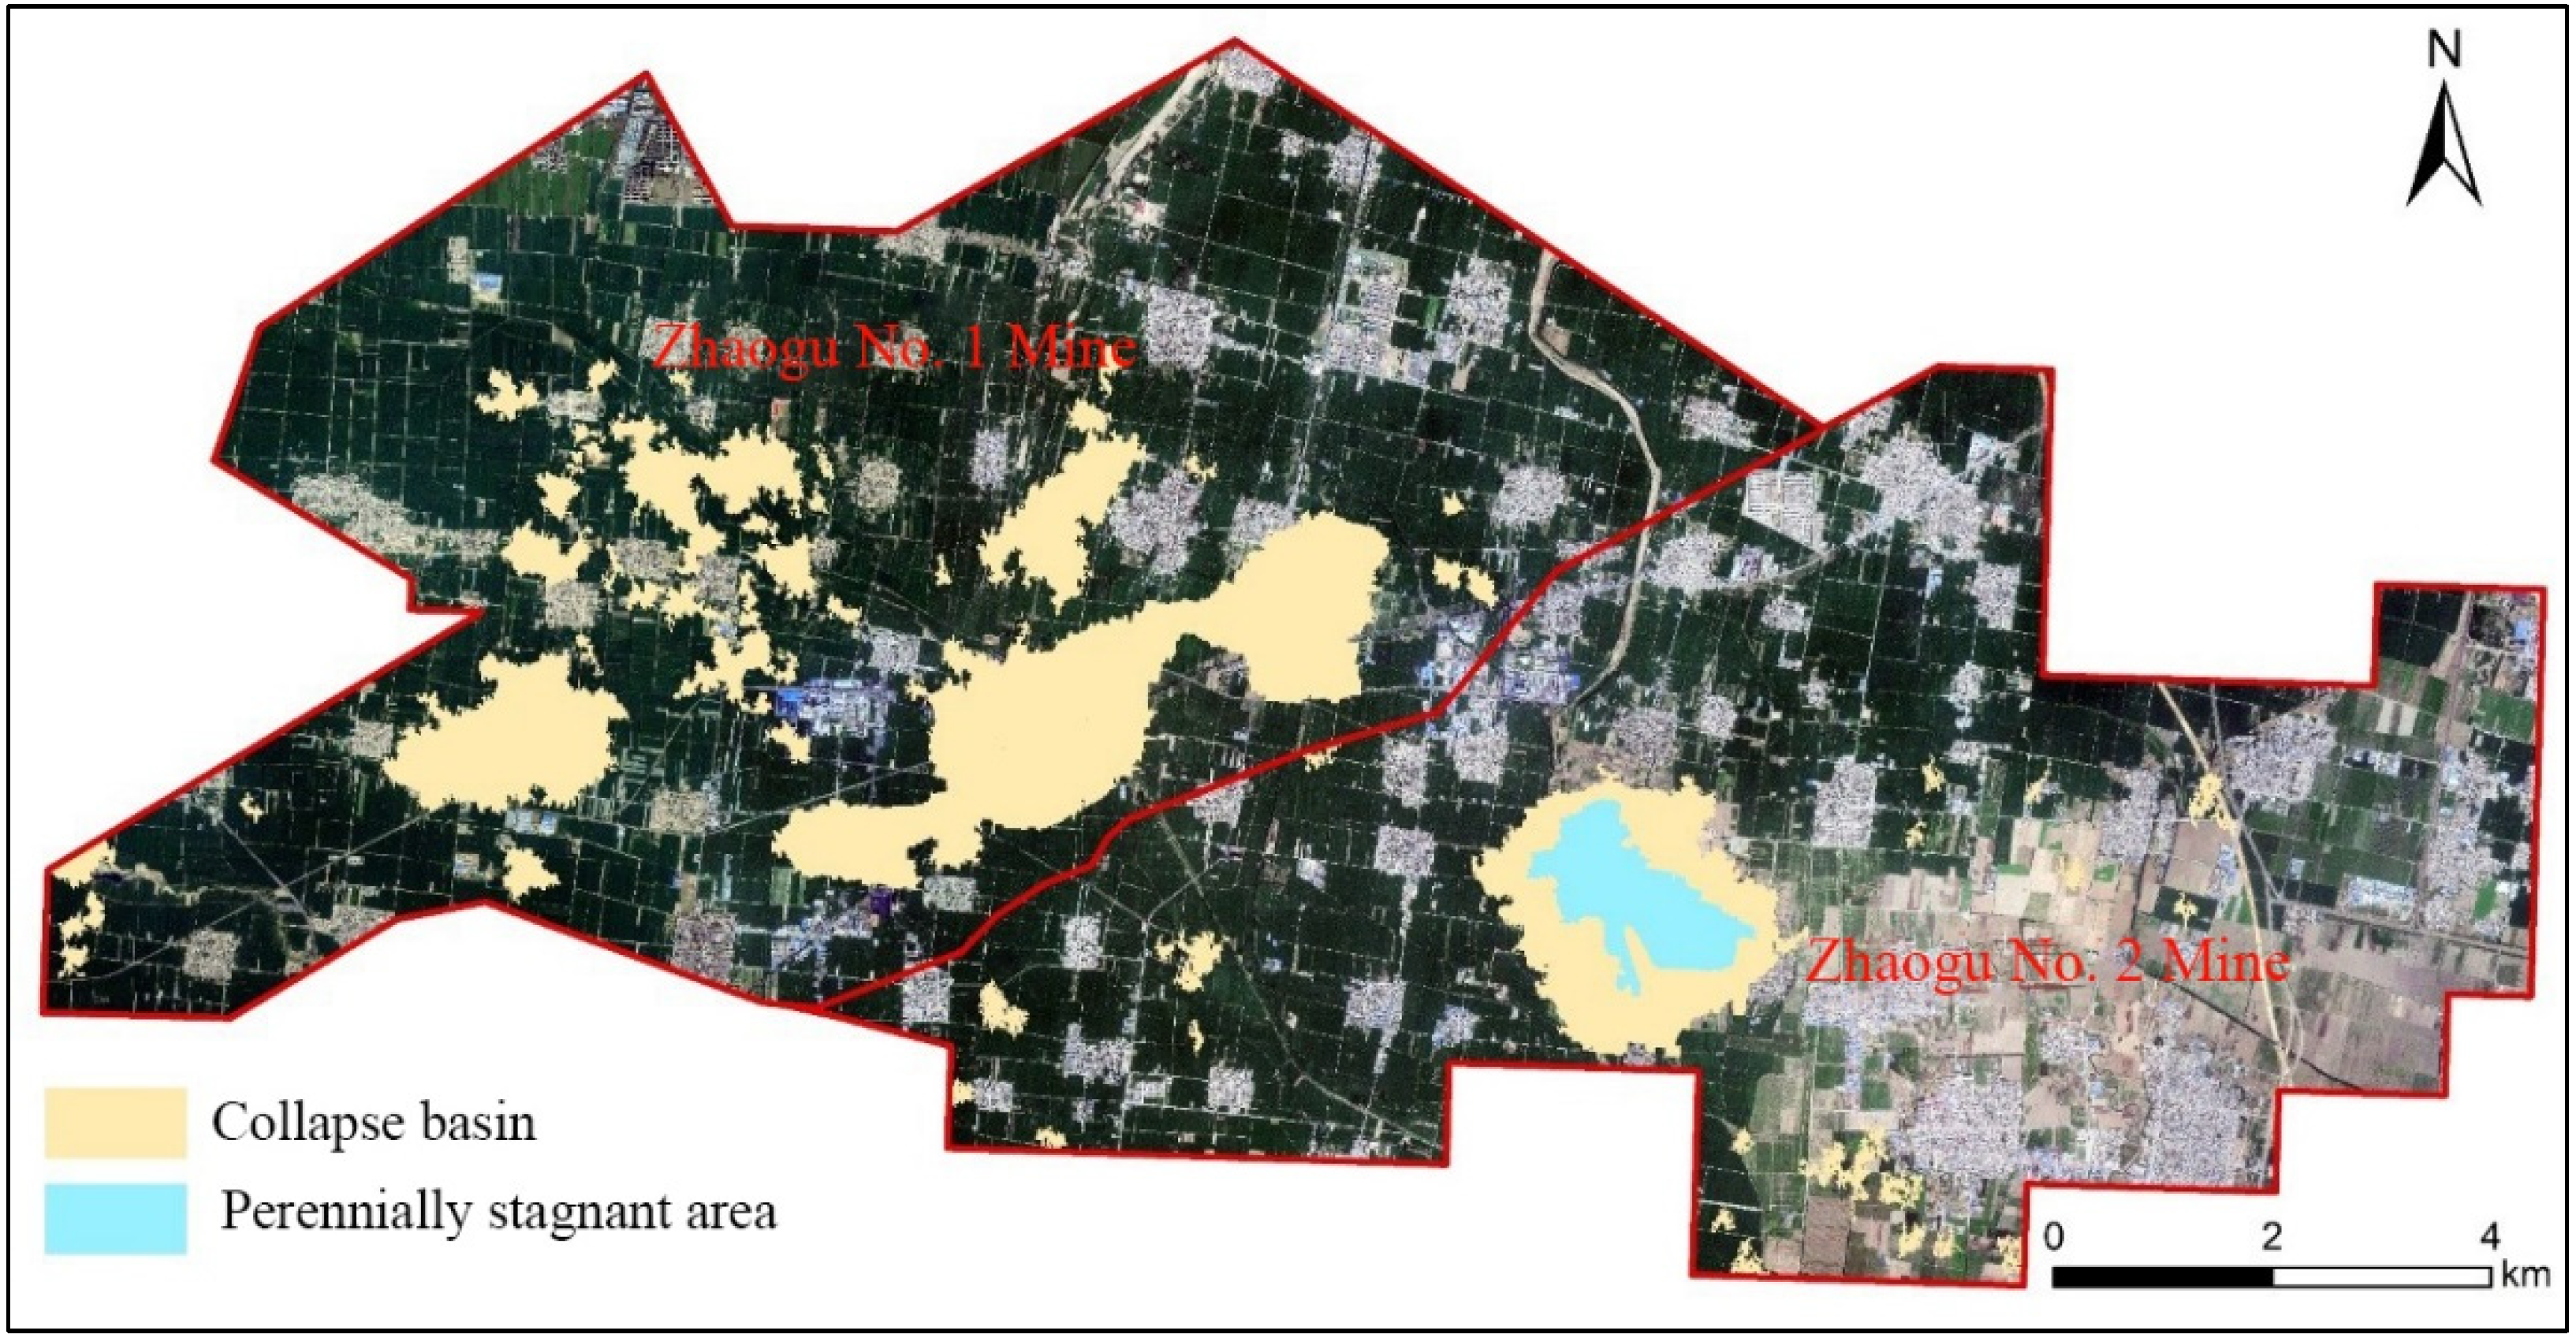
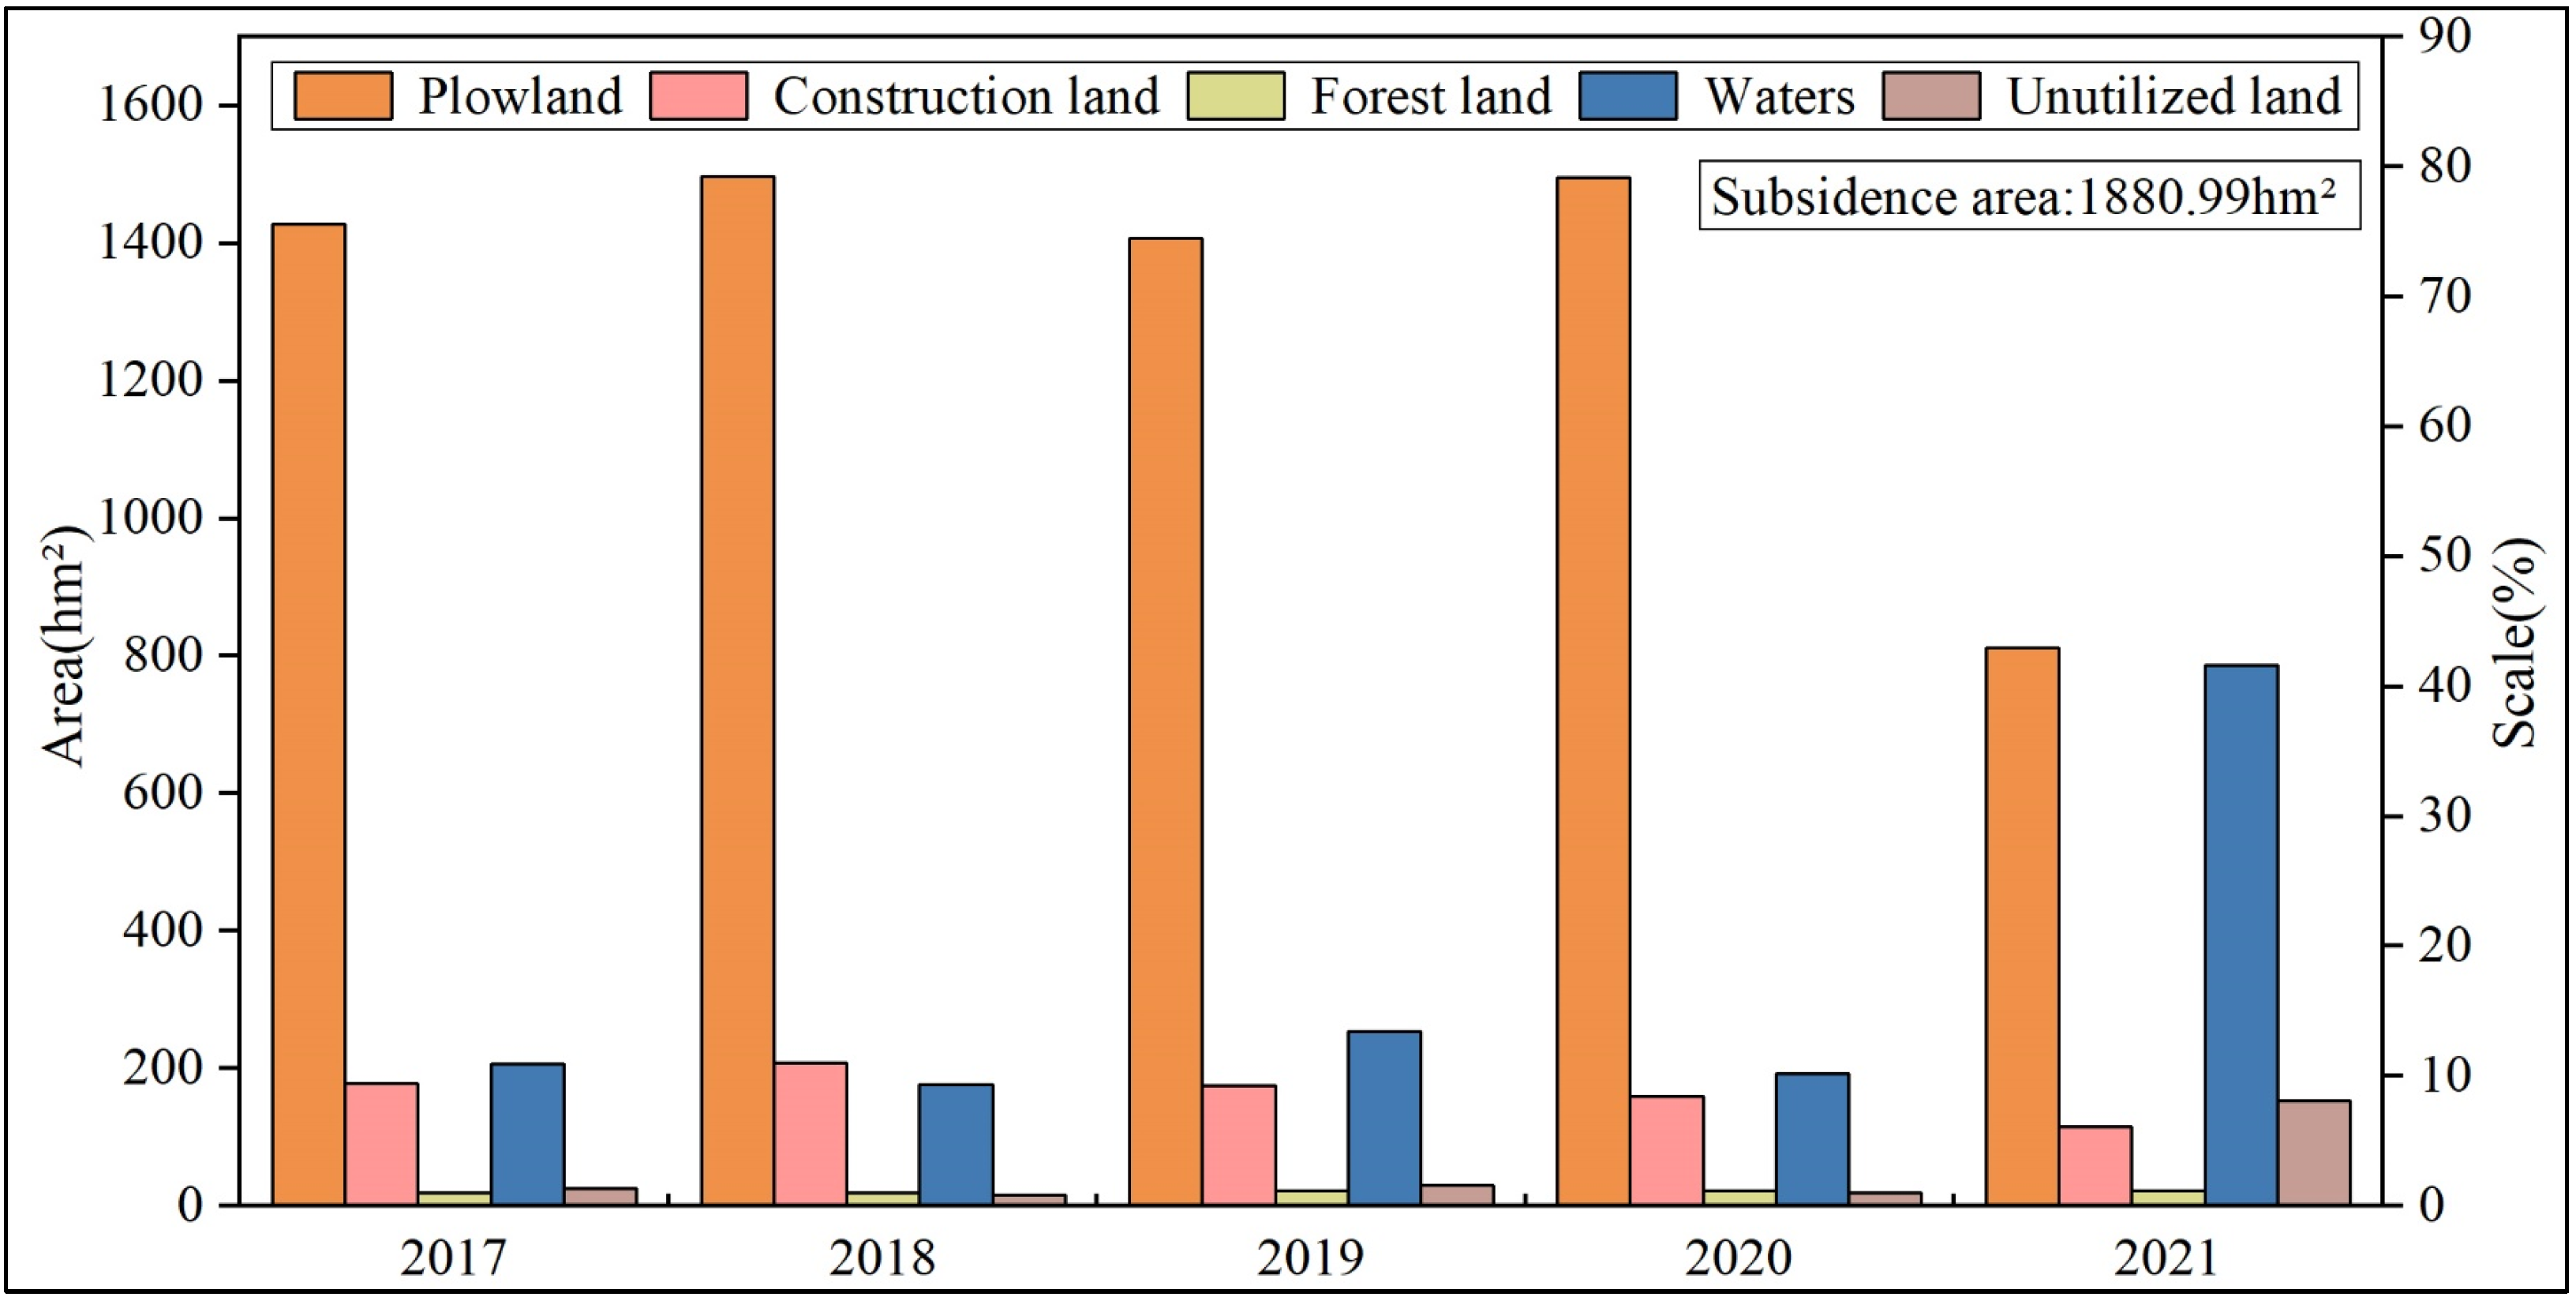
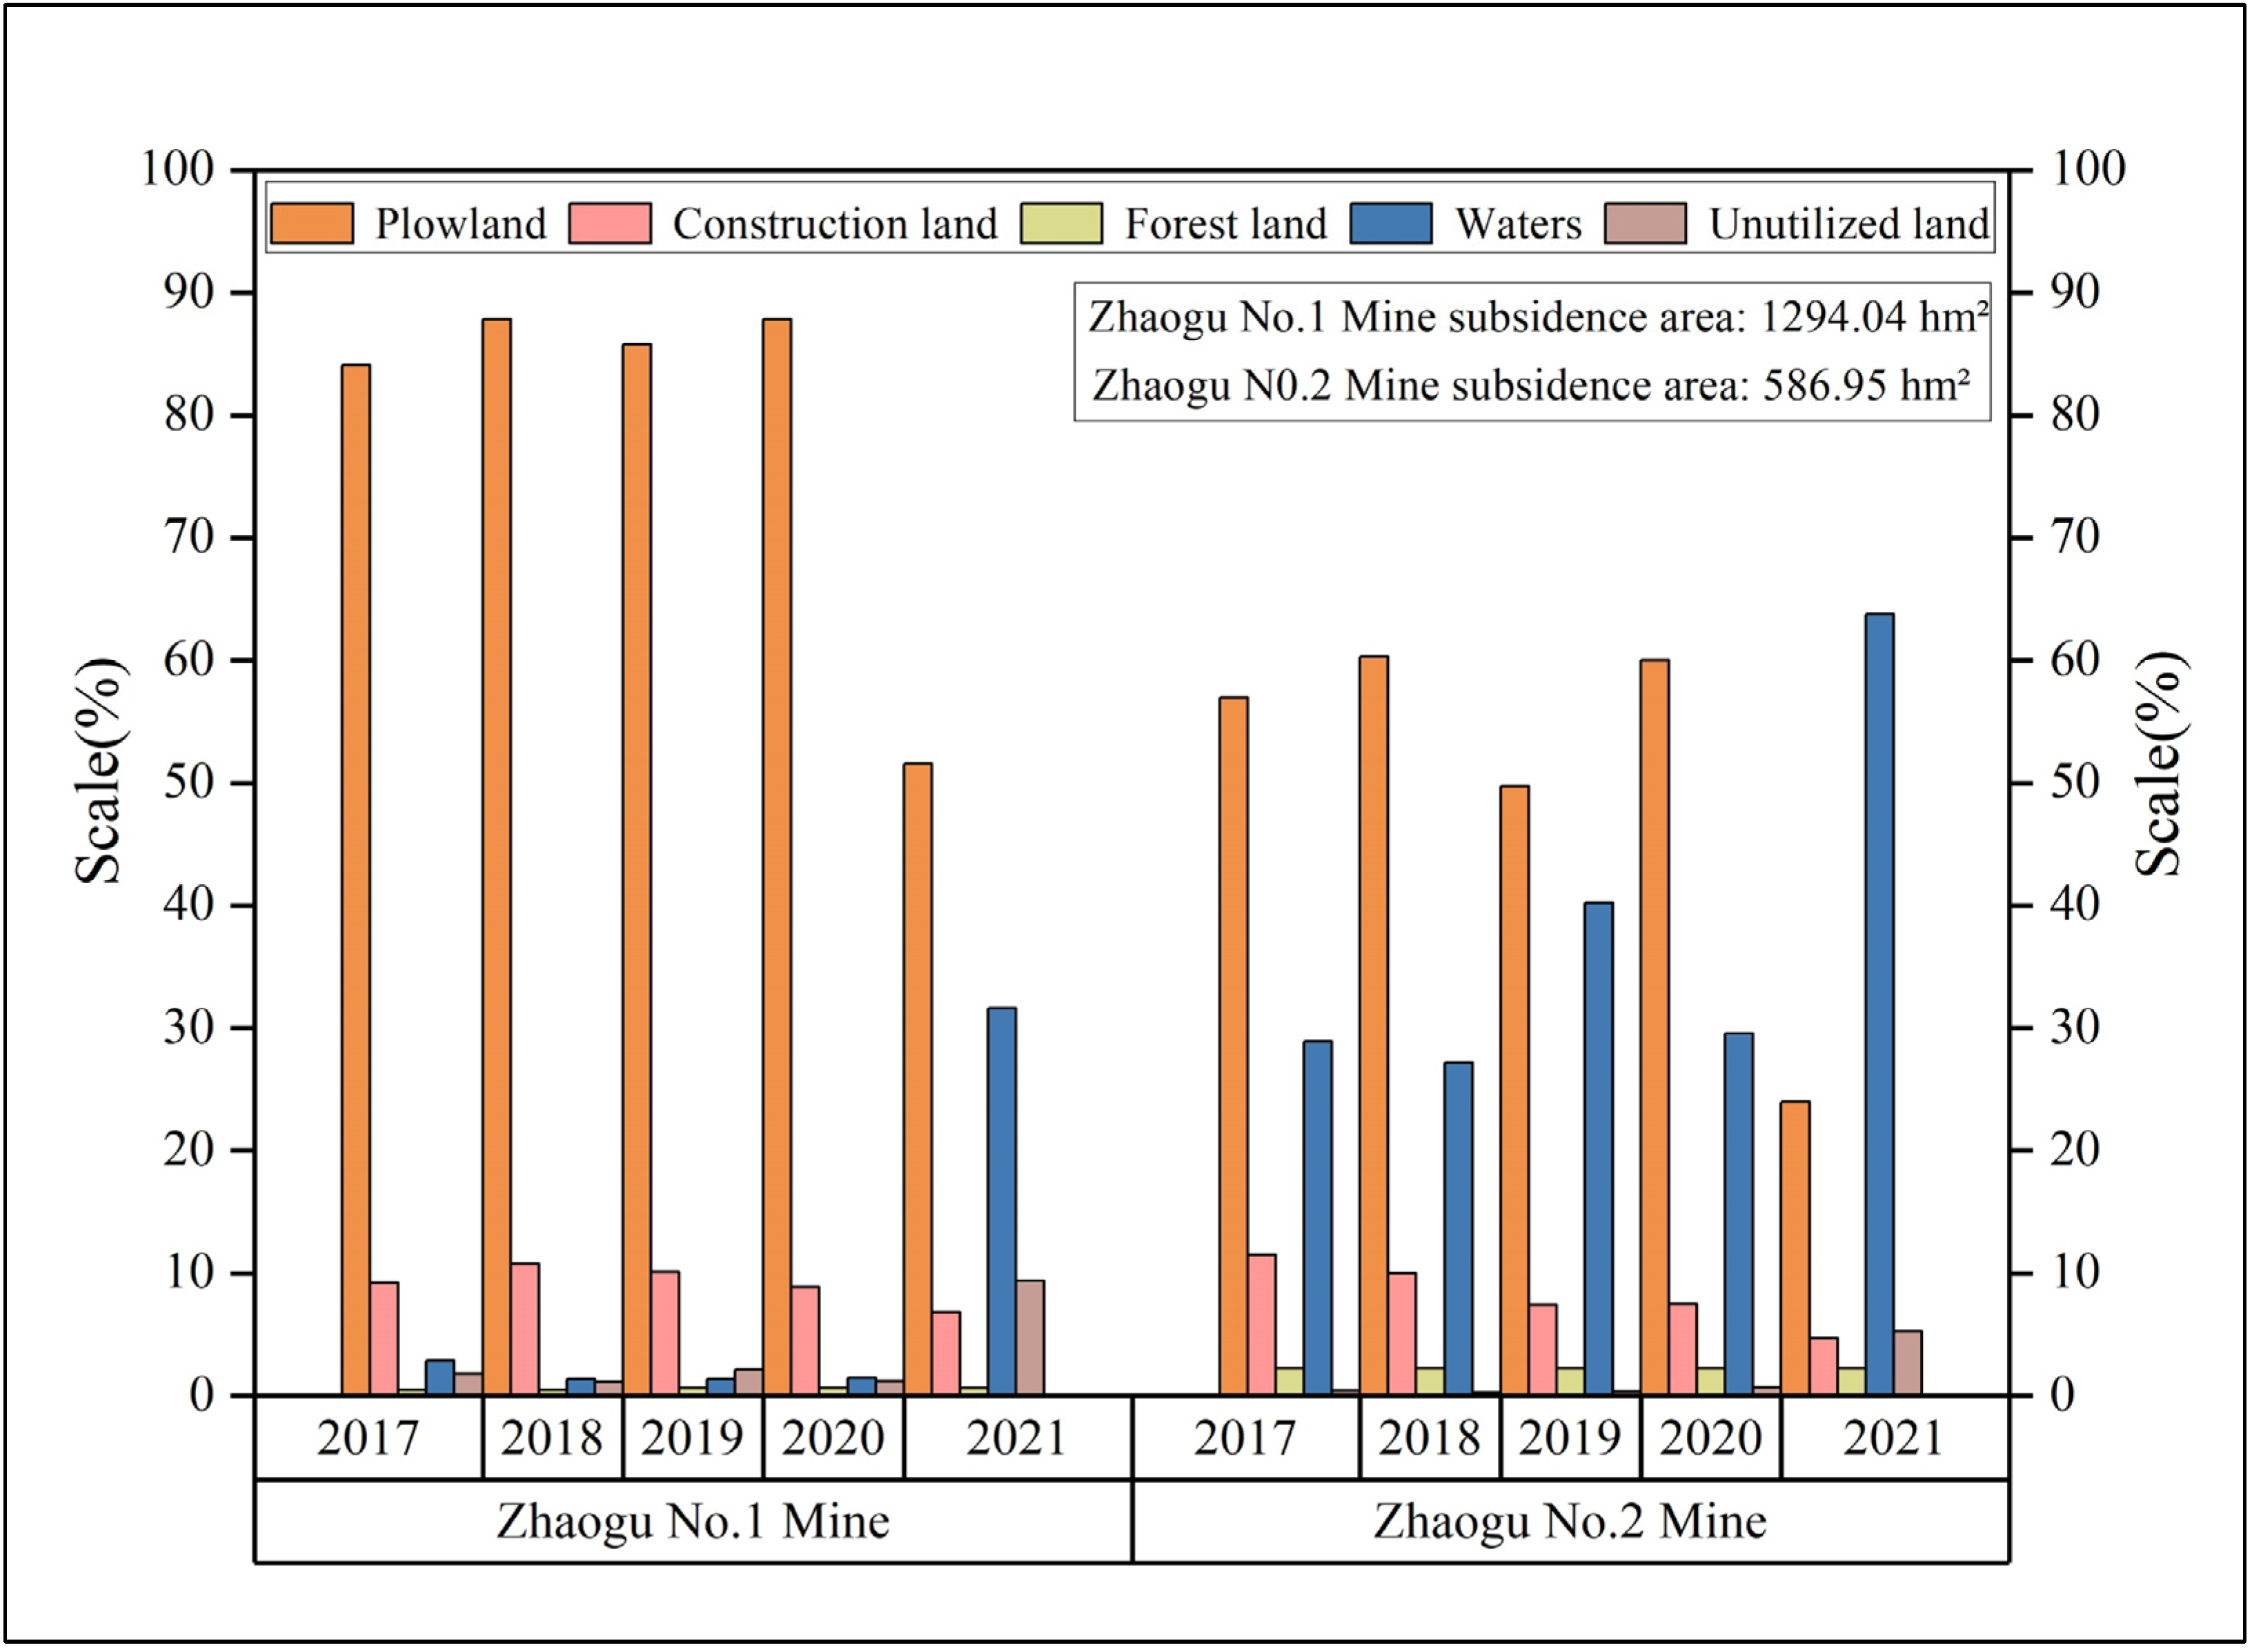
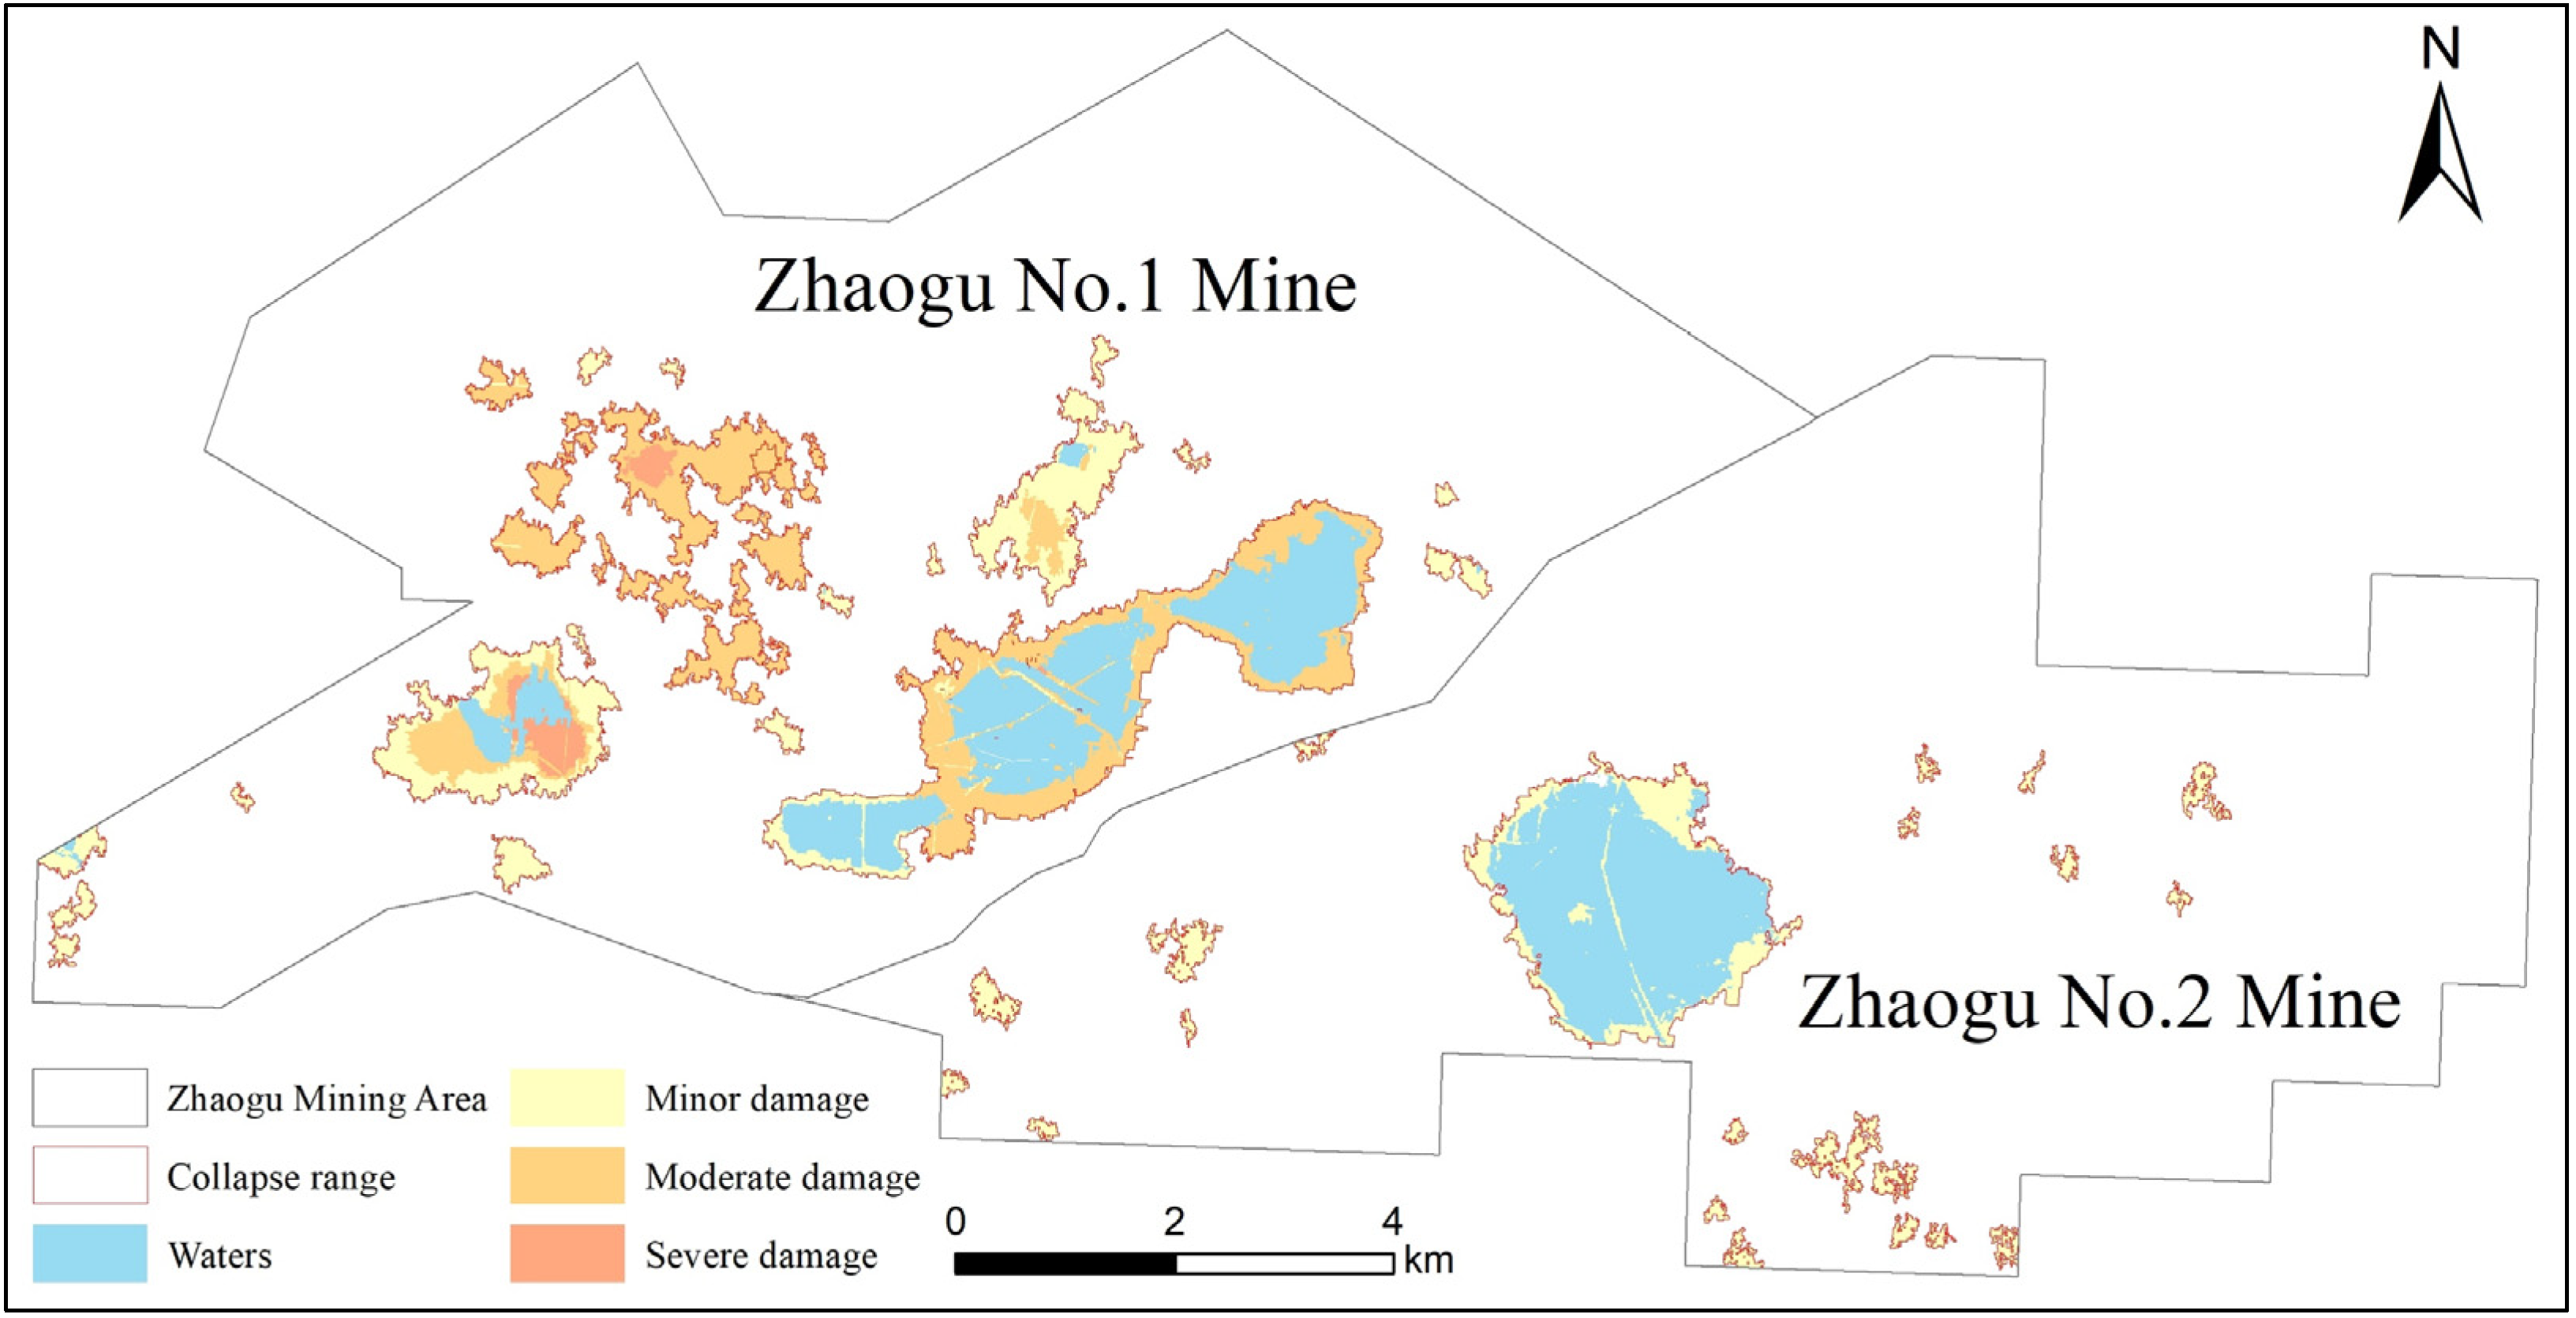
In this paper, the cumulative surface collapse volume in the study area from 2017 to 2021 was extracted based on D-InSAR technology, and it was found that the maximum collapse volume was mainly concentrated in the southwestern and central part of the Zhaogu Mining Area and the southern part of the Zhaogu No. 2 Mine. Collapse basins occur in the central part of Zhaogu No.1 Mine and the southwestern and southern parts of Zhaogu No.2 Mine, and their extent exceeds that of the extraction zone. In particular, the collapse volume in the southwestern part of Jitun Township of Zhaogu No.1 Mine is also large, and the largest collapse basin is formed in the central part of Zhaogu Township. The southern part of Beiyunmen Township in Zhaogu No.2 Mine has the most serious collapse, in which the perennial collapse water accumulation area is out of coherence in D-InSAR processing, and the collapse volume cannot be obtained, considering that the scope of the collapse basin is usually larger than the scope of the air-mining area, especially in the multilayered horizontal mining method. Combined with the field surveys and research, it is possible to delineate all of these water accumulation areas and a certain range of areas around them as the collapse zone, but for these collapse zones, follow-up monitoring should be strengthened to observe the changes, especially the changes in water level and geological structure. In addition to this, this paper has certain advantages based on D-InSAR technology to extract the depth of collapse in the Zhaogu Mining Area. D-InSAR technology has the advantages of high spatial resolution, all-day, large coverage area, low cost, etc., which is especially suitable for large-area and rapid surface deformation monitoring. It fills the gap of traditional level measurement and GPS measurement technology, can monitor and record the cave-in process in the mine area in real time, and is more suitable for the 2017–2021 cave-in depth monitoring study of the Zhaogu Mining Area carried out in this paper, so as to provide an important indicator for the subsequent assessment of the degree of ecological environment damage in the mine area.
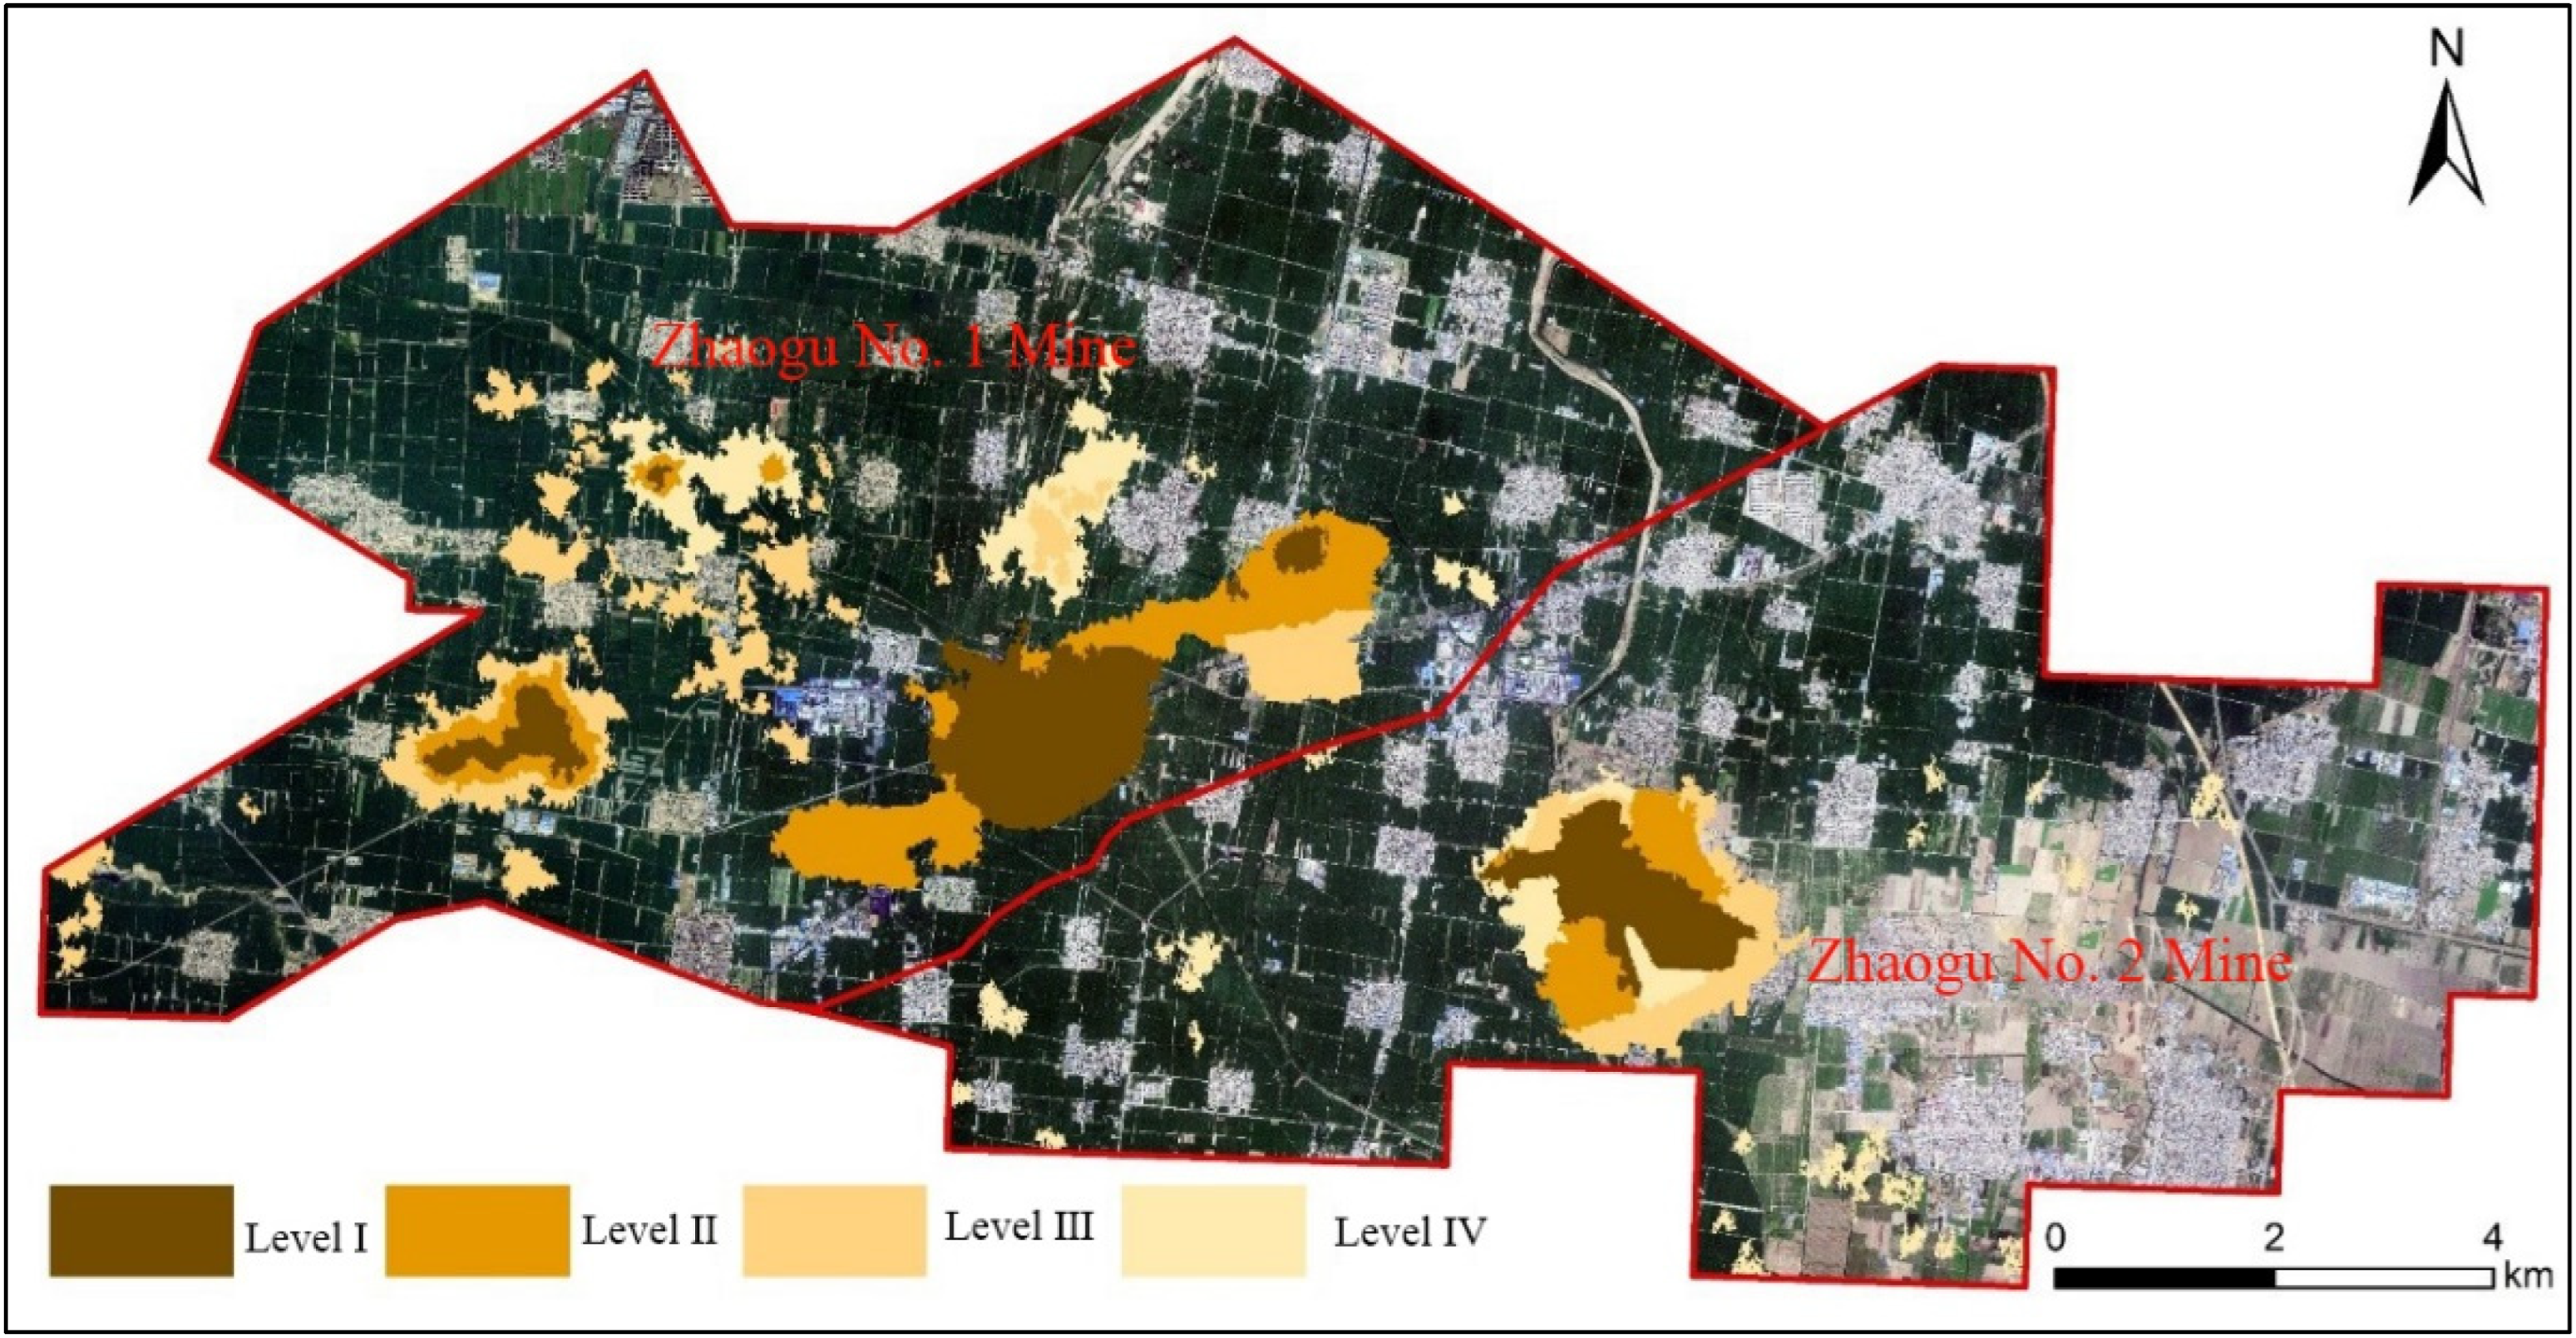
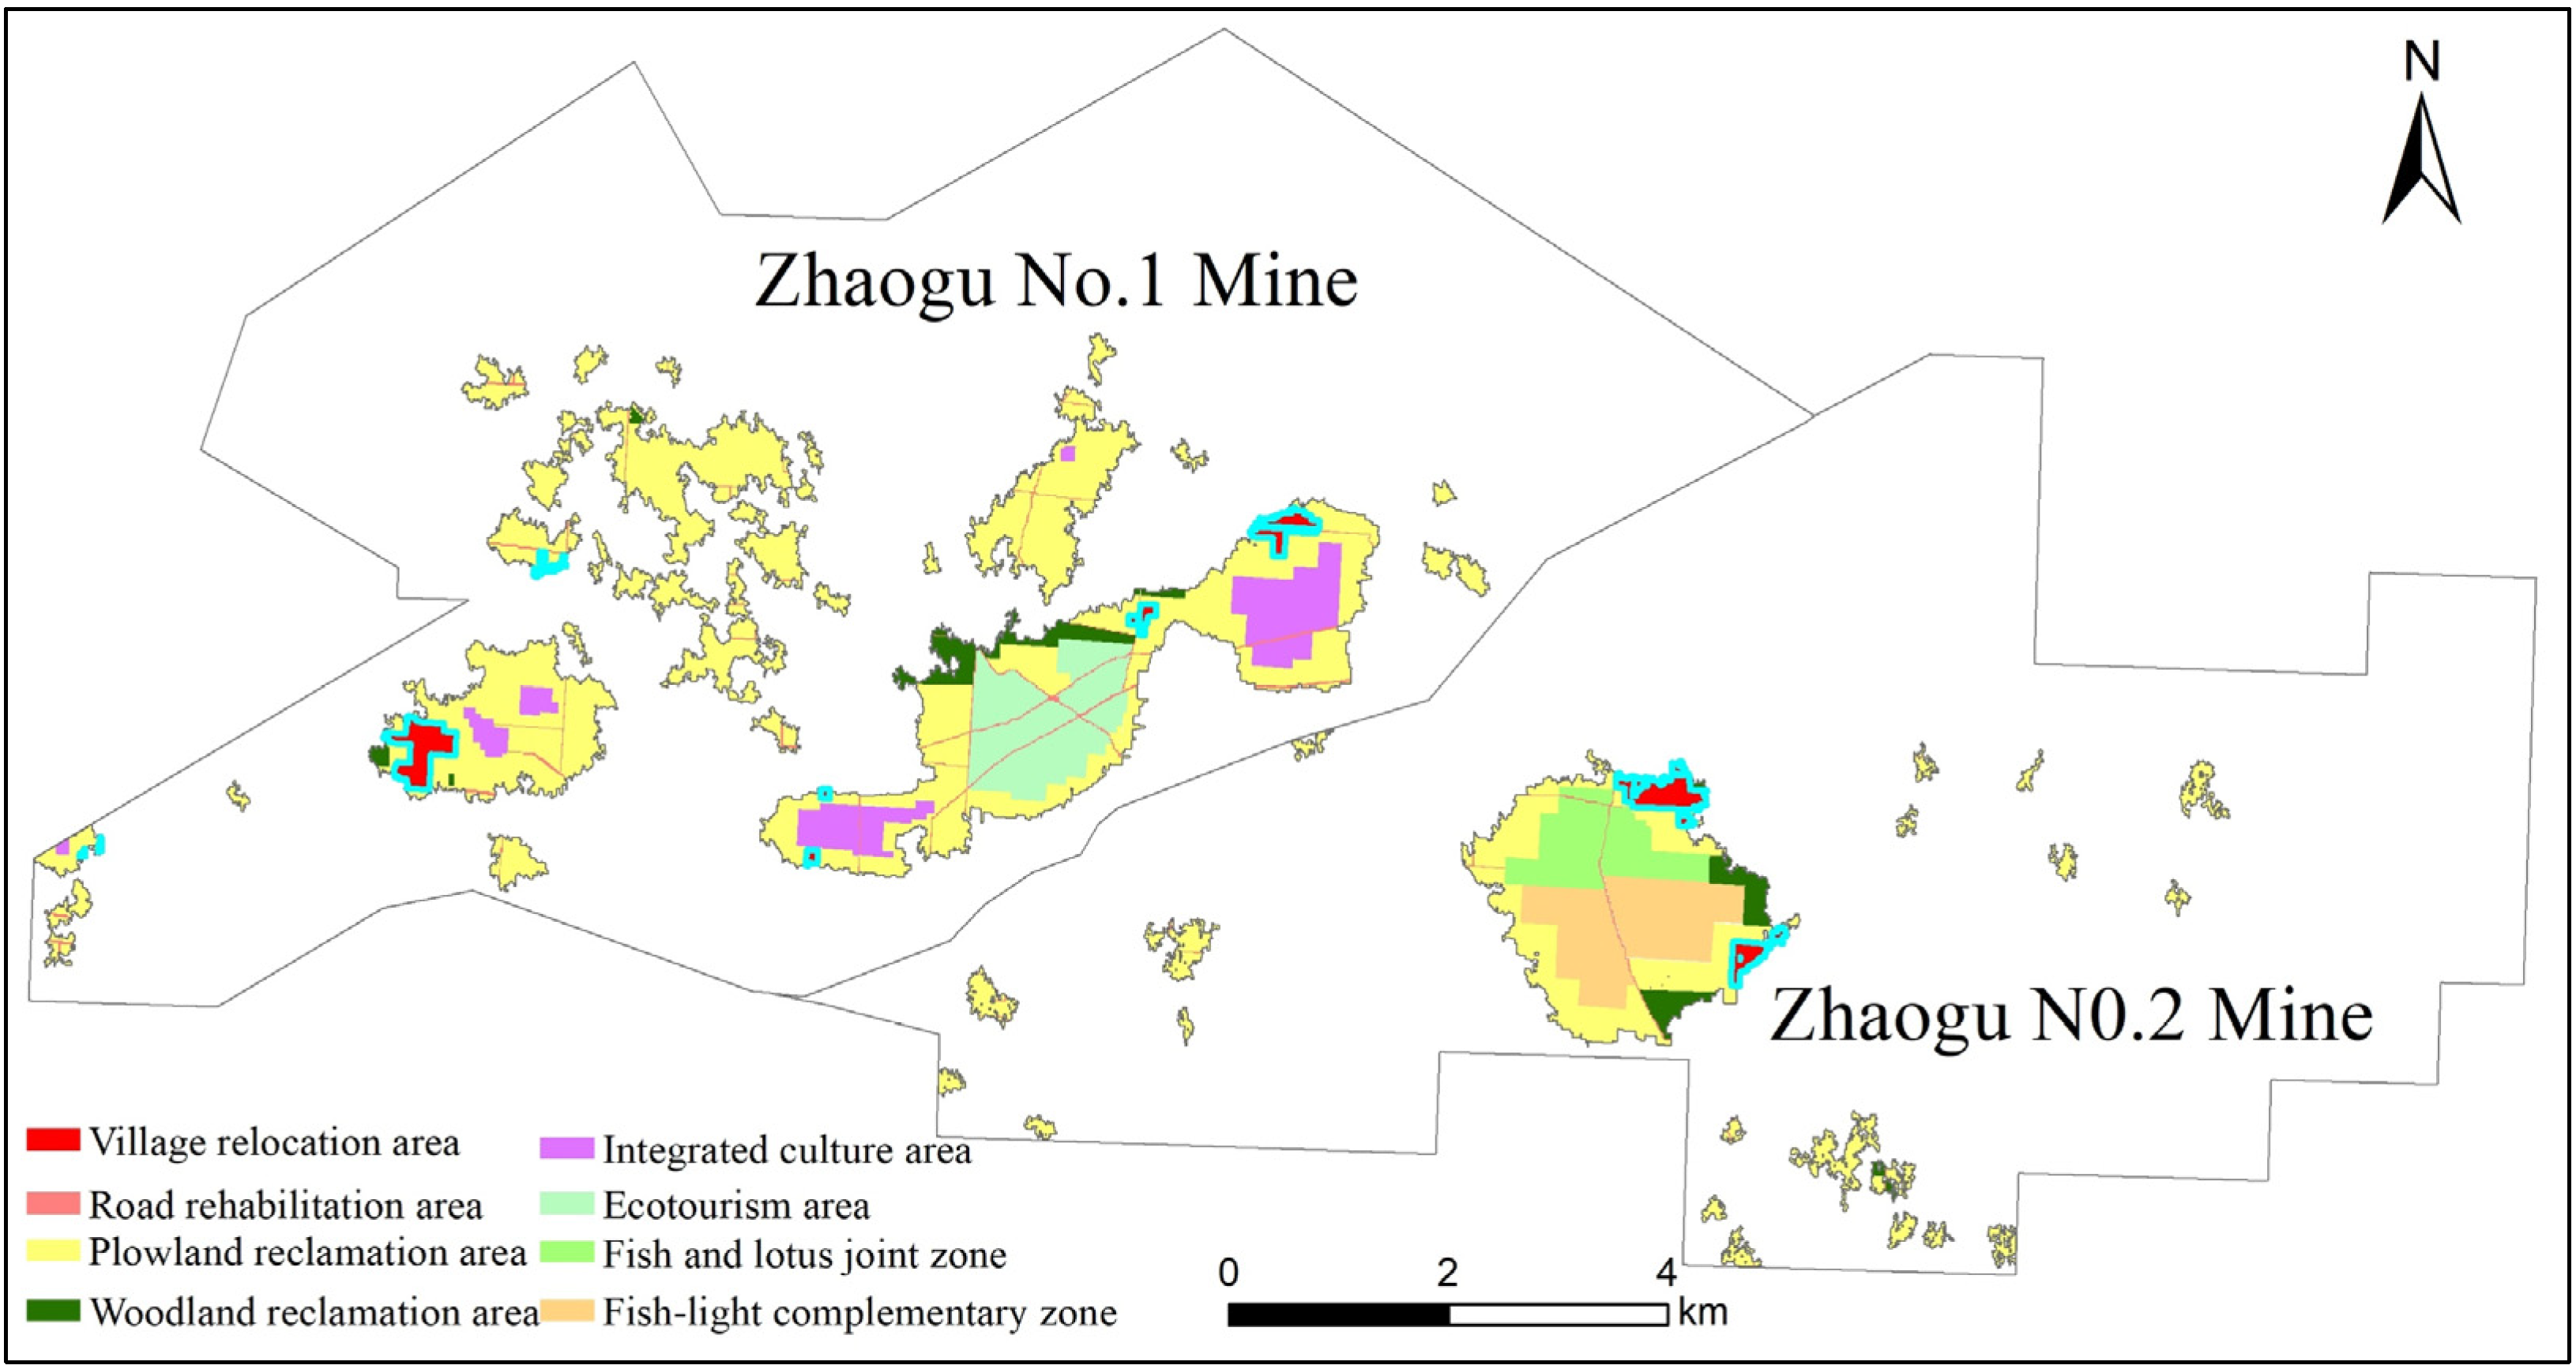
(2) Evaluation of the degree of land destruction in the collapse zone based on a fuzzy comprehensive evaluation model with the improved G1 method
At present, there are relatively mature methods for evaluating land damage in coal mining subsidence areas. For example, Li Chao et al. [38] combined the limit condition method and the evaluable method to evaluate the degree of land damage in subsidence areas. However, the evaluation results derived from these methods are not scientific and intuitive enough, resulting in the results of the classification of the degree of land destruction within the subsidence area not being in line with the actual situation of the land and a lack of guidance for the actual management of the subsidence area. In order to evaluate the land destruction situation in the subsidence area more accurately and intuitively, this paper improves the weight determination method of the fuzzy comprehensive evaluation model and establishes a fuzzy comprehensive evaluation model based on the improved G1 method to evaluate the degree of land destruction in the subsidence area. Based on the results of the evaluation of the degree of land destruction in the subsidence area, and in combination with different land types, a subsidence area management model suitable for the Zhaogu Mining Area was formulated to provide a theoretical basis and data support for the management of the subsidence area in the Zhaogu Mining Area.
(3) Shortcomings and prospects
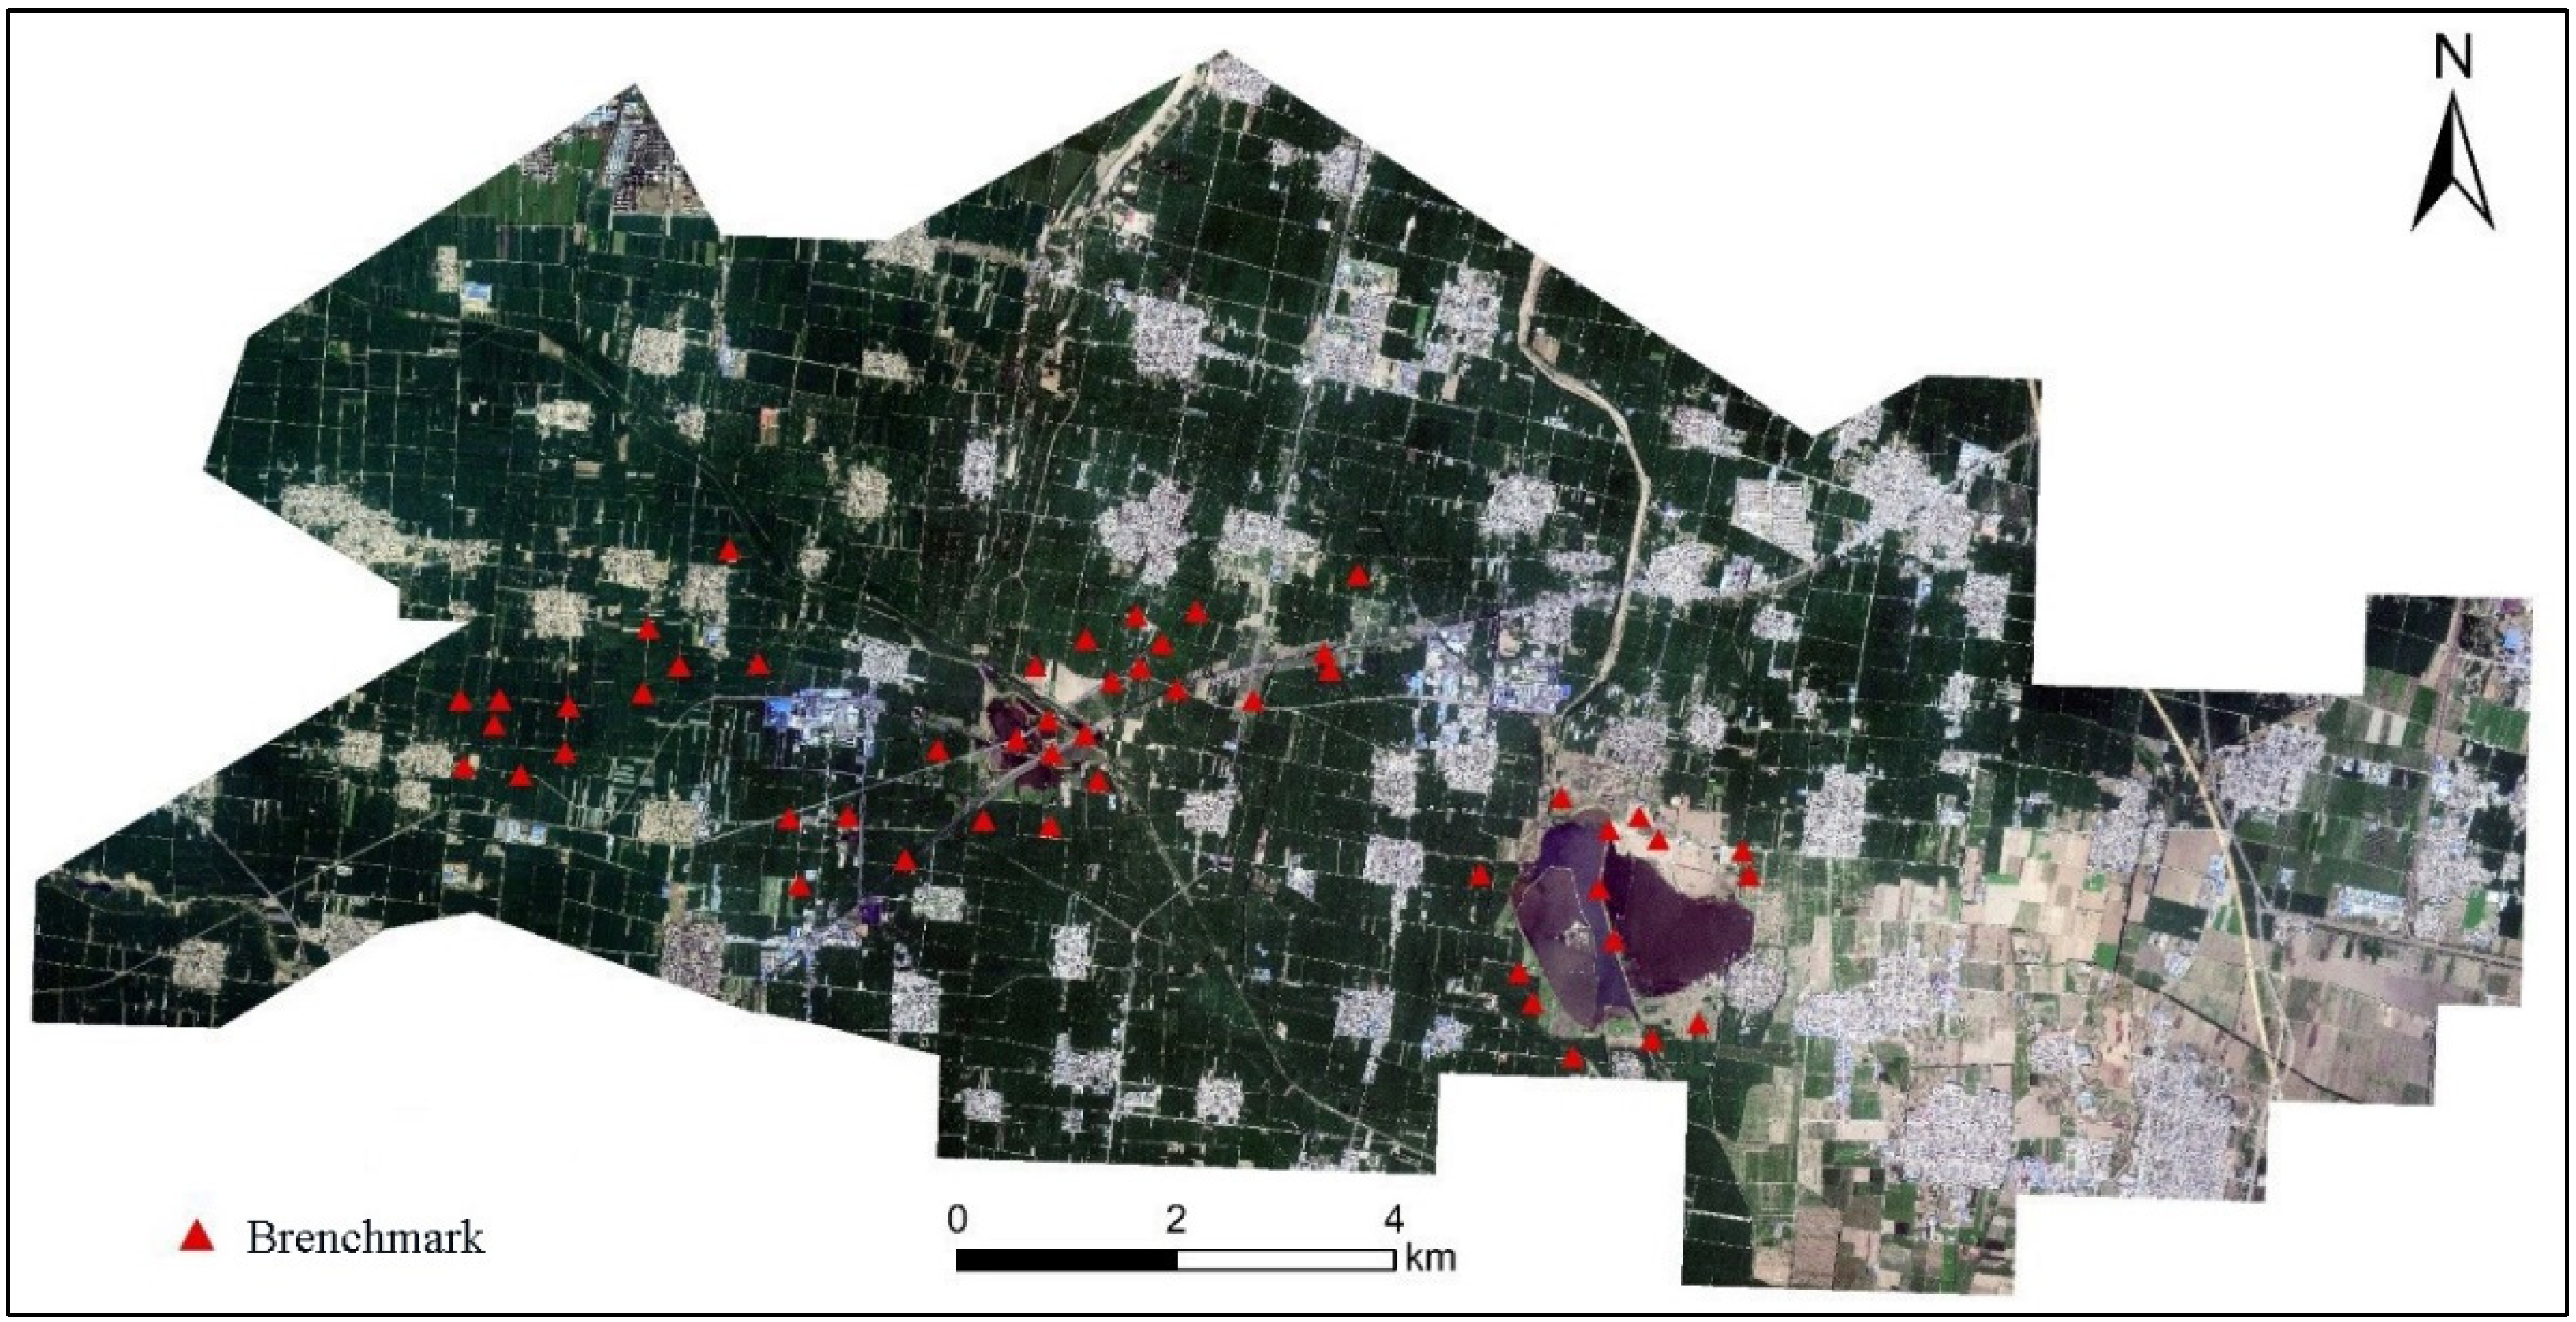
In order to verify the accuracy of the D-InSAR technique in extracting the depth of mine subsidence, this paper uses RTK to measure the amount of surface subsidence at 50 leveling points from 5 March 2021 to 10 April 2021 and compares and analyses the amount of subsidence with three sets of interferometric image pairs in 2021 (5 March 2021–17 March 2021, 17 March 2021–29 March 2021, 29 March 2021–10 April 2021. However, the RTK technique has a relatively large error compared to the total station and level, and a higher accuracy method such as total station or level can be selected for measurement at a later stage to verify the accuracy with the D-InSAR technique measurement results. In addition, this paper only studies the collapse situation of the Zhaogu Mining Area in the past 5 years, which can provide methods for reference for future subsidence area extraction and land use information classification. In future research work, the research time can be extended to study more complete collapse situation of the Zhaogu Mining Area.

5. Conclusions

The research location for this paper is the Zhaogu Mining Area in Huixian City, Henan Province. This study utilizes Geographic Information System (GIS) and remote sensing (RS) technology along with multi-source remote sensing imageries to determine the extent and depth of subsidence in the research region between 2017 and 2021. Additionally, this research uses the SSRN model to identify changes in land use information inside the subsidence area. A fuzzy comprehensive evaluation model is created on the basis of the modified G1 method to assess the extent of land damage in subsidence areas. The evaluation results led to the proposal of a suitable subsidence area management model, which would offer the necessary theoretical basis and data support for managing the subsidence area in the Zhaogu Mining Area. The following are the conclusions:
(1)
The extent of the collapse in the Zhaogu Mining Area is 1880.99 hm2, with the largest amount of collapse measuring 417.77 cm. The collapse area in Zhaogu No. 1 Mine covers 1294.04 hm2, while the collapse area in Zhaogu No. 2 Mine spans 586.95 hm2. Hence, the extent of the collapse at Zhaogu No. 1 Mine is more severe compared to Zhaogu No. 2 Mine. Zhaogu No. 1 Mine represents 62.5% of the Level I collapse level, whereas Zhaogu No. 2 Mine represents 37.5%. The Level II subsidence rate is 81.01% in Zhaogu No. 1 Mine and 18.99% in Zhaogu No. 2 Mine. The subsidence rate in Zhaogu No. 1 Mine is 85.04% at Level III, while in Zhaogu No. 2 Mine, it is 14.96%. The collapse at Level IV of the Zhaogu No. 1 mine was responsible for 46.39% of the total, while the remaining 53.61% can be attributed to the collapse at Level II of the mine.
(2)
Between 2017 and 2021, the subsidence area experienced the greatest impact on cultivated land. The cultivated land area of Zhaogu No. 1 Mine and Zhaogu No. 2 Mine has been decreasing significantly. The reduced cultivated land has mostly been converted into water areas and idle land. The subsidence water area of Zhaogu No. 2 Mine is larger than that of Zhaogu No. 1 Mine, and the idle land area within the subsidence area is smaller than that of Zhaogu No. 1 Mine. The subsidence water area in the Zhaogu No. 5 collapse basin is larger, the groundwater level is higher, and the accumulation water area is deeper.
(3)
The land damage in areas affected by subsidence is categorized into three levels: mild, moderate, and severe damage. The water area in the subsidence area constituted 41.65% of the total subsidence area, while the minor damage area accounted for 23.27%, the moderate damage area accounted for 31.89%, and the severe damage area accounted for 3.19%. The outcome of the full treatment program for the subsidence area is as follows: The relocated village covers an area of 72.11 hm2. The restoration of the road requires an area of 39.83 hm2. There is a total of 1178.75 hm2 of arable land that can be reclaimed. Additionally, 74.68 hm2 can be reclaimed as forest land. The subsidence water area covers 783.36 hm2. After reclamation, the water utilization area is 516.36 hm2, which includes 130.51 hm2 in the integrated aquaculture area, 144.27 hm2 in the eco-tourism area, 96.27 hm2 in the fish and lotus joint zone, and 145.31 hm2 in the fishing-photovoltaic park area.

Author Contributions

Conceptualization, J.P. and Z.W.; methodology, J.P. and Z.W.; software, J.P.; validation, Z.W. and J.P.; formal analysis, S.W.; investigation, J.P.; resources, J.P.; data curation, J.P.; writing—original draft preparation, J.P. and Z.W.; writing—review and editing, S.W.; visualization, J.P.; supervision, S.W.; project administration, S.W.; funding acquisition, S.W. All authors have read and agreed to the published version of the manuscript.

Funding

This work was supported by the State Key Project of the National Natural Science Foundation of China-Key projects of joint fund for regional innovation and development (U22A20620, U21A20108).

Institutional Review Board Statement

Not applicable.

Informed Consent Statement

Not applicable.

Data Availability Statement

The raw data supporting the conclusions of this article will be made available by the authors on request.

Conflicts of Interest

The authors declare no conflicts of interest.

References

  1. Tian, Y.F. Impact of coal mine subsidence area on ecological environment and comprehensive management measures. Pop. Stand. 2021, 20–22. [Google Scholar] [CrossRef]
  2. Xiao, W.; Chen, W.Q.; He, T.T.; Zhao, Y.L.; Hu, Z.Q. Remote sensing monitoring and impact assessment of mining disturbance in high diving coal mine area with long time series process. J. Coal 2022, 47, 922–933. [Google Scholar]
  3. Li, D.R.; Zhou, Y.Q.; Ma, H.C. Principles and Applications of Interferometry SAR. Surv. Mapp. Sci. 2000, 25, 9–12. [Google Scholar]
  4. Zhao, C.Y.; Zhang, Q.; Ding, X.L.; Lu, Z.; Yang, C.S.; Qi, X.M. Monitoring of land subsidence and ground fissures in Xian, China 2005–2006: Mapped by SAR interferometry. Environ. Geol. 2009, 58, 1553. [Google Scholar] [CrossRef]
  5. Gao, E.T.; Fan, D.L.; Fu, B.L.; Yong, Q.; Lan, Y.P. Land Subsidence Monitoring of Nanjing Area Based on PS-InSAR and SBAS Technology. Geod. Geodyn. 2019, 39, 158–163. [Google Scholar]
  6. Zhou, H.Y.; Wang, Y.J.; Yan, S.Y.; Wu, Y.; Liu, X.X. Land Subsidence Monitoring and Analyzing of Cangzhou Area Sentinel-1A/B Based Time Series InSAR. Surv. Mapp. Bull. 2017, 6, 89–93. [Google Scholar]
  7. Carnec, C.; Delacourt, C. Three years of mining subsidence monitored by SAR interferometry, near Gardanne, France. J. Appl. Geophys. 2000, 43, 43–54. [Google Scholar] [CrossRef]
  8. Zhu, J.J.; Xing, X.M.; Hu, J.; Li, Z.W. Monitoring of ground surface deformation in mining area with InSAR technique. China J. Nonferrous Met. 2011, 21, 2564–2576. [Google Scholar]
  9. Wang, L.; Deng, K.Z.; Xue, J.Q.; Yu, D.L. Prediction of Mining Subsidence Based on D-InSAR Combined with Probability Integral Model. Met. Min. 2016, 160–163. [Google Scholar] [CrossRef]
  10. Herwitz, S.R.; Johnson, L.F.; Dunagan, S.E.; Higgin, R.G.; Sullivan, D.V.; Zheng, J.; Lobitz, B.M.; Leung, J.G.; Gallmeyer, B.A.; Aoyagi, M.; et al. Imaging from an unmanned aerial vehicle: Agricultural surveillance and decision support. Comput. Electron. Agric. 2004, 44, 49–61. [Google Scholar] [CrossRef]
  11. Cao, Y.J.; Dai, J.G.; Zhang, G.S.; Xiao, M.H.; Zhao, Q.Z.; Mu, Z.Y.; Xu, M.M. Remote sensing monitoring of non-agriculturalization in typical areas of the Northern Xinjiang of China based on feature optimization. Trans. Chin. Soc. Agric. Eng. 2024, 40, 275–286. [Google Scholar]
  12. Wang, J.; Chai, Z.F.; Ma, H.Y.; Zhao, Z.M.; Wu, J.B.; Fu, W.P. Land use type interpretation and dynamic changes due to water storage projects using support vector machine. Arid Land Res. 2024, 41, 581–589. [Google Scholar]
  13. Dong, J.W.; Wu, W.B.; Huang, J.X.; You, N.S.; He, Y.L.; Yan, H.M. State of the Art and Perspective of Agricultural Land Use Remote Sensing Information Extraction. J. Earth Inf. Sci. 2020, 22, 772–783. [Google Scholar]
  14. Peng, C.; Chen, S.B.; Wang, Y.N.; Tao, Y.L.; Zhang, G.Z. Information extraction of land use change in Korean Peninsula based on MODIS data. World Geol. 2010, 29, 155–159. [Google Scholar]
  15. Yang, Z.X.; Jia, D.Z.; Zhou, H.Y.; Hu, Y.N.; Li, G. Land-use information extraction of GF-1 remote sensing image of reservoir area by using object-oriented method. Surv. Mapp. Bull. 2020, 35–39. [Google Scholar] [CrossRef]
  16. Wang, S.D.; Feng, Z.Y.; Yu, Y.; Zhang, H.B. Land Use/Cover Change Trajectory Analysis Based on Improved Stable Mapping Method. J. Agric. Mach. 2020, 51, 152–162. [Google Scholar]
  17. El-Sayed, M.E.; Youssef, A.W.; Shehata, O.M.; Shihata, L.A.; Azab, E. Computer vision for package tracking on omnidirectional wheeled conveyor: Case Study. Eng. Appl. Artif. Intell. 2022, 116, 105438. [Google Scholar] [CrossRef]
  18. Barrington, H.; Dickinson, A.; McGuire, J.; Yan, C.H.; Reid, M. Computer Vision for Kinetic Analysis of Lab- and Process-Scale Mixing Phenomena. Org. Process Res. Dev. 2022, 26, 3073–3088. [Google Scholar] [CrossRef] [PubMed]
  19. Kakati, D.; Arya, S.C. A full-duplex optical fiber/wireless coherent communication system with digital signal processing at the receiver. Optik 2018, 171, 190–199. [Google Scholar] [CrossRef]
  20. Sodagudi, S.; Manda, S.; Smitha, B.; Chaitanya, N.; Ahmed, M.A.; Deb, N. EEG signal processing by feature extraction and classification based on biomedical deep learning architecture with wireless communication. Optik 2022, 270, 170037. [Google Scholar] [CrossRef]
  21. Krauer, F.; Schmid, B.V. Mapping the plague through natural language processing. Epidemics 2022, 41, 100656. [Google Scholar] [CrossRef] [PubMed]
  22. Pellicer, L.F.A.O.; Ferreira, T.M.; Costa, A.H.R. Data augmentation techniques in natural language processing. Appl. Soft Comput. 2023, 132, 109803. [Google Scholar] [CrossRef]
  23. Li, W.; Wu, G.D.; Zhang, F.; Du, Q. Hyperspectral Image Classification Using Deep Pixel-Pair Features. IEEE Trans. Geosci. Remote Sens. 2017, 55, 844–853. [Google Scholar] [CrossRef]
  24. Chen, Y.S.; Jiang, H.L.; Li, C.Y.; Jia, X.P.; Ghamisi, P. Deep Feature Extraction and Classification of Hyperspectral Images Based on Convolutional Neural Networks. IEEE Trans. Geosci. Remote Sens. 2016, 54, 6232–6251. [Google Scholar] [CrossRef]
  25. Zou, Y.J. Research on Information Extraction Method of Mining Subsidence Basin Based on SAR/InSAR. Master’s Thesis, China University of Mining and Technology, Xuzhou, China, 2024. [Google Scholar]
  26. Zhang, J.W. Analysis of problems and countermeasures in comprehensive land management of coal mining subsidence area in Huaibei City. Natl. Bus. Situat. (Theor. Res.) 2010, 21+48. [Google Scholar] [CrossRef]
  27. Zhang, R.Y.; Zou, Y.; Wu, Y.; Xiao, W.; Guang, J.Y.; Liu, B. Present Status Analysis on Deep Water Area of Mining Subsidence and Discussion on Control Countermeasures. Coal Eng. 2014, 46, 73–75. [Google Scholar]
  28. Xu, G.J.; Duan, D.X.; Du, X.H. Study on integrated management model of fishery and ecology in coal mining collapse waters in southern Shandong Province. Bull. Oceanol. Limnol. 2016, 53–59. [Google Scholar] [CrossRef]
  29. Zhang, L.N.; Wang, X.L.; Ke, K. Analysis of fishery utilization in coal mining subsidence in Jining City, Shandong Province. China Fish. 2020, 66–68. Available online: https://kns.cnki.net/kcms2/article/abstract?v=9UjK0-enmQjREysbzCVKyw5O1o_JriPZOPRDLqw_6FfA89Lemp73JmBPdmETH1I9qpo9i5rgd_hMaebqRw96uAEI8dtF3oH6GoZV-7QNSbfOB9d5g_GqKcgPq1T6osQQUHmEGc__brw=&uniplatform=NZKPT&language=CHS (accessed on 7 July 2024).
  30. He, Z.X.; Yu, H.Y.; Xie, S.F.; Yu, L.L.; Chen, L.G. Deformation monitoring of Xiaolangdi Dam by small baseline set InSAR technique. Surv. Mapp. Sci. 2022, 47, 66–72. [Google Scholar]
  31. Wu, W.C.; Hu, J.K. Research on subsidence monitoring in mining area based on D-InSAR technology. Eng. Res. 2023, 8, 28–31. [Google Scholar]
  32. Dong, J.; Ke, F.; Niu, K.; Wang, J.L. Monitoring and Analysis of Surface Subsidence in Mining Areas Using Dual-track D-InSAR Technology. Energy Technol. Manag. 2024, 49, 1–6. [Google Scholar]
  33. Zhong, Z.L.; Li, J.; Luo, Z.M.; Chapman, M. Spectral–Spatial Residual Network for Hyperspectral Image Classification: A 3-D Deep Learning Framework. IEEE Trans. Geosci. Remote Sens. 2018, 56, 847–858. [Google Scholar] [CrossRef]
  34. Wang, S.D.; Liu, Y. Evaluation of land destruction degree in mining area based on improved fuzzy comprehensive evaluation model. Chin. J. Ecol. Agric. 2015, 23, 1191–1198. [Google Scholar]
  35. Zhang, Z.F. Research on Hyperspectral Image Classification Method Based on Deep Semantic Segmentation Technology. Master’s Thesis, China University of Mining and Technology, Xuzhou, China, 2022. [Google Scholar]
  36. Li, L. Research on Suitability Evaluation of Land Reclamation in Shiguai Coal Mining Subsidence Area, Baotou City. Master’s Thesis, Hebei University of Engineering, Handan, China, 2020. [Google Scholar]
  37. Xi, B.S. Research on Improvement of Land Damage Evaluation Method in Subsidence Area of Western Mining Area. Master’s Thesis, China University of Mining and Technology, Xuzhou, China, 2022. [Google Scholar]
  38. Li, C.; Cui, R.H.; Zhang, X.; Zhang, X.Y.; Ma, J.M.; Wang, P.J. Evaluation of land damage degree in coal mining area with high groundwater level based on matter element extension method. China Min. Mag. 2024, 33, 87–97. [Google Scholar]
Figure 1. Geographical location of the study area.
Applsci 14 06055 g001
Figure 2. Spectral-Space Residual Network model.
Applsci 14 06055 g002
Figure 3. Elevation point position.
Applsci 14 06055 g003
Figure 4. Collapse depth of study area.
Applsci 14 06055 g004
Figure 5. The extent of the subsidence of the study area.
Applsci 14 06055 g005
Figure 6. Collapse depth classification in the study area.
Applsci 14 06055 g006
Figure 7. Comparison of classification results.
Applsci 14 06055 g007
Figure 8. Land use types in subsidence areas, 2017–2021.
Applsci 14 06055 g008
Figure 9. Change of the proportion of land use types in subsidence areas from 2017 to 2021.
Applsci 14 06055 g009
Figure 10. Change of the proportion of land use type in Zhaogu No. 1 Mine and No.2 Mine subsidence area from 2017 to 2021.
Applsci 14 06055 g010
Figure 11. Distribution map of land damage in the subsidence area of Zhaogu Mining Area.
Applsci 14 06055 g011
Figure 12. Comprehensive management planning map of Zhaogu Mining Area subsidence area.
Applsci 14 06055 g012
Table 1. Source of data for the study area.
Data TypeData NameResolutionTimeSource
Radar imageSentinel-1A5 m × 20 m2017–2021European Space Agency (ESA)
Optical remote sensing imageSentinel-2A10 m × 10 m6 August 2017European Space Agency (ESA)
10 m × 10 m22 July 2018
10 m × 10 m29 August 2019
Sentinel-2B10 m × 10 m31 July 2021
GF-18 m × 8 m20 July 2020China Resources Satellite Application Center
DEM data 30 m × 30 m United States Geological Survey (USGS)
Vector dataZhaogu Mining Area boundary 2021Coking coal Group
Zhaogu No. 1 Mine boundary 2021Coking coal Group
Zhaogu No. 2 Mine boundary
Socio-economic dataHuixian City Statistical Yearbook 2017–2021Statistical yearbook sharing platform
Huixian City Statistical Bulletin 2017–2021Huixian City government portal
Table 2. Benchmark surface deformation contrast.
Elevation PointD-InSAR Processing Results (cm)Elevation Point Measurement Value (cm)Elevation PointD-InSAR Processing Results (cm)Elevation Point Measurement Value (cm)
1−6.41−5.8826−7.11−6.25
2−0.14−0.2327−6.13−6.93
3−1.56−1.0128−4.06−5.13
4−0.44−0.3929−5.45−6.03
5−3.06−3.6730−5.20−4.41
6−0.91−0.6631−5.14−5.93
7−1.09−1.3932−6.37−5.53
8−1.46−1.7933−6.39−5.46
9−1.62−1.2134−7.16−6.32
10−2.79−2.1235−7.95−6.88
11−7.21−8.0336−7.04−7.85
12−3.01−3.5637−5.64−6.54
13−5.21−4.6538−5.13−6.15
14−3.55−4.0139−5.63−5.03
15−8.25−7.5640−6.35−7.12
16−8.16−9.2241−6.82−5.79
17−5.33−4.8942−2.13−3.11
18−7.96−7.1343−3.52−3.15
19−7.21−6.5544−5.73−4.86
20−6.51−5.6445−4.45−5.12
21−5.34−6.2146−1.97−1.36
22−7.22−6.5347−5.31−4.51
23−6.85−5.9248−3.79−3.07
24−7.86−8.7249−3.33−2.11
25−8.33−9.2150−3.15−3.97
Table 3. Study area subsidence grading table.
Collapse GradeCollapse Depth (cm)Area (hm2)Total (hm2)Scale (%) 1
Level I>300387.61544.2628.94
Perennial waterlogged areas156.65
Level II200–300433.83433.8323.06
Level III100–200475.02475.0225.25
Level IV0–100427.88427.8822.75
1 The ratio being referred to here is the measurement of the area of the cave-in grade divided by the size of the cave-in land specifically in the Zhaogu Mine.
Table 4. Zhaogu No.1 Mine and Zhaogu No.2 Mine subsidence levels.
Collapse GradeZhaogu No.1 MineZhaogu No.2 Mine
Area (hm2)Scale (%) 1Area (hm2)Scale (%) 1
Level I340.15 62.5204.11 37.5
Level II351.46 81.0182.37 18.99
Level III403.95 85.0471.07 14.96
Level IV198.48 46.39229.40 53.61
Total1294.04 68.8586.95 31.2
1 The ratio is the area of different collapse grades within Zhaogu No.1 Mine and Zhaogu No.2 Mine divided by the area of the corresponding collapse grade in the whole mining site.
Table 5. Comparison of classification accuracy of different methods.
MLCSFSVMSSRN
OA (%)80.4683.1988.6495.87
AA (%)80.0583.3188.4595.92
Kappa (%)80.3983.9488.5095.85
Table 6. Selection and classification standards for land damage indicators in subsidence areas.
Evaluation IndexAcquisition MethodGrading Standard
Minor DamageModerate DamageSevere Damage
Subsidence value (cm)D-InSAR result<100100~200>200
Productivity loss rate (%)Statistical yearbook<20.020.0~60.0>60.0
Slope (cm/m)DEM data<1010~15>15
Soil layer thickness (m)Field investigation>1.50.8~1.5<0.8
Organic matter (%)Field sampling determination>1.50.5~1.5<0.5
PH valueField sampling and detection6~85~6 or 8~8.5<5 or >8.5
Table 7. Statistics on the area of each level of damage in the subsidence area.
Degree of DamageMinor DamageModerate DamageSevere DamageWatersTotal
Area (hm2)437.67599.8560.11783.361880.99
Proportion (%)23.2731.893.1941.65100
Table 8. The degree of damage to various land uses in the subsidence area (hm2).
Degree of DamageCroplandConstruction LandForest LandUnoccupied
Minor damage305.6251.2521.6159.19
Moderate damage446.2163.87089.77
Severe damage56.020.6403.45
Table 9. Reclamation direction of the subsidence area of the Zhaogu Mining Area.
Subsidence Area TypeDegree of DamageReclamation Direction
CroplandMildCropland
Construction landCropland, Forest land
Forest landForest land
UnoccupiedCropland, Forest land
CroplandModerateCropland, Forest land
Construction landCropland, Forest land, Meadow
Forest landForest land
UnoccupiedCropland, Forest land
CroplandSevereCropland, Forest land
Construction landCropland, Forest land, Meadow
Forest landForest land, Meadow
UnoccupiedCropland, Forest land, Meadow
Disclaimer/Publisher’s Note: The statements, opinions and data contained in all publications are solely those of the individual author(s) and contributor(s) and not of MDPI and/or the editor(s). MDPI and/or the editor(s) disclaim responsibility for any injury to people or property resulting from any ideas, methods, instructions or products referred to in the content.

