Review

From Feed to Fish—Nutrients’ Fate in Aquaculture Systems

by
Ana Paula Dalbem Barbosa
1,2,*,
Sarian Kosten
1,
Claumir Cesar Muniz
2 and
Ernandes Sobreira Oliveira-Junior
2
1
Department of Ecology, Faculty of Science, Radboud University, 6525 XZ Nijmegen, The Netherlands
2
Graduate Program in Environmental Sciences, Laboratory of Ichthyology of the North Pantanal, State University of Mato Grosso, Cáceres 78200-000, Brazil
*
Author to whom correspondence should be addressed.
Appl. Sci. 2024, 14(14), 6056; https://doi.org/10.3390/app14146056
Submission received: 9 May 2024 / Revised: 3 July 2024 / Accepted: 9 July 2024 / Published: 11 July 2024

Abstract

:
Aquaculture is increasing globally, providing protein to a growing population, but little is known regarding the nutrient budgets in aquaculture. To obtain insight into how management practices impact nutrient fluxes in freshwater aquaculture earthen ponds worldwide, we conducted a literature review. Our literature search yielded 23 papers in which nutrient budgets were reported. Our results showed that the main nutrient inputs are inlet water, feed, and fertilizers, but they varied according to location and management practices. Overall, feed and fertilizers constituted the predominant nutrient sources, accounting for up to 99% of the total inputs. The most quantified outputs were outlet water, fish, and sedimentation. Our findings indicate that only up to 20% of carbon, 45% of nitrogen, and 60% of phosphorus are assimilated by the fish. In some systems, up to 80% of carbon, 80% of nitrogen, and 60% of phosphorus accumulate in pond bottoms; in other systems, the outflow represents substantial losses of up to 16% of carbon, 76% of nitrogen, and 55% of phosphorus. More insight into nutrients’ fate in fishponds is crucial from a sustainability perspective, as feed and fertilizer use can likely be optimized, reducing operational costs and the potential impact on the surrounding environment and atmospheric greenhouse gas concentrations.

1. Introduction

Human population growth and the rising demand for nutritious food have resulted in a significant increase in fish consumption, rising from 9 kg to 20 kg per capita in the past decades [1]. In association, the aquaculture industry has grown remarkably, with fish production increasing sixfold in the last 20 years [2]. Notably, by 2020, global aquaculture yielded an output of over 157 million tonnes of fish for human consumption, to which freshwater aquaculture contributed 56%, representing a USD 265 billion sale value by 2020 [1].
Fish is considered an environmentally more sustainable protein source than meat of other reared animals [3]. Fish have the lowest feed conversion ratio (FCR) among reared animals, indicating efficient feed utilization per gram of live weight [4]. Despite fish being considered a more environmentally sustainable protein source, the nutrient retention in the live weight of fish is low compared to the amount of nitrogen excreted as ammonia and urea [5]. For commercially fed Oreochromis niloticus (Nile tilapia), for instance, it is estimated that 35% of nitrogen and 28% of phosphorus are transformed into fish biomass, with the remainder of the N and P from feed input being converted to waste [6]. The assimilation of nutrients in fertilizer-fed (on-farm supply) Oreochromis niloticus is reported to be even lower, with only 10% of nitrogen and 5% of phosphorus incorporated into the fish biomass, while the remainder is lost in the cultivation system [7].
The low percentages of nutrients assimilated highlight that, by far, the largest share of nutrients added to fish cultures is lost. This loss can occur in the form of waste (emission via wastewater or—in the case of carbon and nitrogen—to the atmosphere and sedimentation) or assimilated by non-target biota. Given that feed is generally the major operational cost [8], this implies an enormous economic loss. In addition, the nutrient inputs in aquaculture are a matter of concern due to the eutrophication of the fishponds and the receiving waters [2] and as anthropogenic sources of greenhouse gas emissions [9,10].
Insight into nutrient fluxes, in combination with different management techniques, can eventually contribute to optimizing fish growth and minimizing potential environmental impacts. A comprehensive understanding of the nutrient dynamics in aquaculture is essential to develop effective nutrient management strategies that minimize environmental impact and promote the long-term viability of aquaculture [11].
Hence, here we provide an overview of studies on nutrient budgets of freshwater earthen (excavated) fishponds, which are the most commonly used facility to produce finfish [1]. We aim to link observed differences in nutrient budgets to the cultured fish species and to pond management (e.g., way of feeding, fertilizer use) to obtain insight into how different practices impact the nutrient budget. Therefore, our main question is, “How do management practices in freshwater aquaculture systems impact the nutrient fluxes, and what practices can be implemented to optimize these parameters and promote the sustainability of these systems?”.

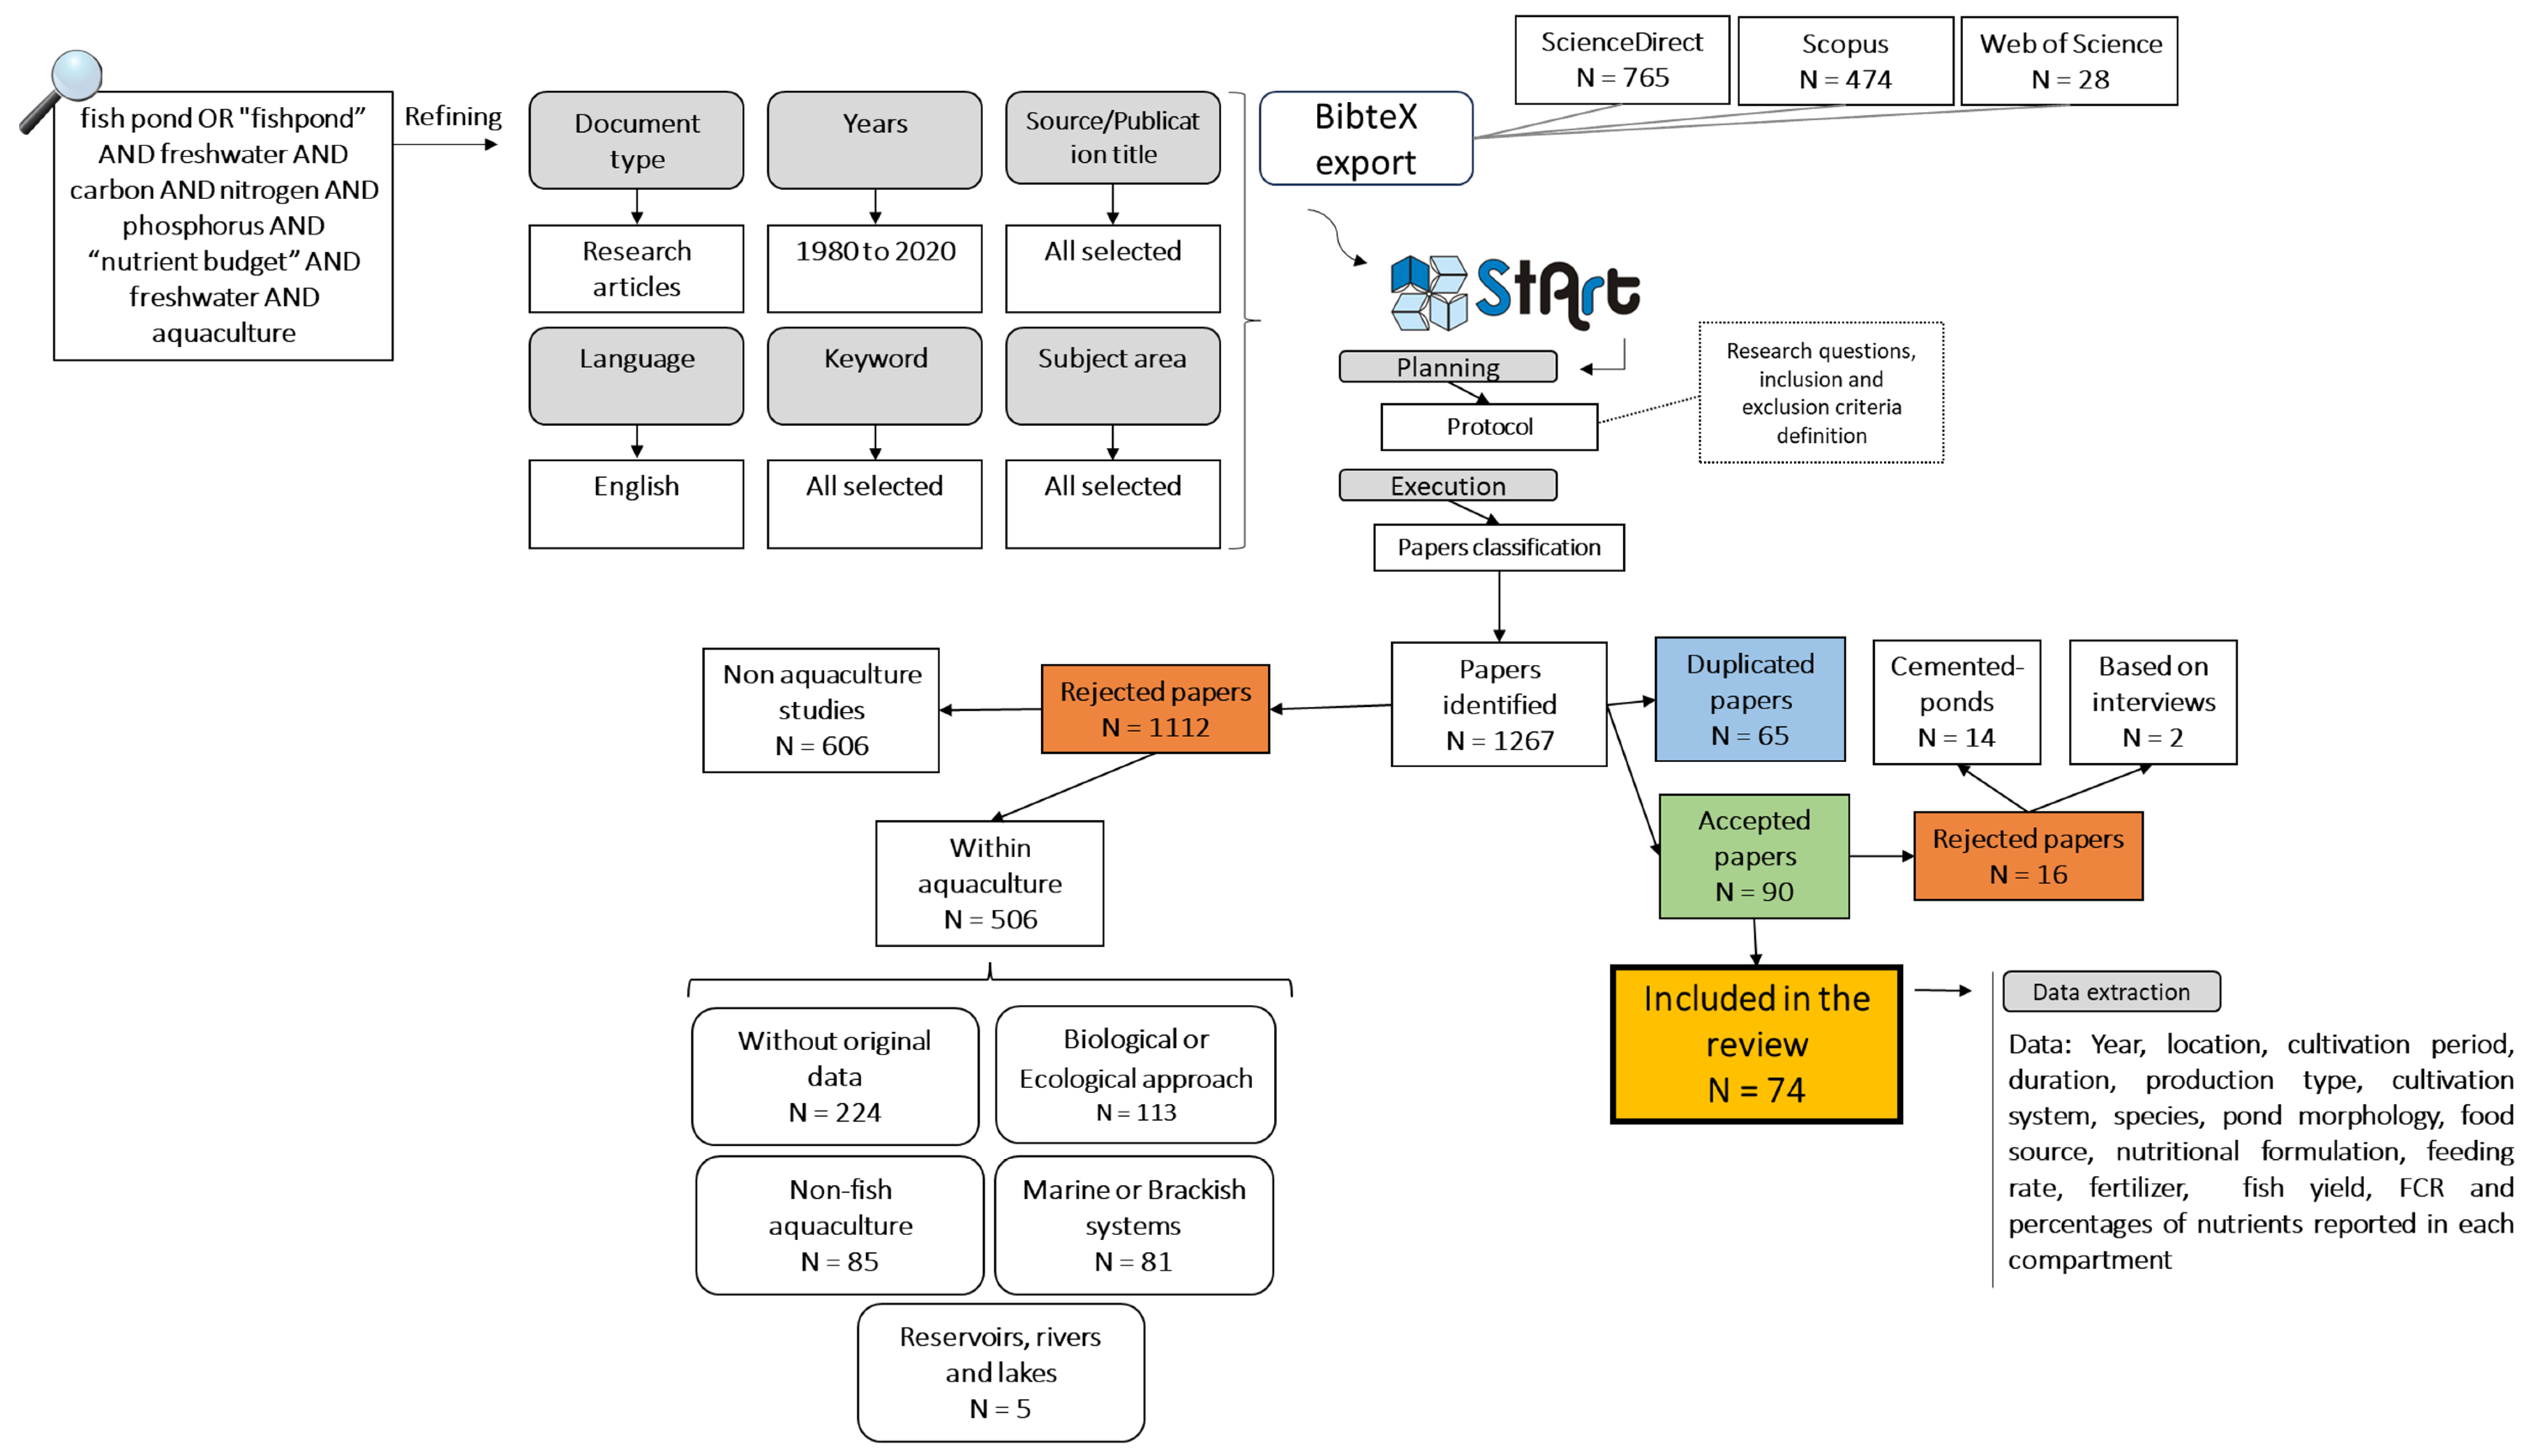
2. Materials and Methods

To answer our research questions, we searched literature from the past 40 years, aiming to include the 20 years prior to the rapid increase in fish production as well as recent research. In April 2020, the search was performed in Scopus, ScienceDirect, and Web of Science using advanced searches, with combinations of the following search terms together with the Boolean operators AND and OR: fish pond OR “fishpond” AND freshwater AND carbon AND nitrogen AND phosphorus and “nutrient budget” AND aquaculture found in the papers’ titles or keywords. The search results from the platforms were saved in BibTeX format and exported to the software State of the Art through Systematic Review (StArt version 2.3.4.2), where the papers were sorted.
Based on the papers’ abstracts, we first selected all papers that reported nutrient fluxes, concentrations in at least one pond compartment (inlet, pond, and outlet), and the fish species cultivated. We did not include papers that focused on the aquaculture of species other than fish (for instance, algae, crustaceans, mollusks, and shellfish), papers that focused on marine and brackish systems, nor, for instance, review papers without original data. Other papers that lacked data providing insight into the ponds’ nutrient budgets tended to focus on specific biological groups within the ponds (e.g., bacteria, algae, plants, and animal communities) or aquaculture systems other than ponds (e.g., net cages) (Figure 1). A Sankey plot, obtained using the software JMP® 17 (trial version) with the Enhanced Sankey Plot extension, was used to display the interactions among cultivation systems and fish species.
Our search yielded 1267 papers; 65 were duplicated, and 1112 papers were rejected. Of these, 606 papers did not focus on freshwater fish cultivation, and within fish aquaculture, 506 papers did not follow the inclusion criteria and were classified as follows: focusing on the biology of the fish rather than on the nutrient budget (113), aquaculture not involving fish (85), papers on marine or brackish systems (81), papers without original data (224), and aquaculture carried out in freshwater systems other than excavated earthen ponds (e.g., reservoirs, rivers, or natural lakes) (19). Finally, we also excluded papers in which the input data were based solely on qualitative data obtained from interviews (two) that were not included in our review.
We retrieved data on carbon, nitrogen, and phosphorus fluxes from the various sources (inputs) as well as the different losses (outputs). Next, we calculated the contribution of different nutrient sources to the total nutrient input to the fishponds and the contribution of the different output terms to the total output. As water used to fill the ponds can be an important nutrient source, we accounted for rainwater and inlet water separately. Inlet water can include more diverse sources, including runoff, groundwater, rivers, streams, lakes, irrigation canals, effluents from mines, reservoirs and other fishponds, and domestic sewage.
Furthermore, we give an overview of the multiple nutrient loss pathways. Particulate matter entering the ponds, including organic and inorganic matter in the inlet water, uneaten feed, feces, within-pond primary production, as well as leaves and other material falling into the water, may settle at the pond bottom. When sedimentation rates are higher than sediment mineralization, this leads to the accumulation of organic matter in the pond bottoms. We also identified pathways that were often not quantified (e.g., infiltration and gas efflux). Gas efflux can be measured as ammonia volatilization and diffusive and ebullitive pathways of nitrogen and carbon.
We pay special attention to the assimilation of nutrients by the cultivated species, as this is the targeted endpoint of the nutrients added to the fishponds and ultimately impacts its marketability and the sustainability of the aquaculture practice. We did not include studies where, besides harvested fish, no other output terms were quantified because the lack of data on output terms inhibits the calculation of the percentage of the total nutrient output ending up in the fish.
We present input and output rates in kg ha−1 day−1 and the percentages of the different budget terms with respect to the total carbon (C), nitrogen (N), and phosphorus (P) input or output. Finally, the budget is presented as ranges to reflect the data variability obtained from different fish cultivation systems. It is important to note that these ranges are intended to be considered independently as they highlight the spectrum of the values for each element (C, N, and P) registered in various fish cultivation conditions.

3. Results

3.1. Paper Selection and Nutrient Budget

A total of 74 papers reported the cultivated fish species, provided the nutrient data from some of the pond’s budget terms, or reported the whole nutrient budget of carbon, nitrogen, or phosphorus. Of the assessed papers, the majority (51) did not report some nutrient input and output pathways. In the 23 papers that reported a complete or nearly complete nutrient budget, feed (in twenty papers), fertilizer (in nineteen papers), inlet water (in fifteen papers), and stocked fish (in ten papers) were the inputs quantified in most of the papers, while precipitation and gas influx were reported in only four papers each. Regarding the outputs, the main reported components were outlet water (in eighteen papers), harvested fish (in twenty-two papers), and sedimentation (in fifteen papers), while fewer studies reported infiltration and gas efflux (four) (Figure 2 and Table S1 for more details).
Our search yielded papers from 25 countries, of which India (ten), Brazil (nine), and China (nine) were the countries with more publications. The country where most studies reported complete or near complete nutrient budgets was Brazil (five) (Figure 3).

3.2. Fishpond and Cultivation Characteristics

In four of the seventy-four assessed papers, the authors referred to the fish production they studied as being ‘extensive’; in nine papers, the production was ‘semi-intensive’; and in seven papers, the production was considered to be intensive, while fifty-four papers did not report the type of production (Table S2). In extensively managed fishponds, average fish yields ranged from 38 to 584 kg ha−1; in semi-intensive production, yields ranged from 755 to 13,312 kg ha−1; and in intensive production, yields ranged from 53 to 43,358 kg ha−1. The lowest value from intensive production was due to the low cultivation period (73 days).
The 74 papers collectively recorded a total of forty-seven fish species and two species of prawn cultivated together with fish. Of the 47 fish species, only 14 were studied in more than two papers. These species were cultivated in polyculture, monoculture, and integrated systems (Figure 4). Differently from monoculture and polyculture, in which the main produced species are fish, the integrated systems combine different activities—e.g., agriculture and fish farming—where the output of one component is utilized as input for the other to maximize productivity and reduce environmental impacts.
Examples of integrated systems in our database were agriculture–aquaculture (IAA) that included farming of rice and fish [12], agricultural residues applied to ponds and pond water used for irrigation [13], and soybean cultivation within the dry pond and later used in feed formulation [14]. Integrated cultivation systems were also reported as integrated multi-trophic aquaculture (IMTA), which combines fed species (commonly finfish) with an extractive species (e.g., filter-feeders such as fish or prawns) reared in the same pond or in enclosures (cage-culture) [15] and in-pond raceways [16]
The species Oreochromis niloticus and Cyprinus carpio were the most cultivated species, reported in 30 and 19 papers, respectively, and were cultivated in monoculture, polyculture, and integrated cultivation systems. In IMTA, the fish species Catla catla, Labeo rohita, Cirrhinus mrigala [17,18], Mugil cephalus, Ctenopharyngodon idella, Hypophthalmichthys molitrix [19], and Oreochromis niloticus [20] were cultivated with the prawn species Macrobachium rosenbergii. The prawn species Macrobachium amazonicum, in turn, was only reported in Brazilian aquaculture and was cultivated in Oreochromis niloticus [21,22,23] and Colossoma macropomum ponds [24,25,26].

3.3. Nutrient Input in Fishponds

3.3.1. Precipitation

Out of the 23 papers that reported the nutrient input, 15 quantified and reported the input via precipitation. Most of these papers reported only one nutrient. Two papers accounted for nitrogen and phosphorus, and two papers included carbon, nitrogen, and phosphorus in precipitation in their budgets. These studies provide insights into the contribution of precipitation to the overall input of nutrients. Investigations conducted in Indonesia [27] and Vietnam [13] assumed that precipitation made a negligible contribution to the budget and, hence, was not included in the budget. Studies conducted in Brazil, China, and the USA indicated that rainwater accounted for less than 5% of the total inputs for carbon, nitrogen, or phosphorus (Table 1). Besides the low concentration of C, N, and P in precipitation, it was not the primary water supply in these systems, further explaining the low contribution to total nutrient input.
In Indian fish farms, the precipitation accounted for approximately 0.5% of the total organic carbon, while the contribution of nitrogen and phosphorus was found to be less than 0.10% of the total input [18]. In Indian ponds, where precipitation was not the main source but was responsible for 20% of the ponds’ water supply, it registered a participation of 4% in the total nitrogen input [28].

3.3.2. Inlet Water

Of the twenty-three papers, five did not report the water source, and although they were included in the budget, the main water source was not specified in one of the studies that reported the budget [17]. Nonetheless, in this case, the contribution of inlet water to the budget was less than 5% of the total inputs (Table 2). Particularly, studies that reported a substantial contribution of inlet water to the total input mentioned the specific water source.
Studies on Brazilian fishponds reported a high share of the nutrients being supplied by the inlet water, along with which source was a reservoir that received effluents from other animals’ cultivation. Thus, for phosphorus, there were shares of 26% [22] to 37% [26]; for nitrogen, there were shares of 29% [21] and 58% and [24]; and for carbon, 32% were found [25]. Notably, the highest percentage of P (72%) was reported in fishponds receiving loads from the watershed, which included animal slurry and wastewater from treatment plants [32].

3.3.3. Gas Influx

Six of the papers in our database reported gas fluxes, of which one reported the influx of CO2 and CH4, and five papers reported N2 fixation. Carbon influx through photosynthesis accounted for 3.5% of the carbon input in ponds in integrated polyculture in-pond raceways in the USA [16]. In integrated ponds of Colossoma macropomum cultivation with Macrobachium amazonicum, the reported CO2 influx corresponded to 12%, while CH4 contributed to only 0.2% of the total input [25] (Table 3).
In the same cultivation system, 0.2% of the total N input was through N2 absorption [24]. For integrated Oreochromis niloticus ponds, N2 absorption was more important (>1.2%) [21], while in Micropterus salmoides monoculture cultivation ponds, a lower contribution was reported (0.05%) [31].

3.3.4. Stocked Fish

Stocked fish was included in the budget of 15 of the 23 papers that reported the budget and often represented a minor fraction of the total nutrient input in fishponds (Table 4). Generally, the weight of stocked fish (1.7–10 g per individual) is much lower compared to their final weight (180-786 g per individual). In this case, the stocked fish accounts only for a minor portion of the total carbon input (<1%) [25,31], 3% of the total phosphorus, and 5% of the total nitrogen.
In cases where the stocked fish already have a high initial weight and do not grow a lot during the cultivation period (e.g., in [15], where the initial weight was 44 g, which increased to 104 g at the end of the 73 days lasting cultivation period), the contribution of stocked fish to the total phosphorus inputs was considerably higher (26%). On other occasions, the relatively high contribution of stocked fish to the total N and P input quantified was caused by disregarding one or more other N and P input pathways [33,36].

3.3.5. Feed and Fertilizers

In the 23 budgeted papers we assessed, the feed application was mentioned in 20 papers and included a variety of feed types, including commercial feed (manufactured pellets), fish, cereals (wheat, rice, or maize bran), and plant components (plant wastes and crops residues). In some cases, specific feed was formulated to test the effect of different ingredients and dosages on fish growth (Table 5). Nonetheless, among the papers that quantified the amount of C, N, and P input via feed, the most common type of feed used was commercial feed. Low contribution of feed to the carbon inputs (<35%) was found in four of the assessed papers in different cultivation systems and species [13,16,25,31]. A contribution of up to 95% was reported in studies in polyculture carp ponds (Catla catla, Labeo rohita, and Cirrhinus mrigala) [17,18]. Overall, the contribution of fertilizer to the inputs of carbon was less than 10%, except for the integrated (IAA) fishponds, where fertilizer was composed of excreta and crop residues, accounting for 65% of the C input.
Lower contribution (<30%) to the inputs of nitrogen was registered in a few studies, either receiving commercial feed [24], rice bran, or mustard oil cake [37]. Contribution of over 50% of the nitrogen inputs was commonly registered across different studies, using commercial feed, fish, or wheat as feed sources or in fertilized ponds. As for phosphorus, the lowest contribution of feed was already around 50% of the inputs [14], and the contribution of more than 70% was registered in many of the assessed papers.

3.4. Nutrient Output in Fishponds

3.4.1. Infiltration

Nutrient (N, P, and/or C) loss through infiltration was reported in four of the twenty-three assessed papers that reported the nutrient budget. Either it was calculated assuming the same nutrient concentration in pond water multiplied by the volume of infiltrated water [13,29] or—in the case of N—based on a laboratory essay using sediment cores, where the flux of nitrate and ammonia through the sediment column was measured [28,31].
In three of the four studies in which the loss of nutrients through the pond bottom was assessed, the contribution of infiltration to the total output in the different studies was no more than 1% of carbon [16,31], nitrogen [28,31], and phosphorus [31] (Table 6). In one study, higher values of N (3%) and P (14%) were registered. As infiltration was calculated as having the same concentration as pond water, the water column had a very high concentration of nutrients due to consistent chicken manure fertilization [29].

3.4.2. Outlet Water

Draining the ponds is the first step of fish harvesting, and depending on the pond size, depth, and shape, the process can be complex, requiring more than a hundred days to be completed in larger ponds [39]. Considering that about 90 to 92% of the pond water is flushed out [13,18] and that the generally high nutrient concentrations in the pond water further increase during the emptying and harvesting process as a result of resuspension [40], this flux can be an important component of the overall nutrient budget. Thus, the nutrient in outlet water was accounted for in the budget of 17 of the 23 assessed papers.
Overall, the contribution of outlet water to the total output of C was low, accounting for no more than 1.5%, as observed in different studies (Table 7). However, higher values were observed in integrated (IMTA) fishponds, where the outlet water contributed 7% to the outputs [25]. In other integrated cultivation systems (IAA) with high-water-exchange ponds, the contribution reached up to 16% of the outputs [13].
The contribution of outlet water to the total N output varies widely, with contributions lower than 15% found in several studies. The contribution of outlet water to the total N output is highest (61 and 76%) in ponds in which the water is flushed out (i.e., replaced by inlet water) during the production cycle [13,36]. As for P, outlet water accounted for less than 1% of the total outputs in studies conducted in polyculture carp ponds (Catla catla, Labeo rohita, Cirrhinus mrigala, and Hypothalmichthys nobilis) [17,18,30] and in Osphronemus goramy ponds [27]. In general, the water outlet was responsible for less than 10%, whereas the highest contributions of outlet water to the total P output were within the range of 33 to 55%.
The highest contribution of outlet to the total output of P and N was found in a system where effluents from other fish production (nutrient-rich inlet water) in Cyprinus carpio cultivation were used [33]. Here, the outlet water was the main output of N and P. In this study, only two output terms were reported (i.e., harvested fish and outlet water), which may have inflated the percentage of nutrients being flushed out if other important output terms had been missed. It is likely, however, that the water outlet is indeed an important output term as these study systems were constantly flushed, which contrasts with systems in which the water is drained only at the end of the cultivation period.

3.4.3. Gas Efflux, Ammonia Volatilization and Denitrification

Out of the twenty-three papers reviewed, eight focused on evaluating the nutrient release through gas efflux. Five studies have examined the nitrogen efflux, while only three assessed the carbon efflux. Other than respiration, carbon gaseous fluxes, such as CO2 and CH4, were often neglected in the past, as they were perceived to have minimal impact on the pond’s carbon budget at the time [38]. Within the examined literature, nitrogen gas forms were quantified through denitrification and ammonia volatilization, while diffusive and ebullitive pathways were utilized to measure nitrogen (N2) and carbon compound emissions (Table 8). Despite the relevance of N2O for climate change, the quantification was not found in the assessed papers.
Ammonia volatilization and denitrification were assumed to be negligible, hence not quantified in manured ponds, and were associated with very low concentrations of nitrate, nitrite, and total ammonia in the pond water [29]. In polyculture, aerated carp ponds (Channa arguss and Hypothalmichthys nobilis), ammonia volatilization contributed less than 1% of the outputs [30]. Also, low contribution (<3%) was also found in Micropterus salmoides aerated ponds [31]. Ammonia volatilization contribution to the budget was higher (12.5%) in Ictalurus punctatus, and together with denitrification (17% of the outputs), the gas efflux was the second major nitrogen output in this study [28].
When considering both N2 diffusion and ebullition in integrated ponds of Orechromis niloticus, they collectively accounted for 32% of the total outputs [21]. However, a clearer understanding of each contribution emerged when the efflux pathways were reported separately. It was evident that diffusion played a minor role compared to ebullition, which alone constituted 52% of the total outputs in Colossoma macropomum ponds [24]. Similarly, in these systems, carbon emissions were assessed through the ebullition and diffusion of CO2 and CH4, contributing no more than 3.5% to the overall outputs [25]. Notably, diffusive fluxes of CO2 were significantly higher than those of CH4.
Some studies addressed carbon efflux as respiration, accounting for 26% of the outputs [16] considering water, fish, and benthic respiration together. Water respiration, together with fish respiration, also accounted for an important output of carbon (40%) [38].

3.4.4. Harvested Fish

Although several studies did not report nutrient budgets, fish yields were reported in most studies in different contexts. Among the 74 papers assessed, 68 provided data on fish production (see Table S1), with 23 of these studies offering insights into the contribution of fish to nutrient outputs (Table 9). Less than 12% of the C entering the systems was assimilated by the fish in manured ponds [41], integrated ponds [13,25], in-pond raceway systems [16], intensive ponds [38], polyculture ponds [17], and intensive monoculture ponds [31]. The highest share of carbon ending up in harvested fish was less than 20%. These relatively high shares were reported for integrated cultivation systems in India [18].
The contribution of N was found to be less than 20% of the total output in integrated systems [13,24], in polyculture ponds [37], in chemically and organically fertilized ponds [41], in monoculture of Osphronemus goramy ponds [27], and in Oreochromis niloticus monoculture ponds [29]. A contribution of over 20% was reported in integrated ponds in Brazil [21], in Ictalurus punctatus (31%) [28], in polyculture ponds (38.5%) [30], in integrated ponds in India (44%) [18], and in Micropterus salmoides ponds (44%) [31].
The contribution of harvested fish was less than 10% to the P output, registered only in the monoculture of Osphrenemus goramy (3%) [27] and in integrated ponds (4%) [13]. No more than 20% of P assimilation was found in several integrated systems and monoculture ponds [29]. Contrasting to these results, the highest P assimilation percentages were obtained in intensive Carassius carassius integrated systems (enclosure) (41%) [15] and in integrated (pen–cum–pond) systems for Oreochromis niloticus and hybrid catfish cultivation (59%) [35].
While the majority of papers report FCRs within the expected low ranges for fish production, some studies documented high values. Among the lowest contribution of harvested fish to the total output, the FCR found in Micropterus salmoides fed with iced fish [31] was relatively higher than those reported in other studies of our dataset (3.9), but high FCRs are already expected in carnivorous fish production. However, an FCR of 12.4 was reported in Catla catla, Labeo rohita, and Labeo calbasu in Bangladeshi ponds, fed with rice bran and mustard oil cake [37]. The high FCR suggests that filter-feeding species benefited more from the fertilizers (as shown in Table 5) than the feed applied into the ponds. The low contribution of harvested fish to the total output, juxtaposed with high FCR, provides insight into reduced feed efficiency attributed to feed types introduced into the ponds (e.g., raw plant materials versus commercial diet), as well as the varying abilities of species to assimilate these nutrients into biomass.

3.4.5. Sedimentation

Sedimentation was evaluated in 15 of the 23 budget studies (Table 10). Only three studies evaluated the relative importance of sedimentation for C, N, and P [13,17,31]. Based on the studies in our dataset, the percentages of C, N, and P varied widely among and within cultivation systems. Carbon sedimentation contributed between 9 and 81% of the total carbon output (Table 10). The lowest contribution was reported in a study conducted in an in-pond raceway polyculture pond, where carbon sedimentation represented only 9% of the total output, representing the third major carbon loss in the studied system [16]. In the intensive monoculture of Micropterus salmoides, sediment accumulation was the second main carbon output, contributing an average of 16% to the total output. Here, the relatively low sedimentation rate was related to the presence of eco-substrates placed in different depths below the water surface, trapping suspended organic matter, hence decreasing the settlement [31]. On the other end of the spectrum are integrated cultivation systems where carbon sedimentation contributes more than 60% to the total output. In integrated fishponds (IAA), 81% of the C output accumulated in the sediment due to high organic matter from the human excreta and the crop residues that were added to the ponds as fertilizers [13].
Sedimentation was also an important sink for N, representing 19 to 60% of the total output. The lowest contribution was found in Colossoma macropomum ponds cultivated together with prawns [24]. As for P sedimentation, it represented 24 to 82% of the total output. However, percentages above 60% were observed in ponds that had substrates for periphyton growth placed in the water column—e.g., bamboo, geotextile, and Aquamat® [22,31]. Similarly, in fish cultivated with prawns (IMTA) and in monoculture ponds, it accounted for a high share of total P output [17,18,27].

3.5. Gaps in the Nutrient Budget

The difference between the total output and input can be related to inaccuracies in assessments of individual budget terms or to the fact that some nutrient fluxes were not considered. Only 10 of the 23 papers that reported a total budget also specifically mentioned the unaccounted portion.
In the studies where the estimated nutrient output was considerably smaller than the total input, this was attributed to missing input components, for instance, the introduced small fish and the influx of leaves and flowers, dust, and birds’ feces [22]. When the total output was higher than the inputs, the authors mentioned overestimation of sedimentation [21], denitrification [17,18,31], loss to the groundwater and harvest of periphyton [30], nutrients in the outlet water [27], and the nutrient retained in the ponds [24]. Another possible reason that led to the unbalance between inputs and outputs could be the non-inclusion of inlet and outlet water when calculating the final balance [25].

4. Discussion

A comparison of nutrient budgets and individual fluxes using data from around the world can be complex, but it gives insight into how FCRs, as well as “waste flows”, including sedimentation, surface water outflow, and gaseous emissions, vary among fish species, pond systems, and management practices. This type of analysis is urgently needed to make fish production more sustainable. Yet, global analyses are challenging due to differences in data availability and quality, with some budgets being more complete than others. We argue that despite variations in the available data across studies, comparisons are insightful when data quality and sampling methodologies are considered. Certainly, the most sustainable practice in one region may not be directly applicable to other regions due to factors beyond the control of the fish farmer, including climate, geology, hydrology, and land use practices. In addition, socio-economic and cultural factors can lead to a high variation in fish production strategies (e.g., labor, resources available, fish species suitable for the climatic region). Nonetheless, we deem it important to increase knowledge about the input and fate of nitrogen, phosphorus, and carbon in fish cultivation systems to further increase their environmental sustainability in the sense that FCRs are optimized and pollution of the environment is minimized. Below, we discuss the major input and output terms and highlight sustainable management techniques related to the different nutrient fluxes.

4.1. Inputs

Feed and fertilizers represented the most substantial nutrient input (often >70% of the total input) (Figure 5). Management malpractices such as overfeeding and overfertilization can increase the contribution of these budget terms to the total nutrient budgets and even more to financial costs. When feed is the primary source of nutrient supplementation, overfeeding can be mitigated simply through improved record-keeping practices and enhanced farmer training [42].
Depending on fishpond management, CO2 uptake due to photosynthetic activity can be an important budget term, particularly in fertilized systems [25]. Uptake of N2 and CH4 contributed little to the total N and C input. Even though many studies did not report the water source, studies that did assess it found substantial contributions of inlet water to the total nutrient input. This was particularly the case in Brazilian fishponds that were supplied with nutrient-rich inlet water. This nutrient-rich water was referred to as “a source of unpaid nutrients” [21]. Its use could exempt the use of supplemental feed and fertilizers [43] and can, therefore, be seen as contributing to the environmental sustainability of fish production.
Depending on the hydrology of fishponds, precipitation can be an important component of a pond’s water budget. However, it was generally a minor component of the nutrient budget. Although it may be an important source of N in oligotrophic aquatic systems, this is not the case for generally nutrient-rich fishponds [44]. The relevance of precipitation for C and P input to the systems reviewed here was even lower.
Advancing the knowledge of fish physiology and growth can contribute to optimizing feed input in aquaculture pond systems. Improvements are also being made through the optimization of the FCR by using species-specific feed formulation. Breeding programs for higher feed efficiency (i.e., lower FCRs) of genetically improved rainbow trout resulted in the reduction of feed costs by 18%, and the low FCR led to 18.3% less nitrogen and phosphorus load into the aquatic environment [45]. A decrease in the FCR by 27% for trout, for instance, may reduce the environmental impact of trout cultivation on eutrophication, acidification potential, and global warming by 16–27% [46].

4.2. Outputs

Fish are the targeted endpoint for the nutrients added to the aquaculture ponds; hence, they are generally responsible for a considerable share of the output. Our review, however, shows that the share of nutrients ending up in the harvested fish varies considerably within and among cultivation systems. Harvested fish were reported in most of the assessed studies, indicating their importance in the overall studies on nutrient dynamics or growth performance. The contribution of harvested fish to the nutrient outputs in aquaculture systems in the assessed papers varied depending on factors such as pond management practices (e.g., feed type, species composition, and cultivation methods). In either monoculture, polyculture, or integrated systems, no more than 20% of the carbon was harvested as fish. Although nitrogen and phosphorus had higher percentages (>70%) in one study, the majority of the papers reported no more than 45% of the nitrogen as fish, and the phosphorus assimilated by the fish biomass was generally less than 45%.
The pond’s bottom was found to often be the second most important endpoint of nutrients, with up to >80% of C, N, and P ending up there. However, the variation among aquaculture systems was large, particularly in the high-water-exchange ponds where nutrient retention in the sediment was considerably lower. Only a few studies included the loss of nutrients from the sediment during water drawdown and fishing phases [47]. The nutrients that become mobilized and flushed out transform the fishponds into significant sources of nutrients for downstream aquatic systems [32].
Particularly in ponds with a high water exchange rate, outflow was an important non-targeted endpoint of nutrients [28]. In cultivation systems where low or no water exchange is practiced, the loss of nutrients to downstream waters is low [18,34]. Noteworthy is that even when water exchange during cultivation is low, nutrients may still be flushed out during the harvesting phase when ponds are drained. Part of the nutrients accumulated in the pond sediments throughout the whole cultivation period may then be flushed out due to resuspension [29,32].
Nutrient-rich sediments offer a viable option for growing crops within the ponds during the dry phase [14], used as fertilizer and soil conditioner in plant culture, and also in non-aquaculture agriculture activities [47]. This approach not only optimizes nutrient utilization for fish farmers who also engage in agriculture but also benefits the environment by minimizing the release of nutrients into water bodies and the atmosphere. New studies should incorporate sediment as indicators to assess the sustainability of fish farming, particularly in instances where there is a significant influx of nutrients from feed and fertilization methods.
While infiltration may contribute to water and nutrient losses from fishponds, it was generally not quantified, and when it was, the loss of nutrients through leakage towards the groundwater had a minor contribution to the outputs.
The reported denitrification and ammonia volatilization varied depending on pond management practices and species composition, but overall, their contribution to the total output was minor. N2 efflux was measured only in a few studies [21,24] and was found to be emitted more through ebullition rather than diffusion. Diffusive fluxes were also the main ways of CO2 emission, but CH4 was more emitted through ebullition. Both pathways had minor contribution to the output (<1.5%) [25]. Nevertheless, from an environmental sustainability perspective, these emissions are very important [9,10]. It is also noteworthy that those values represent the emissions during the cultivation period, and the lack of investigation during other stages of the production cycle, i.e., pre-stocking phase fishless, after pond draining, and dry pond can lead to uncertainties on the overall greenhouse gas emissions [9].

5. Conclusions

Our review highlights several gaps in reporting nutrient budget terms, and we therefore call for more comprehensive studies on nutrient budgets. Efforts should prioritize input and output terms with high contributions to the total budget. More efficient feeding and fertilization decreases the contribution of these input terms to the total inputs and optimizes the feed conversion ratio. Furthermore, when important nutrient sources other than feed or fertilizers are identified (e.g., nutrient-rich inlet water), the input of feed and fertilizer may be reduced in the case of some species (e.g., filter-feeder species). Additionally, cultures integrating fed and extractive organisms can further increase nutrient assimilation.
Outlet water and sediment are potential sources of contamination of the environment. On the other hand, nutrient-rich sediments and water offer a viable option for crop fertilization, increasing the nutrient use efficiency. As nutrients in the fishpond sediment can also significantly impact greenhouse gas emissions, not only when the ponds are full but also during dry phases and after being deposited elsewhere, recognizing that gas efflux is a crucial pathway for nutrient loss is crucial for understanding environmental impacts reaching further than the local environment. Overall, insight into the full nutrient budget of an aquaculture system facilitates the formulation of best management practices with effective strategies for sustainable aquaculture.

Supplementary Materials

The following supporting information can be downloaded at https://www.mdpi.com/article/10.3390/app14146056/s1. Table S1: Compartments evaluated in each of the studies that reported the budget of C, N, or P. Table S2. Cultivation system characteristics in the 74 assessed papers. I: integrated cultivation systems; P: polyculture; M: monoculture; TSP: triple superphosphate; n.r.: not reported.

Author Contributions

Conceptualization, E.S.O.-J., C.C.M. and S.K.; methodology, A.P.D.B.; validation, S.K. and E.S.O.-J.; formal analysis, A.P.D.B.; resources, C.C.M.; data curation, A.P.D.B.; writing—original draft preparation, A.P.D.B.; writing—review and editing, S.K., C.C.M. and E.S.O.-J.; visualization A.P.D.B. and S.K.; supervision, S.K., E.S.O.-J. and C.C.M.; project administration, C.C.M.; funding acquisition, C.C.M. All authors have read and agreed to the published version of the manuscript.

Funding

The first author is funded by CAPES (Fundação Coordenação de Aperfeiçoamento de Pessoal de Nível Superior), grant number 88887.610401/2021-00.

Institutional Review Board Statement

Not applicable.

Informed Consent Statement

Not applicable.

Data Availability Statement

Not applicable.

Acknowledgments

We are thankful to the Public Ministry of Mato Grosso State for the infrastructure used in the development of this study.

Conflicts of Interest

The authors declare no conflicts of interest.

References

  1. FAO. The State of World Fisheries and Aquaculture—Towards Blue Transformation; FAO: Rome, Italy, 2022; p. 236. [Google Scholar]
  2. Ahmed, N.; Thompson, S. The blue dimensions of aquaculture: A global synthesis. Sci. Total Environ. 2019, 652, 851–861. [Google Scholar] [CrossRef]
  3. de Boer, J.; Schösler, H.; Aikinga, H. Fish as an alternative protein—A consumer-oriented perspective on its role in a transition towards more healthy and sustainable diets. Appetite 2020, 152, 104721. [Google Scholar] [CrossRef]
  4. Fry, J.P.; Mailloux, N.A.; Love, D.C.; Milli, M.C.; Cao, L. Feed conversion efficiency in aquaculture: Do we measure it correctly? Environ. Res. Lett. 2018, 13, 024017. [Google Scholar] [CrossRef]
  5. Talbot, C.; Hole, R. Fish diets and the control of eutrophication resulting from aquaculture. J. Appl. Ichthyol. 1994, 10, 258–270. [Google Scholar] [CrossRef]
  6. Montanhini Neto, R.; Ostrensky, A. Nutrient load estimation in the waste of Nile tilapia Oreochromis niloticus (L.) reared in cages in tropical climate conditions. Aquac. Res. 2015, 46, 1309–1322. [Google Scholar] [CrossRef]
  7. Lin, C.K.; Yi, Y. Minimizing environmental impacts of freshwater aquaculture and reuse of pond effluents and mud. Aquaculture 2003, 226, 57–68. [Google Scholar] [CrossRef]
  8. Valenti, W.C.; Kimpara, J.M.; Preto, B.d.L. Measuring aquaculture sustainability. World Aquac. 2011, 42, 26–30. [Google Scholar]
  9. Kosten, S.; Almeida, R.M.; Barbosa, I.; Mendonca, R.; Santos Muzitano, I.; Sobreira Oliveira-Junior, E.; Vroom, R.J.E.; Wang, H.J.; Barros, N. Better assessments of greenhouse gas emissions from global fish ponds needed to adequately evaluate aquaculture footprint. Sci. Total Environ. 2020, 748, 141247. [Google Scholar] [CrossRef]
  10. Yuan, J.; Xiang, J.; Liu, D.; Kang, H.; He, T.; Kim, S.; Lin, Y.; Freeman, C.; Ding, W. Rapid growth in greenhouse gas emissions from the adoption of industrial-scale aquaculture. Nat. Clim. Chang. 2019, 9, 318–322. [Google Scholar] [CrossRef]
  11. Soto, D.; Aguilar-Manjarrez, J.; Brugère, C.; Angel, D.; Bailey, C.; Black, K.; Edwards, P.; Costa-Pierce, B.; Chopin, T.; Deudero, S.; et al. Applying an Ecosystem-Based Approach to Aquaculture: Principles, Scales and Some Management Measures; FAO Fisheries and Aquaculture Proceedings: Palma de Mallorca, Spain, 2007; pp. 15–35. [Google Scholar]
  12. Yaobin, L.; Lin, Q.; Fengbo, L.; Xiyue, Z.; Chunchun, X.; Long, J.; Zhongdu, C.; Jinfei, F.; Fuping, F. Impact of Rice-Catfish/Shrimp Co-culture on Nutrients Fluxes across Sediment-Water Interface in Intensive Aquaculture Ponds. Rice Sci. 2019, 26, 416–424. [Google Scholar] [CrossRef]
  13. Nhan, D.K.; Verdegem, M.C.J.; Milstein, A.; Verreth, J.A.V. Water and nutrient budgets of ponds in integrated agriculture-aquaculture systems in the Mekong Delta, Vietnam. Aquac. Res. 2008, 39, 1216–1228. [Google Scholar] [CrossRef]
  14. Ofor, C.O. A comparison of the yield and yield economics of three types of semi-intensive grow out systems, in the production of Heterobranchus longifilis (Teleostei: Clariidae) (Val. 1840), in Southeast Nigeria. Aquaculture 2007, 269, 402–413. [Google Scholar] [CrossRef]
  15. Sun, Y.; Chen, M.; Kong, C.; Tang, H.; Gan, L.; Zhang, M. Enclosure experiment of effects of dietary phosphorus level on water quality, phosphorus budget, and plankton composition in intensive culture of crucian carp. Aquac. Int. 2016, 25, 1145–1158. [Google Scholar] [CrossRef]
  16. Brown, T.W.; Boyd, C.E.; Chappell, J.A. Organic Carbon and Dissolved Oxygen Budgets for a Commercial-Size, In-pond Raceway System. J. World Aquac. Soc. 2015, 46, 539–548. [Google Scholar] [CrossRef]
  17. Adhikari, S.; Sahu, B.C.; Dey, L. Nutrients budget and effluents characteristics in polyculture of scampi (Macrobrachium rosenbergii) and Indian major carps ponds using organic inputs. Water Sci. Technol. 2012, 66, 1540–1548. [Google Scholar] [CrossRef]
  18. Sahu, B.C.; Adhikari, S.; Mahapatra, A.S.; Dey, L. Nitrogen, Phosphorus, and Carbon Budgets in Polyculture Ponds of Indian Major Carps and Giant Freshwater Prawn in Orissa State, India. J. Appl. Aquac. 2015, 27, 365–376. [Google Scholar] [CrossRef]
  19. Costa-Pierce, B.A.; Clay, L.; Malecha, S.R.; Laws, E.A. Polyculture of Chinese carps and prawns at commercial densities and reduced feeding rates I. Water and sediment microbial ecology. J. World Aquac. Soc. 1984, 15, 367–390. [Google Scholar] [CrossRef]
  20. Uddin, M.S.; Azim, M.E.; Wahab, M.A.; Verdegem, M.C.J. Effects of substrate addition and supplemental feeding on plankton composition and production in tilapia (Oreochromis niloticus) and freshwater prawn (Macrobrachium rosenbergii) polyculture. Aquaculture 2009, 297, 99–105. [Google Scholar] [CrossRef]
  21. David, F.S.; Proença, D.C.; Valenti, W.C. Nitrogen budget in integrated aquaculture systems with Nile tilapia and Amazon River prawn. Aquac. Int. 2017, 25, 1733–1746. [Google Scholar] [CrossRef]
  22. David, F.S.; Proença, D.C.; Valenti, W.C. Phosphorus Budget in Integrated Multitrophic Aquaculture Systems with Nile Tilapia, Oreochromis niloticus, and Amazon River Prawn, Macrobrachium amazonicum. J. World Aquac. Soc. 2017, 48, 402–414. [Google Scholar] [CrossRef]
  23. Rodrigues, C.G.; Garcia, B.F.; Verdegem, M.; Santos, M.R.; Amorim, R.V.; Valenti, W.C. Integrated culture of Nile tilapia and Amazon river prawn in stagnant ponds, using nutrient-rich water and substrates. Aquaculture 2019, 503, 111–117. [Google Scholar] [CrossRef]
  24. Flickinger, D.L.; Costa, G.A.; Dantas, D.P.; Moraes-Valenti, P.; Valenti, W.C. The budget of nitrogen in the grow-out of the Amazon river prawn (Macrobrachium amazonicum Heller) and tambaqui (Colossoma macropomum Cuvier) farmed in monoculture and in integrated multitrophic aquaculture systems. Aquac. Res. 2019, 50, 3444–3461. [Google Scholar] [CrossRef]
  25. Flickinger, D.L.; Costa, G.A.; Dantas, D.P.; Proença, D.C.; David, F.S.; Durborow, R.M.; Moraes-Valenti, P.; Valenti, W.C. The budget of carbon in the farming of the Amazon river prawn and tambaqui fish in earthen pond monoculture and integrated multitrophic systems. Aquac. Rep. 2020, 17, 100340. [Google Scholar] [CrossRef]
  26. Flickinger, D.L.; Dantas, D.P.; Proença, D.C.; David, F.S.; Valenti, W.C. Phosphorus in the culture of the Amazon river prawn (Macrobrachium amazonicum) and tambaqui (Colossoma macropomum) farmed in monoculture and in integrated multitrophic systems. J. World Aquac. Soc. 2019, 51, 1002–1023. [Google Scholar] [CrossRef]
  27. Pouil, S.; Samsudin, R.; Slembrouck, J.; Sihabuddin, A.; Sundari, G.; Khazaidan, K.; Kristanto, A.H.; Pantjara, B.; Caruso, D. Nutrient budgets in a small-scale freshwater fish pond system in Indonesia. Aquaculture 2019, 504, 267–274. [Google Scholar] [CrossRef]
  28. Gross, A.; Boyd, C.E.; Wood, C.W. Nitrogen transformations and balance in channel catfish ponds. Aquac. Eng. 2000, 24, 1–14. [Google Scholar] [CrossRef]
  29. Green, B.W.; Boyd, C.E. Chemical budgets for organically fertilized fish ponds in the dry tropics. J. World Aquac. Soc. 1995, 26, 284–296. [Google Scholar] [CrossRef]
  30. Zhang, K.; Xie, J.; Yu, D.-G.; Wang, G.-J.; Yu, E.-M.; Gong, W.-B.; Li, Z.-F.; Wang, C.-C.; Xia, Y. A comparative study on the budget of nitrogen and phosphorus in polyculture systems of snakehead with bighead carp. Aquaculture 2018, 483, 69–75. [Google Scholar] [CrossRef]
  31. Zhang, K.; Yu, D.; Li, Z.; Xie, J.; Wang, G.; Gong, W.; Yu, E.; Tian, J. Influence of eco-substrate addition on organic carbon, nitrogen and phosphorus budgets of intensive aquaculture ponds of the Pearl River, China. Aquaculture 2020, 520, 734868. [Google Scholar] [CrossRef]
  32. Potužák, J.; Duras, J.; Drozd, B. Mass balance of fishponds: Are they sources or sinks of phosphorus? Aquac. Int. 2016, 24, 1725–1745. [Google Scholar] [CrossRef]
  33. Hlaváč, D.; Anton-Pardo, M.; Másílko, J.; Hartman, P.; Regenda, J.; Vejsada, P.; Baxa, M.; Pechar, L.; Valentová, O.; Všetičková, L.; et al. Supplementary feeding with thermally treated cereals in common carp (Cyprinus carpio L.) pond farming and its effects on water quality, nutrient budget and zooplankton and zoobenthos assemblages. Aquac. Int. 2016, 24, 1681–1697. [Google Scholar] [CrossRef]
  34. Cang, P.; Zhang, M.; Qiao, G.; Sun, Q.; Xu, D.; Li, Q.; Yuan, X.; Liu, W. Analysis of Growth, Nutrition and Economic Profitability of Gibel Carp (Carassius auratus gibelio ♀ × C. carpio ♂) Cultured in Zero-water Exchange System. Pak. J. Zool. 2019, 51, 619–630. [Google Scholar] [CrossRef]
  35. Yi, Y.; Kwei Lina, C.; Diana, J.S. Hybrid catfish (Clarias macrocephalus × C. gariepinus) and Nile tilapia (Oreochromis niloticus) culture in an integrated pen-cum-pond system: Growth performance and nutrient budgets. Aquaculture 2003, 217, 395–408. [Google Scholar] [CrossRef]
  36. Hlaváč, D.; Másílko, J.; Hartman, P.; Bláha, M.; Pechar, L.; Anton-Pardo, M.; Adámek, Z. Effects of common carp (Cyprinus carpio Linnaeus, 1758) supplementary feeding with modified cereals on pond water quality and nutrient budget. J. Appl. Aquac. 2015, 31, 30–37. [Google Scholar] [CrossRef]
  37. Azim, M.E.; Verdegem, M.C.J.; Khatoon, H.; Wahab, M.A. A comparison of fertilization, feeding and three periphyton substrates for increasing fish production in freshwater pond aquaculture in Bangladesh. Aquaculture 2002, 212, 227–243. [Google Scholar] [CrossRef]
  38. Zur, O. Primary production in intensive fish ponds and a complete organic carbon balance in the ponds. Aquaculture 1981, 23, 197–210. [Google Scholar] [CrossRef]
  39. Banas, D.; Masson, G.; Leglize, L.; Usseglio-Polatera, P.; Boyd, C.E. Assessment of sediment concentration and nutrient loads in effluents drained from extensively managed fishponds in France. Environ. Pollut. 2008, 152, 679–685. [Google Scholar] [CrossRef] [PubMed]
  40. Schwartz, M.F.; Boyd, C.E. Channel Catfish Pond Effluents. Prog. Fish-Cult. 1994, 56, 273–281. [Google Scholar] [CrossRef]
  41. Schroeder, G.L.; Wohlfarth, G.; Alkon, A.; Halevy, A.; Krueger, H. The dominance of algal-based food webs in fish ponds receiving chemical fertilizers plus organic manures. Aquaculture 1990, 86, 219–229. [Google Scholar] [CrossRef]
  42. Chary, K.; van Riel, A.J.; Muscat, A.; Wilfart, A.; Harchaoui, S.; Verdegem, M.; Filgueira, R.; Troell, M.; Henriksson, P.J.G.; de Boer, I.J.M.; et al. Transforming sustainable aquaculture by applying circularity principles. Rev. Aquac. 2023, 16, 656–673. [Google Scholar] [CrossRef]
  43. Mishra, B.; Ayyappan, S.; Jena, J.K.; Priyambada, P.; Behera, P.K.; Aravindakshan, P.K.; Purushothaman, C.S. Carp polyculture in aquaculture sewage treatment plant and its impact on soil and water characteristics. Indian. J. Fish. 2009, 56, 271–276. [Google Scholar]
  44. Knud-Hansen, C.F.; Batterson, T.R.; McNabb, C.D.; Harahatb, I.S.; Sumantadinatab, K.; Eidmanb, H.M. Nitrogen input, primary productivity and fish yield in fertilized freshwater ponds in Indonesia. Aquaculture 1991, 94, 49–63. [Google Scholar] [CrossRef]
  45. Kause, A.; Nousiainen, A.; Koskinen, H. Improvement in feed efficiency and reduction in nutrient loading from rainbow trout farms: The role of selective breeding. J. Anim. Sci. 2022, 100, skac214. [Google Scholar] [CrossRef] [PubMed]
  46. d’Orbcastel, E.R.; Blancheton, J.-P.; Aubin, J. Towards environmentally sustainable aquaculture: Comparison between two trout farming systems using Life Cycle Assessment. Aquac. Eng. 2009, 40, 113–119. [Google Scholar] [CrossRef]
  47. Dróżdż, D.; Malińska, K.; Mazurkiewicz, J.; Kacprzak, M.; Mrowiec, M.; Szczypiór, A.; Postawa, P.; Stachowiak, T. Fish pond sediment from aquaculture production—Current practices and the potential for nutrient recovery: A Review. Int. Agrophys. 2020, 34, 33–41. [Google Scholar] [CrossRef]
Figure 1. Flow chart of the paper search, selection, and data extraction.
Applsci 14 06056 g001
Figure 2. Number of papers that reported specific nutrient input and output pathways in fishponds. C: papers evaluating only carbon; N: papers evaluating only nitrogen; P: papers evaluating only phosphorus; N+P: papers evaluating nitrogen and phosphorus; C+N+P: papers evaluating all three nutrients; CH4 + CO2: studies in which both gases were quantified; N2 + NH3: studies that quantified dinitrogen efflux and NH3 volatilization. n.r.: not reported in the budget.
Applsci 14 06056 g002
Figure 3. Assessed papers’ locations across the world. Dots indicate the studies’ locations, and triangles indicate the papers focusing on nutrient budget location.
Applsci 14 06056 g003
Figure 4. Most studied fish species and the corresponding cultivation systems in the assessed papers.
Applsci 14 06056 g004
Figure 5. Inputs and outputs of carbon, nitrogen, and phosphorus presented as the percentage of the total input and output, respectively. Data ranges are based on findings presented in the 23 assessed papers. Straight lines represent inputs of nutrients, and dashed lines represent output of nutrients. Wavy blue arrows represent gas influx, and wavy red arrows represent gas efflux.
Applsci 14 06056 g005
Table 1. Contribution of precipitation to the total input of carbon, nitrogen, and phosphorus and their average supply rates during the study period (kg ha−1 d−1). Values shown in the table are the mean of the values reported in the assessed papers. n.r.: not reported.
ReferenceLocationC (%)kg ha−1 d−1N (%)kg ha−1 d−1P (%)kg ha−1 d−1
[15]Chinan.r.n.r.n.r.n.r.0.090.001
[16]USA00n.r.n.r.n.r.n.r.
[18]India 0.50.060.080.0010.070.003
[21]Braziln.r.n.r.0.060.002n.r.n.r.
[22]Brazil n.r.n.r.n.r.n.r.0.50.004
[24]Braziln.r.n.r.0.90.02n.r.n.r.
[25]Brazil0.60.19n.r.n.r.n.r.n.r.
[26]Braziln.r.n.r.n.r.n.r.0.50.002
[28]USAn.r.n.r.40.07n.r.n.r.
[29]Hondurasn.r.n.r.0.60.010.10.001
[30]China n.r.n.r.0.50.0090.050.0002
[31]China0.060.050.110.010.080.001
Table 2. Contribution of inlet water to the total input of carbon, nitrogen, and phosphorus, along with their average supply rates during the study period (kg ha−1 d−1). Values shown in the table are the mean of the values reported in the assessed papers. n.r.: not reported.
ReferenceWater sourcesC (%)kg ha−1 d−1N (%)kg ha−1 d−1P (%)kg ha−1 d−1
[13]Irrigation canals, precipitation, and infiltration *74.3544.6100.3
[14]Streamn.r.n.r.n.r.n.r.0.30.001
[16]Precipitation, groundwater, and runoff00n.r.n.r.n.r.n.r.
[17]n.r.0.50.060.10.00090.070.0003
[21]Reservoirn.r.n.r.291n.r.n.r.
[22]Reservoirn.r.n.r.n.r.n.r.260.19
[24]Reservoirn.r.n.r.581n.r.n.r.
[25]Reservoir3210n.r.n.r.n.r.n.r.
[26]Reservoirn.r.n.r.n.r.n.r.370.11
[27]Reservoirn.r.n.r.60.60.10.004
[28]Main source n.r. and precipitationn.r.n.r.70.12n.r.n.r.
[29]Main source n.r. and precipitationn.r.n.r.40.0640.03
[30]Main source n.r. and precipitationn.r.n.r.10.010.40.001
[31]Main source n.r. and precipitation0.450.31.70.171.40.02
[32]Watershedn.r.n.r.n.r.n.r.720.0001
[33]Effluents from fish culturen.r.n.r.751.3550.12
[34]Water from fishpondn.r.n.r.n.r.n.r.10.01
[35]Effluents from fish culturen.r.n.r.10.20.20.006
* inlet water was the sum of all water sources.
Table 3. Contribution of gaseous C and N influx to the total input of carbon and nitrogen and its rates (kg ha−1 d−1). Values shown in the table are the mean of the values reported in the assessed papers. I: integrated cultivation systems and M: monoculture; n.r.: not reported.
ReferenceFish SpeciesCultivation SystemGasC (%)kg ha−1 d−1N (%)kg ha−1 d−1
[16]Ictalurus punctatus, hybrid channel catfish (Ictalurus punctatus
× Ictalurus furcatus), Polyodon spathula, Oreochromis niloticus
ICO23.58n.r.n.r.
[21]Oreochromis niloticusIN2n.r.n.r.10.04
[24]Colossoma macropomumI and MN2 n.r.n.r.0.20.02
[25]Colossoma macropomumI and MCO2
CH4
12
0.2
3.5
0.08
n.r.n.r.
[28]Ictalurus punctatusMN2n.r.n.r.0.050.003
[31]Micropterus salmoidesMN2n.r.n.r.0.055.5
Table 4. Contribution of stocked fish to the total input of carbon, nitrogen, and phosphorus and its rates (kg ha−1 d−1). Values shown in the table are the mean of the values reported in the assessed papers. n.r.: not reported.
ReferenceFish SpeciesC (%)kg ha−1 d−1N (%)kg ha−1 d−1P (%)kg ha−1 d−1
[14]Heterobranchus longifilis and Oreochromis niloticusn.r.n.r.n.r.n.r.20.006
[15]Carassius carassiusn.r.n.r.n.r.n.r.260.5
[16]Ictalurus punctatus, hybrid channel catfish, hybrid channel catfish (Ictalurus punctatus
× Ictalurus furcatus), Polyodon spathula, and Oreochromis niloticus
3.58n.r.n.r.n.r.n.r.
[21]Oreochromis niloticusn.r.n.r.10.04n.r.n.r.
[22]Oreochromis niloticusn.r.n.r.n.r.n.r.1.30.01
[24]Colossoma macropomumn.r.n.r.0.20.02n.r.n.r.
[25]Colossoma macropomum0.100.03n.r.n.r.n.r.n.r.
[26]Colossoma macropomumn.r.n.r.n.r.n.r.0.20.001
[27]Osphronemus goramyn.r.n.r.30.30.70.02
[28]Ictalurus punctatusn.r.n.r.20.04n.r.n.r.
[29]Oreochromis niloticusn.r.n.r.50.0520.02
[30]Channa arguss and Hypothalmichthys nobilisn.r.n.r.0.20.0030.10.0004
[31]Micropterus salmoides0.30.20.70.10.50.01
[33]Cyprinus carpion.r.n.r.360.05280.01
[35]Hybrid catfish (Clarias macrocephalus × Clarias gariepinus) and Oreochromis niloticusn.r.n.r.30.520.06
[36]Cyprinus carpion.r.n.r.110.2260.06
Table 5. Contribution of feed and fertilizers to the inputs of carbon, nitrogen, and phosphorus and its rates (kg ha−1 d−1). Values shown in the table are the mean of the values reported in the assessed papers. I: integrated cultivation systems; P: polyculture; M: monoculture; TSP: triple superphosphate; n.r.: not reported.
ReferenceFish SpeciesCultivation SystemPeriod (Days)Feed/Fertilizer TypeC (%)kg ha−1 d−1N (%)kg ha−1 d−1P (%)kg ha−1 d−1
[13]Barboides gonionotus, Cirrhinus mrigala, Cyprinus carpio, Hypophthalmichthys molitrix, Oreochromis niloticus, Helostoma temminckii, Osphronemus goramy, Pangasius hypophthalmus, and hybrid catfish (Clarias macrocephalus × Clarias gariepinus)I342Rice bran, fish powder, and commercial feed
Cow manure, human excreta, crop residues
21
65
5.7
19
3
37
0.2
2.2
12
64
0.1
1
[14]Heterobranchus longifilis and Oreochromis niloticusI and P365Formulated feed
Chicken manure, lime, and plant wastes
n.r.
n.r.
n.r.
n.r.
n.r.
n.r.
n.r.
n.r.
49
44
0.1
0.1
[15]Carassius carassiusM73Formulated feedn.r.n.r.n.r.n.r.731.5
[16]Ictalurus punctatus, hybrid channel catfish (Ictalurus punctatus × Ictalurus furcatus), Polyodon spathula, and Oreochromis niloticusI250Commercial feed2251n.r.n.r.n.r.n.r.
[17]Catla catla, Labeo rohita, and Cirrhinus mrigalaI292Commercial feed
Cow manure and fermented rice straw
95
4
11
0.5
97
2
0.9
0.007
97
2
0.4
0.02
[18]Catla catla, Labeo rohita, and Cirrhinus mrigalaI280Commercial feed
Cow manure, urea, and simple superphosphate
95
4
12
0.5
82
17
1
0.22
92
7
0.4
0.03
[21]Oreochromis niloticusI140Commercial feed
Urea and simple superphosphate
n.r.
n.r.
n.r.
n.r.
67
0.4
2.5
0.01
n.r.
n.r.
n.r.
n.r.
[22]Oreochromis niloticusI140Commercial feed
Urea and simple superphosphate
n.r.
n.r.
n.r.
n.r.
n.r.
n.r.
n.r.
n.r.
54
6
0.06
0.5
[24]Colossoma macropomumI and M171Commercial feedn.r.n.r.281.2n.r.n.r.
[25]Colossoma macropomumI and M171Commercial feed 279n.r.n.r.n.r.n.r.
[26]Colossoma macropomumI and M171Commercial feedn.r.n.r.n.r.n.r.610.26
[27]Osphronemus goramyM152Commercial feed
Chicken manure and rice bran
n.r.
n.r.
n.r.
n.r.
56
34
6.5
4
60
38
1.8
1.1
[28]Ictalurus punctatusM133Commercial feed n.r.n.r.881.7n.r.n.r.
[29]Oreochromis niloticusM151Chicken littern.r.n.r.931.6940.8
[30]Channa arguss and Hypothalmichthys nobilisP120Commercial feedn.r.n.r.981.5990.3
[31]Micropterus salmoidesM240Fish 3428979981.3
[33]Cyprinus carpioM163Wheat n.r.n.r.690.1700.02
[35]Hybrid catfish (Clarias macrocephalus × Clarias gariepinus) and Oreochromis niloticusI87Commercial feed
Urea and TSP
n.r.
n.r.
n.r.
n.r.
63
5.7
12
1.2
83
8.7
2.8
0.3
[37]Catla catla, Labeo rohita, and Labeo calbasuP135Rice bran and mustard oil cake
Cow manure, urea, and TSP
n.r.
n.r.
n.r.
n.r.
25
95
4.5
1.5
n.r.
n.r.
n.r.
n.r.
[38]Cyprinus carpio and hybrid tilapia (Oreochromis niloticus × Oreochromis aureus)P53Commercial feed
Chicken manure
47
6
36
3.5
n.r.
n.r.
n.r.
n.r.
n.r.
n.r.
n.r.
n.r.
Table 6. Contribution of infiltration to the outputs of carbon, nitrogen, and phosphorus and its rates (kg ha−1 d−1). Values shown in the table are the mean of the values reported in the assessed papers. n.r.: not reported.
ReferenceMethodsC (%)kg ha−1 d−1N (%)kg ha−1 d−1P (%)kg ha−1 d−1
[16]Same concentration as pond water0.010.03n.r.n.r.n.r.n.r.
[28]Sediment coresn.r.n.r.0.50.01n.r.n.r.
[29]Same concentration as pond watern.r.n.r.31.7140.9
[31]Sediment cores0.20.20.40.040.50.01
Table 7. Contribution of outlet water to the total output of carbon, nitrogen, and phosphorus and its rates (kg ha−1 d−1). Values shown in the table are the mean of the values reported in the assessed papers. n.r.: not reported.
ReferencePond HydrologyC (%)kg ha−1 d−1N (%)kg ha−1 d−1P (%)kg ha−1 d−1
[13]Flushed166617380.8
[15]Not flushedn.r.n.r.n.r.n.r.40.08
[16]Not flushed0.10.3n.r.n.r.n.r.n.r.
[17]Not flushed1.20.1410.010.60.002
[18]Not flushed10.150.90.010.60.003
[21]Not flushedn.r.n.r.50.2n.r.n.r.
[22]Not flushedn.r.n.r.n.r.n.r.80.07
[24]Not flushedn.r.n.r.120.5n.r.n.r.
[25]Not flushed72n.r.n.r.n.r.n.r.
[26]Not flushedn.r.n.r.n.r.n.r.9.50.03
[27]Flushed n.r.n.r.50.40.40.01
[28]n.r.n.r.n.r.140.3n.r.n.r.
[29]n.r.n.r.n.r.80.1330.3
[30]Not flushed n.r.n.r.0.23.20.31.1
[31]Flushed0.80.057.30.64.50.06
[32]Flushed n.r.n.r.n.r.n.r.130.01
[36]Flushed n.r.n.r.761.3550.1
[35]Flushed n.r.n.r.131.390.06
Table 8. Contribution of gas efflux to the outputs of carbon and nitrogen and its rates (kg ha−1 d−1). Values shown in the table are the mean of the values reported in the assessed papers. n.r.: not reported.
ReferencePathwayC (%)kg ha−1 d−1N (%)kg ha−1 d−1
[16]Respiration2662n.r.n.r.
[21]Diffusion + ebullitionn.r.n.r.321.2
[24]Diffusionn.r.n.r.0.30.01
Ebullitionn.r.n.r.522
[25]Diffusion CO21.40.4n.r.n.r.
Diffusion CH400.01n.r.n.r.
Ebullition CO20.20.1n.r.n.r.
Ebullition CH41.30.3n.r.n.r.
[28]NH3 volatilizationn.r.n.r.12.50.25
Denitrificationn.r.n.r.170.34
[30]NH3 volatilizationn.r.n.r.0.80.1
[31]NH3 volatilizationn.r.n.r.2.70.25
[38]Respiration4020n.r.n.r.
Table 9. Contribution of harvested fish to the outputs of carbon and nitrogen and its assimilation rates (kg ha−1 d−1). Values shown in the table are the mean of the values reported in the assessed papers. FCR: feed conversion ratio; n.r.: not reported; I: integrated cultivation systems; P: polyculture; M: monoculture.
ReferenceFish SpeciesCultivation SystemPeriod (Days)FCRYieldC (%)kg ha−1 d−1N (%)kg ha−1 d−1P (%)kg ha−1 d−1
[13]Barboides gonionotus, Cirrhinus mrigala, Cyprinus carpio, Hypophthalmichthys molitrix, Oreochromis niloticus, Helostoma temminckii, Osphronemus goramy, Pangasius hypophthalmus, and hybrid catfish (Clarias macrocephalus × Clarias gariepinus)I342n.r.4.9 ton ha−161.740.340.07
[14]Heterobranchus longifilis and Oreochromis niloticusI and P365n.r.8 ton ha−1n.r.n.r.n.r.n.r.110.04
[15]Carassius carassiusM73n.r.53 kg ha−1n.r.n.r.n.r.n.r.410.6
[16]Ictalurus punctatus, hybrid channel catfish (Ictalurus punctatus × Ictalurus furcatus), Polyodon spathula, and Oreochromis niloticusP2501.520 ton ha−11125n.r.n.r.n.r.n.r.
[17]Catla catla, Labeo rohita, and Cirrhinus mrigalaI2921.84.6 ton ha−192.10340.4100.07
[18]Catla catla, Labeo rohita, and Cirrhinus mrigalaI2801.72.7 ton ha−1192.5440.5190.08
[21]Oreochromis niloticusI140n.r.4.8 ton ha−1n.r.n.r.210.7n.r.n.r.
[22]Oreochromis niloticusI140n.r.4.8 ton ha−1n.r.n.r.n.r.n.r.210.2
[24]Colossoma macropomumI and M171n.r.4.6 ton ha−1n.r.n.r.120.5n.r.n.r.
[25]Colossoma macropomumI and M171n.r.4.6 ton ha−193n.r.n.r.n.r.n.r.
[26]Colossoma macropomumI and M171n.r.4.6 ton ha−1n.r.n.r.n.r.n.r.23n.r.
[27]Osphronemus goramyM152n.r.8 ton ha−1n.r.n.r.181.730.1
[28]Ictalurus punctatusM1331.43.5 ton ha−1n.r.n.r.310.6n.r.n.r.
[29]Oreochromis niloticusM151n.r.n.r.n.r.n.r.180.3150.1
[30]Channa arguss and Hypophthalmichthys nobilisP1201.320 ton ha−1n.r.n.r.390.5140.5
[31]Micropterus salmoidesM2403.943 ton ha−11410443.7250.3
[32]Cyprinus carpioM365n.r.664 kg ha−1n.r.n.r.n.r.n.r.60.01
[35]Hybrid catfish (Clarias macrocephalus × Clarias gariepinus) and Oreochromis niloticusI87n.r.1.9 ton ha−1n.r.n.r.407591.7
[36]Cyprinus carpio (scaled common carp)M120n.r.>450 kg ha−1n.r.n.r.230.4440.1
[37]Catla catla, Labeo rohita, and Labeo calbasuP13512.4623 kg ha−1n.r.n.r.70.3n.r.n.r.
[38]Cyprinus carpio and hybrid tilapia (Oreochromis niloticus × Oreochromis aureus)P532.98.1 ton ha−1125n.r.n.r.n.r.n.r.
[41]Hybrid tilapia, Oreochromis niloticus, Hypophthalmichthys molitrix, and Ctenopharyngodon idellaP98n.r.2.6 ton ha−151.5133.7n.r.n.r.
Table 10. Contribution of sedimentation to the total output of carbon, nitrogen, and phosphorus and its rates (kg ha−1 d−1). Values shown in the table are the mean of the values reported in the assessed papers. n.r.: not reported; I: integrated cultivation systems; P: polyculture; M: monoculture.
ReferenceCultivation SystemFish SpeciesC (%)kg ha−1 d−1N (%)kg ha−1 da−1P (%)kg ha−1 d−1
[13]IBarboides gonionotus, Cirrhinus mrigala, Cyprinus carpio, Hypophthalmichthys molitrix, Oreochromis niloticus, Helostoma temminckii, Osphronemus goramy, Pangasius hypophthalmus, and hybrid catfish (Clarias macrocephalus × Clarias gariepinus)8123291.9480.7
[15]MCarassius carassiusn.r.n.r.n.r.n.r.551
[16]IIctalurus punctatus, hybrid channel catfish (Ictalurus punctatus × Ictalurus furcatus), Polyodon spathula, and Oreochromis niloticus921n.r.n.r.n.r.n.r.
[17]ICatla catla, Labeo rohita, and Cirrhinus mrigala688380.4720.2
[18]ICatla catla, Labeo rohita, and Cirrhinus mrigala699460.5700.3
[21]IOreochromis niloticusn.r.n.r.311.2n.r.n.r.
[22]IOreochromis niloticusn.r.n.r.n.r.n.r.640.6
[24]I and MColossoma macropomumn.r.n.r.190.7n.r.n.r.
[25]I and MColossoma macropomum7024n.r.n.r.n.r.n.r.
[26]I and MColossoma macropomumn.r.n.r.n.r.n.r.510.2
[27]MOsphronemus goramyn.r.n.r.606772
[28]MIctalurus punctatusn.r.n.r.230.45n.r.n.r.
[30]PChanna arguss and Hypophthalmichthys nobilisn.r.n.r.600.7820.2
[31]MMicropterus salmoides1611453690.09
[35]IHybrid catfish (Clarias macrocephalus × Clarias gariepinus) and Oreochromis niloticusn.r.n.r.408240.9
Disclaimer/Publisher’s Note: The statements, opinions and data contained in all publications are solely those of the individual author(s) and contributor(s) and not of MDPI and/or the editor(s). MDPI and/or the editor(s) disclaim responsibility for any injury to people or property resulting from any ideas, methods, instructions or products referred to in the content.

