1. Introduction
In the process of construction and development of modern cities, ground surface settlement has become a serious urban problem, which has widely appeared in major cities around the world [
1]. Due to the combination of factors such as the concentration of urban buildings, over-exploitation of groundwater resources, and weak urban foundation, the impact of ground surface settlement is increasingly significant [
2]. Long-term surface subsidence directly leads to road collapse, building tilting, and building cracking. This causes serious geological disasters, which seriously threaten urban stability and safety, such as through building collapse [
3]. At the same time, they may also indirectly lead to the degradation of groundwater resources and environmental pollution. Therefore, timely monitoring of urban land surfaces is crucial for identifying potential risks of geological disasters, which eliminates safety hazards in urban construction and development.
Traditional methods of surface subsidence monitoring, such as geodetic survey and Global Navigation Satellite System (GNSS), have high accuracy. These are labor-intensive, high-cost, long-cycle, and low-efficiency methods, especially for long-term series monitoring. The area monitored by traditional methods is easily limited, and the amount of monitoring data generated is small [
4]. With the development of global microwave remote sensing satellite technology, large-area long-time-series monitoring has become possible. The Interferometric Synthetic Aperture Radar (InSAR) technique has found extensive application in the surveillance of surface subsidence [
5].
As a typical case of urban land subsidence in the western plateau faulted basin of China, Kunming City has shown a wide subsidence range and a fast subsidence rate [
6]. In recent years, the surface settlement of the Kunming urban area has obviously expanded and accelerated. This makes it particularly important to study the surface settlement of the Kunming urban area, which meets the needs of the modern economic and social construction of “one lake and four areas” [
7]. Ma et al. and Xiong et al. have collected settlement data in Kunming City with the Sentinel-1 radar by PS-InSAR and SBAS-InSAR, analyzed the surface settlement of urban areas, and verified the effectiveness of this method in monitoring small deformations [
8,
9]. However, due to the timeliness of remote sensing technology, the formation of land surface settlement always lags behind the actual situation. The application has limitations, meaning it cannot reflect the current actual situation and achieve real-time monitoring [
10]. The prediction of land surface subsidence trends has become an important research subject.
With the widespread use of neural network models, Long Short-Term Memory (LSTM), used as a dedicated neural network for processing time series data, has demonstrated its unique advantages in feature learning [
11,
12]. However, the traditional LSTM may affect the stability of model prediction due to improper parameter selection. To overcome this challenge, Grey Wolf Optimizer (GWO) enhances the parameter selection procedure of the LSTM model. GWO is a heuristic optimization algorithm, which mimics the social hierarchy and hunts patterns observed in grey wolves within their natural habitat and convergence characteristics [
13]. By applying GWO to the parameter optimization of the LSTM model, the performance and accuracy of the prediction model can be significantly improved.
This paper aims to construct GWO-optimized LSTM and a new method of Time Series-Interferometric Synthetic Aperture Radar (TS-InSAR). Taking Kunming City as an example, the land surface subsidence prediction is studied, based on ESA Sentinel-1A data, Precise Orbit Determination (POD), and JAXA-published ALOS World 3D-30 m (AW3D30) data as an external digital elevation model (DEM). These data serve as the basis for building and analyzing the prediction model of land subsidence. In this paper, PS-InSAR and SBAS-InSAR methods are used to obtain real-time surface deformation data of the Kunming urban area from 2020 to 2022, and cross-verification is carried out. Based on the surface deformation information monitored by TS-InSAR, a new surface subsidence prediction model (GWO-LSTM) is proposed. To guarantee the precision of the forecasting model, root mean square error (RMSE), mean absolute error (MAE), and determination coefficient (R2) are introduced as evaluation indexes. The accuracy and applicability of the new method are verified. This paper adopts new methods to monitor and predict land subsidence, which provides a scientific basis for the planning and development of cities and the prevention of geological disasters.
Despite the advancements in monitoring techniques, the ability to accurately predict land subsidence trends remains a significant challenge. The proposed research introduces a novel approach by integrating the strengths of Time Series-Interferometric Synthetic Aperture Radar (TS-InSAR) with LSTM by the Grey Wolf Optimizer (GWO). This study is the first to apply the GWO-LSTM model to predict land subsidence, specifically in the context of Kunming City, where the complex geological conditions and rapid urban expansion require reliable monitoring.
The novelty in the development of a hybrid methodology leverages the global search capabilities and convergence characteristics of the GWO, which enhances the parameter selection of the LSTM model. This optimization significantly improves the accuracy and stability of subsidence prediction, which addresses the limitations of traditional monitoring and prediction methods. Furthermore, the application was used for a real-world case study in Kunming City. With its unique geological setting and rapid urban development, this provides a critical test bed for the model’s effectiveness and applicability.
3. Research Methods
3.1. PS-InSAR
The technical approach known as PS-InSAR was introduced by Ferretti et al. [
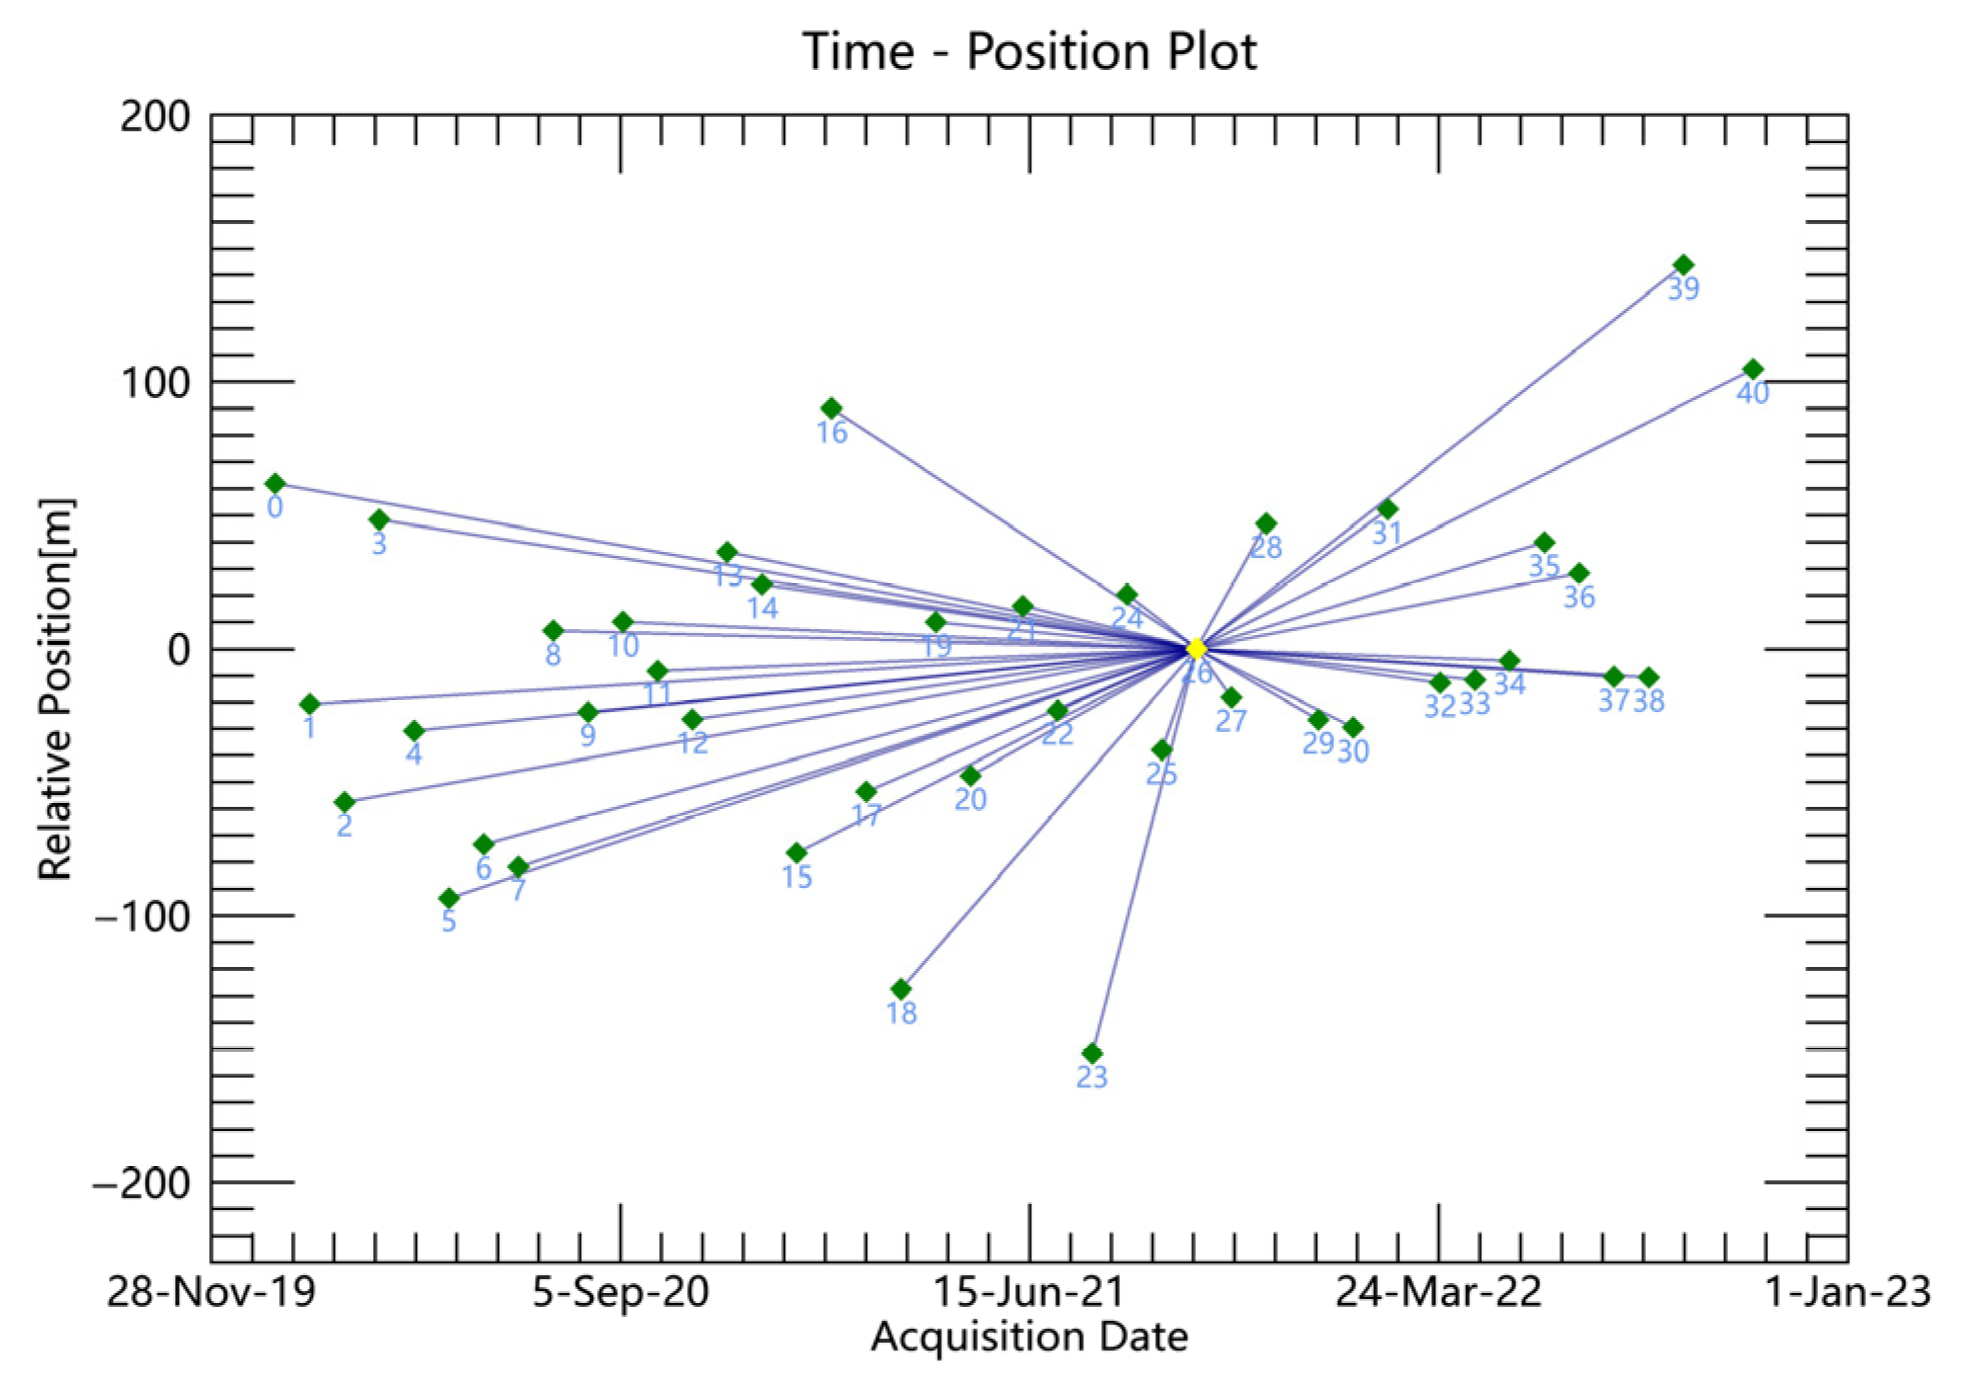
19] and detects highly correlated and stable points, namely permanent scatterers. Based on the amplitude and phase data of images, it can define ground objects such as buildings, artificial structures, rocks, and ridges. This possesses the capability of sustaining prolonged temporal sequences with elevated coherence and robust scattering. The algorithm in question is outlined as follows. It acquires N + 1 SAR images encompassing the identical region, which could designate a single image as the reference image. It also carries out registration, resampling, de-flattening, and topographic phase and interference processing to obtain N-interference images. The diagram in
Figure 2 illustrates the space–time baseline.
The reference DEM and satellite orbit data are used to perform topographic correction on the interferogram. The phase of the interferogram
ϕx,i at the
x position of the
i interferometer pair can be expressed as Equation (1).
The sum of the three components ϕconst,x,i, ϕslope,x,i, and ϕatm,x,i is known as the Atmospheric Phase Screen (APS), which represents the constant phase values, the linear phase values due to atmospheric effects, and the nonlinear atmospheric effects, respectively. ϕdefo,x,i and ϕtopo,x,i denote the surface deformation phase in the radar line-of-sight direction and the terrain phase due to DEM errors, respectively. ϕnoise,x,i denotes the noise phase (errors introduced by scatterer variations, thermal noise, alignment errors, etc.).
On 8 October 2021, the super master image was chosen. Initially, a linear model is employed to estimate the residual height correction coefficient and average deformation rate of the potential PS points before an initial inversion. In this process, the region is divided into subregions of 2 m2 in size, and the selection of reference points is based on the index of amplitude deviation. Each subregion is processed individually, and the results from all subregions are then combined to form a complete result. In the case of the second inversion, a linear model of first order is employed for estimating the phase component caused by atmospheric interference. In order to isolate the nonlinear deformation phase ϕdefo,x,i in Equation (1), one of the key issues is the need to determine the atmospheric phase ϕatm,x,i. In the residual phase, the atmospheric phase and the nonlinear deformation phase have different frequency characteristics in the spatial domains. This is because the atmospheric correlation length in space is about 1 km, which exhibits a high degree of correlation in the spatial domain, i.e., a low-frequency characteristic. However, for an image element, the atmospheric condition can be regarded as a stochastic process at different radar image acquisition times, and the atmospheric phase is a white noise in time, highly uncorrelated in the time domain, i.e., a high-frequency characteristic. In contrast, the nonlinear deformation has a small correlation length in space and a low-frequency characteristic in the time domain. Therefore, we consider separating the atmospheric phases ϕatm,x,i by obtaining them through temporal high-pass filtering (365 days) and spatial low-pass filtering (1.2 km). The high-pass filtering of 365 days means that we choose a time window of one year’s length to remove the low-frequency signals, which effectively filters out the long-term trends and cyclical variations and preserves the high-frequency components of the atmospheric perturbations. A spatial low-pass filter of 1.2 km was chosen to effectively retain the low-frequency components.
Finally, the processed data were mapped to the geographic coordinate system through geocoding. The line-of-sight deformation rate and the shape variable accumulated over time were obtained, as shown in
Figure 3. This sequence of procedures is crucial in examining surface displacement and its associated factors. At the same time, the radar incidence angle is utilized to convert the line-of-sight deformation into vertical deformation [
20], and the conversion formula is shown in Equation (2):
where
dLos represents the outcome of line-of-sight deformation,
dv denotes the vertical deformation result, and
θ corresponds to the radar incidence angle.
3.2. SBAS-InSAR
The proposal of SBAS-InSAR technology was put forward by Berardino et al. [
21]; the core principle of this technology is to combine all SAR image data into a small baseline subset according to the interference pairs of spatial and temporal baselines within a certain range. The image baseline distance within each subset is small. For each subset, the surface deformation of the time series in each subset was calculated by the least square, which is shown in
Figure 4.
The 5 May 2021 image was selected as the reference image. The initial inversion employs a linear model, which estimates the coefficient of residual height correction and the average deformation rate at high-coherence points. It adopts SVD to obtain the surface temporal deformation results combined with the small baseline data. The phase component of atmospheric interference is estimated in the second inversion by the first-order linear model. To eliminate the phase component by atmospheric interference, an atmospheric filter is utilized, which consists of a temporal high-pass filter (365 days) and a spatial low-pass filter (1200 m). In conclusion, the geocoding process enables the acquisition of line-of-sight deformation rate and cumulative time series deformation statistics. At the same time, Equation (2) is employed to convert the deformation observed along the line of sight into vertical deformation, considering the radar incidence angle. This process is shown in
Figure 5.
3.3. Comprehensive PS-InSAR and SBAS-InSAR Methods
PS-InSAR simulates linear deformation, while SBAS-InSAR simulates nonlinear deformation. It has been contended that a small baseline approach with comprehensive resolution is comparable to a persistent scatter approach, and represents a unit primarily influenced by a single scatter [
22]. However, it should be noted that the PS method offers two distinct benefits. Firstly, by generating all interferograms with respect to a single reference image, we can effectively minimize the noise contribution from the primary image before unfolding the phase; this is because such noise is consistently present in all interferograms. Secondly, by implementing spatial filtering, the amplification of noise caused by the non-dominant scatter has effectively been mitigated through resolution coarsening. Hence, a dataset comprises a sequence of pixels exhibiting scattering characteristics; it can be inferred that these two approaches possess complementary attributes. Through the integration of both approaches, more scattered signals can be extracted in general; thus, the spatial sampling error can be mitigated, which leads to an enhancement in the signal-to-noise ratio for the backscattering coefficients.
3.4. Long Short-Term Memory Network
The LSTM network as a type of RNN addressed the issue of gradient vanishing and exploding in conventional recurrent neural networks (RNNs) while handling lengthy sequential data [
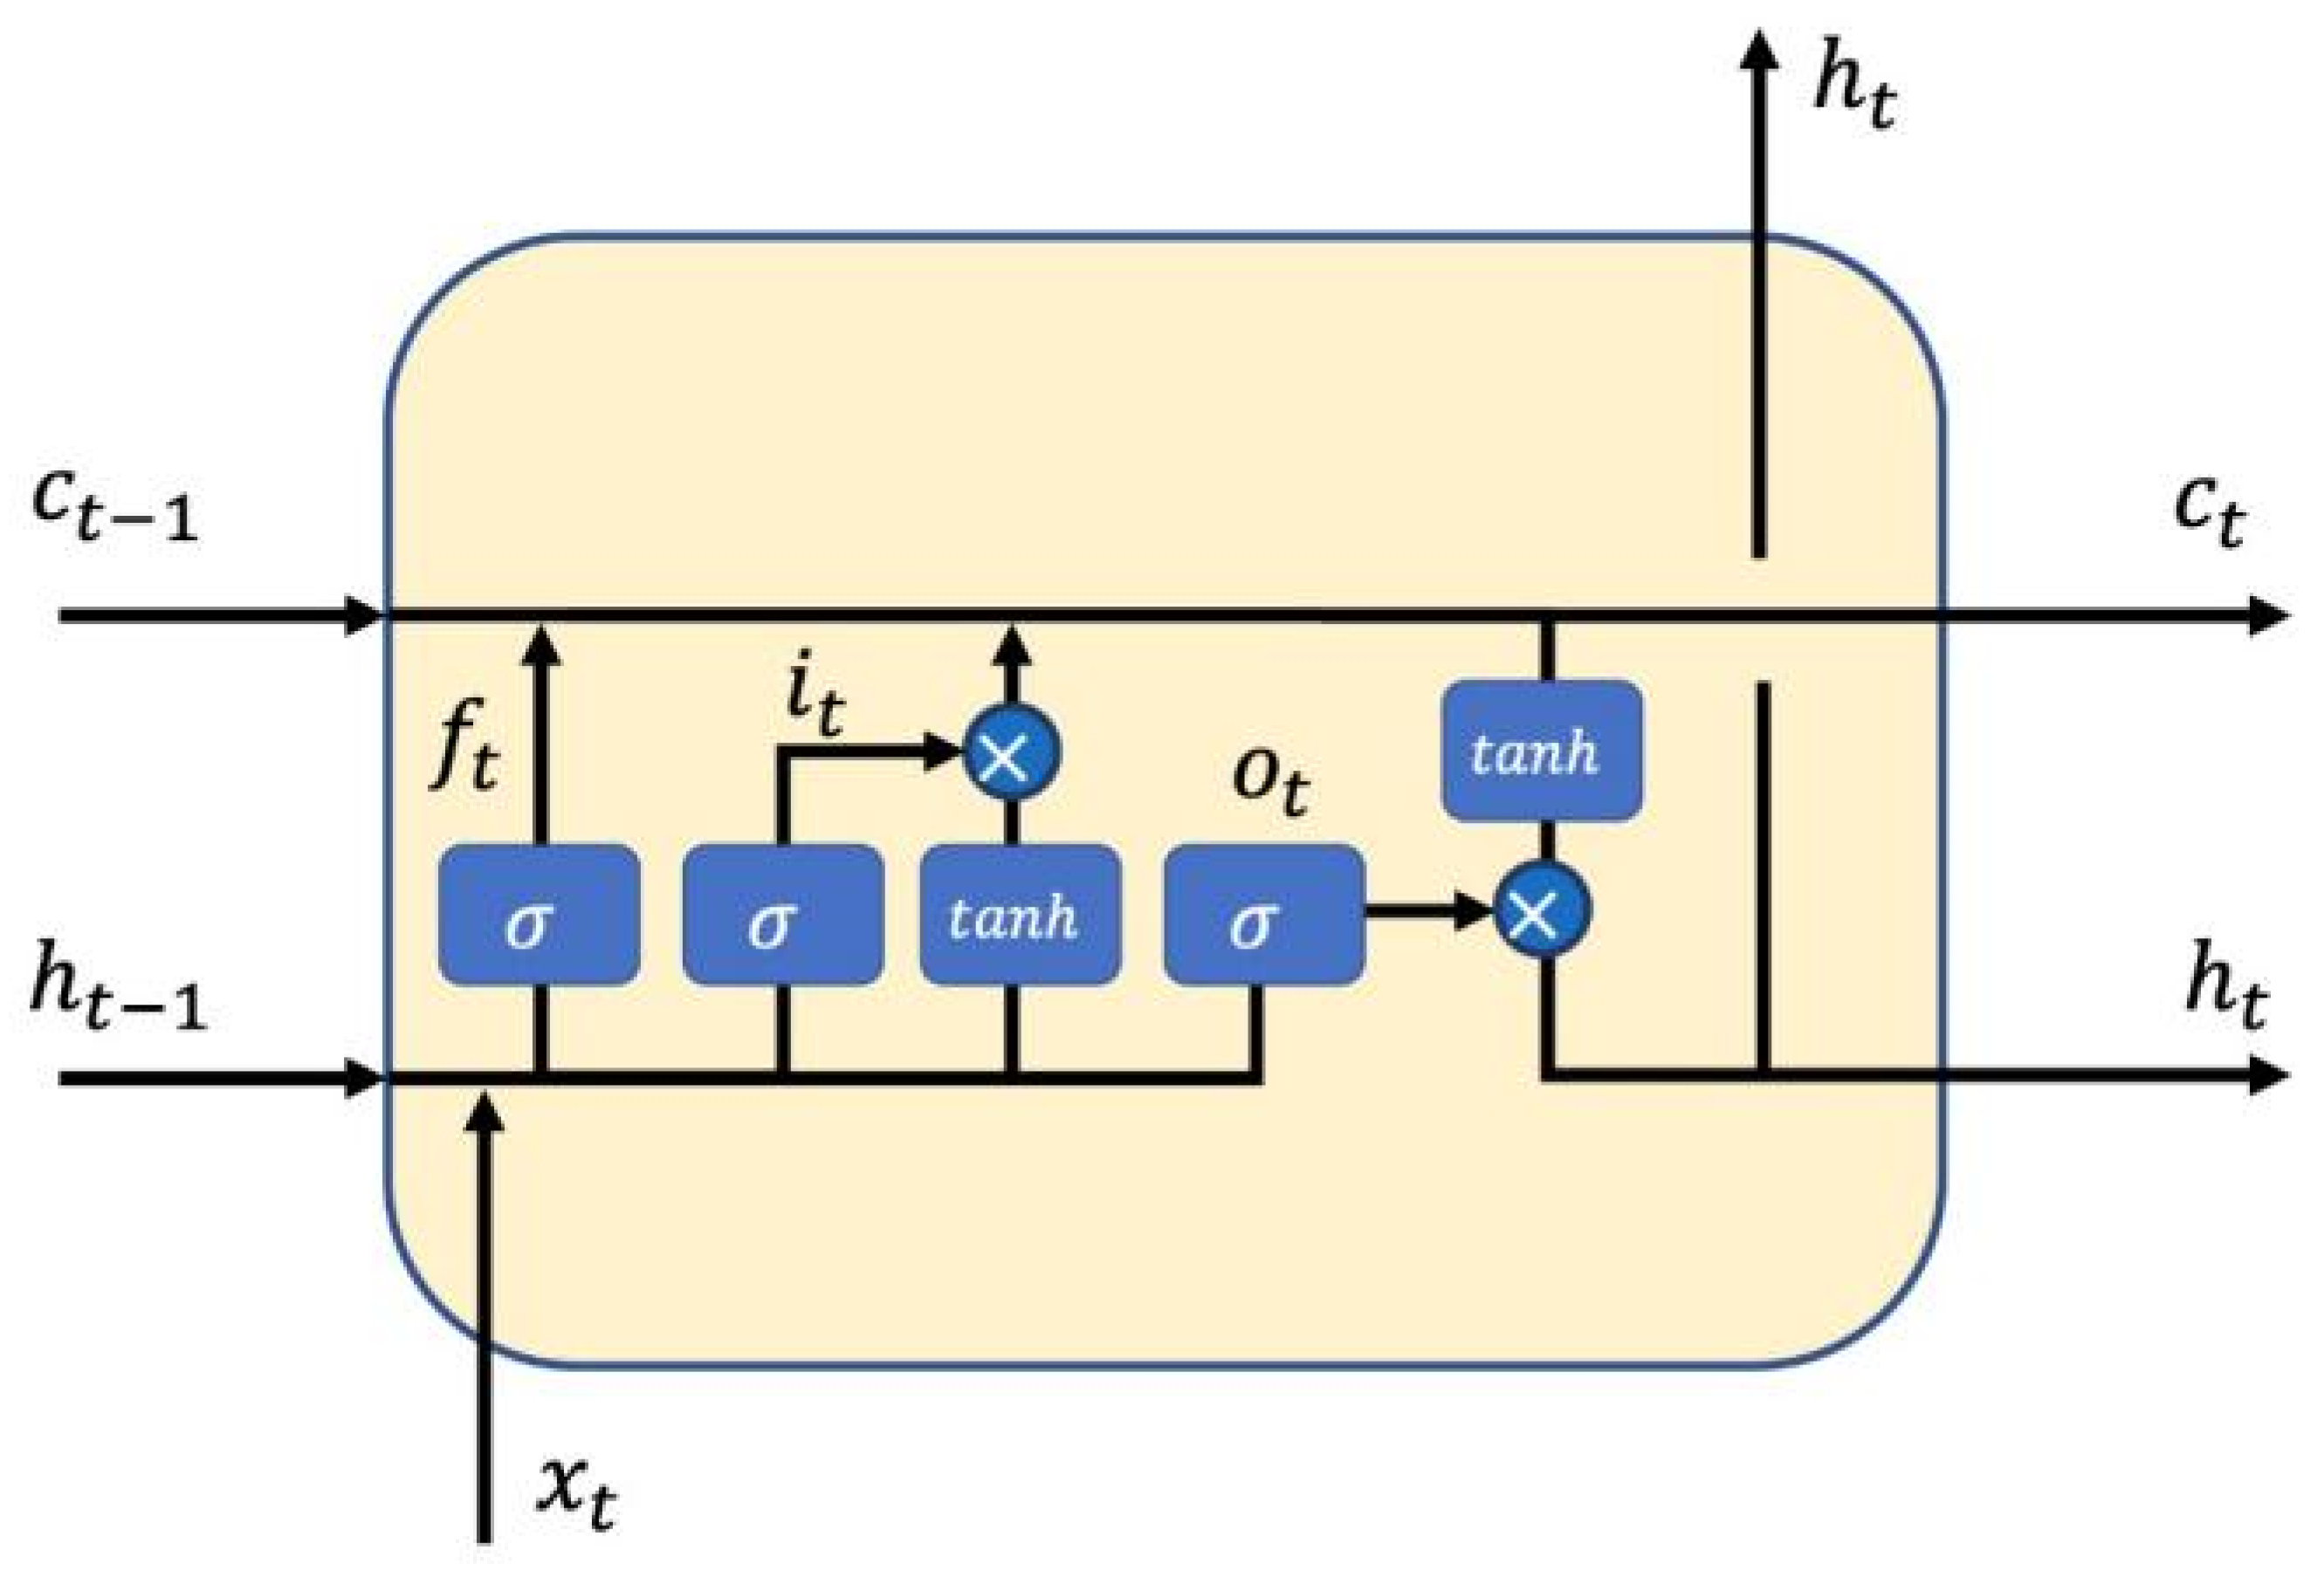
23]. LSTM incorporates gate control mechanisms to effectively retain and modify the internal state of the network, enabling it to capture long-term dependencies (
Figure 6).
The LSTM module is composed of a memory unit and three gates, namely the input gate, the forget gate, and the output gate [
24]. The input gate regulates the transmission of data from the input layer to the memory unit, while the forget gate determines the information that should be preserved or eliminated. Additionally, the output gate governs the transfer of data from the memory unit to the output layer. These gate structures enable LSTM to selectively remember or forget information while learning in sequences, effectively capturing and maintaining long-term dependency.
In each time step, LSTM takes in the present input along with the hidden state and memory unit contents from the previous time step. It then produces updates for the current time step’s hidden state and memory unit by utilizing these gates, which finally produce the output. These operations are implemented through nonlinear activation functions with learnable parameters. As a result, the LSTM model can be properly trained to effectively maintain information flow, and it performs well in applications when dealing with long series of data.
In temporal InSAR (TS-InSAR) data analysis, the utilization of the LSTM model enables the accurate prediction of land subsidence trends and patterns. By learning and training historical surface subsidence data, the LSTM model can extract hidden patterns and rules in time series information, which predicts future surface subsidence. Compared to conventional statistical techniques, the LSTM model exhibits enhanced capability in capturing nonlinear associations and long-term dependencies within time series data, thereby elevating prediction accuracy.
However, the traditional LSTM may have the following limitations in the surface settlement prediction [
25]. (1) Long-term dependency modeling problems are shown as follows. An unoptimized LSTM may have difficulty dealing with long-term dependencies. Long-term dependence refers to the existence of a large time interval among a series of events. The memory unit of the LSTM model may not be able to effectively capture information, causing a decline in the prediction accuracy of such long-term context information. (2) Lack of data: Surface subsidence prediction studies usually require a large amount of observational data to train models, but real-world geological monitoring data may be missing or incomplete. Unoptimized LSTM may be sensitive to missing data, which can affect the training and prediction ability of the model in inaccurate prediction results. (3) Overfitting problem: Unoptimized LSTM may have the risk of overfitting when fitting training data. The LSTM model has a strong memory ability. It is possible to excessively fit the training dataset, which leads to a lack of generalization when encountering new and unfamiliar data. This results in poor performance of the predictive model in practical applications. (4) Parameter selection problem: Unoptimized LSTM requires careful parameter selection, including network structure, learning rate, and number of iterations. The inadequate parameter selection can result in subpar model performance and impact the accuracy and stability of prediction outcomes.
3.5. Grey Wolf Optimization Algorithm (GWO)
The Grey Wolf Optimizer (GWO) is an optimization algorithm inspired by the collective tracking and hunting behavior of grey wolves in their pursuit of prey [
26]. It was proposed by Seyedali Mirjalili and others in 2014 to address intricate optimization challenges. The algorithm is based on four levels of grey wolf groups. α (alpha), β (beta), δ (delta), and ω (omega) are used to simulate the social hierarchy of the wolf pack.
Wolf pack hierarchy and social behavior were simulated as follows:
α (alpha) is the leader of the pack, and is responsible for deciding the direction of the hunt. The rest of the pack usually follows its guidance. β (beta), as a secondary leader, acts as an advisor and helper. α wolves and β wolves will take over the leadership. δ (delta), as the wolf with a certain prestige, acts under the guidance of α and β and ensures the internal order and safety of the group. ω (omega) is the lowest-ranking member, which mainly follows the instructions of the first three levels to complete the task, and their information is also helpful in finding prey.
The algorithm flow is as follows:
Initialization: A group of N search agents (grey wolves) is randomly generated, each representing a potential solution to the problem.
Lead wolf identification: This assesses the performance of every search agent, which identifies the optimal three agents as α, β, and δ.
Finding and encircling prey: The behavior of the three-tier wolf pack members approaching prey is simulated by a mathematical model. The other members (ω) update their positions according to the positions of the three leading wolves.
Attack (optimization): Constantly it updates the position of the pack in an iterative manner in the expectation of finding prey (optimal solution to the problem).
Termination condition: The algorithm continues its iterations until it satisfies a predetermined termination condition, such as reaching the maximum allowable number of iterations or achieving a specific level of solution quality.
The GWO algorithm adopts the method of simulating wolf pack behavior to carry out a global optimization search. The algorithm mimics the hunting, chasing, and attacking behavior of wolves during prey pursuit. The location update formula considers the position of the current search agent, the position of the lead wolf, and the flexible adaptation of both exploration and exploitation tactics. The balanced exploration and utilization of the search space are realized by calculating the distance between wolves, which updates the position, and randomly selects the leading wolf. Compared with other optimization algorithms, GWO has fewer tuning parameters. The algorithm is simple to implement and easy to extend to high-dimensional problems. Furthermore, GWO proves to be applicable in a wide range of optimization problem scenarios, including continuous, discrete, and multi-objective optimization problems. Overall, GWO achieves a successful equilibrium between worldwide and regional optimization through the emulation of wolves’ social structure and hunting tactics.
3.6. GWO-LSTM Prediction Model
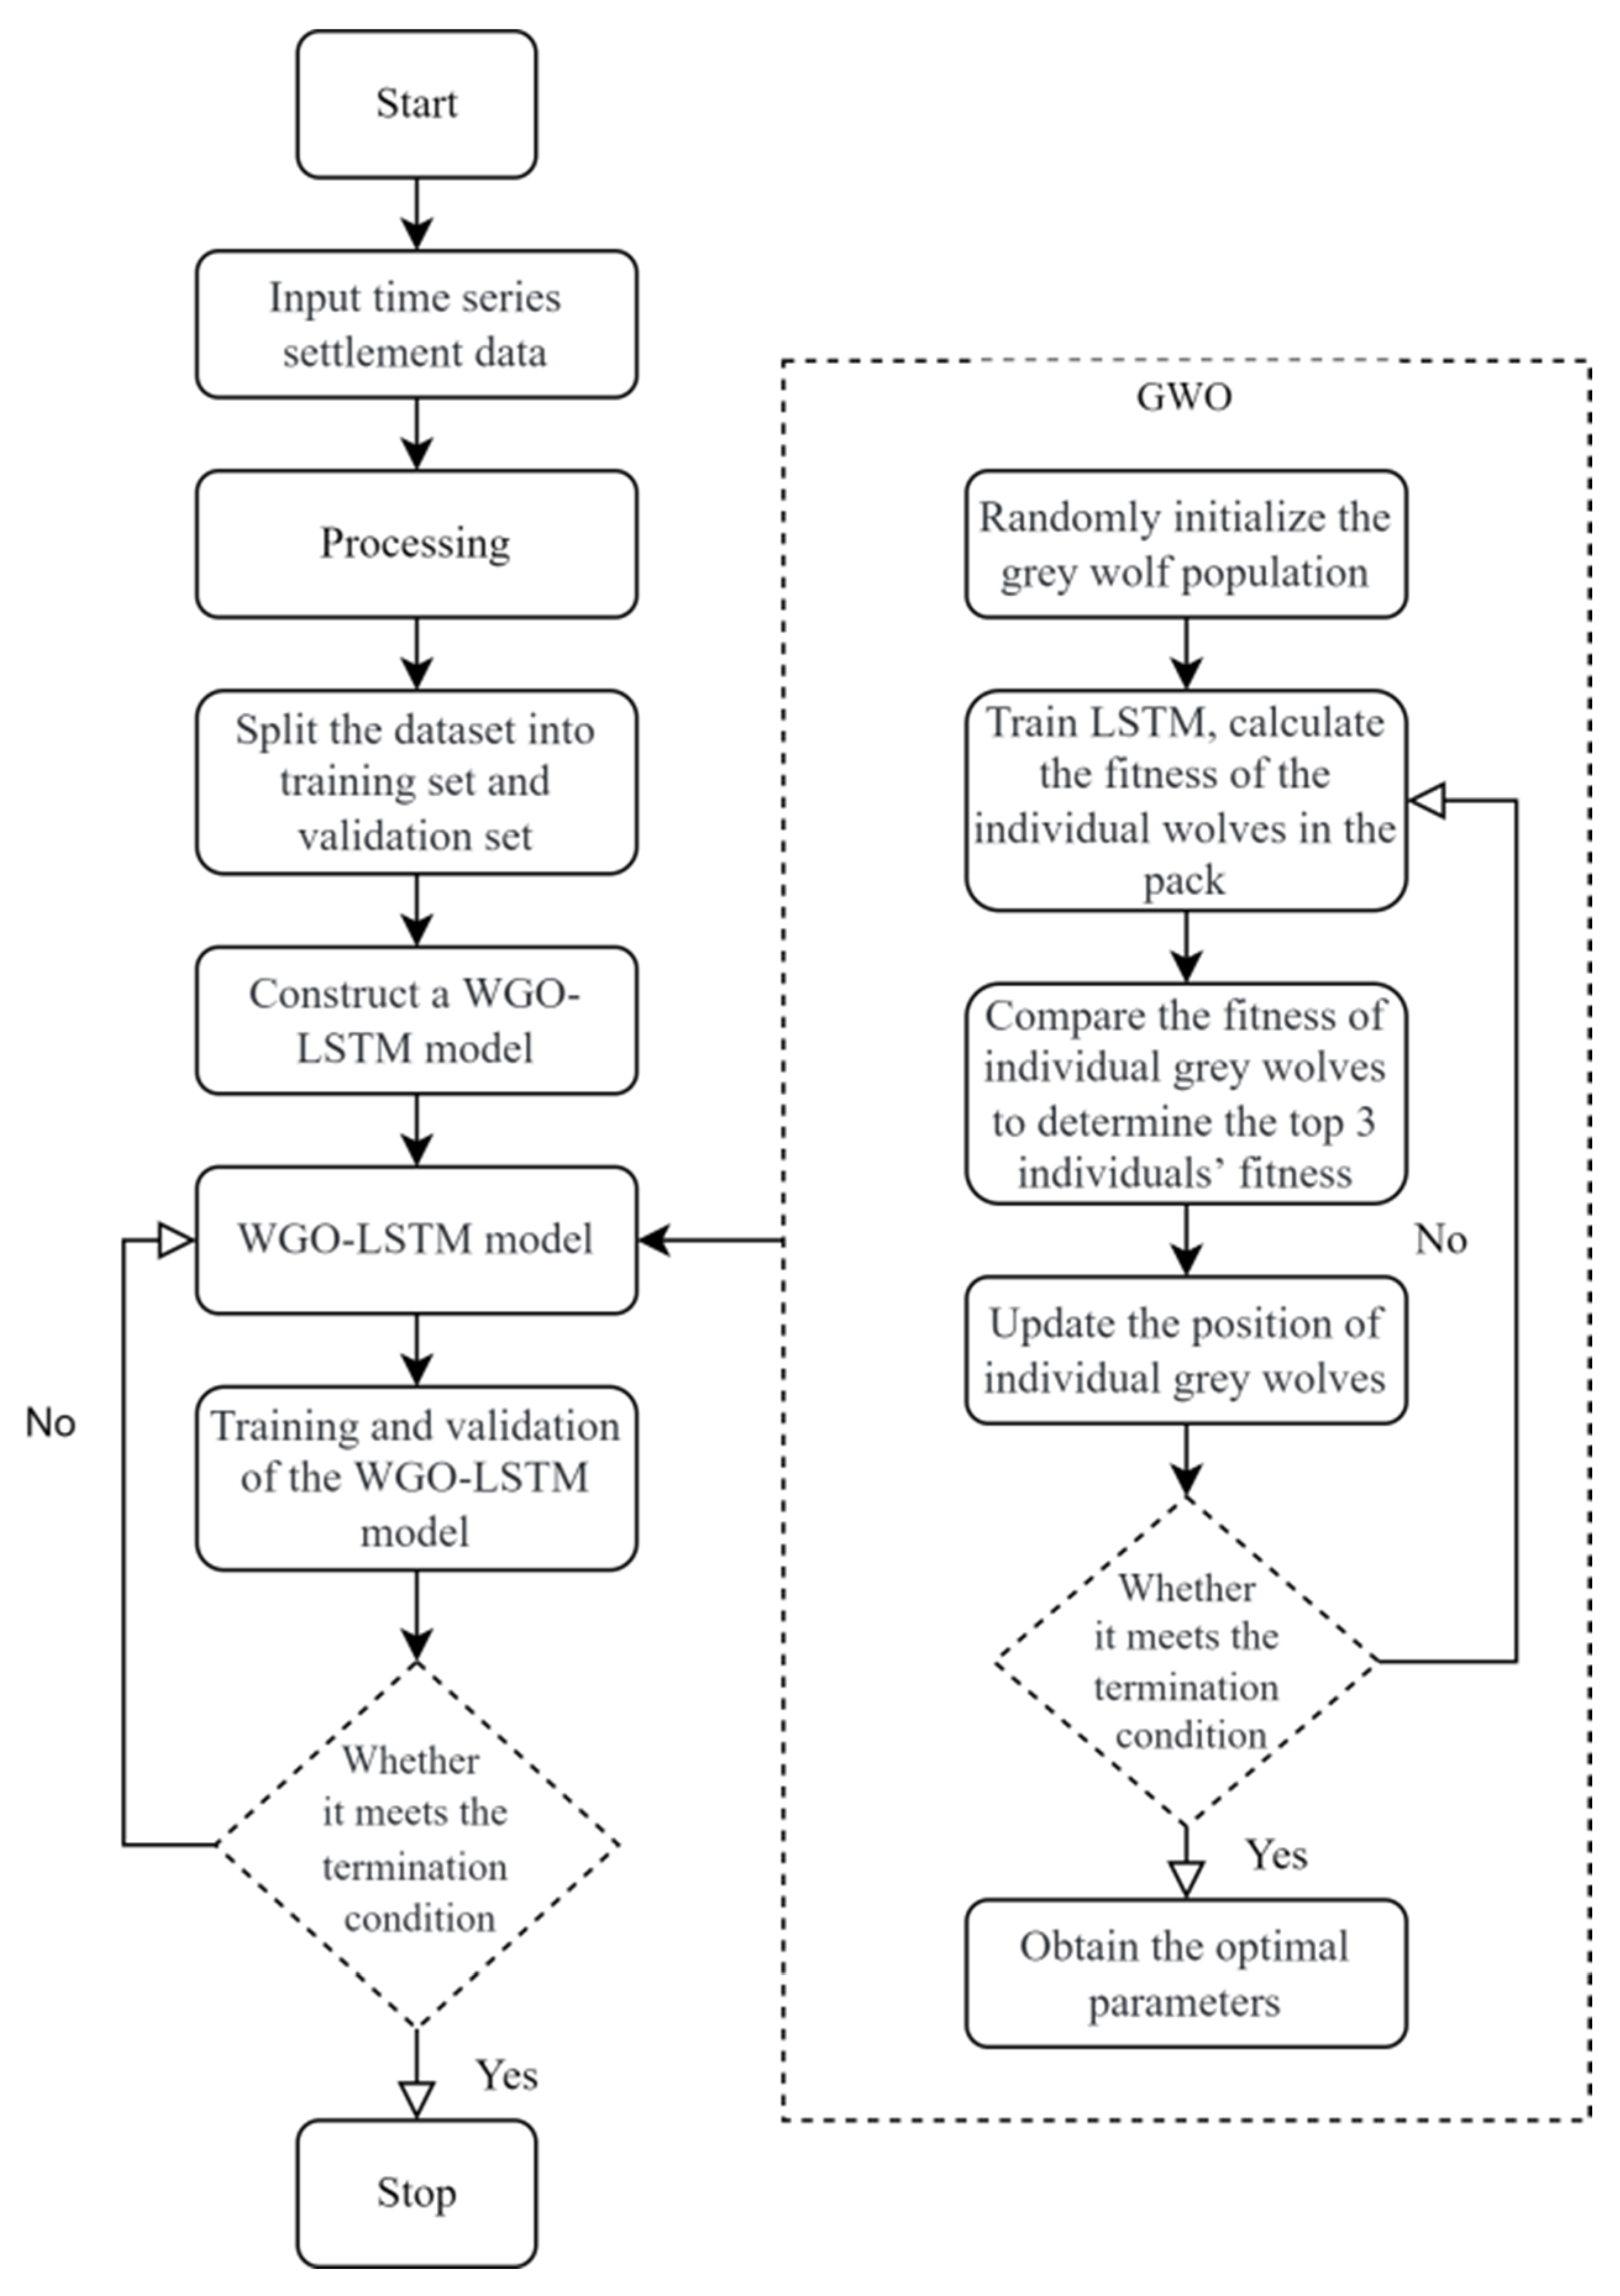
In order to solve the time sequence problem of land surface settlement prediction, the problems of local optimality and slow convergence of the LSTM model are considered, and an LSTM model combined with the Grey Wolf Optimizer (GWO) algorithm is proposed in this study (
Figure 7). GWO is an emerging swarm intelligence optimization algorithm. It emulates the hierarchical order and predatory conduct witnessed in grey wolf populations, which guide the group to conduct a global search through alpha, beta, and delta wolves. This also reinforces the global search capability, which minimizes the likelihood of converging towards a suboptimal solution.
The introduction of the Grey Wolf Optimization algorithm optimizes the weight and bias parameters of the LSTM neural network, which applies the global search ability of the GWO algorithm in the iterative process. This contributes to enhancing both the rate at which the network converges and the overall precision of predictions made by the model. In addition, the GWO algorithm can also adapt to changing problem scenarios, which enhances the robustness of the model in dynamic environments.
In the process of modeling, the traditional LSTM model is used to establish a preliminary surface settlement prediction model. Then, the GWO algorithm is employed for the optimization of the initial parameters in LSTM. In each iteration of the GWO, it evaluates the fitness of all individuals (solutions) in the current population, and selects the most fit individual as the lead wolf to guide the group toward a better solution. Through continuous iteration, the optimal solution set as the optimal weight and bias parameters of the LSTM network is finally obtained, and a more accurate prediction model of surface settlement is constructed.
3.7. Subsidence Zone
Previous researchers have utilized integrated PS, SBAS, and DS InSAR techniques to monitor subsidence, which reveals multiple subsidence centers in Kunming’s urban area. In recent years, new subsidence funnels have continually emerged along the northern and eastern shores of Dianchi Lake. Although these funnels are small in volume, they cover a broad area and exhibit an outward expansion trend. Based on the preliminary identification of subsidence zones and the distribution characteristics of the subsidence centers, we have divided the severely affected areas into six sub-study zones by regular rectangles to facilitate more in-depth research. The specific subsidence zones are as follows.
Subsidence zone A: Primarily located in the Rongchuang-Xinhe Community–Wangjiadui area in Xishan District, Kunming.
Subsidence zone B: A newly identified subsidence-sensitive area, situated along Metro Line 5, the South Connection Line Expressway, Qianwei Road, Hairun Road to Ziyuan Road, Guangfu Road, and Haize Road.
Subsidence zone C: The largest known subsidence area in Kunming, encompassing multiple locations in Guandu District, including Liujia Village, Caojiaqiao, Niujia Village, Dianchi Convention and Exhibition Center, Sijia Community, Luoya Community, Wangjia Village, and Longma Community.
Subsidence zone D: Extending from Xiaobanchiao to Guangwei Village, Hewei Village, and Fubao Village.
Subsidence zone E: Situated in the Daloyang Community and Xiaoloyang Community of Luoyang Street in Chenggong District.
Subsidence zone F: Includes Zhonghe Village and Luojia Village in Dayu Street, Chenggong District, and areas along the East Ring Road.
Subsidence zones A, B, and C are located along the northern and eastern shores of Dianchi Lake. These areas have experienced rapid urban development in Kunming in recent years, and contain a significant number of industrial parks. Subsidence zones D and E are further from the lakeshore, with more concentrated subsidence centers that began earlier. Subsidence zone F is located in a wetland park along the Dianchi Lake shore, where subsidence has occurred rapidly in recent years, displaying distribution characteristics similar to zones D and E.
4. Result
4.1. Cross-Validation of PS and SBAS Method Results
The average settlement amount of each settling area at each time was calculated, and the average settlement amount of each settling area of PS-InSAR and SBAS-InSAR in 40 periods was analyzed for correlation. The correlation coefficients of PS and SBAS are above 0.88 in the time series of each sedimentation zone and reach 0.98 in subsidence zone C. The
p of subsidence zone F is less than 0.01. Hence, the correlation is very significant. See
Figure 8 and
Table 2 for details. Combined with the characteristics of PS-InSAR and SBAS-InSAR, PS is more suitable for dense building areas with high scattering rates and high stability. The SBAS method has better performance in lower-frequency deformation and nonlinear deformation. Based on the monitoring results of PS and SBAS, the results of subsidence zones B and E were monitored by SBAS, and the results of other subsidence zones were monitored by PS.
4.2. Monitoring Results
Based on historical monitoring data and current results, this paper delineates the multi-dimensional spatial units of surface subsidence in the urban area of Kunming. The identification and characteristics reveal the heterogeneity of the surface subsidence process and deformation characteristics, which highlights the risk factors in urban planning and land use.
The results show (
Figure 9) that surface subsidence in Kunming is still ongoing, and overall changes remain relatively stable. However, the subsidence area near the northeastern shore of Dianchi Lake is gradually expanding. In zone B, a new subsidence funnel has appeared in recent years, which is developing rapidly with a trend towards connecting with zone A and zone C in the future (
Figure 10). The soft ground, numerous wetlands, and abundant groundwater resources around Dianchi Lake coupled with the rapid urban development and sharp growth in buildings in zone A, zone B, and zone C will inevitably lead to extensive groundwater extraction. Hence, surface subsidence is ultimately exacerbated in these regions. The subsidence phenomena in zone D and zone E occurred earlier, and have remained relatively stable for a period. However, in recent years, the rapid construction of buildings in Chenggong New District has exacerbated the subsidence in zone E.
These areas have not undergone large-scale urban construction and development, which are related to continuous groundwater extraction. Zone F, as a wetland area without urban buildings, has shown rapid subsidence over the past three years, possibly related to the irrigation of nearby agricultural facilities.
The dynamic development of surface subsidence is driven by both environmental conditions and human factors. The accumulation of subsidence and the occurrence of multiple funnels demonstrate that the subsidence process is spatially non-uniform with some areas experiencing rapid subsidence, with localized stress concentration, while others remain relatively stable. Under the background of rapid urbanization, the analysis of zone A, zone B, and zone C highlights that the rapid expansion of urban structures and transportation infrastructure has led to the diversification and complexity of surface subsidence phenomena. All subsidence areas are associated with groundwater depletion.
By integrating the monitoring results obtained by the PS method and SBAS method (
Figure 11 and
Figure 12), the Universal Kriging interpolation method is used for analysis. The results show that the subsidence regions monitored and located by the two methods are highly consistent, especially in the subsidence zone A, zone D, and zone E. This shows that both methods can efficiently and sensitively reflect the existing and newly formed surface subsidence areas.
This research shows (
Figure 13) that in the past three years, the depth of the surface subsidence funnel in the Kunming urban area has continued to increase. The most serious subsidence areas are subsidence zone A and zone C. The cumulative subsidence of the monitoring points with the most serious subsidence in the past three years has reached 99.4 mm and 83.9 mm, and the average accumulated settlement in the settling area has reached 19.0 mm and 16.4 mm, respectively (
Table 3).
According to the experimental results (
Figure 13), the sedimentation rate also presents a funnel shape in space. The end of the sedimentation rate funnel in subsidence zone A, subsidence zone B, and subsidence zone C is separated and is refined into multiple funnel mouths. The sedimentation rate funnel in subsidence zone D has the characteristic of the funnel mouth being too large, which can easily cause geological disasters. Subsidence zone E is the most typical subsidence funnel, and there is a greater probability of overall expansion of the subsidence funnel at a later period. Compared with other settling areas, the settling rate of zone F is lower, and the settling tends to stop. The maximum sedimentation rate of subsidence zone A, zone B, and zone C is 47.564 mm·a
−1, 38.829 mm·a
−1, and 50.468 mm·a
−1, respectively, all of which are located at the tiny funnel mouth of the subsidence funnel. The small proportion of the distribution area of the maximum sedimentation rate should focus on whether each small funnel mouth has a trend of contiguous pieces. The maximum sedimentation rates of zone D, zone E, and zone F are 25.086 mm·a
−1, 28.184 mm·a
−1, and 26.804 mm·a
−1, respectively, which are lower than those of zone A, zone B, and zone C.
From the time series sedimentation data of 41 stages, 8 stages were selected according to a certain time step (
Figure 14). Using the radar data to obtain the reference plane at the earliest time, serious surface subsidence occurred in subsidence zone A to zone F during the study period. The subsidence funnel in subsidence zone A and zone E developed rapidly and the subsidence rate was faster, followed by zone C, zone D, and zone F. According to the results, scattered and irregular settling funnels began to develop in zone B from January 2020 to April 2021 and gradually accelerated after 2021.
4.3. Results of GWO-LSTM Prediction Model
In this study, the combined method of the Grey Wolf Optimization algorithm (GWO) and Long Short-Term Memory network (LSTM) was used to predict the time series of land surface subsidence in different subsidence areas of Kunming City. The results of LSTM parameter optimization and the prediction accuracy index are shown in
Table 4.
In subsidence zone A, the GWO-LSTM model showed high prediction accuracy, with an RMSE and MAE of 3.5438 and 2.8288, and a coefficient of determination (R2) of 0.93532. The model can capture the dynamic change in land surface settlement in this region with high accuracy.
The prediction results of subsidence zone B show that the model also has a good performance, with an RMSE of 2.7745, MAE of 1.8907, and R2 of 0.93063. These results show that the GWO-LSTM model is reliable in predicting the surface change in subsidence zone B.
In subsidence zone C, the model also showed robust forecasting ability, with an RMSE and MAE of 2.9179 and 2.1371, and an R2 of 0.93966, which was the second-highest R2 value in all regions.
The prediction of subsidence zone D shows that the performance of the model is also well maintained here, with an RMSE of 2.9671, MAE of 2.1651, and R2 of 0.93713.
It is worth noting that the prediction performance of subsidence zone E is relatively low: its RMSE and MAE values are 2.6812 and 1.7788. The coefficient of determination R2 is 0.8379, which is lower than that of other regions. This indicates that the settlement dynamics in this region may have been affected by more complex factors, and further analysis could improve the prediction accuracy.
Finally, in subsidence zone F, the GWO-LSTM model shows the best prediction performance. With RMSE and MAE values of 3.4631 and 1.6571, and an R2 up to 0.94862, the prediction of the model in this region is highly consistent with the actual observed data.
In general, through the construction of GWO-LSTM, the proposed model has demonstrated good forecasting ability in multiple settling areas of Kunming City. This provides reliable support for the monitoring and prevention of land surface settlement in this area in the future. Nevertheless, the relatively low prediction accuracy of subsidence zone E suggests that we need to pay attention to further optimization of the model in future work. This identifies potential factors that may affect the prediction performance of this region.
The LSTM neural network optimized based on the Grey Wolf Optimizer algorithm had a time step of 5, and used the data of five periods as historical data for point-to-point prediction. The number of grey wolves was set to 3 to optimize the three parameters of LSTM. The prediction process and results are shown in
Figure 15. The error values of each monitoring point in each area converge around 0, and there is no concentrated monitoring point error showing an abrupt scattering transition. The prediction results and the test set show a high coincidence phenomenon on the graph. The prediction results have an excellent ability to show the characteristics of historical data changes.
The historical data and monitoring results were fitted according to the beginning, middle, and forecast results (
Figure 16). The upper two layers were used as the historical monitoring data, and the bottom figure was used as the future forecast data. The GWO-LSTM results show that the subsidence funnel deformation trend matches the surface subsidence trend because of historical monitoring results. The prediction models make it easier to identify areas where subsidence is becoming more severe. In the future, settlement zones A~F will continue to increase the occurrence of land surface settlement. The sedimentation funnel develops faster in the vertical direction, forming a sharp sedimentation funnel (
Figure 15 and
Figure 16). Subsidence zones A, B, C, and E all show this situation. With further subsidence, geological disasters of ground collapse can easily occur at the entrance of the subsidence funnel. Subsidence zones D and F continue to show an overall settlement trend. The edge of the subsidence funnel will cause damage to buildings and other infrastructure, with the risk of structural cracks and collapse.
5. Discussion and Conclusions
5.1. Monitoring the Adaptability of Models in Different Environments
In this study, the correlation analysis of accuracy demonstrates that PS-InSAR and SBAS-InSAR are equally effective in monitoring settlement in urban areas of Kunming. However, each method is suitable for different monitoring environments based on its unique advantages.
PS-InSAR: The PS technique shows better adaptability in areas with high stability and dense scattering points. The technique relies on stable scattering points (e.g., buildings, rocks, etc.) and therefore performs well in built-up areas (e.g., subsidence zones D and F). In these areas, buildings are built stably, and PS points are dense and stable. Hence, PS-InSAR can provide highly accurate settlement monitoring results.
SBAS-InSAR: For low-frequency deformations and nonlinear deformations, SBAS technology shows a unique advantage. SBAS technology performs better in large engineering and construction areas (e.g., settlement zones B and E). These areas are undergoing large-scale urban construction, the surface changes are more intense, and there are fewer stable scattering points. SBAS technology can better deal with nonlinear deformation and low-frequency deformation, so it is suitable for areas with intense surface changes. In particular, in zone B, due to the existence of large-scale construction activities, SBAS-InSAR can more accurately reflect the subsidence.
As for zones A and C, where the development rhythm is stable, both PS-InSAR and SABS-InSAR have good performance. Considering that the urbanization process in the future tends to develop towards zone B, while zone A and zone C gradually tend to be stable, the PS method is more suitable for monitoring zone A and zone C.
The R2 was as high as 0.98 in settlement zone C and settlement zone F, showing a high degree of consistency between the two techniques. However, the R2 is only 0.88 in settlement zone B and settlement zone E. Settlement zones B and E are fast-developing urban areas with rapid building growth, which leads to the lack of stabilization of the PS points and some spatial incoherence. Therefore, it further indicates that the SBAS monitoring results are more reliable in these areas.
5.2. Application of the GWO-LSTM Modeling
In this study, the Grey Wolf Optimization (GWO) algorithm was used to enhance the performance of the Long Short-Term Memory Network (LSTM) in predicting surface settlement in urban areas of Kunming.
GWO is a meta-heuristic algorithm; it simulates the hunting behavior of grey wolves and enhances the prediction model through the following aspects.
Strong social cooperation mechanism: GWO relies on the social division of labor and cooperation strategies in grey wolf packs, which makes the algorithm more efficient in tracking the global optimal solution. This enhances the convergence speed and accuracy of LSTM in surface subsidence prediction.
Flexible Approximation Mechanism: In GWO, individual grey wolves update their positions based on the current optimal candidate position. The parameters of LSTM have effectively been optimized. This allows the model to maintain a balanced exploration and exploitation capability at all stages, which enhances the understanding of time series data.
Adaptive behavior: GWO introduces adaptive behavior, which enables the algorithm to dynamically adjust the search strategy and behavior. It improves the model’s accuracy in predicting various types of subsidence trends.
It makes up for the shortcomings of traditional LSTM in the following aspects:
Long-term dependency modeling problem: GWO optimizes the parameters of LSTM, such as the number of hidden layers and the number of units, which enhances the model’s ability to deal with long-term dependencies. By the optimal combination of parameters, GWO improves the LSTM model’s ability to capture and maintain long-term contextual information.
Insufficient Data Problem: GWO selects the most appropriate interpolation or filling techniques by the missing data optimization in the data preprocessing stage. Meanwhile, by optimizing the hyperparameters of the LSTM model, GWO can improve the performance of the model on small sample data and enhance the robustness to incomplete data.
Overfitting problem: GWO optimizes the training process of LSTM models through cross-validation and early-stopping techniques to reduce the risk. GWO can find the optimal regularization parameters and dropout ratios, which prevents the model from overfitting the training data and improves the generalization ability.
Parameter selection problem: GWO can find the optimal combination of LSTM parameters in the parameter space through its global search capability. The parameters optimized by GWO include the network structure, the learning rate, the number of iterations, and so on. Hence, it improves the performance of the model, which ensures the accuracy and stability of the prediction results.
5.3. Sedimentation Phenomena and Mechanisms
The GWO-LSTM model provides a new perspective on understanding and predicting ground subsidence in Kunming’s urban areas. It represents the broad application potential in preventing and mitigating geological disasters, which guides urban planning. Through detailed field surveys and continuous monitoring, this predictive model can provide more accurate data support for geological disaster prevention, which contributes to sustainable urban development.
Notably, the subsidence prediction model for Kunming’s urban area reveals a potential trend of aggravated subsidence in zone E. New subsidence near the new Metro Line 5 highlights the need to prevent geological risks in urban development. In the future, the authors will continue to monitor the subsidence dynamics in Kunming’s urban areas, and timely propose reasonable disposal and preventive measures based on research results to ensure the safety and sustainability of urban development.
Groundwater is widely used for daily life, industrial production, and agricultural irrigation in the city. The north shore of Dianchi Lake near Daguanlou Park has relatively abundant groundwater resources with good water quality, which makes it one of the preferred water sources. However, rapid urban development and population growth have led to a high demand for groundwater resources. Especially in the fast-developing eastern and northern shores, industrial water demand has significantly increased, which exacerbates the pressure on groundwater extraction. In zone A, zone B, and zone C, which are located in these areas, rapid economic development has led to increasingly severe subsidence. There is a very direct relationship between groundwater extraction and ground subsidence. When groundwater is pumped out, the original pore pressure in the water decreases. This causes the pore water volume to shrink, which leads to the rearrangement of underground sediments, resulting in soil layer subsidence and a vicious cycle of reduced groundwater storage capacity.
At a later stage, attention should focus on the use of groundwater resources in the region to avoid overdrawing and thereby mitigate surface subsidence.


