Article

A Study on Deformation Characteristics and Stability of Soft Surrounding Rock for a Shallow-Buried Tunnel

1
School of Traffic and Transportation, Lanzhou Jiaotong University, Lanzhou 730070, China
2
Department of Mining and Geological Engineering, University of Arizona, Tucson, AZ 85721, USA
3
China Merchants Chongqing Communications Technology Research and Design Institute Co., Ltd., Chongqing 400067, China
*
Author to whom correspondence should be addressed.
Appl. Sci. 2024, 14(14), 6014; https://doi.org/10.3390/app14146014
Submission received: 9 May 2024 / Revised: 24 June 2024 / Accepted: 5 July 2024 / Published: 10 July 2024
(This article belongs to the Special Issue Smart Geotechnical Engineering)

Abstract

:
The Heimaguan Tunnel in China serves as a case study to exemplify the variation laws related to surface settlement, deformation, and stress characteristics in a shallow-buried soft-rock tunnel, while emphasizing in the tunnel support requirements. The first stage of this study begins with monitoring the time-varying characteristics of surface settlement, vault subsidence, and the horizontal convergence of Grade V rock. In the second stage, Peck theory is used to calculate the distribution characteristics of surface settlement. The results of both stages are compared to create a vault settlement model, thus establishing the horizontal convergence based on exponential function, logarithmic function and hyperbolic function, and determining the optimal time of secondary lining construction. On this basis, the time-dependent variation laws and characteristics of vertical and horizontal displacement and principal stress of surrounding rock are studied. After this, using simulation and analysis, the proper support is recommended. The study reveals that the surface settlement, vault subsidence, and horizontal convergence of the shallow-buried soft-rock tunnel stabilize within 25–30 days. Peck theory closely aligns with predictions based on exponential functions, with only a 0.72% difference. The recommended time for secondary lining application is 26–27 days.

1. Introduction

In recent years, numerous tunnels have been constructed for highways, railways, water conservancy, and for hydropower infrastructure in China. As the construction environment is becoming increasingly complex, such as shallow tunnels, long tunnels, and soft-rock tunnels, attention is drawn to the challenges posed by shallow-buried soft-rock tunnels. These tunnels exhibit weak surrounding rock, poor stability, and significant excavation-induced deformation, leading to potential disasters such as surface settlement, vault collapse, and damage to supporting structures during tunnel excavation. Such instability can impact the safety of construction procedures and personnel [1,2,3].
To address these issues, experts and scholars have dedicated substantial efforts to stabilize shallow-buried soft-rock tunnels, yielding valuable insights. Yuan et al. [4] investigated how different constitutive models influence surface settlement predictions. Li et al. [5] developed an expression for tunnel surface settlement in composite strata tunnels based on random medium theory. Su et al. [6] proposed a formula to estimate ultimate deformation and strain in soft-surrounding-rock tunnels. Sun et al. [7] analyzed deformation characteristics and acceleration in the rock surrounding tunnels, deriving a comprehensive deformation model for both deep and shallow-buried tunnels. Yang et al. [8] explored the relationship between tunnel section size, construction method, surrounding rock grade, and excavated surface stability using orthogonal experiments and range analysis. Abdellah et al. [9] investigated the effects of joints, fissures, and cross-section shape in shallow-buried tunnels. Deng et al. [10] put forth a support scheme for soft-rock tunnels, combining weakening anchors with enhanced rigidity and initial support strength. Additionally, Yang et al. [11] conducted long-term stability studies on soft-rock tunnels through experiments and field tests. Lv et al. [12] conducted some laboratory tests and examined the mechanical characteristics of mudstone based on the Badong Tunnel, and the large deformation collapse process of the tunnel face was simulated. Xu et al. [13] studied the reinforcement effect of high-pressure rotary jet method on surface in shallow-buried sections of tunnels. Zuo et al. [14] studied the stress characteristics of the supporting structure of expansive soft-rock tunnels and built a swelling force release method of tunnel support with expansive soft rock.
In practice, tunneling plans, optimal construction times for tunnel support, and the stability of tunnel construction are closely linked to the mechanisms and processes of surrounding rock deformation. On-site monitoring and numerical simulation serve as crucial methods [15,16]. However, there is a relative scarcity of studies focusing on the time-varying characteristics and laws governing surface settlement, deformation of the surrounding rock, and stress within supporting structures in shallow-buried tunnels. In this study, the Heimaguan Tunnel serves as the subject of investigation. Researchers analyze the time-dependent settlement characteristics of the tunnel surface, vault subsidence, and horizontal convergence through on-site monitoring and regression analysis. This analysis informs the determination of the optimal secondary lining construction time. Based on these findings, a numerical simulation model is developed to assess the deformation of the surrounding rock and stress characteristics relevant to supporting structures. The study’s conclusions provide a theoretical foundation and serve as a reference for the design, maintenance, and research of shallow-buried soft-rock tunnels.

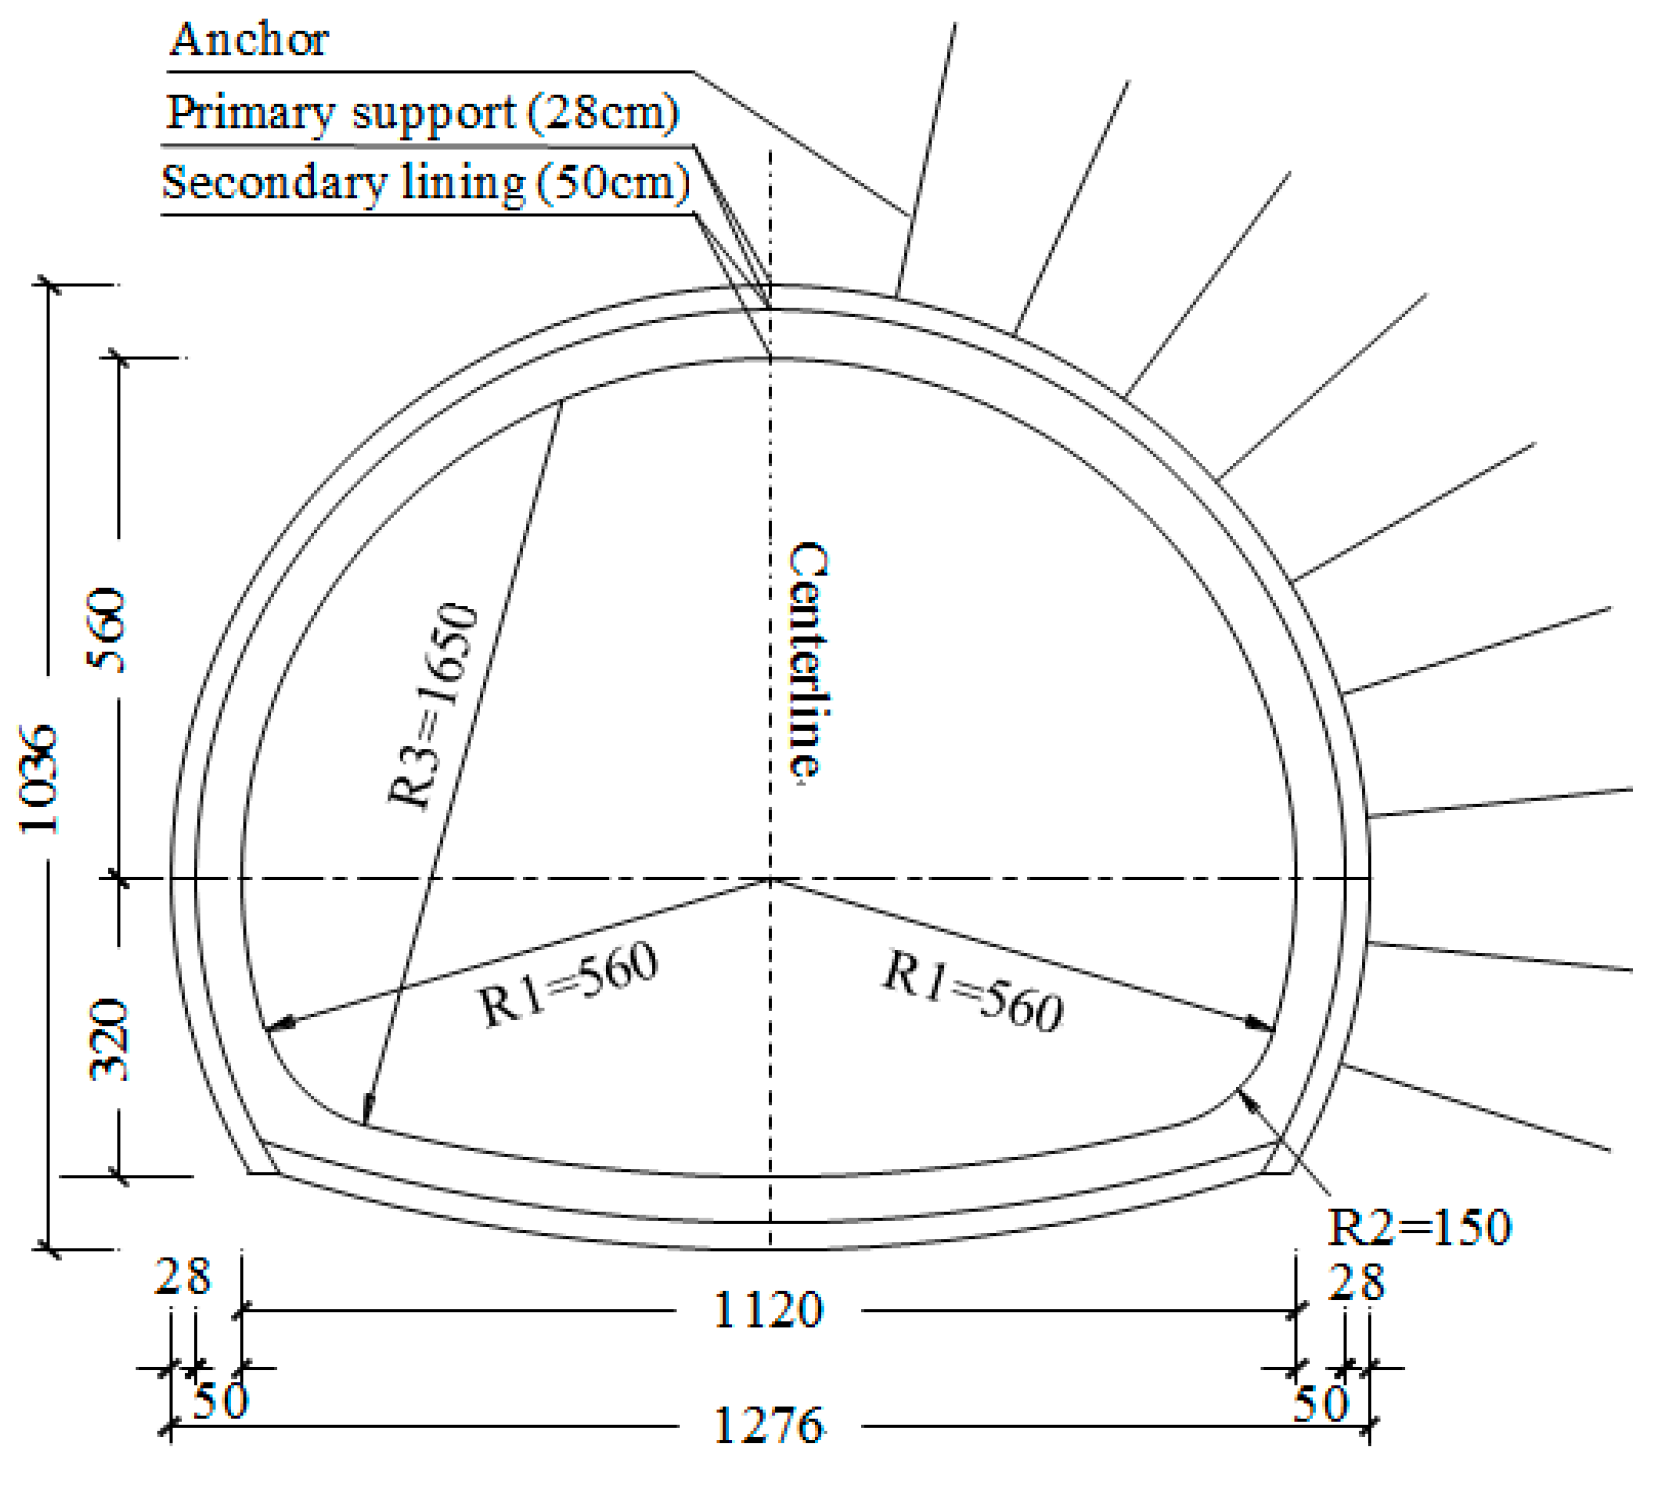
2. Engineering Overview

The Heimaguan Tunnel is a single, extra-long tunnel. Right line length is 5250 m from YK12 + 840 to YK18 + 090, and left line length is 5216 m from ZK12 + 840 to ZK18 + 056. The tunnel site overlies colluvial deposits of silty clay and alluvial breccia, with underlying bedrock composed of Devonian limestone, slate, carbonaceous slate, phyllite, and fault breccia. The surrounding rock primarily falls into the Grade IV and Grade V categories. For Grade IV rock, the upper and lower step method is employed, while Grade V utilizes the upper and lower step reserved core soil approach. The buried depth of Grade V surrounding rock ranges from approximately 35 m to 110 m. In this study, the Section ZK13 + 092 within Grade V rock serves as the focal point. Due to the fractured and soft nature of the surrounding rock, combined support methods—including shotcrete, anchors, reinforcing mesh, and steel arches—are used for the primary supports [17,18]. Additionally, a C35 reinforced-concrete structure constitutes the secondary lining. The cross-section of the tunnel is shown in Figure 1, and the parameters of tunnel supports are listed in Table 1.

3. Tunnel Stability Based of In-Site Monitoring

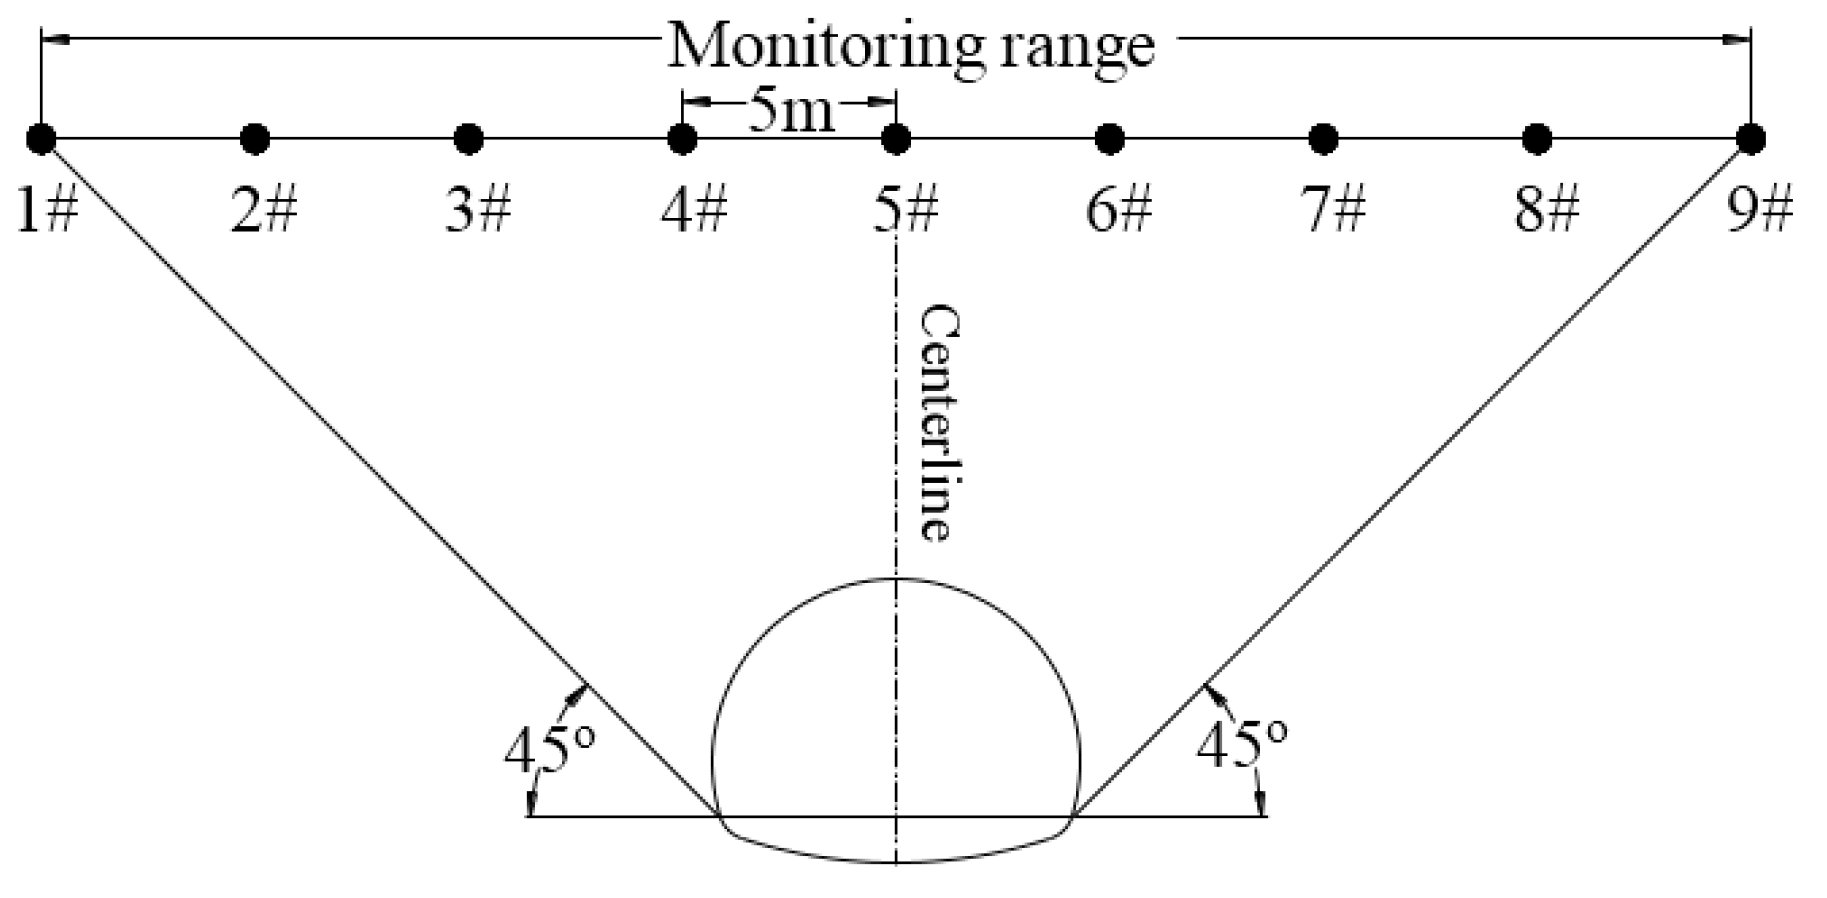
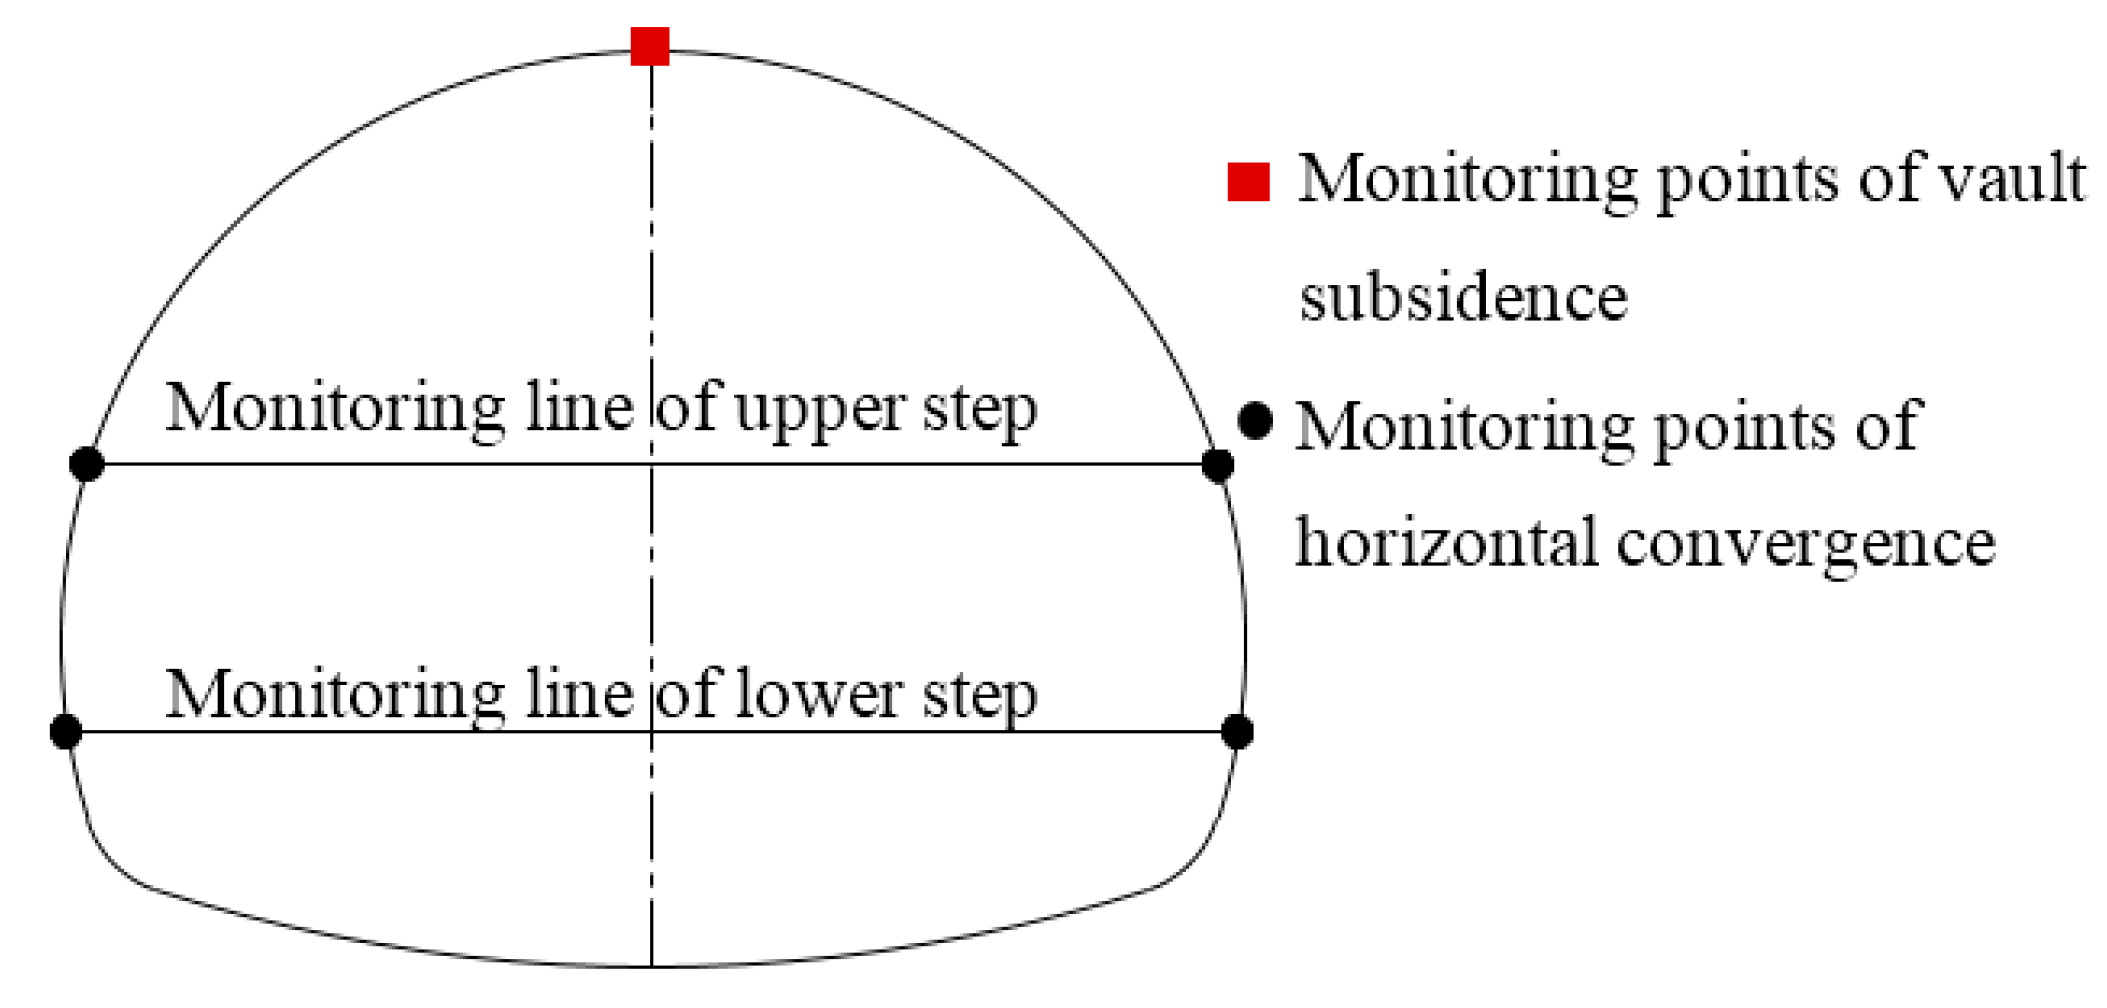
3.1. Layout Scheme of Monitoring Points

To ensure tunnel stability, nine monitoring points were arranged to monitor surface settlement with the tunnel centerline as the symmetry axis, and the lateral distance of the monitoring points is 5 m. The layout of these points is shown in Figure 2. Additionally, other monitoring points are placed at the vault and upper and lower steps to analyze the deformation patterns and stability [19,20,21] of the surrounding rock of the tunnel during its construction. These monitoring points are shown in Figure 3. In this project, the monitoring equipment includes a leveling instrument, total station, steel ruler, and convergence gauge. The surface settlement was measured and monitored by the leveling instrument, total station, and steel ruler; subsidence of the vault was monitored by the total station, steel ruler, and convergence gauge; and horizontal convergence was measured by the total station and convergence gauge.

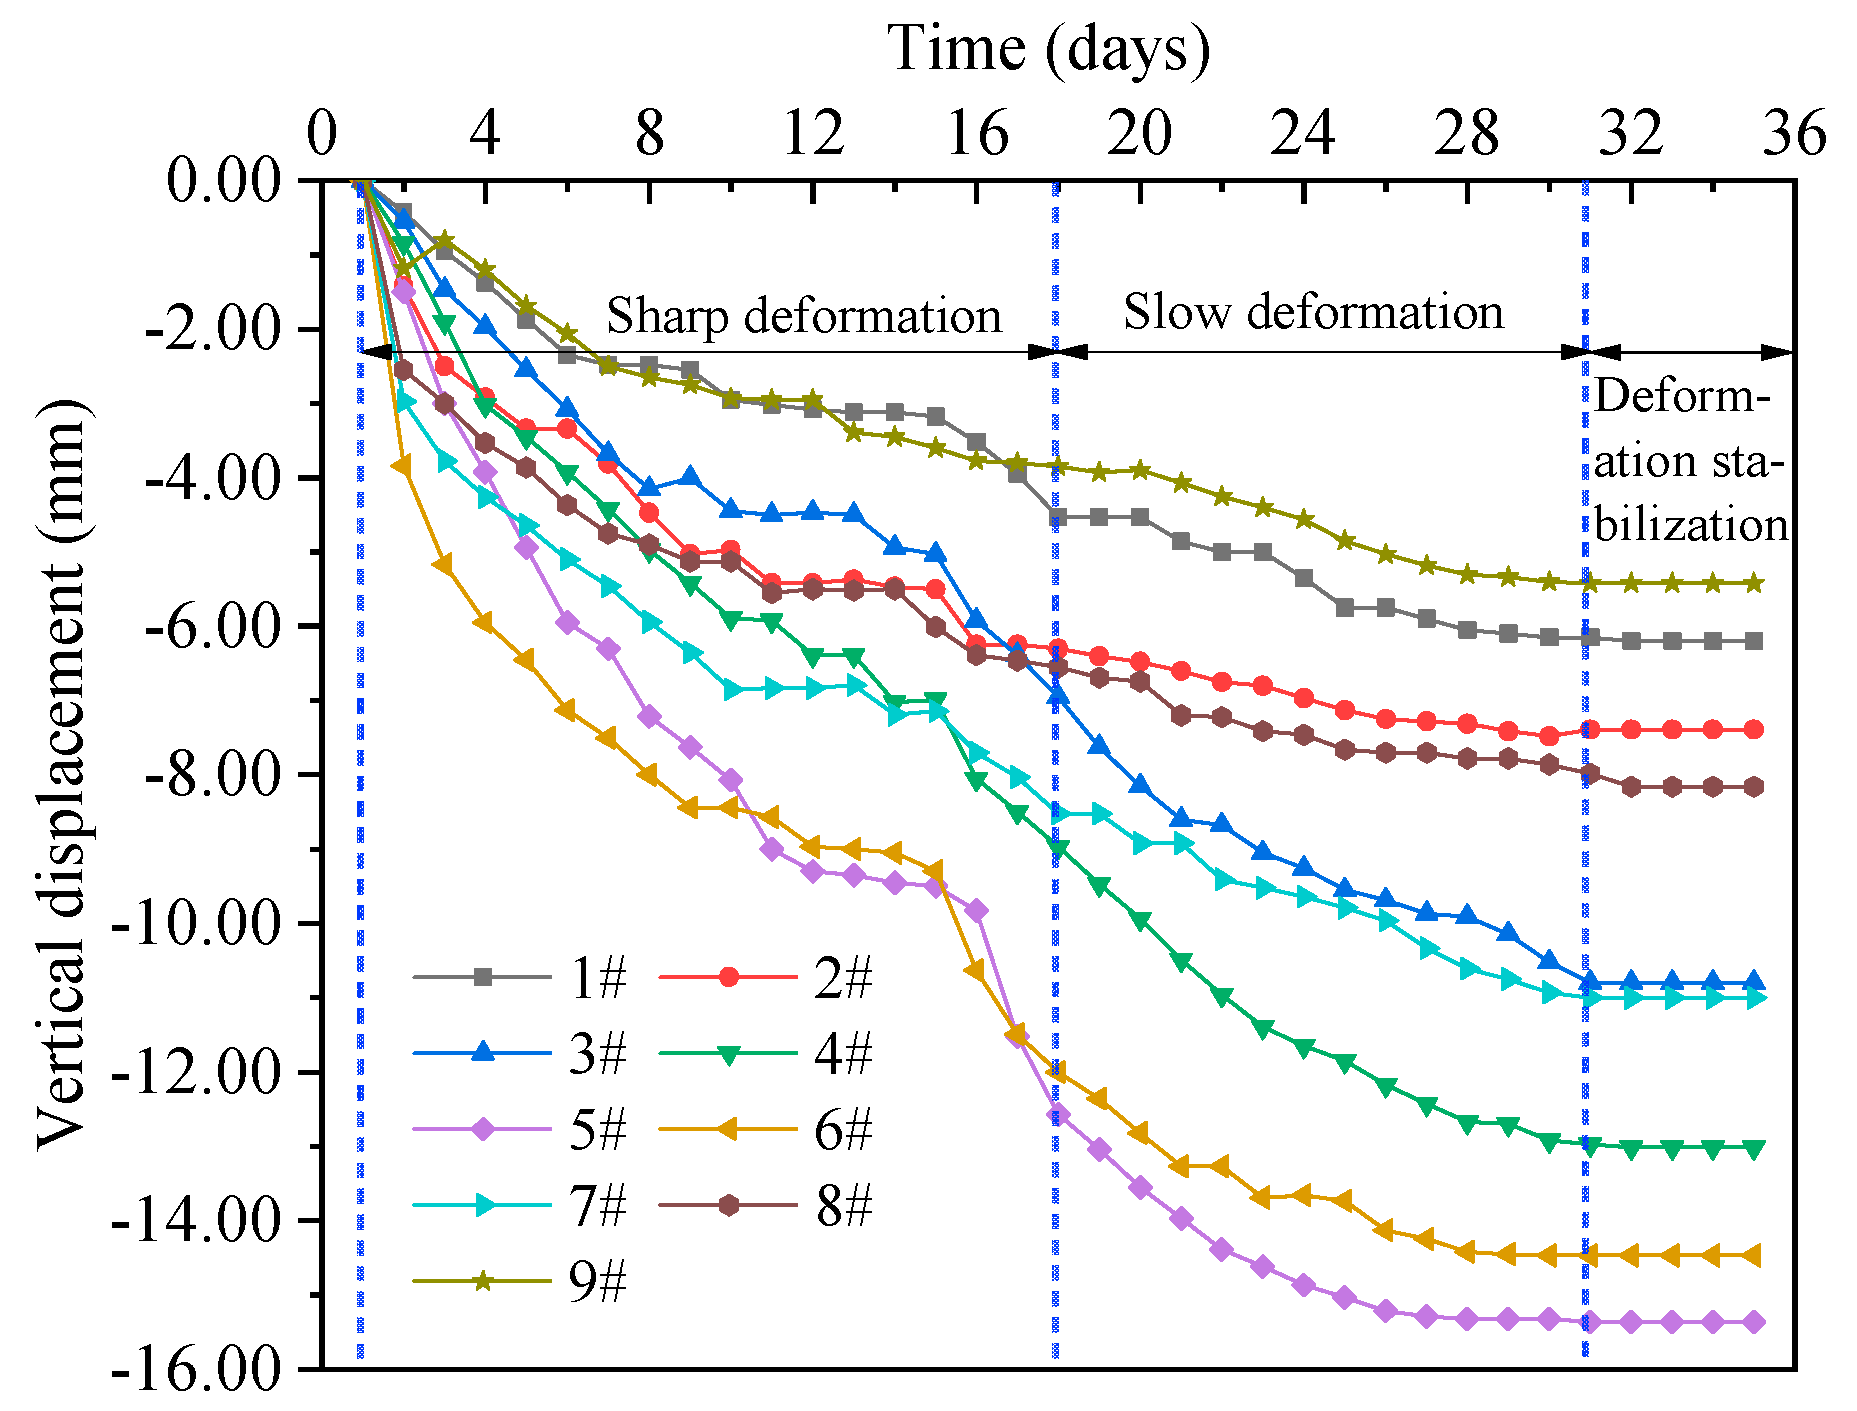
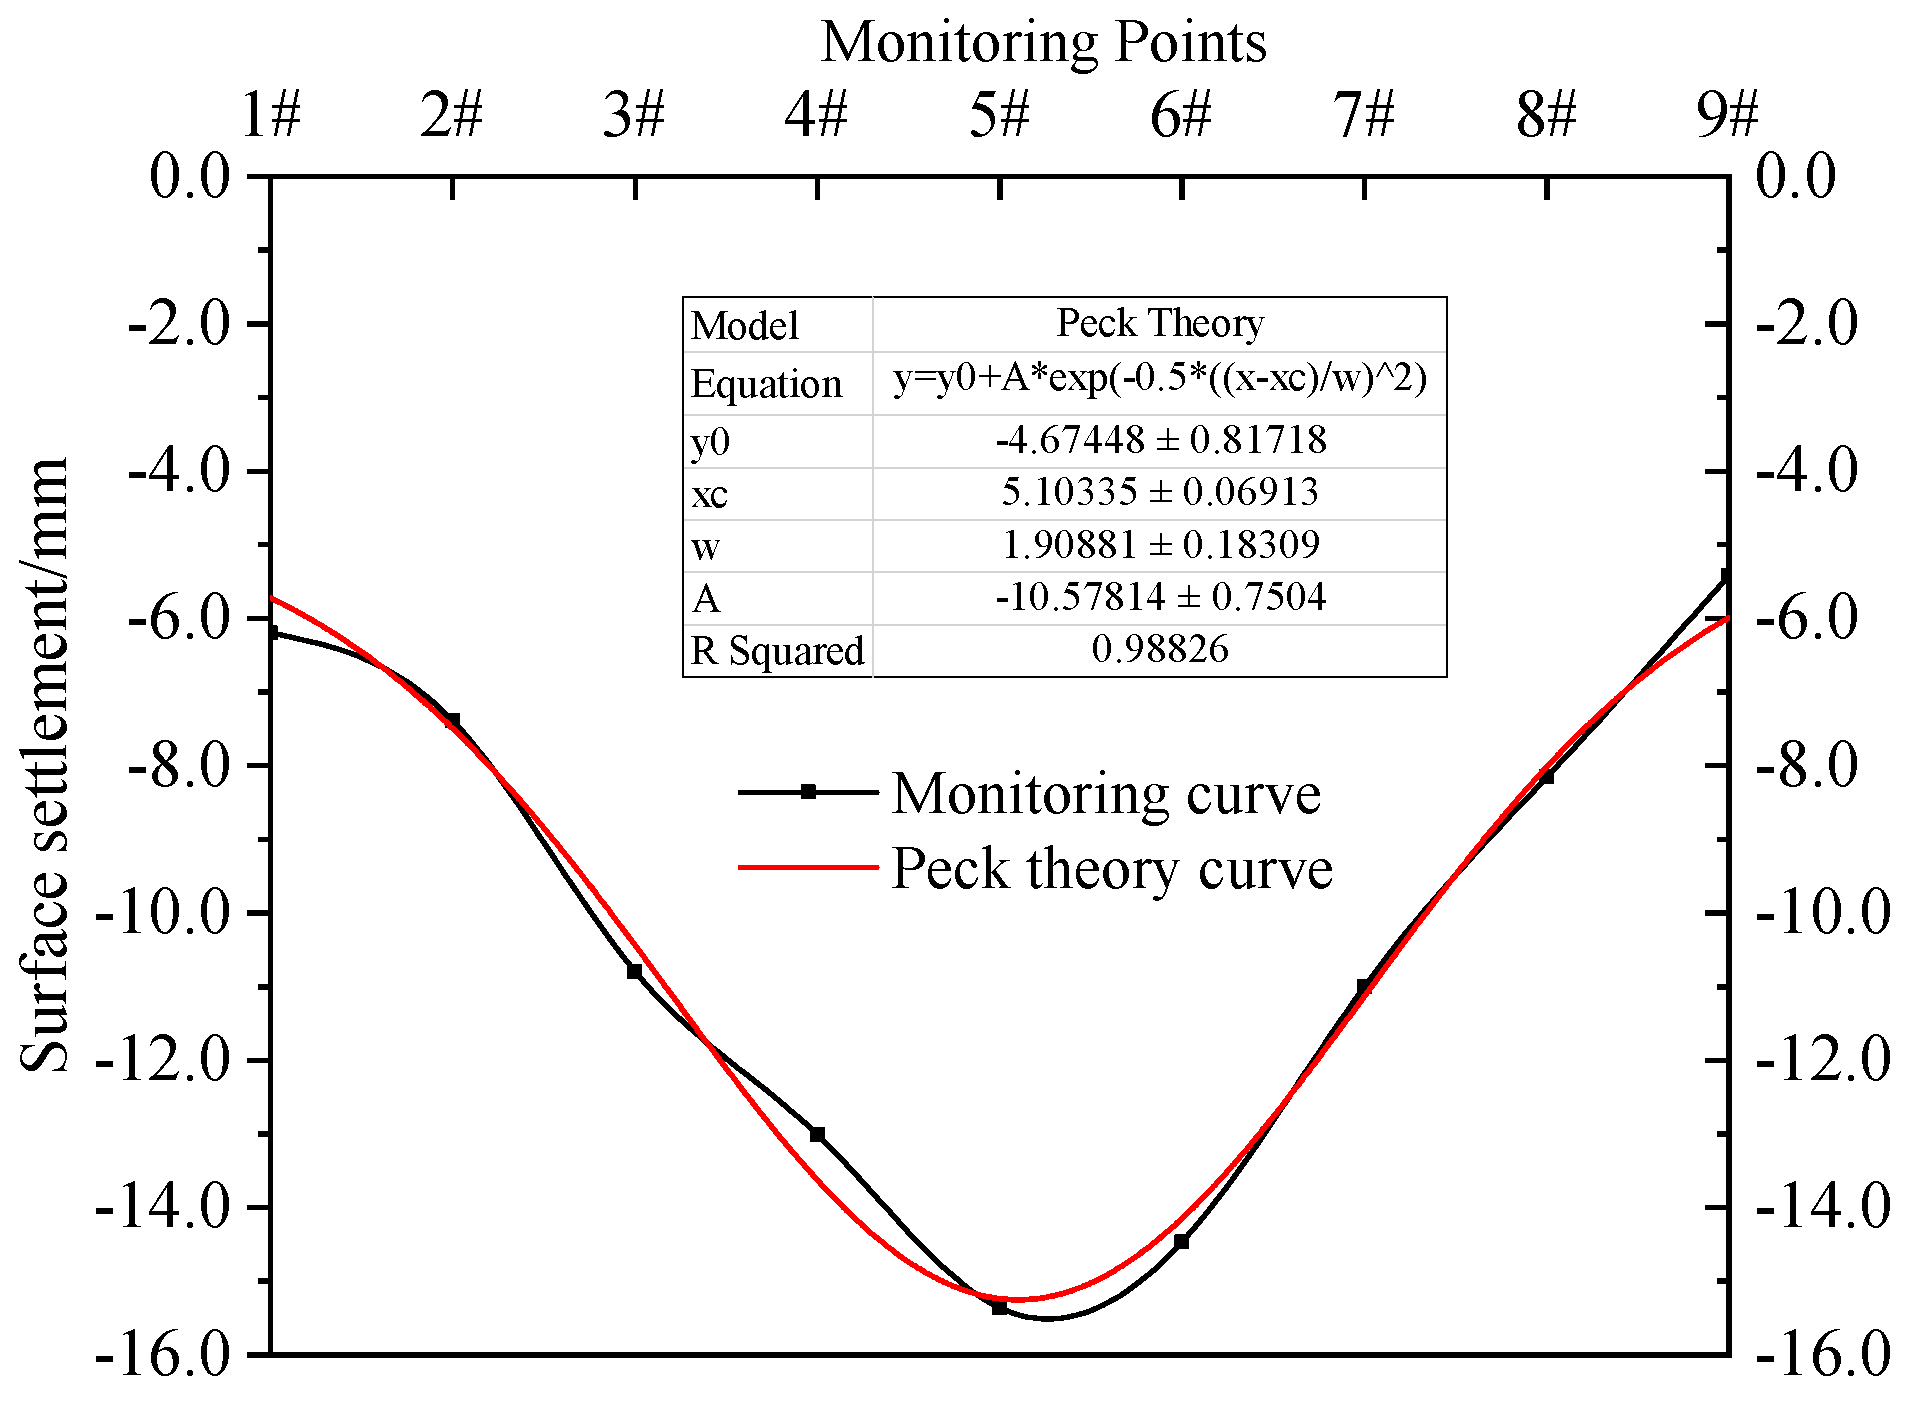
3.2. Analysis of Surface Settlement

The time graph for vertical displacement of each point is shown in Figure 4, and the surface settlement curve is shown in Figure 5.
It can be seen from Figure 4 that with the advance of the working face, the settlement of each measuring point shows the following main processes [22,23,24]: (1) Sharp deformation. It lasted about 18 days, and the settlement rapidly occurs during this initial phase. On average, each monitoring point experiences approximately 76% of its final settlement. (2) Slow deformation. It lasted about 12 days. A slower settlement process ensues, and the average settlement at each measuring point contributes to about 20% of the final settlement. (3) Deformation stabilization. After monitoring for 31 days, the subsidence amount of each measuring point is very small, and the subsidence rate approaches zero, indicating that surface subsidence has reached a stable state.
Figure 5 shows the following: (1) The change trend of the curve for settlement of the surface is consistent with that calculated by Peck theory [1,19], and the final surface settlement is symmetrically distributed with the tunnel center line as the symmetry axis. (2) The smaller the distance between the monitoring point and the central line of the tunnel, the greater the settlement. On the contrary, the greater the distance between the monitoring point and central line of the tunnel, the smaller the settlement. The settlement of measuring point No.5 above the middle line of tunnel is the largest (15.36 mm), and the values for measuring points No.1 and No.9 are 6.20 mm and 5.42 mm, respectively. (3) The calculated width coefficient of the ground subsidence tank is 1.91, and the maximum ground subsidence value is 15.25 mm, which is only 0.72% less than the field monitoring value. The determination coefficient is 0.981 and residual sum of squares is 1.229, thus indicating that Peck theory can well predict the surface settlement law of shallow soft-rock tunnels.

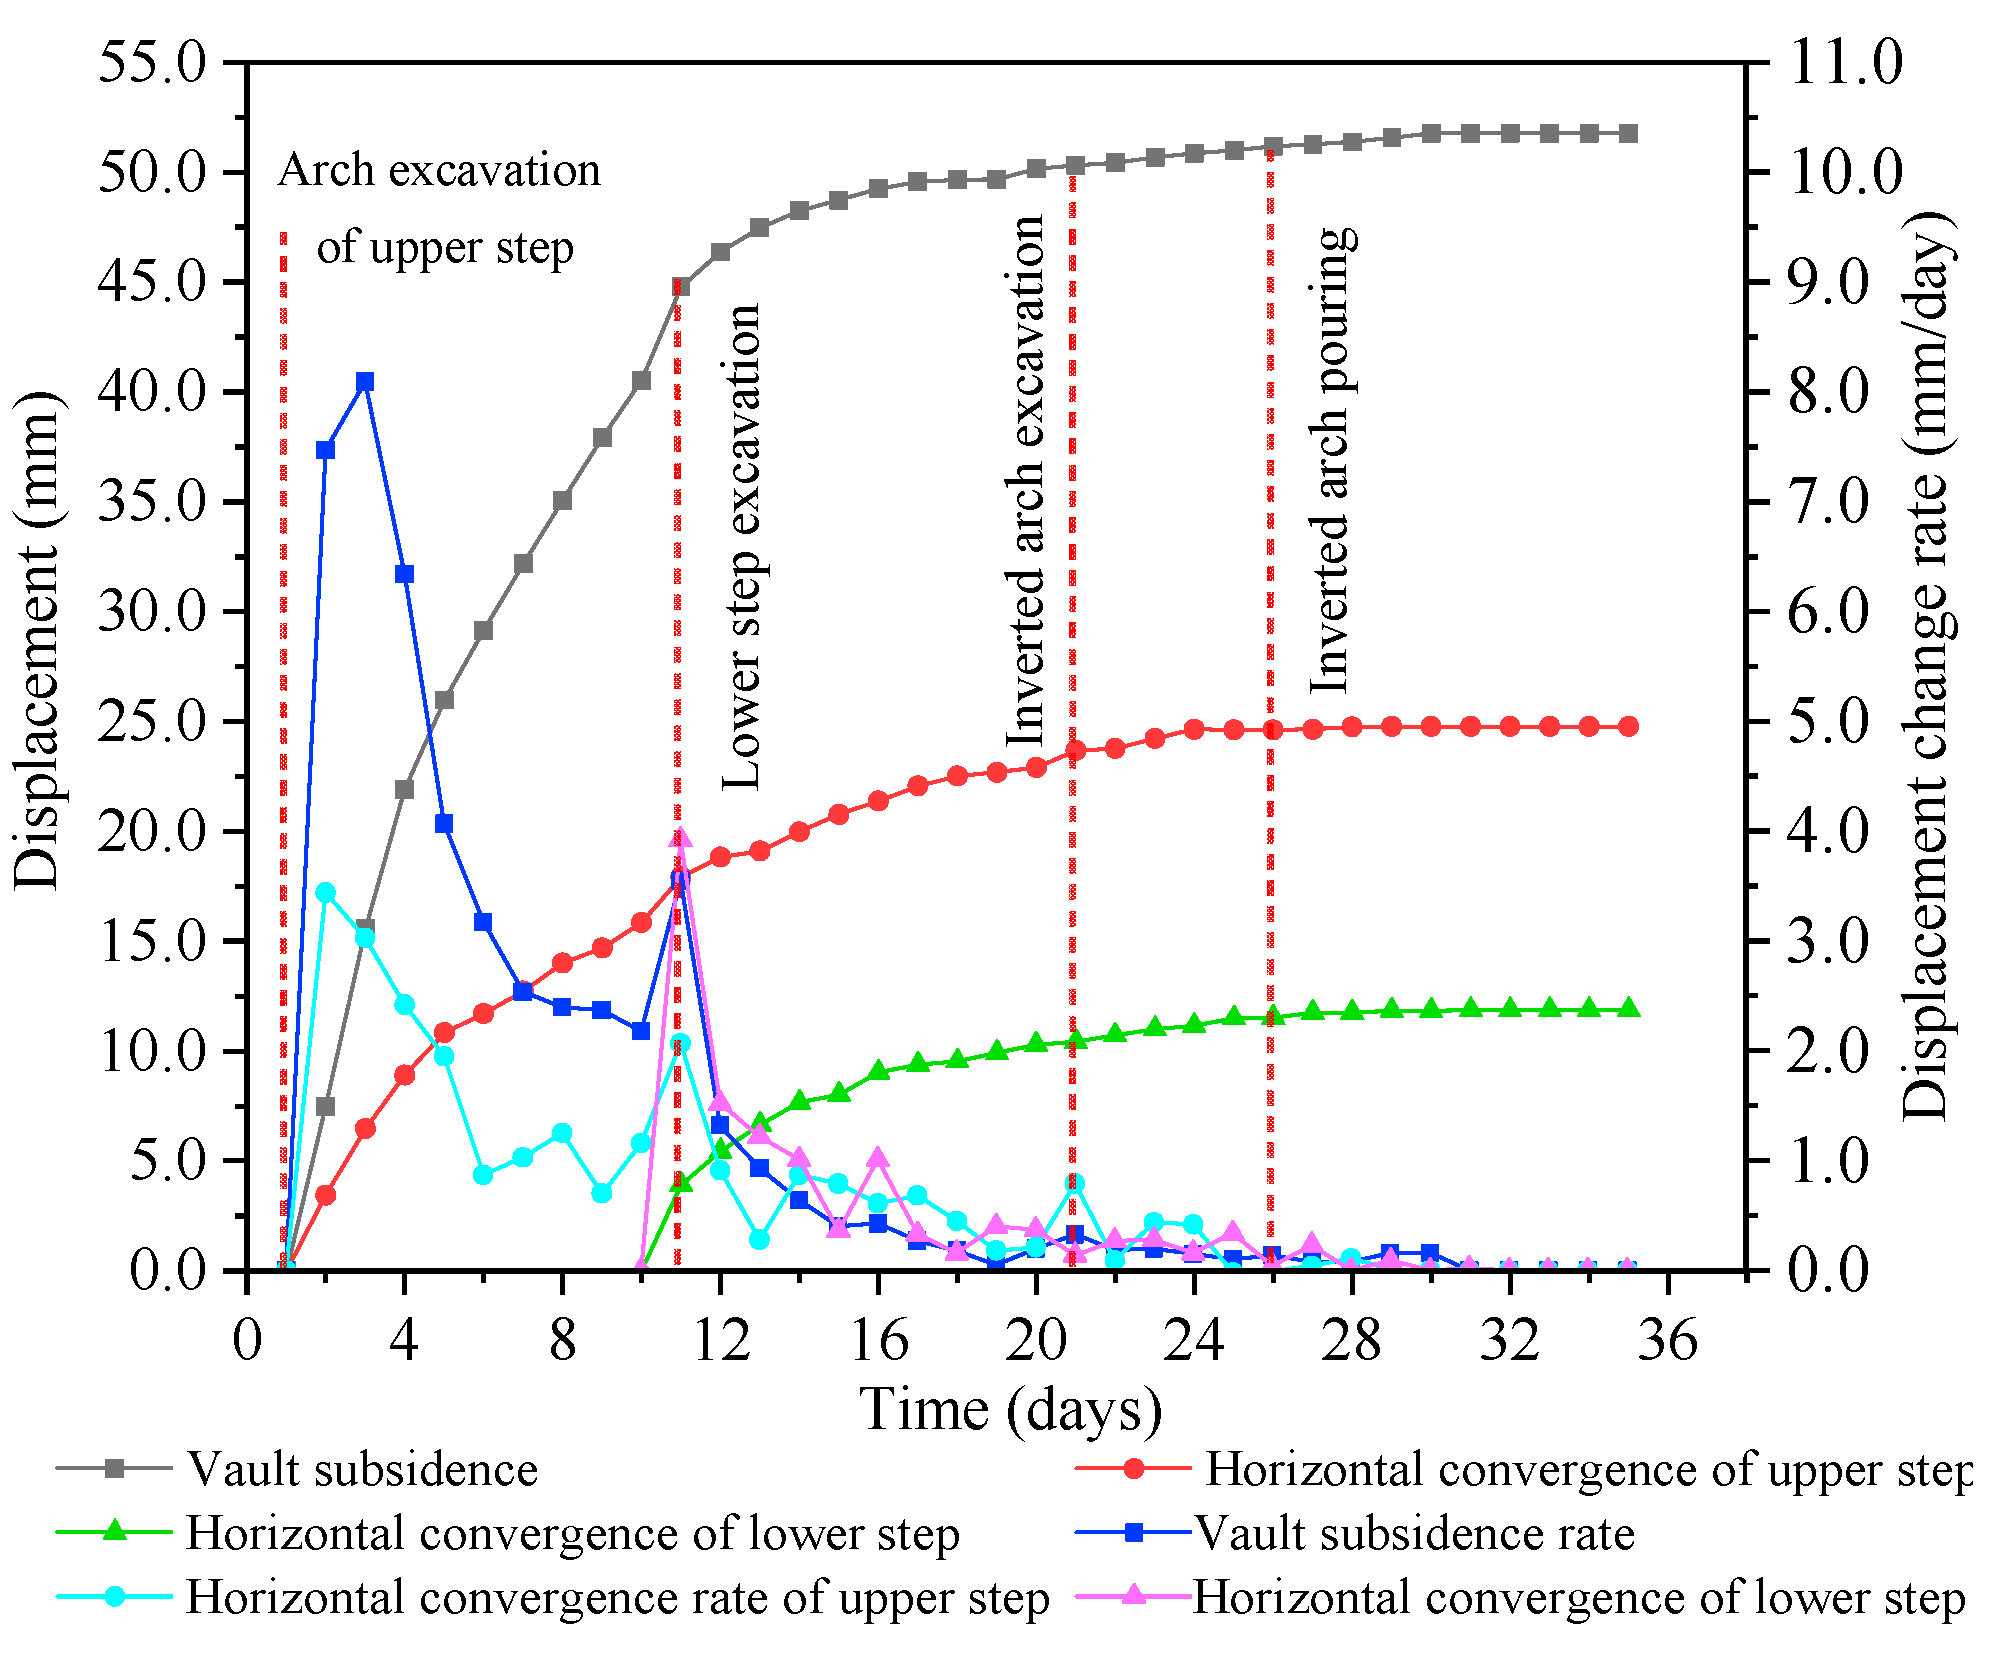
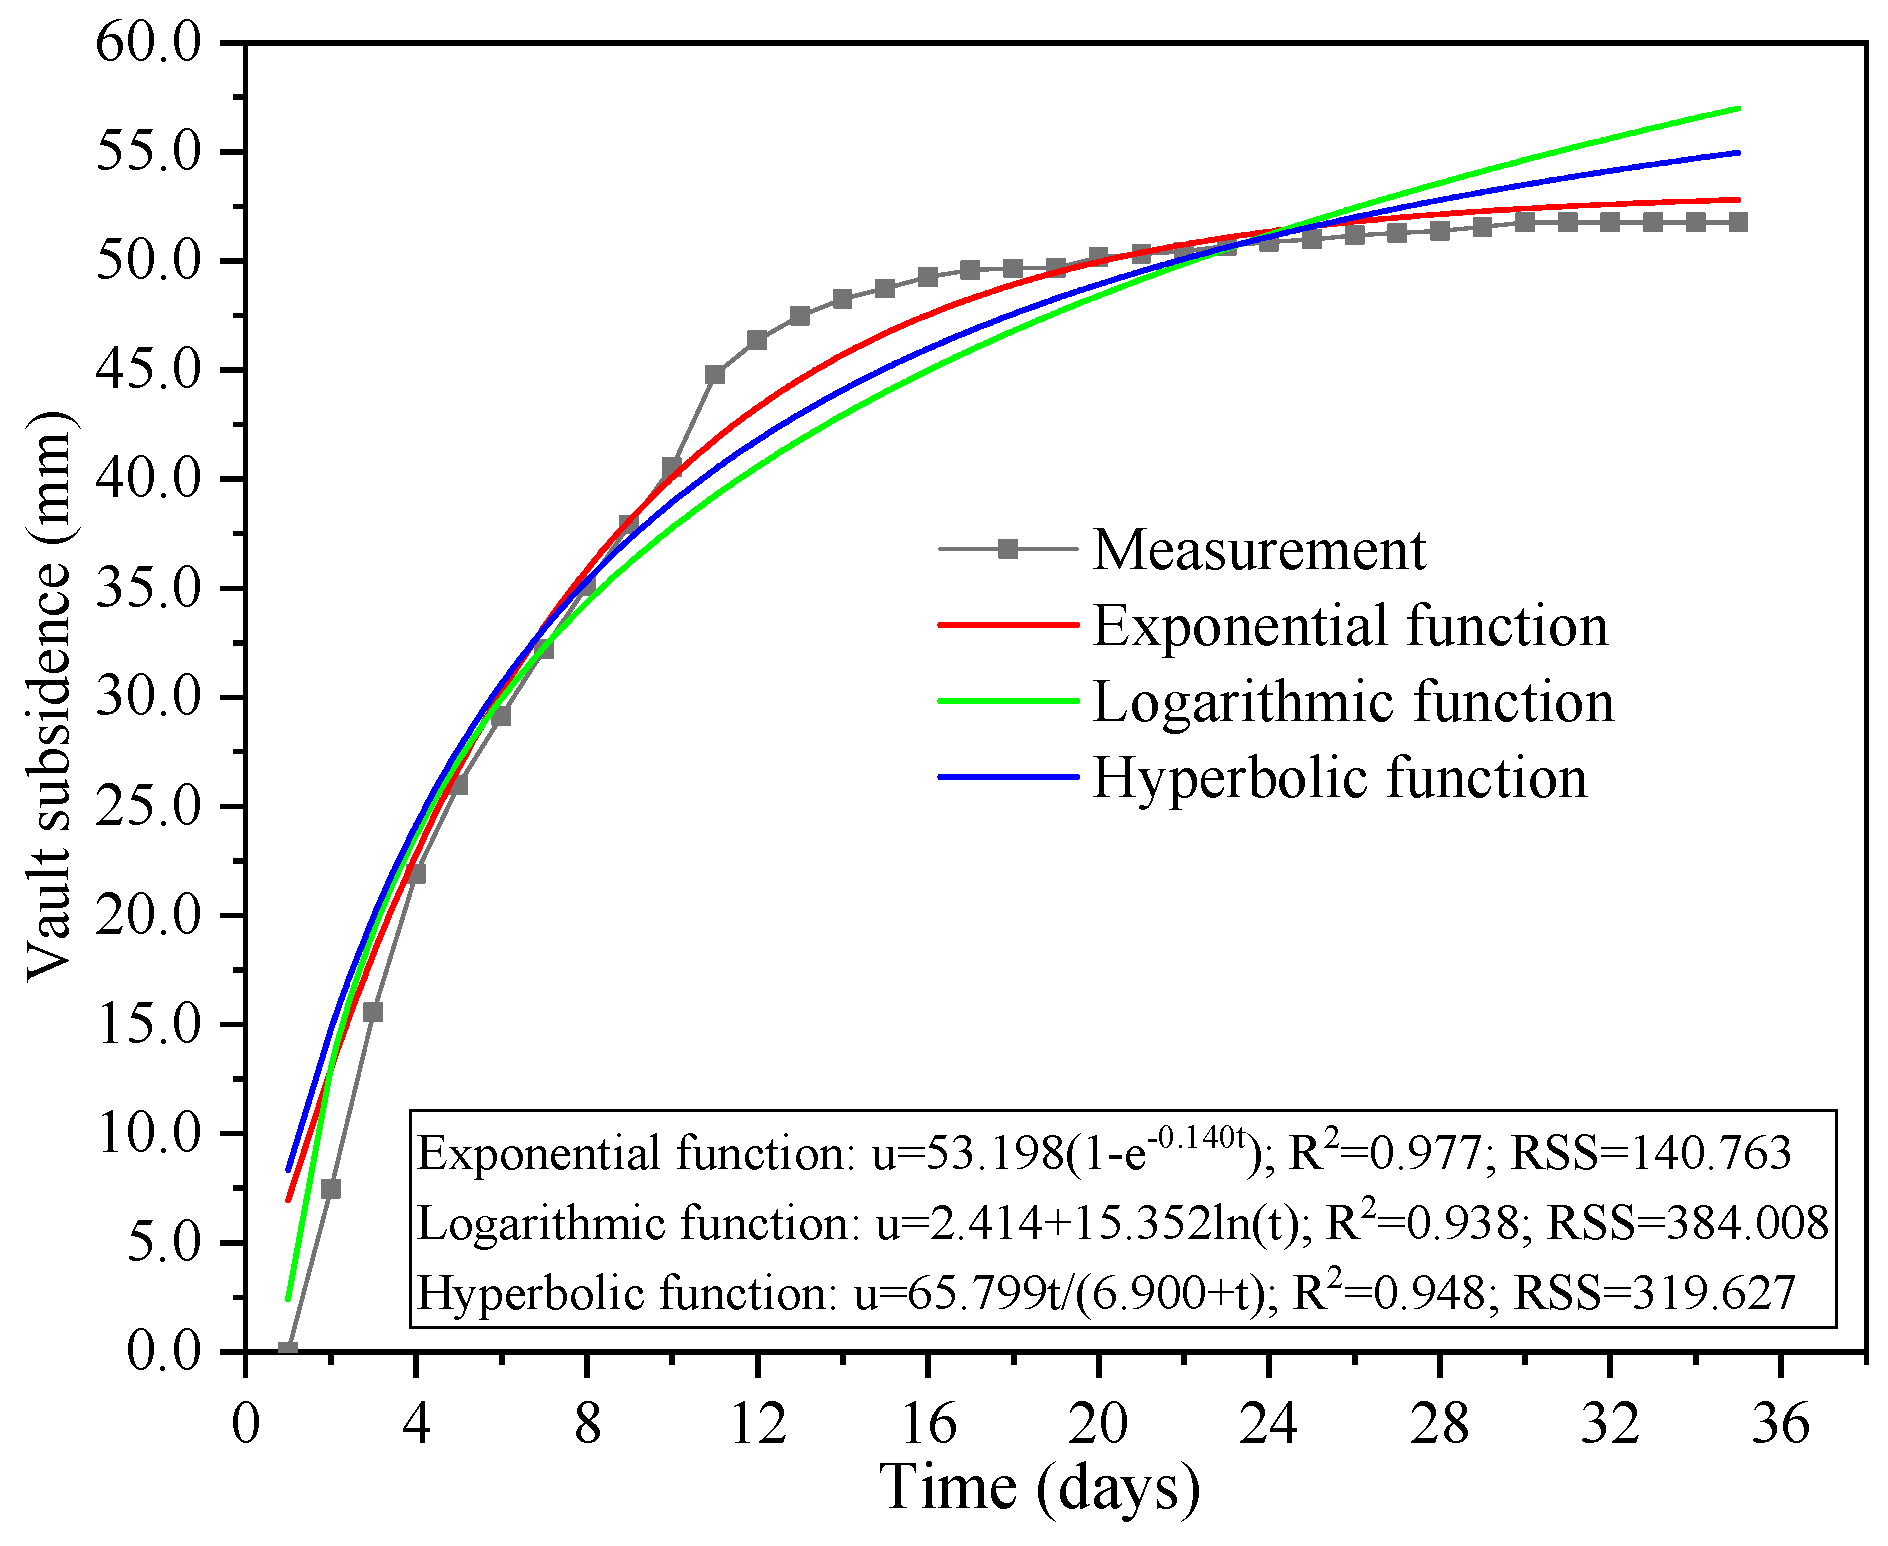
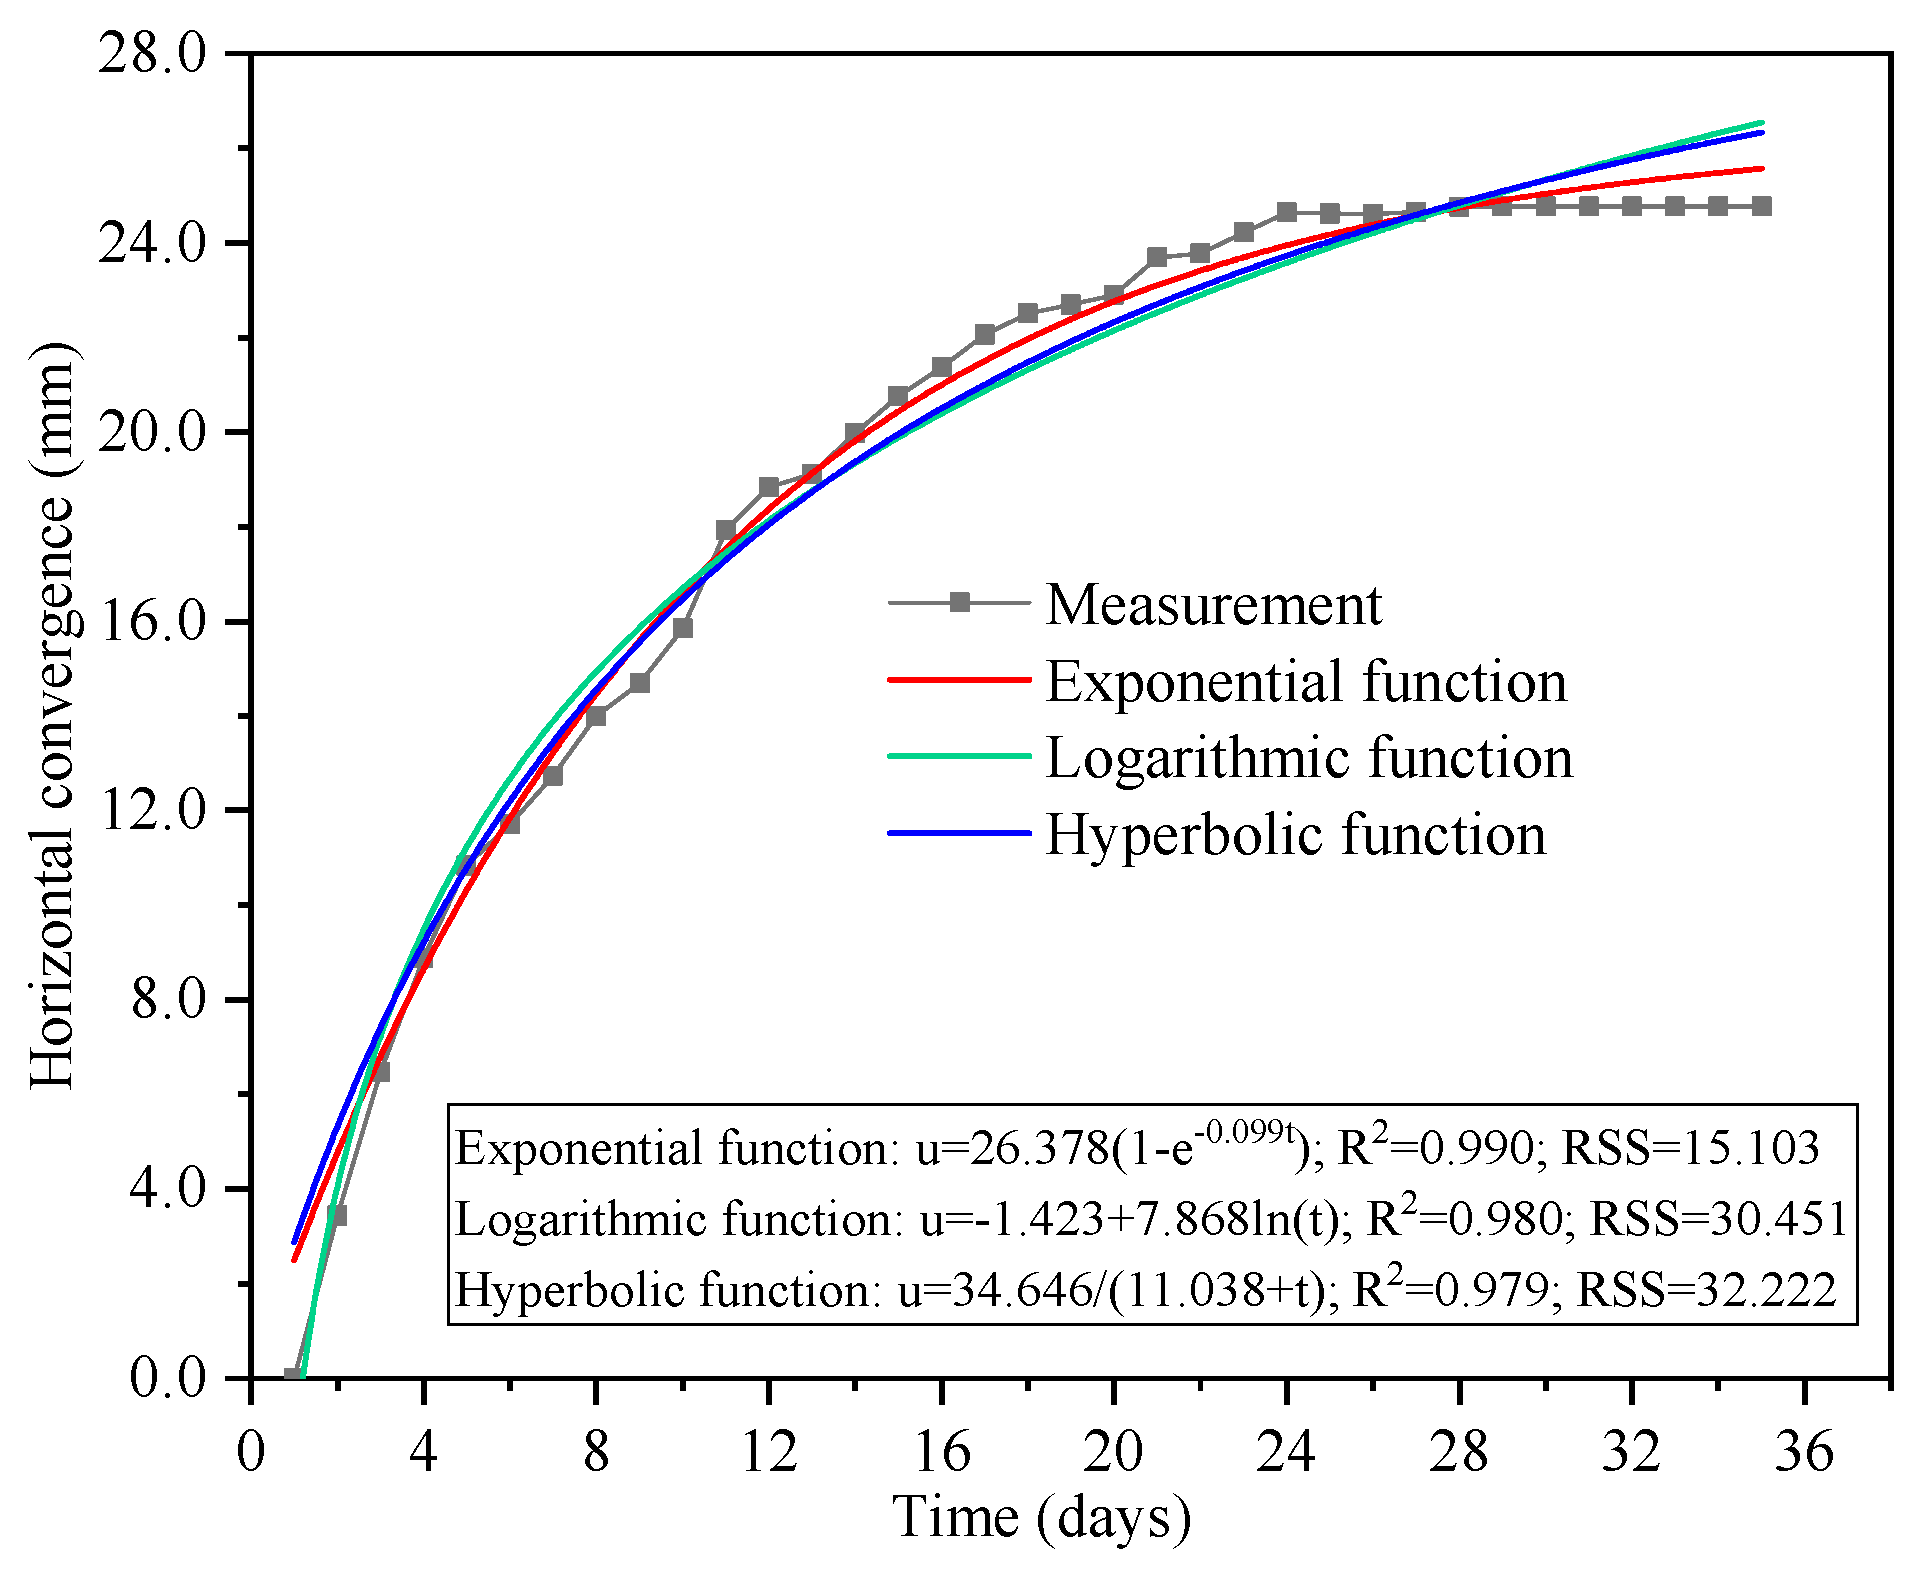
3.3. Monitoring and Analysis of Subsidence of Vaults and Horizontal Convergence

The variation curves of displacement and tunnel vault subsidence and horizontal convergence rates are shown in Figure 6.
After observing Figure 6, the following can be noted: (1) Vault subsidence [23,24] increased sharply in the first 11 days after tunnel excavation, during which the subsidence accounted for 86% of the total subsidence. After that, the vault subsidence entered a slow growth stage, lasting about 14 days, and the subsidence amount accounted for 9% of the total subsidence amount. After 26 days of tunnel excavation, vault subsidence converges, and the measured convergence value of vault settlement is 51.77 mm. (2) After excavation, the subsidence rate of the vault varies significantly within 11 days, whereas the daily average subsidence rate is about 4.22 mm/d, showing that the surrounding rock is in rapid deformation. After that, it gradually decreases and tends to be stable.
Figure 6 also shows the following: (1) Within 11 days of tunnel face excavation, horizontal convergence of the upper step reaches a sharp growth stage, during which the convergence value accounts for 72% of the total. After that, it enters a slow growth stage, lasting about 12 days, while the convergence value accounts for 25% of the total. After 25 days of excavation, the horizontal convergence is stable, and the final convergence is 24.77 mm. (2) During the first 11 days, the horizontal convergence rate changed significantly, and the daily average convergence rate was about 1.80 mm/d and then gradually decreased and tended to zero. While excavating the tunnel, the convergence value of the lower step is smaller than the upper step, and this is due to the initial support immediately after the excavation of the upper-step arch, which has an inhibition effect on the surrounding rock deformation.
The construction time for secondary lining plays a crucial role in ensuring the self-supporting capacity of the surrounding rock and long-term stability. While technical specifications for tunnel engineering in China determine optimal supporting times for the secondary lining, these guidelines primarily apply to general tunnels. However, for shallow soft-rock tunnels, a clear and unified conclusion regarding optimal timing remains elusive. Field monitoring results have been instrumental in determining the effective and critical time for the secondary lining [25]. To address this, the study employs nonlinear fitting analysis using exponential, logarithmic, and hyperbolic functions to assess vault subsidence and horizontal convergence [22] and to determine the optimal time for secondary lining. The fitting results are shown in Figure 7 and Figure 8.
Observations from Figure 7 and Figure 8 reveal that the predicted results from the exponential function closely align with the field-measured results, regardless of whether we consider vault subsidence or horizontal convergence. Specifically, the calculated subsidence and convergence using the exponential function are 53.20 mm and 26.38 mm, respectively. According to the “Technical Specification for Construction of Highway Tunnel” [26], the allowable relative displacement of Grade V rock with a buried depth less than 50 m ranges from 0.20% to 0.80%. Given that the final displacement value for vault subsidence in the monitored section is 51.77 mm, and the tunnel excavation height is approximately 9.62 m, the relative displacement of vault subsidence (0.53%) meets the allowable requirements.
According to the displacement fitting curve, the subsidence rate of vault is as follows:
d u / d t = 7.443 e 0.140 t
From Equation (1), the rate for vault subsidence is 0.198 mm/d, which is less than 0.2 mm/d during the 26th day after tunnel excavation, and the change rate is as follows:
d 2 u / d t 2 | t = 26 = 1.042 e 0.140 t < 0
The current measured value of vault subsidence reaching 97% of the final subsidence indicates that the surrounding rock has essentially stabilized and meets the criteria for secondary lining construction.
In the same way, because the final horizontal convergence displacement of the monitored section is 24.77 mm whereas the tunnel excavation width is about 12.76 m, the relative displacement of horizontal convergence is 0.20%, which meets the requirements of allowable relative displacement. The horizontal convergence rate is as follows:
d u / d t = 2.621 e 0.099 t
Therefore, the obtained rate for horizontal convergence is 0.182 mm/d, which is less than 0.2 mm/d on the 27th day after tunnel excavation, and its change rate is as follows:
d 2 u / d t 2 | t = 27 = 0.260 e 0.099 t < 0
At this time, the measured horizontal convergence value has finally reached 94%, which demonstrates that the surrounding rock of the tunnel has stabilized and met the requirements of secondary lining construction.
To sum up, the optimal time [22] for secondary lining construction of this shallow soft-rock tunnel is 26–27 days after tunnel excavation, and the results are consistent with the on-site construction time.

4. Numerical Simulation Analysis of Tunnel Stability
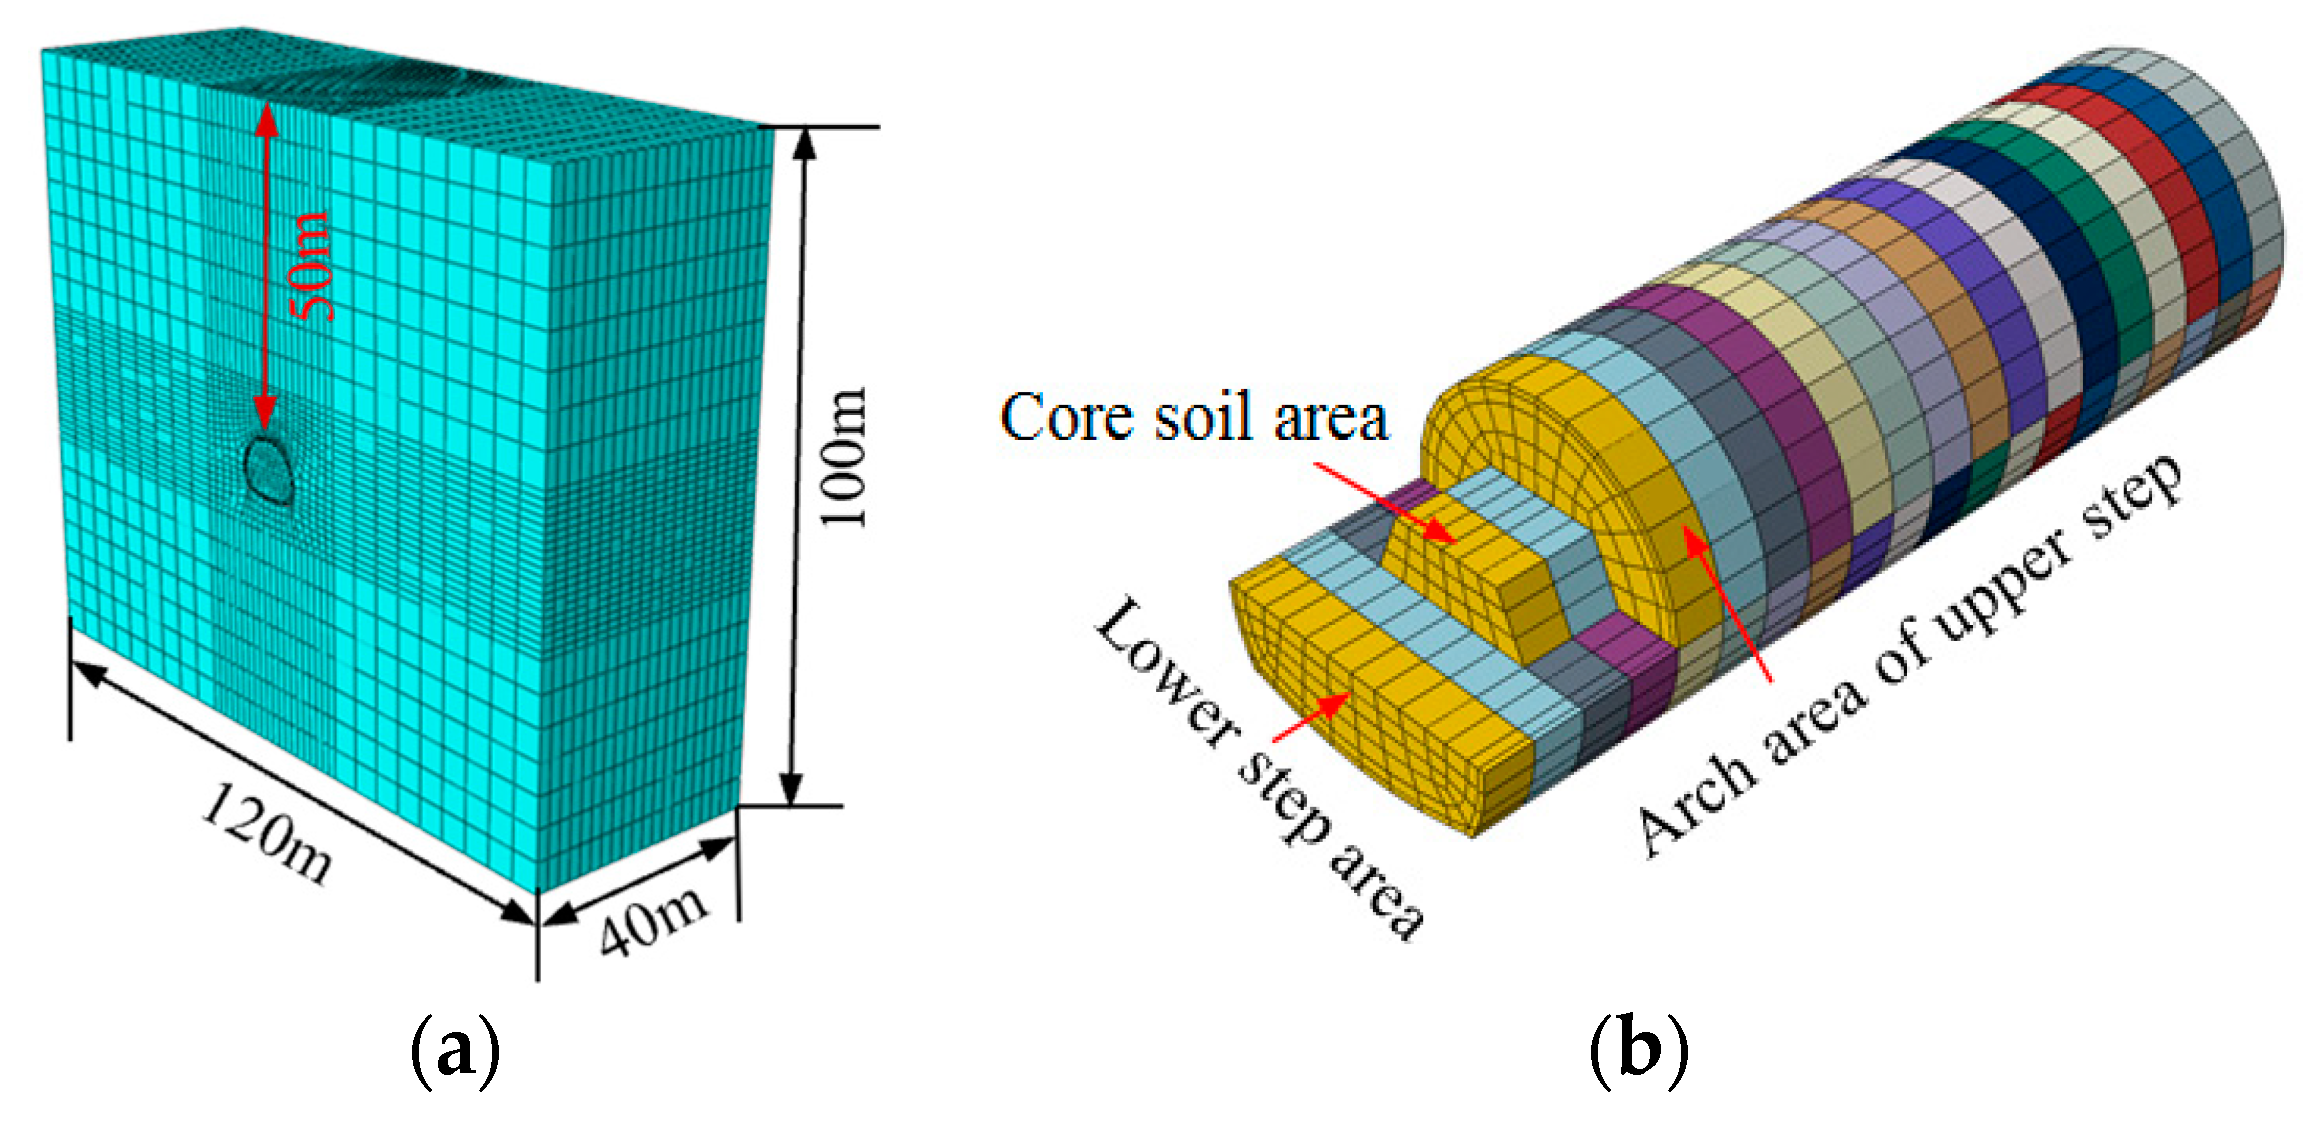
4.1. Modeling

In this paper, the ZK13 + 090 ~ ZK13 + 130 section with Grade V surrounding rock is analyzed, and ABAQUS software (2020) for finite elements is used for simulation analysis. The model is 120 m × 40 m × 100 m (length × width × height), and the tunnel buried depth is 50 m, as in Figure 9a. The model is surrounded by displacement constraints, with a fixed boundary at the bottom and a free boundary at the upper surface [14,15]. The simulation of the surrounding rock and support elements is performed by solid elements, whereas the grid element type is a three-dimensional eight-node hexahedral linear element (C3D8). The anchor is a rod element with a cross-sectional area of 3.8 × 10⁻⁴ m2, and the grid element type is a three-dimensional two-node linear element (T3D2) [27,28,29]. The surrounding rock of the tunnel is a Mohr–Coulomb plastic model, and the support is a linear elastic model [30]. The physical and the mechanical parameters for the surrounding rock and the support types are presented in Table 2.
Because the tunnel is surrounded by Grade V, the method of reserving core soil with upper and lower steps (as shown in Figure 9b) is utilized for construction, being divided into 20 sections along the longitudinal direction during numerical simulation, with an excavation footage of 2 m. The arch of the upper step is 4 m ahead of the core soil, and the core soil is 4 m ahead of the lower step. The tunnel excavation steps are as follows: the first and second excavation steps for arch excavation of the upper step, the third and fourth excavation steps for core soil excavation, and the fifth excavation step for lower step excavation, which circulate in turn. There are 24 excavation steps in the construction of the tunnel. The primary supports need to be performed in time after each excavation, and the secondary lining shall be completed in the 9th, 14th, 19th, and 24th excavation steps.

4.2. Results of Simulation and Analysis

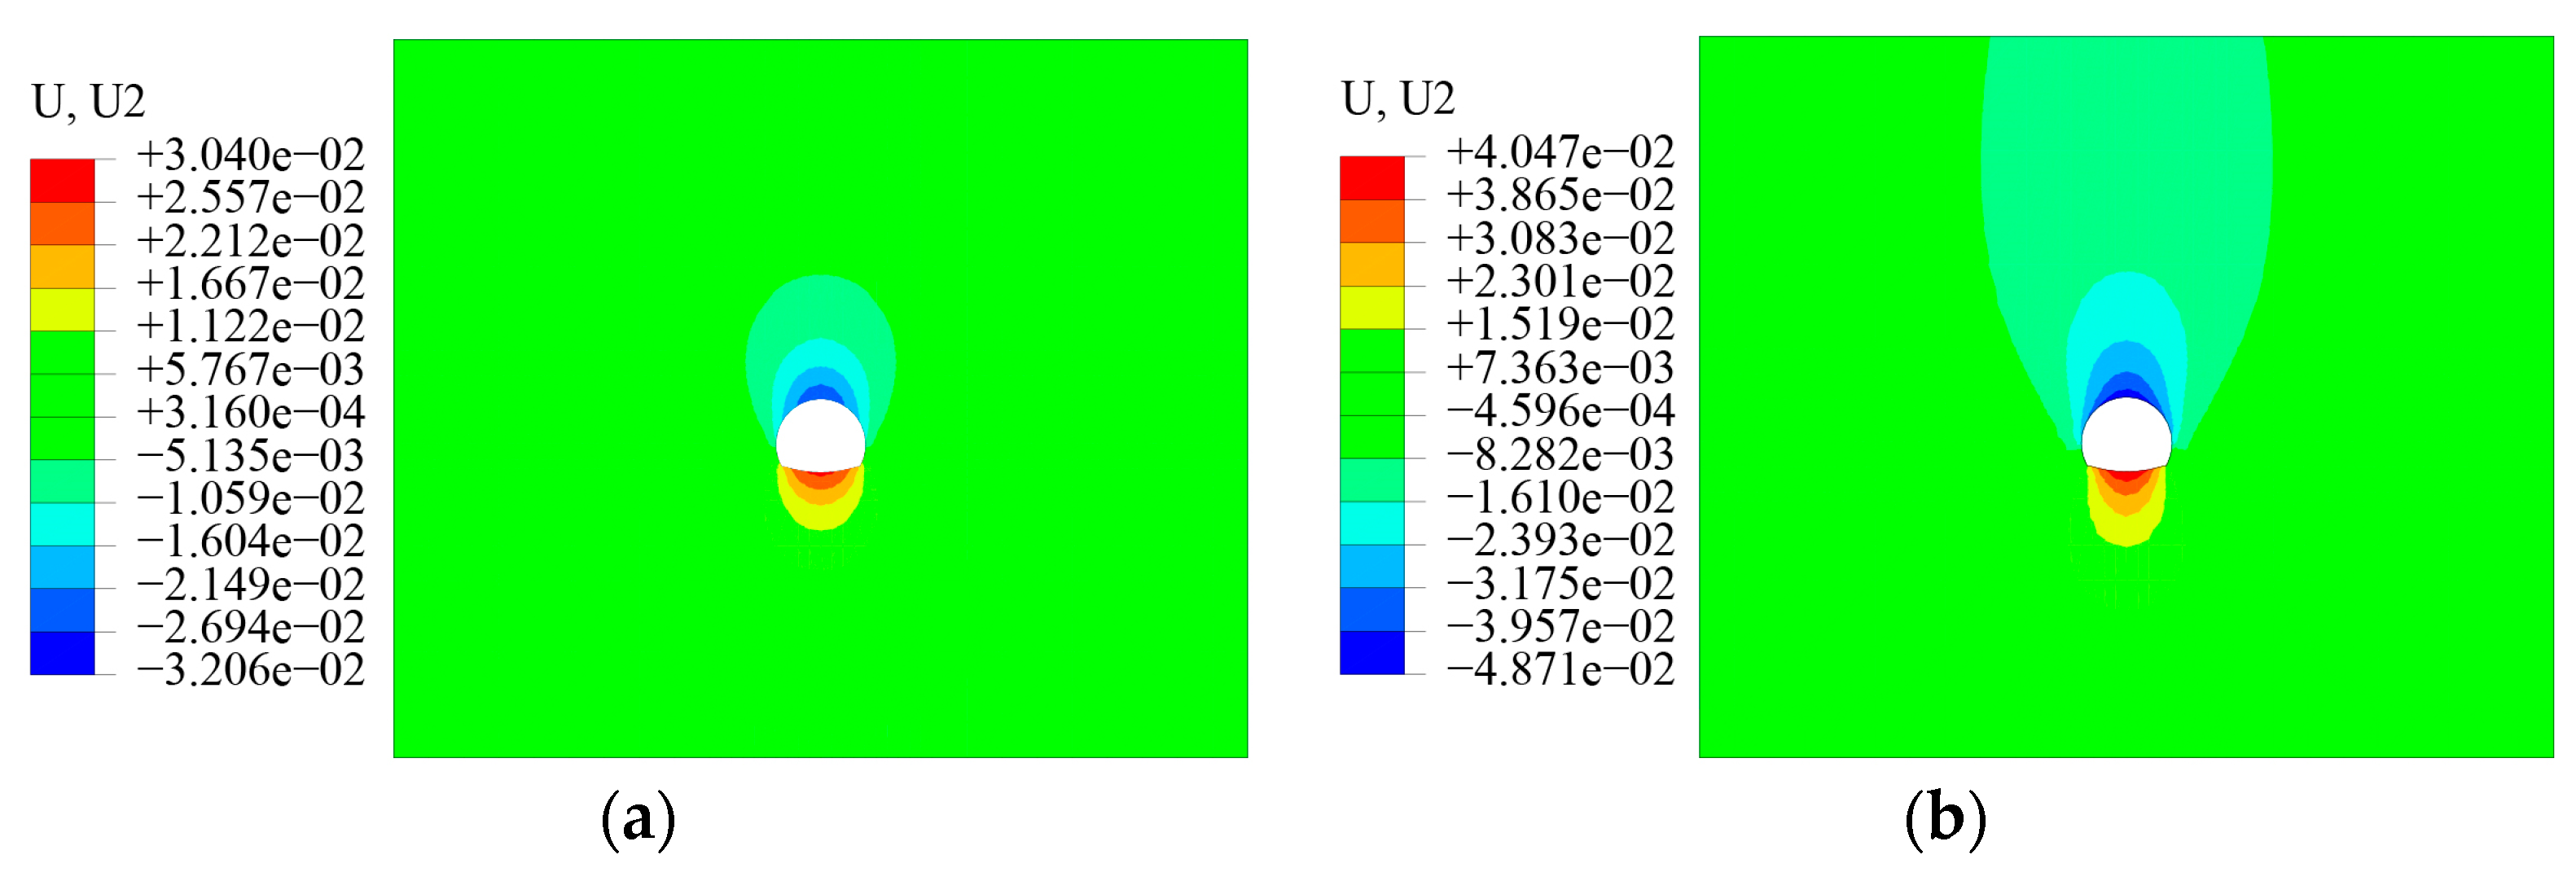
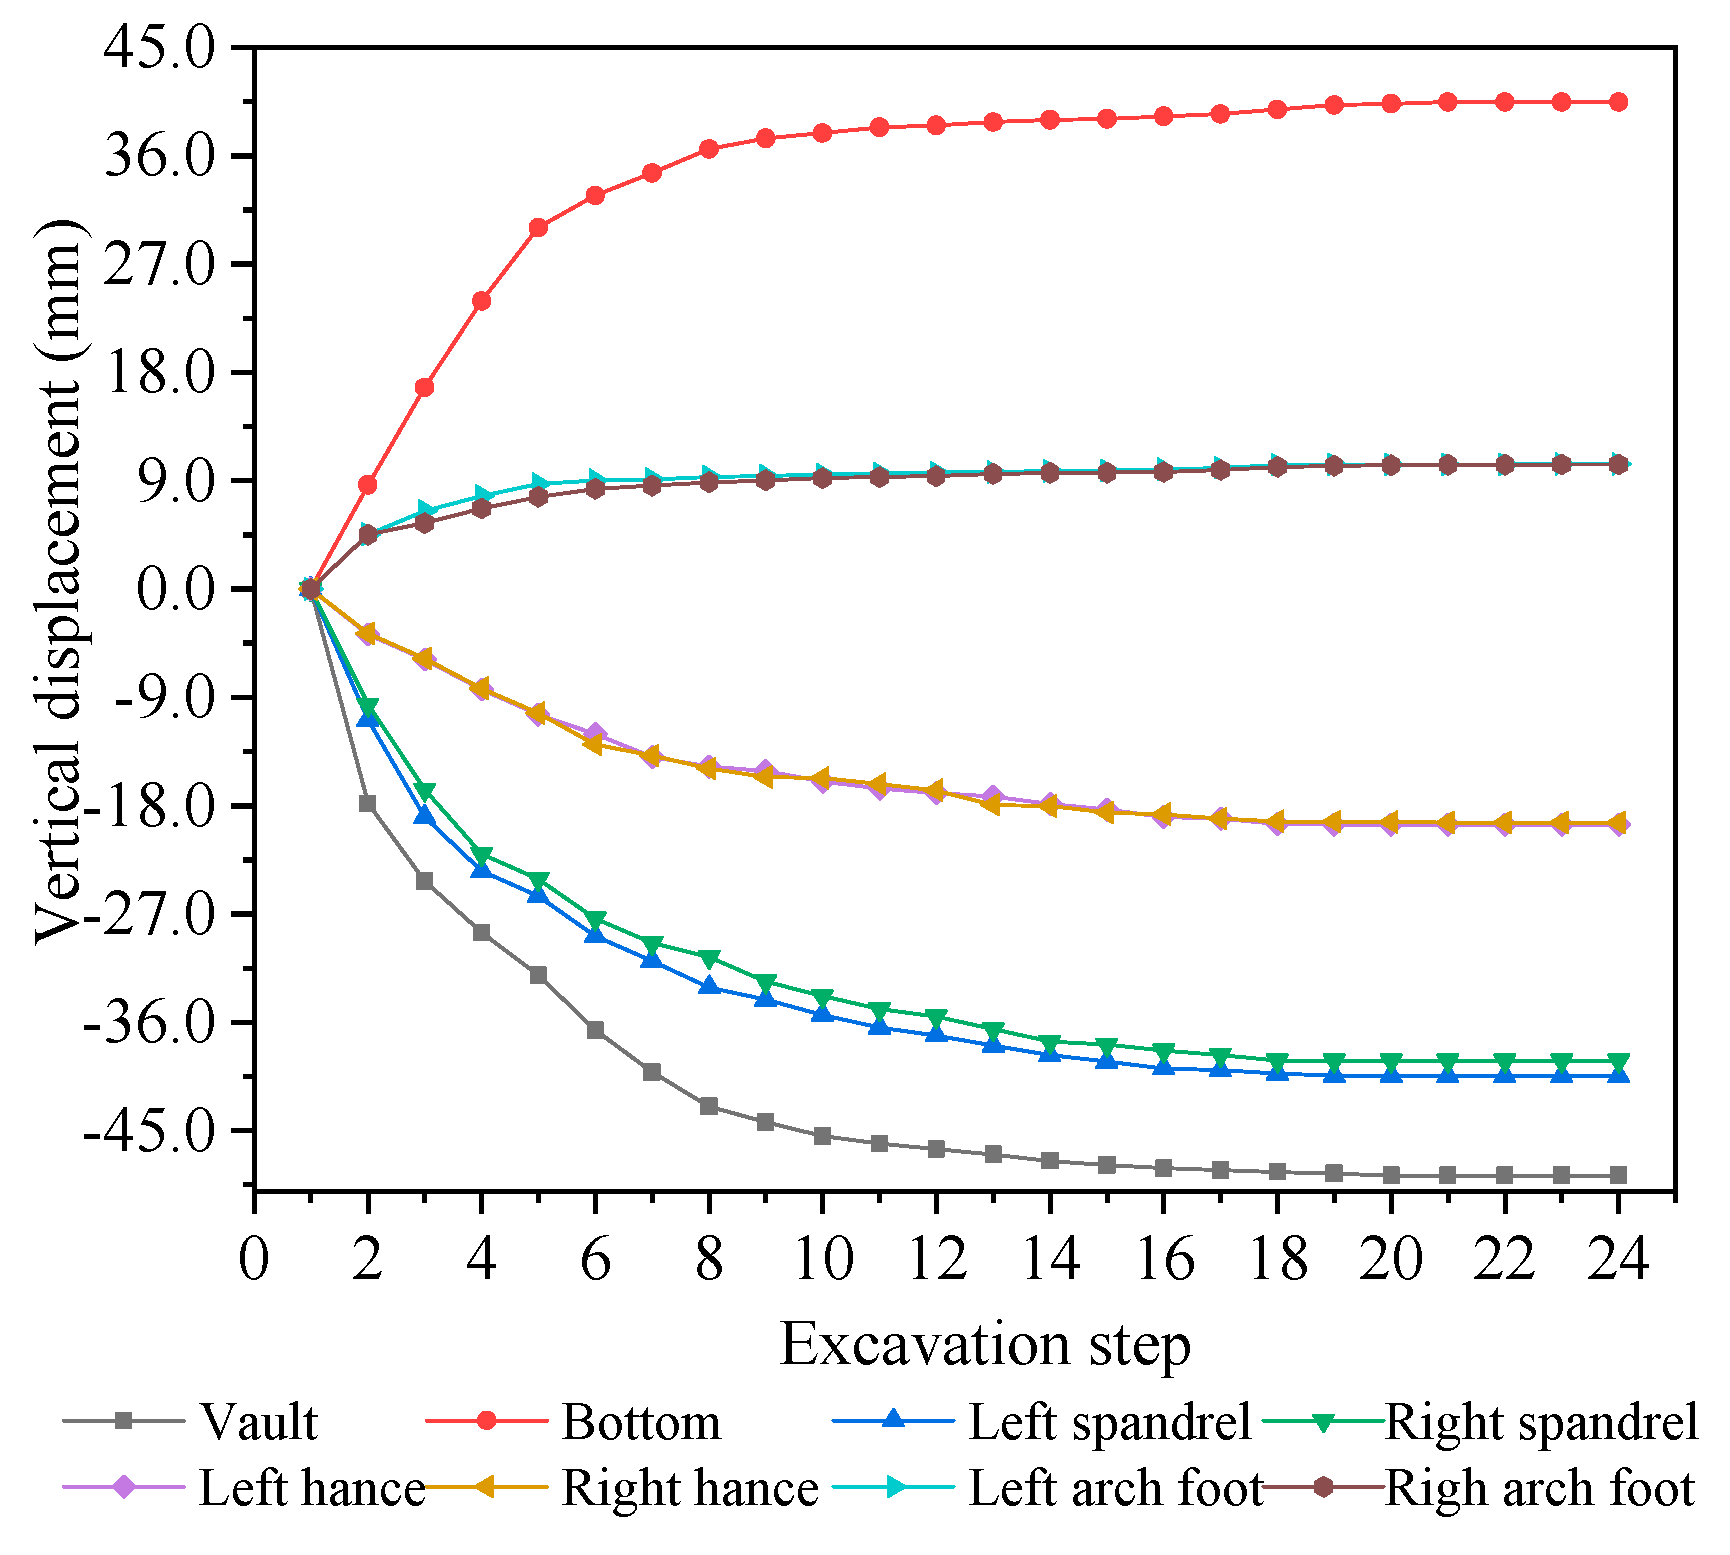
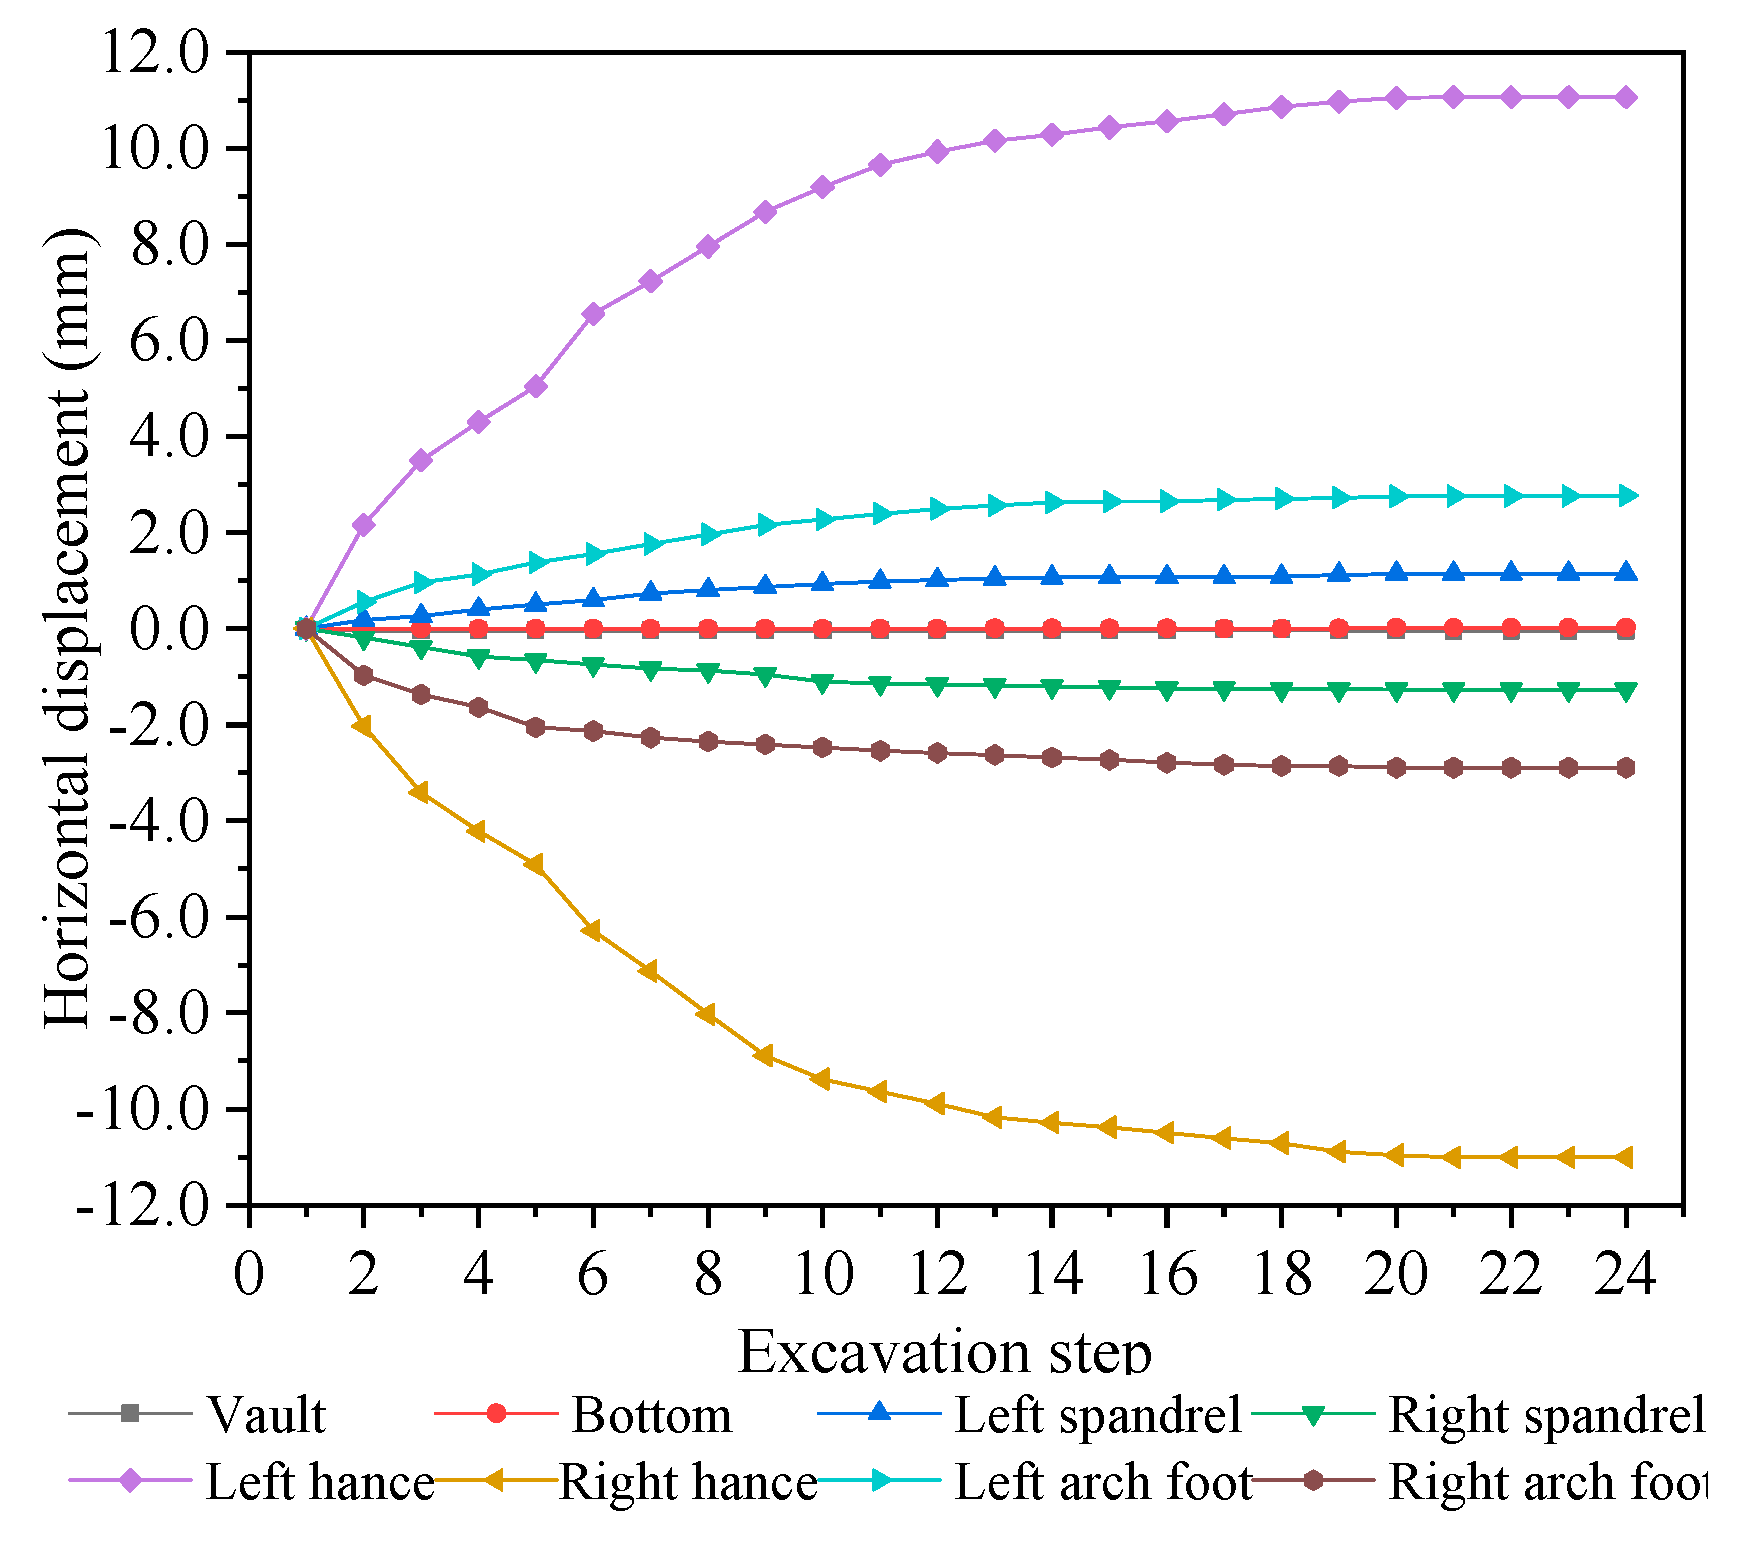
4.2.1. Displacement of Surrounding Rock

(1) Vertical displacement. The nephogram for surrounding rock and the curve for vertical displacement of each key point are shown in Figure 10 and Figure 11.
From Figure 10, it can be found that with the advancement of each excavation step, the vertical displacement of rock gradually increases and finally tends to be stable, whereas the maximum value of vertical displacement occurs at the vault and bottom, showing that the vault subsides and the bottom rises. After the fifth excavation step, the subsidence value for the vault is 32.06 mm, while the uplift value of the bottom reaches 30.40 mm, accounting for 65.8% and 74.2% of final deformation, respectively. As it can be found in Figure 11, the vertical displacement of each key point changes greatly before the seventh excavation step, and the displacement growth rate is obvious, which indicates that the working face excavation proves to be of significant influence on the stability of soft-rock tunnels. From the eighth excavation step, the vertical displacement of each point increases slowly, and after the nineteenth excavation step, the displacement of each point tends to stabilize. Vertical displacement convergence values of the vault, spandrel, and hance are 48.71 mm, 39.83 mm, and 19.49 mm, respectively. At the bottom and arch foot, they are 40.47 mm and 10.37 mm, respectively, and floor heave appears.
(2) Horizontal displacement. The nephogram of surrounding rock and the curve for each key point are presented in Figure 12 and Figure 13.
As can be seen from Figure 12 and Figure 13, the horizontal displacements at the leftmost and rightmost spandrels, hances, and arch feet are symmetrically distributed with the tunnel centerline, whereas the horizontal displacements at the leftmost and rightmost hances are the largest. With continuous increase in excavation steps, the horizontal displacement of surrounding rock increases gradually, and tends to be stable at the end. Before the ninth excavation step, the horizontal displacement of each key point changes greatly, and the displacement increases obviously, which is caused by the close distance from the working face to the monitoring section and the great rock disturbance during excavation. In the fifth excavation step, horizontal displacements of the leftmost and rightmost hances are 5.04 mm and 4.91 mm, respectively, accounting for 45.08% of the convergence value. After the 10th excavation step, the horizontal displacements at each point increased slowly, and once reaching the 20th step, the horizontal displacements at each point tend to stabilize. The convergence values of the horizontal displacements at the hance, arch foot, and spandrel are 22.07 mm, 5.66 mm, and 2.41 mm, respectively.

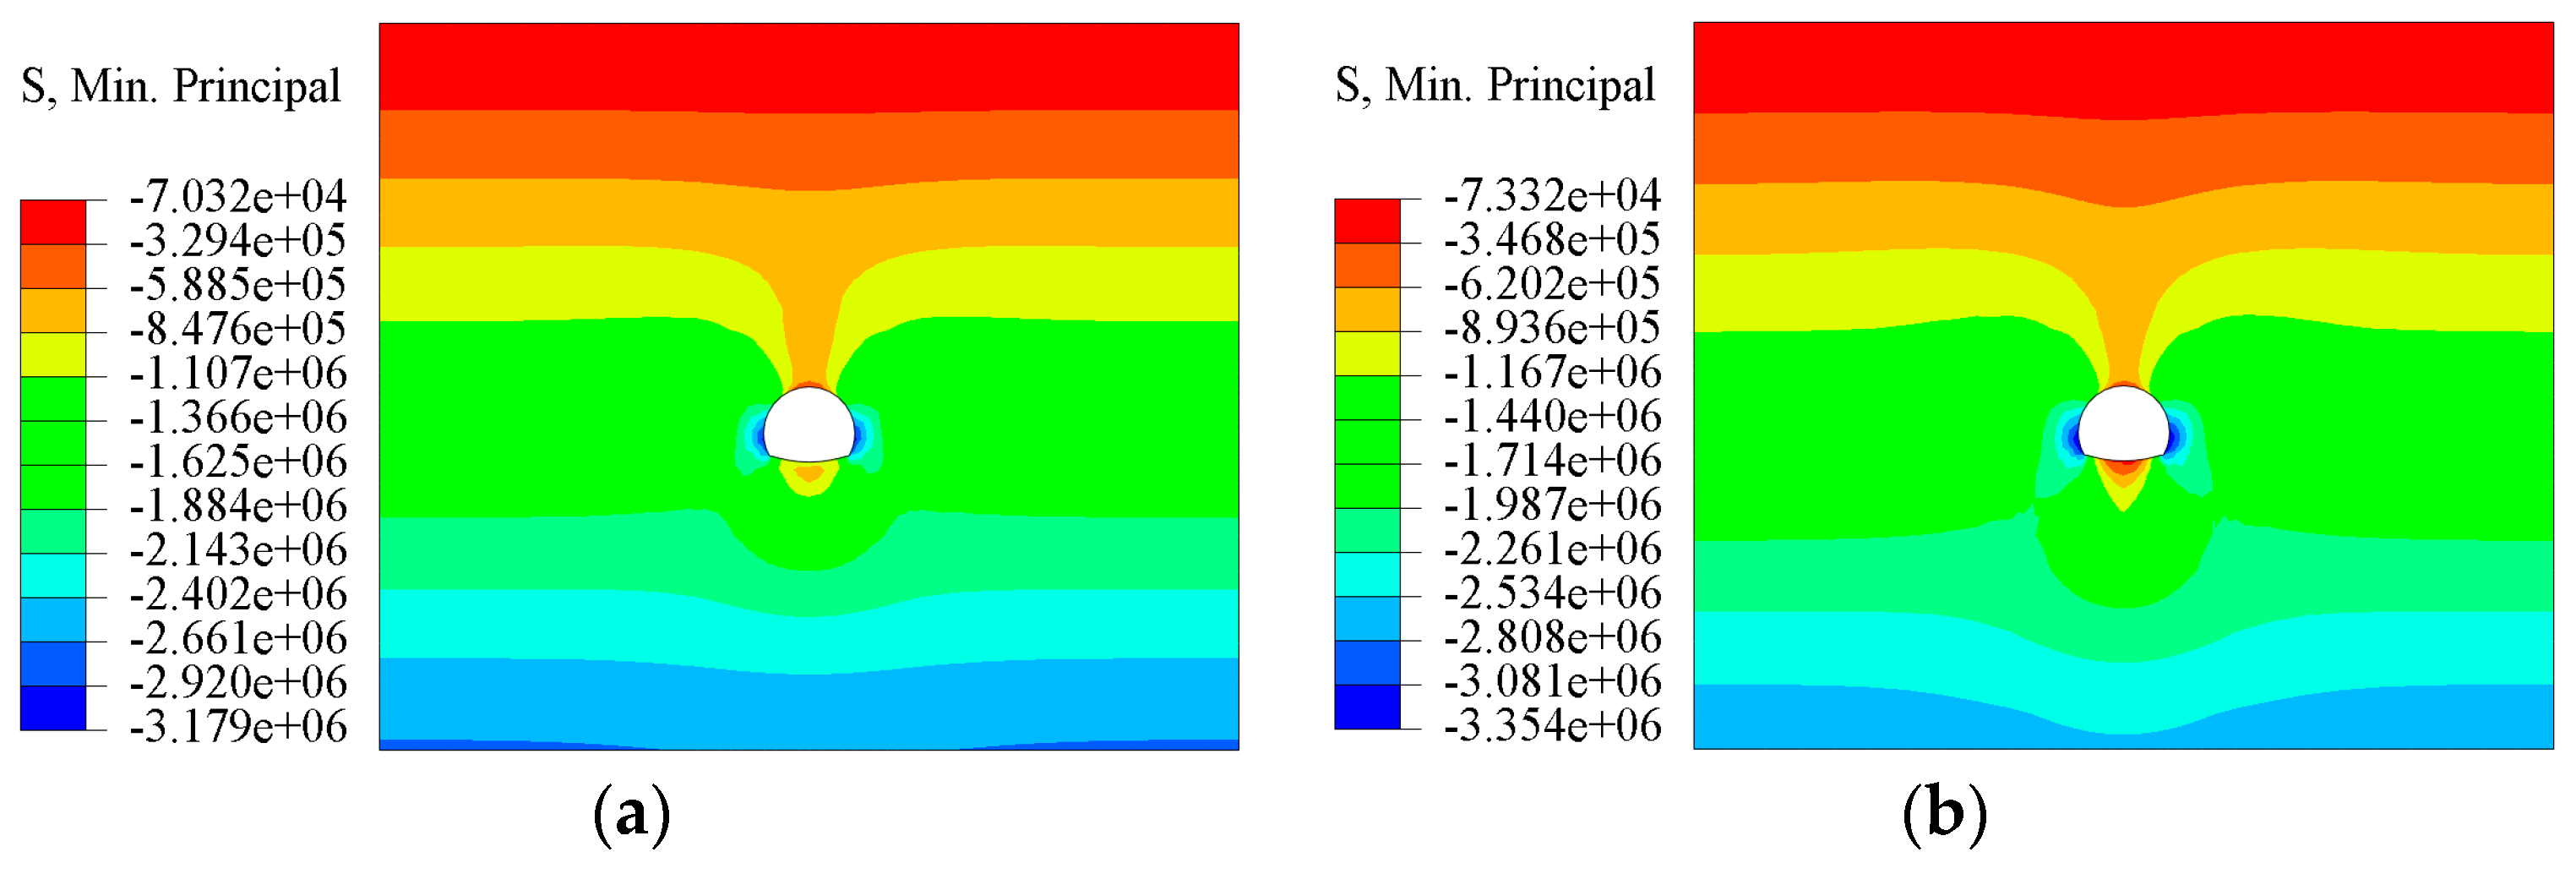
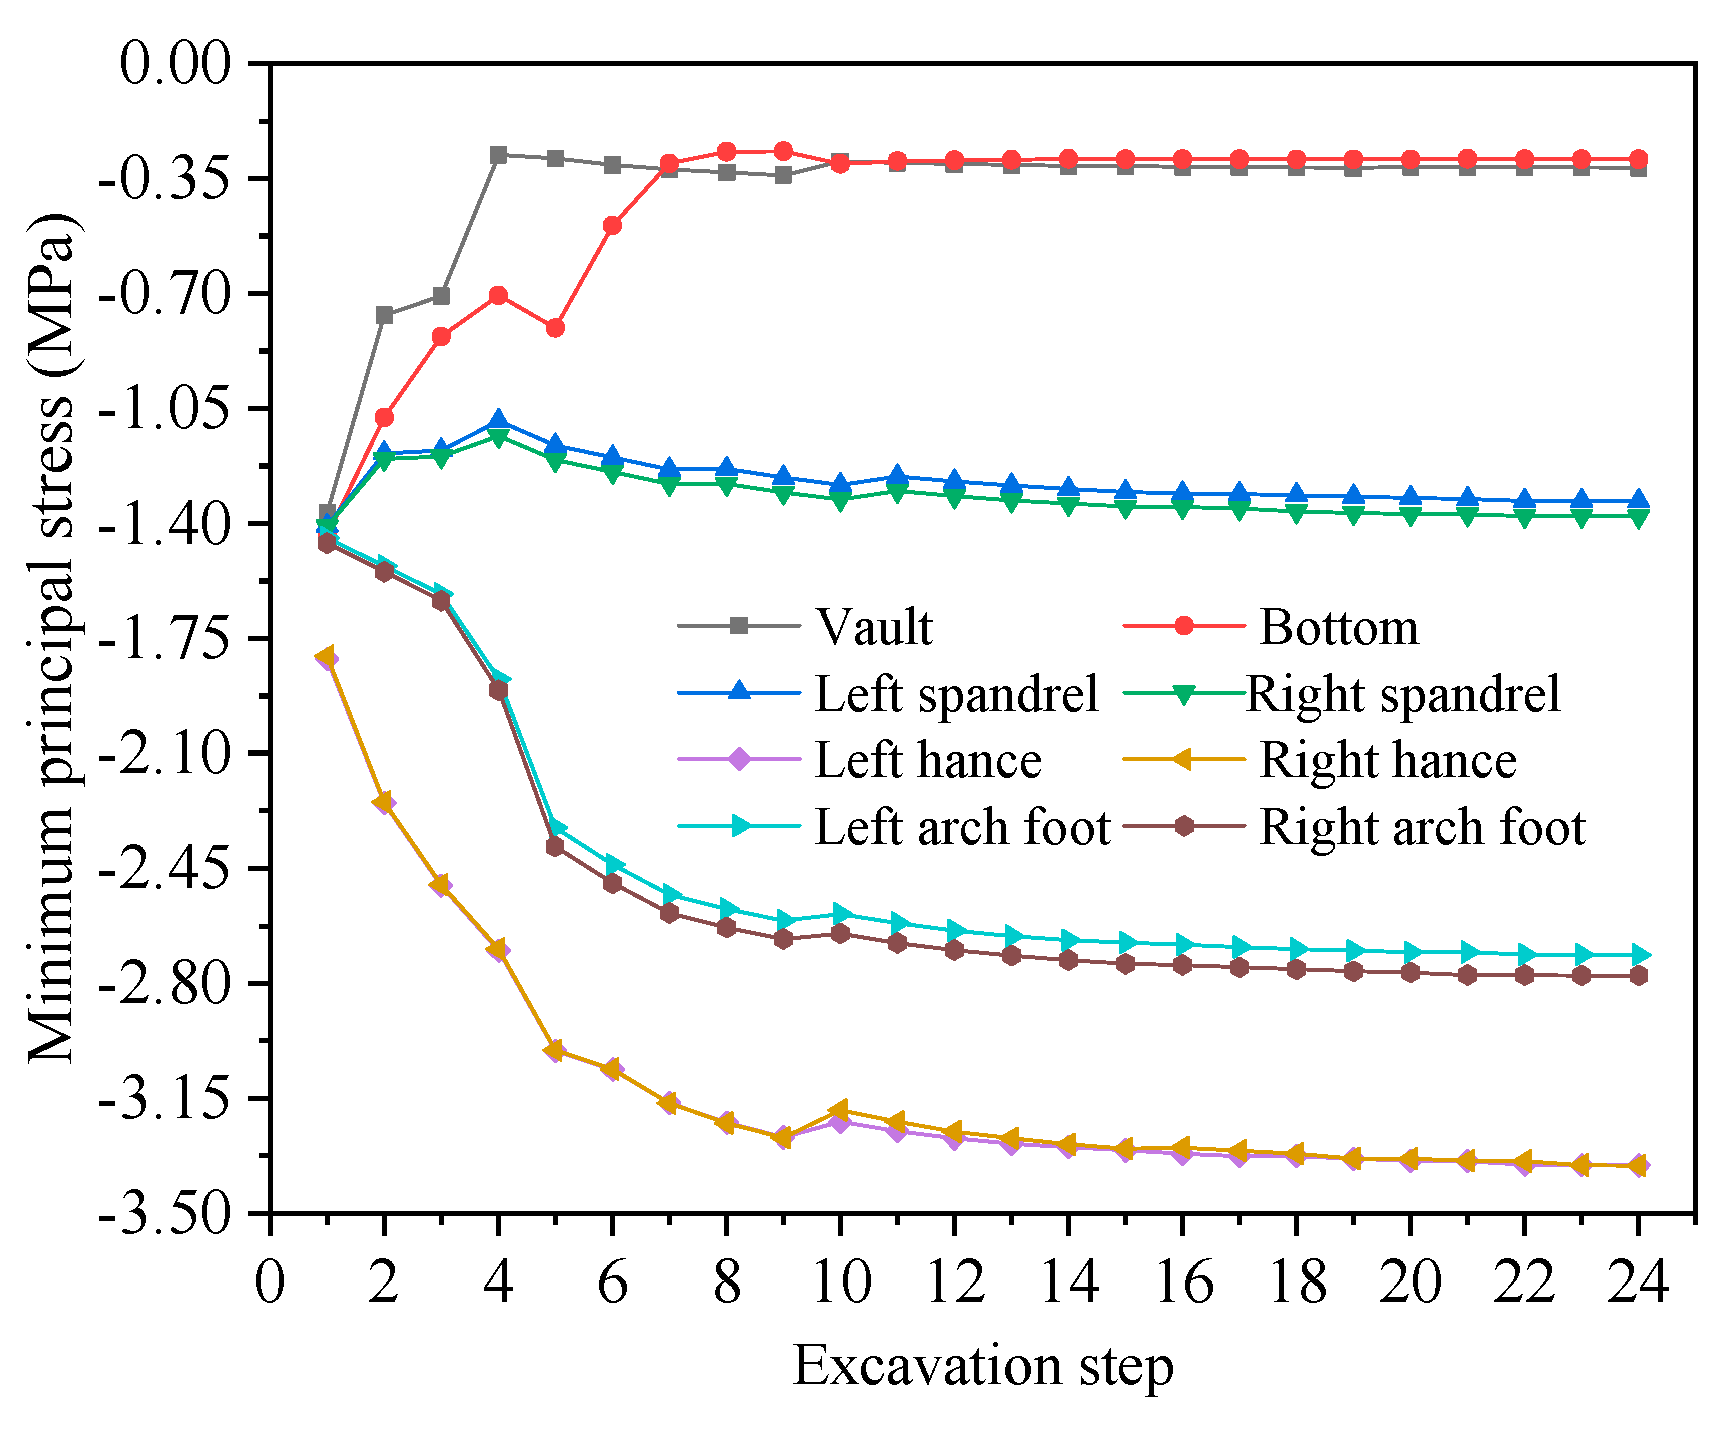
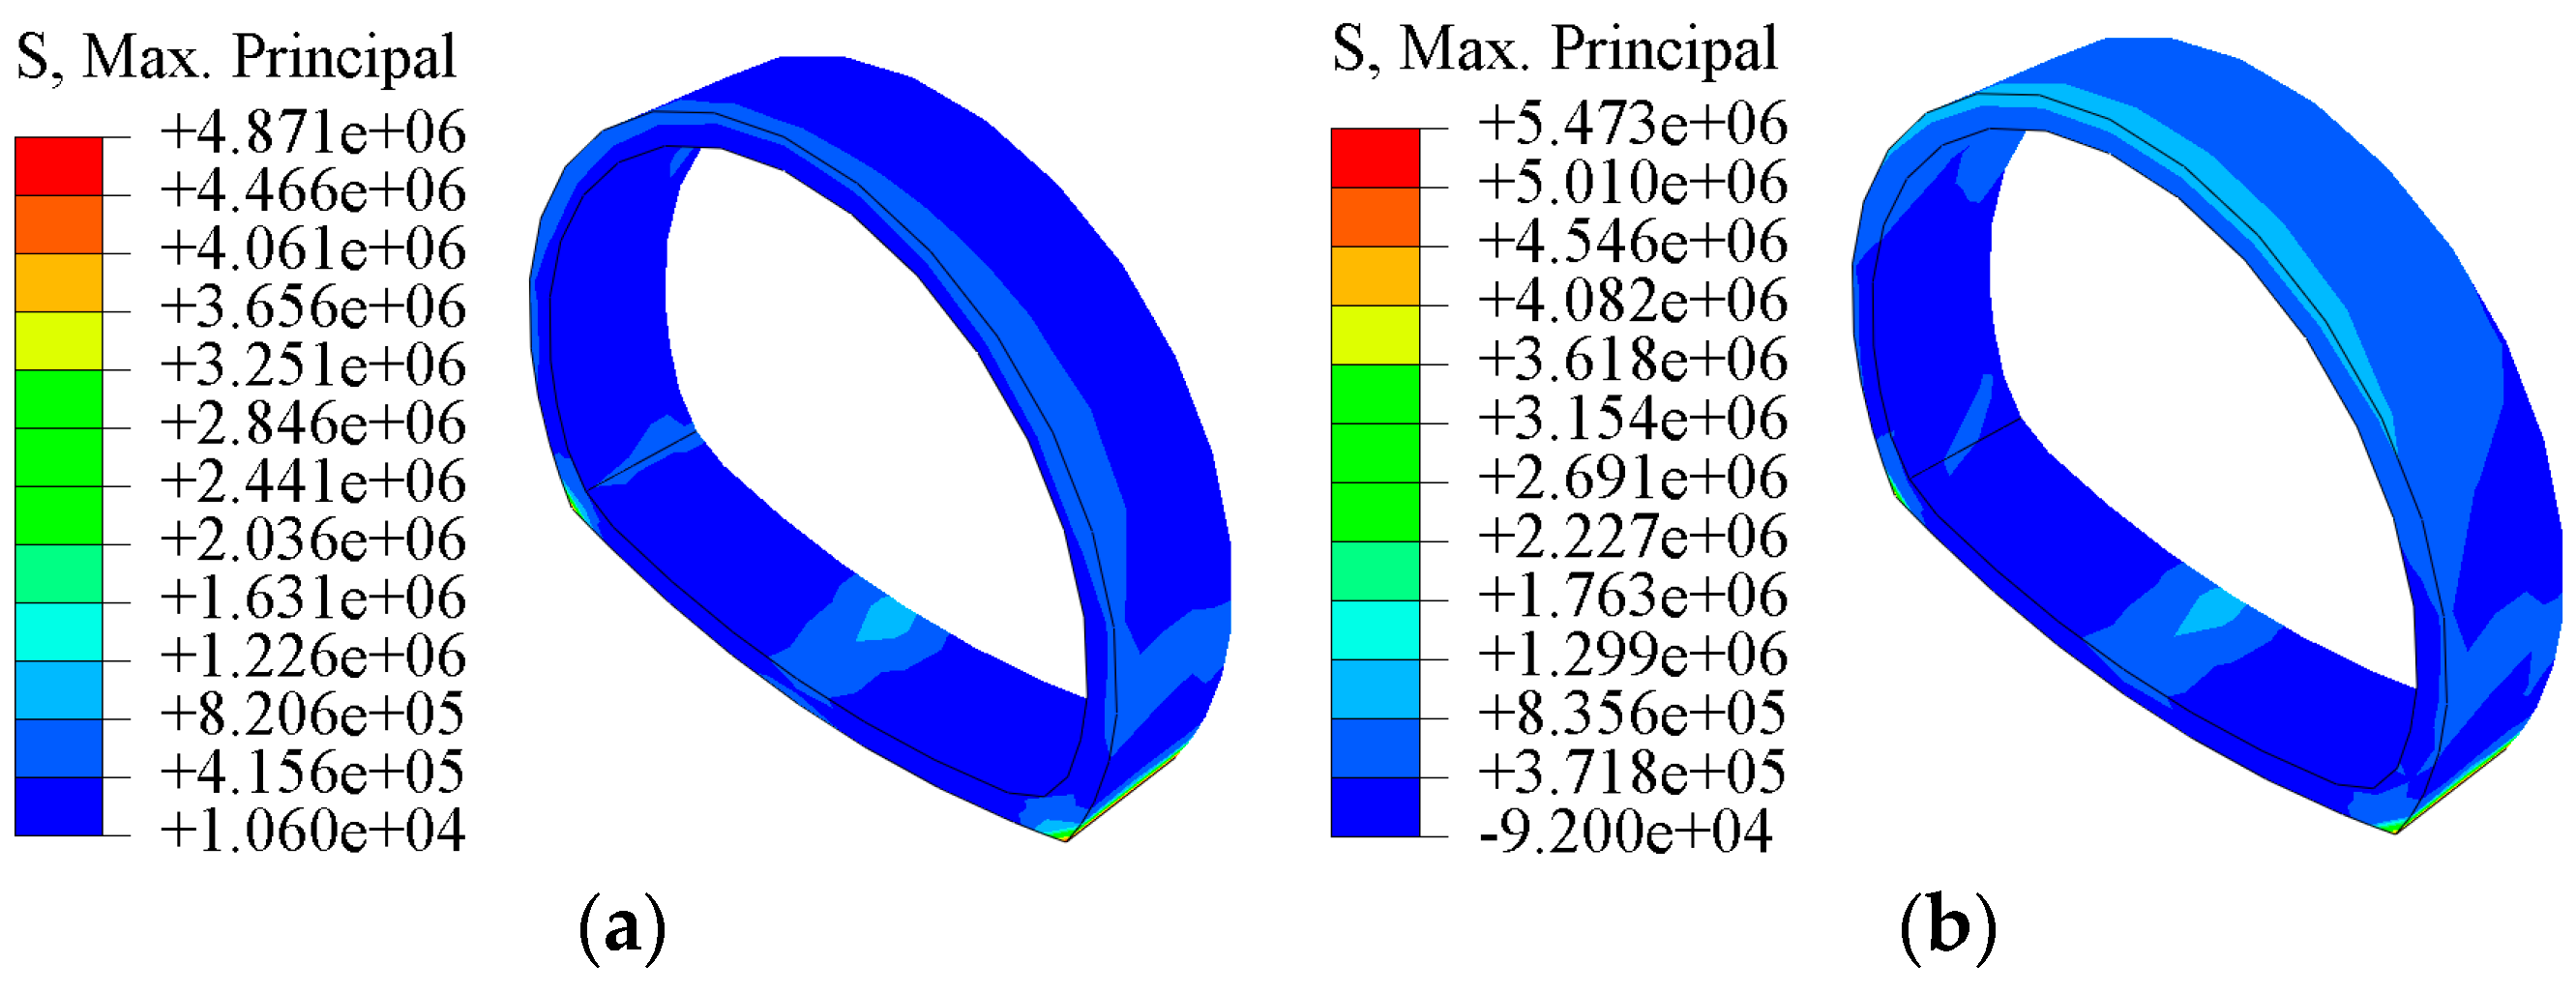
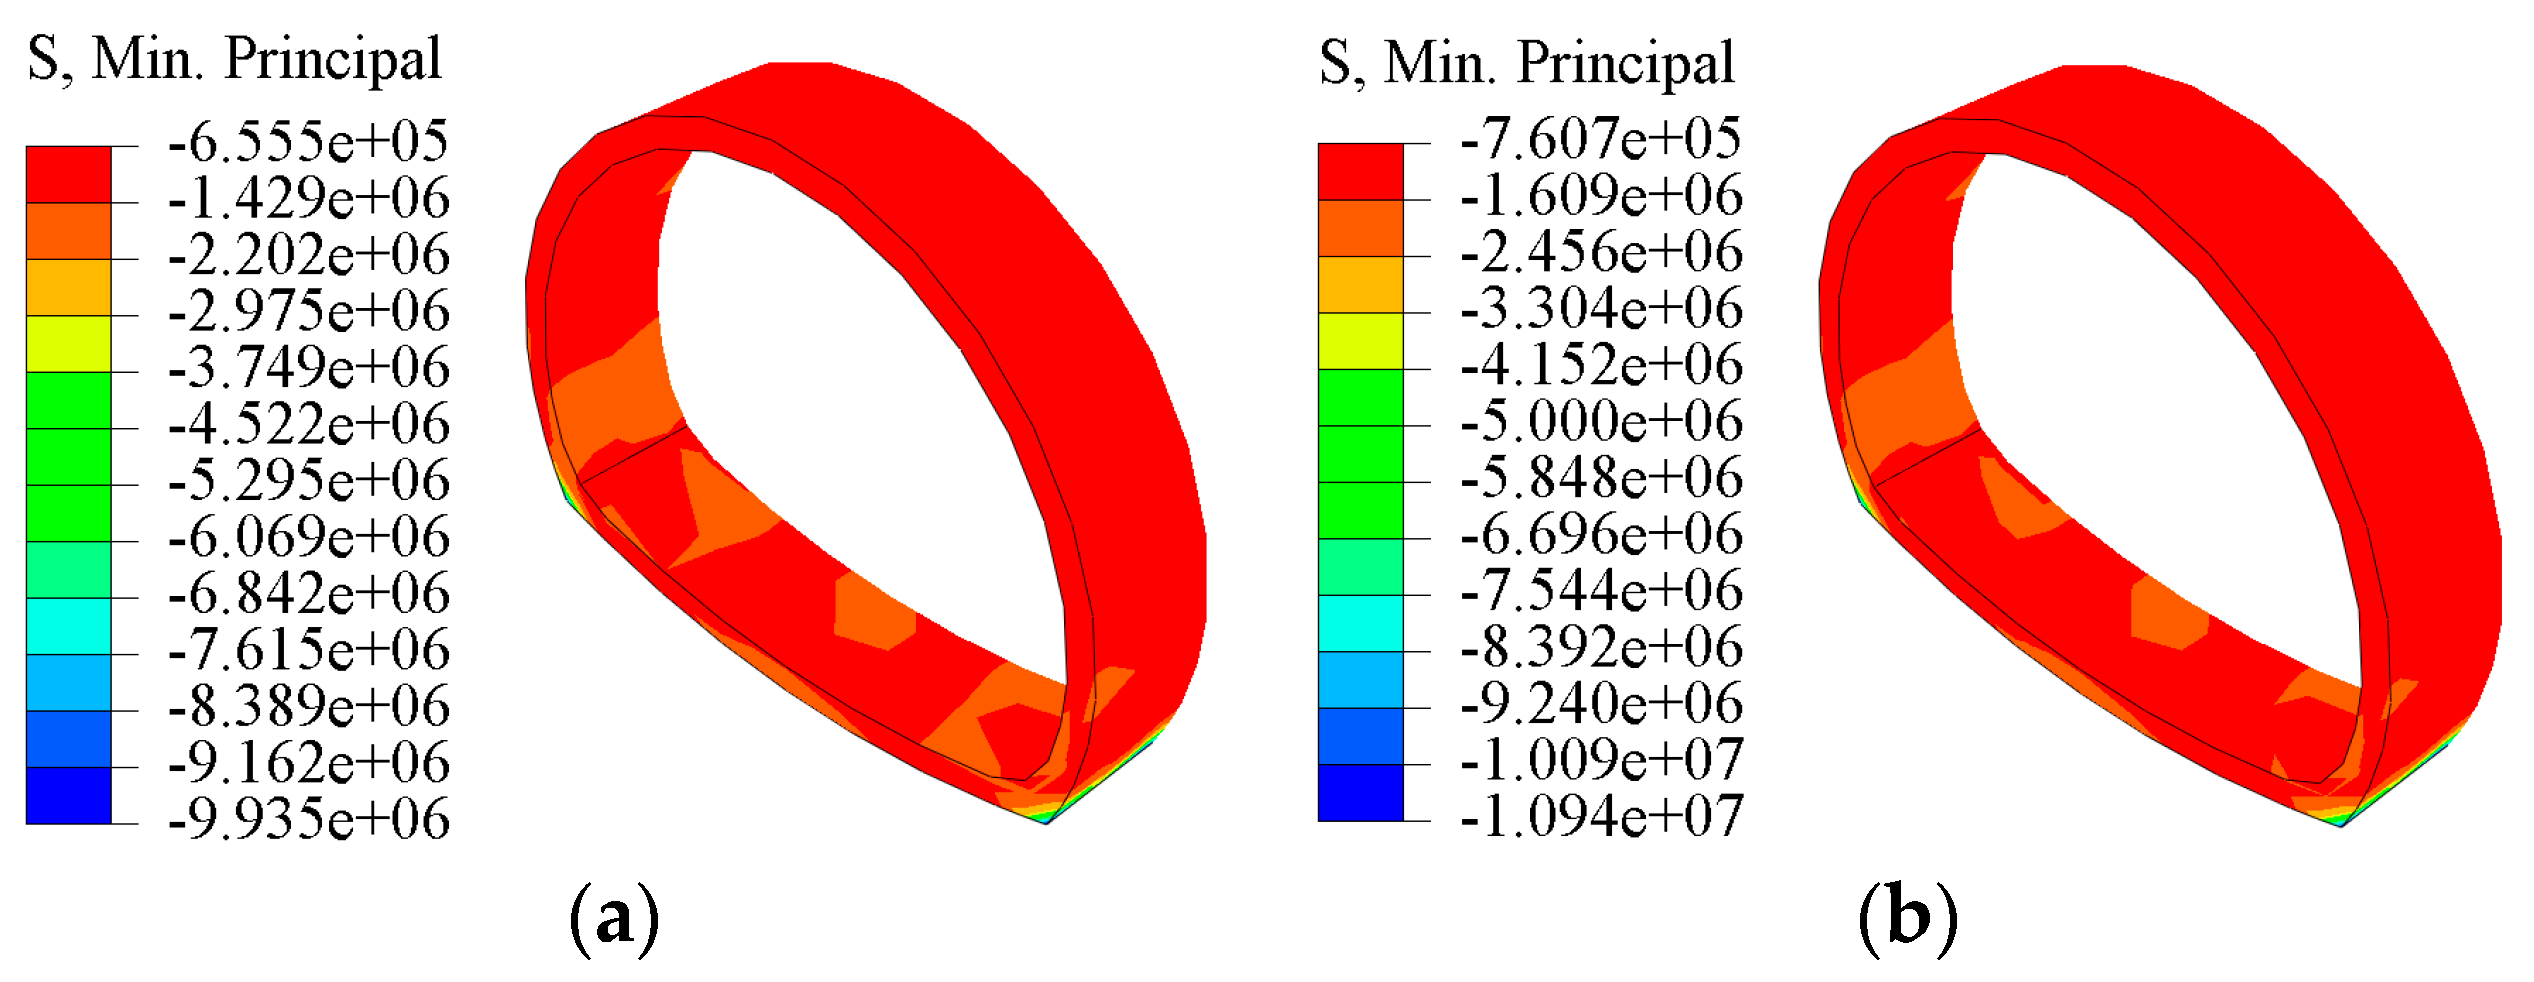
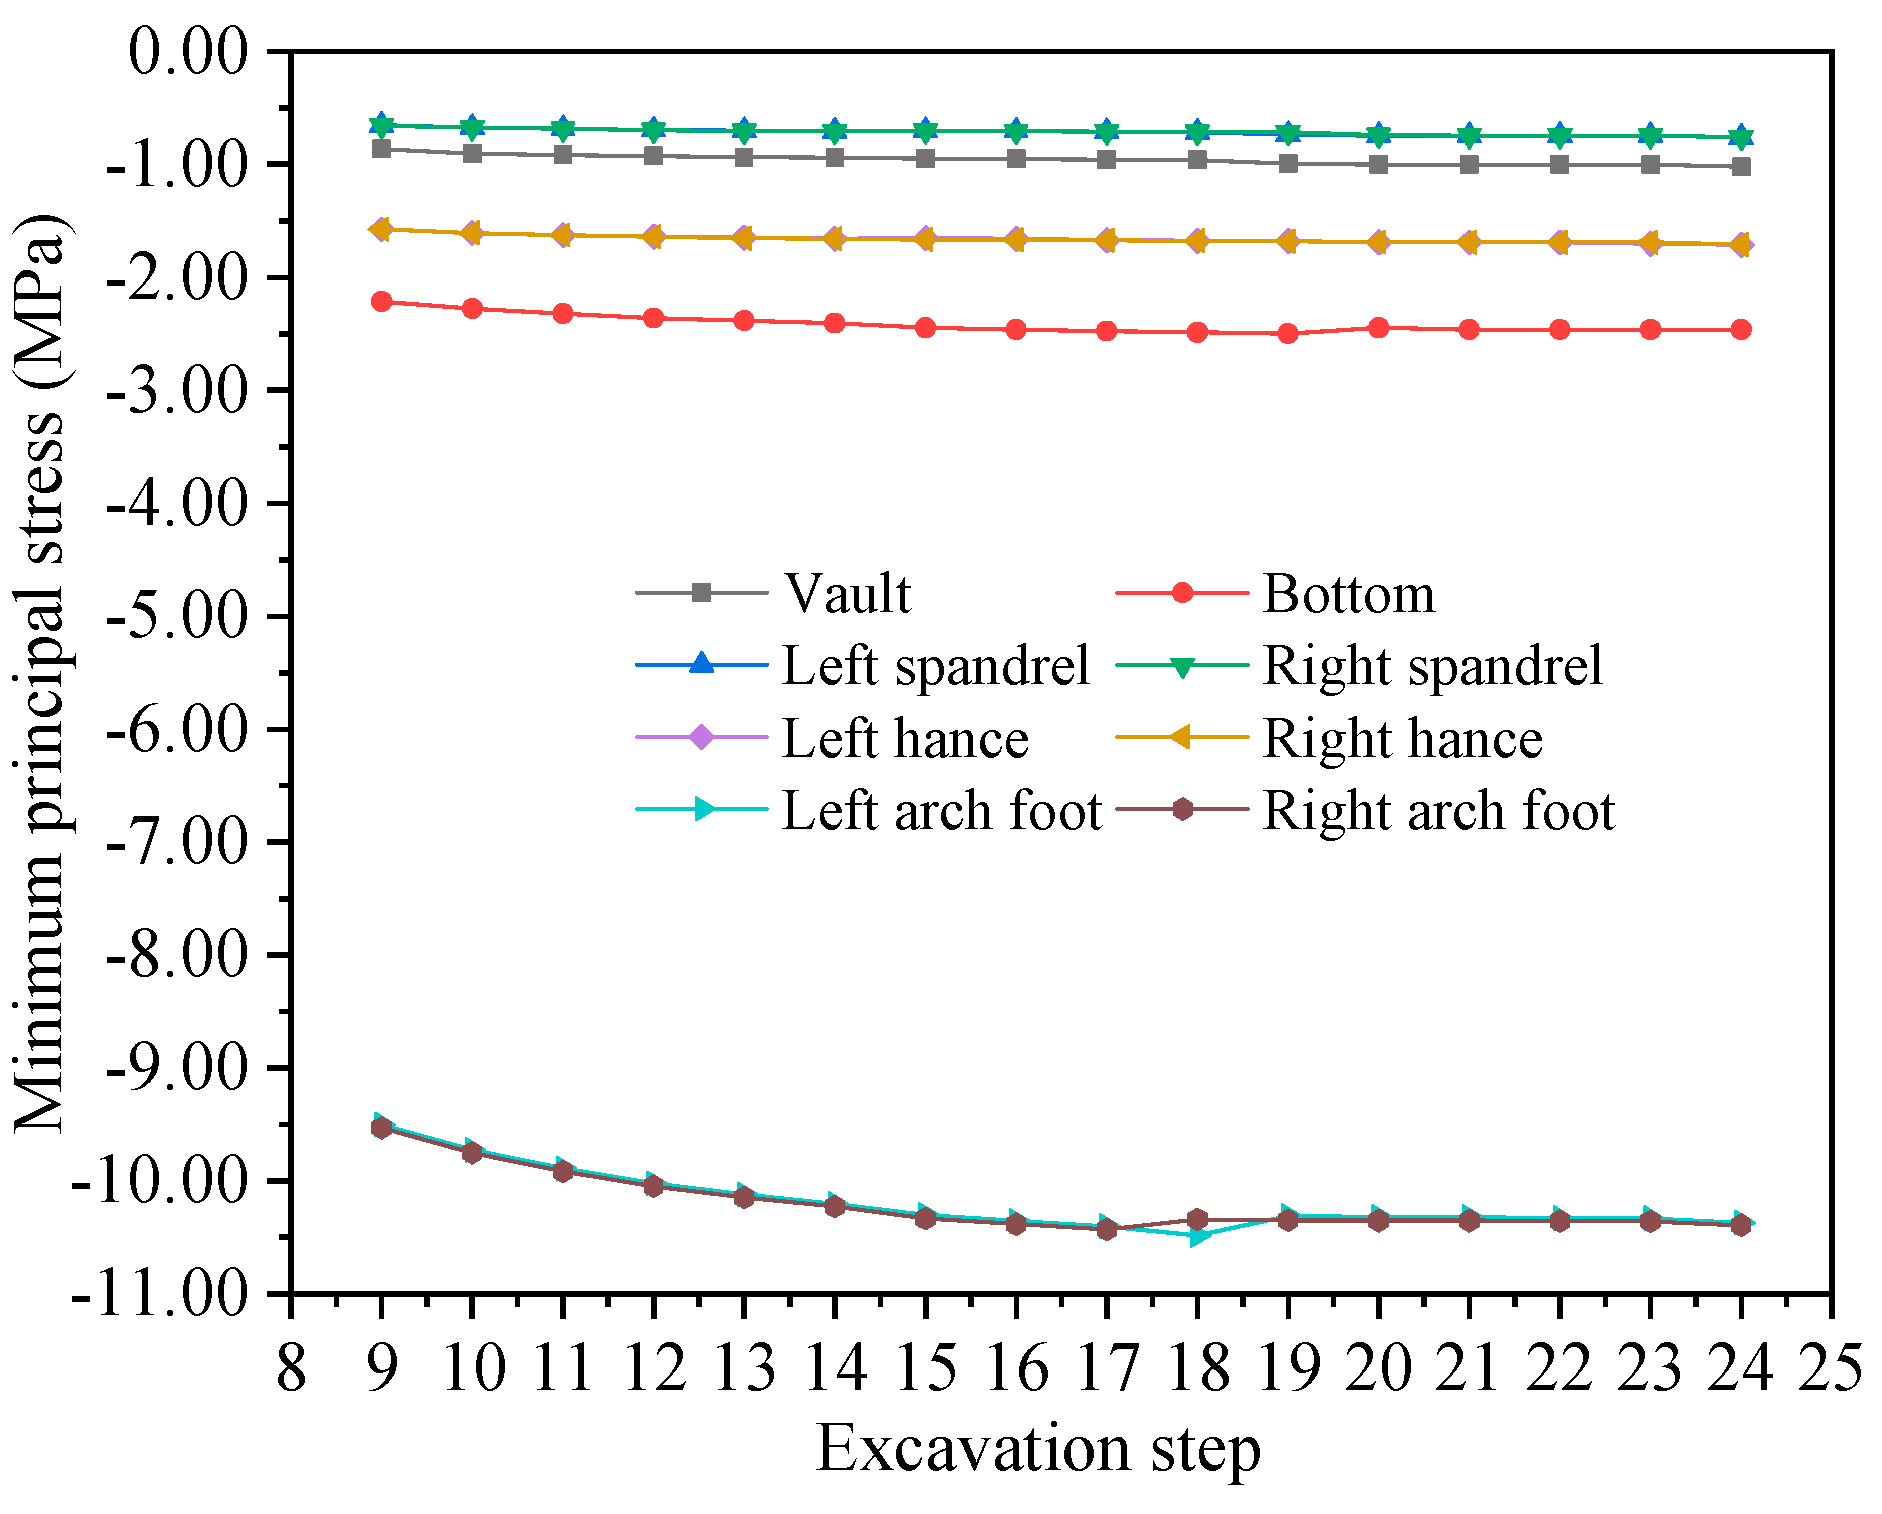
4.2.2. Stress Analysis of Surrounding Rock of the Tunnel

(1) Maximum principal stress of surrounding rock. The corresponding nephogram and its variation curve are shown in Figure 14 and Figure 15, respectively.
As from the figures analyzed, the maximum principal stress of the surrounding rock of the tunnel at the vault, spandrel, and bottom is the tensile stress, and it is the largest at the vault, followed by the spandrel, and it is the smallest at the bottom. The maximum principal stress at the hance and arch foot is compressive stress. With excavation step increase, the maximum principal stress of the surrounding rock increases gradually and tends to be stable after the 10th excavation. In the 5th excavation step, the tensile stress of the vault, spandrel, and bottom is 0.413 MPa, 0.124 MPa, and 0.002 MPa, respectively. The compressive stress at the hance and arch foot is 0.350 MPa and 0.331 MPa, respectively. The convergence values of tensile stress at the vault, spandrel, and bottom are 0.310 MPa, 0.028 MPa, and 0.015 MPa, respectively, whereas the convergence values of compressive stress at the hance and arch foot are 0.557 MPa and 0.586 MPa, respectively.
(2) Minimum principal stress of the surrounding rock of the tunnel. The corresponding nephogram and its variation curve are shown in Figure 16 and Figure 17.
As it is shown in the figures, the minimum principal stress of the surrounding rock of the tunnel is compressive stress, and stress concentration occurs at the hance. The minimum stress of the hance is greater than that of the arch foot, which is greater than that of the spandrel, and it is the smallest at the bottom. With the increase in the excavation step, the minimum principal stress of the surrounding rock of the tunnel increases gradually and tends to be stable after the 10th excavation step. The convergence values of minimum principal stress at the hance, arch foot, spandrel, vault, and bottom are 3.355 MPa, 2.745 MPa, 1.356 MPa, 0.317 MPa, and 0.291 MPa, respectively.

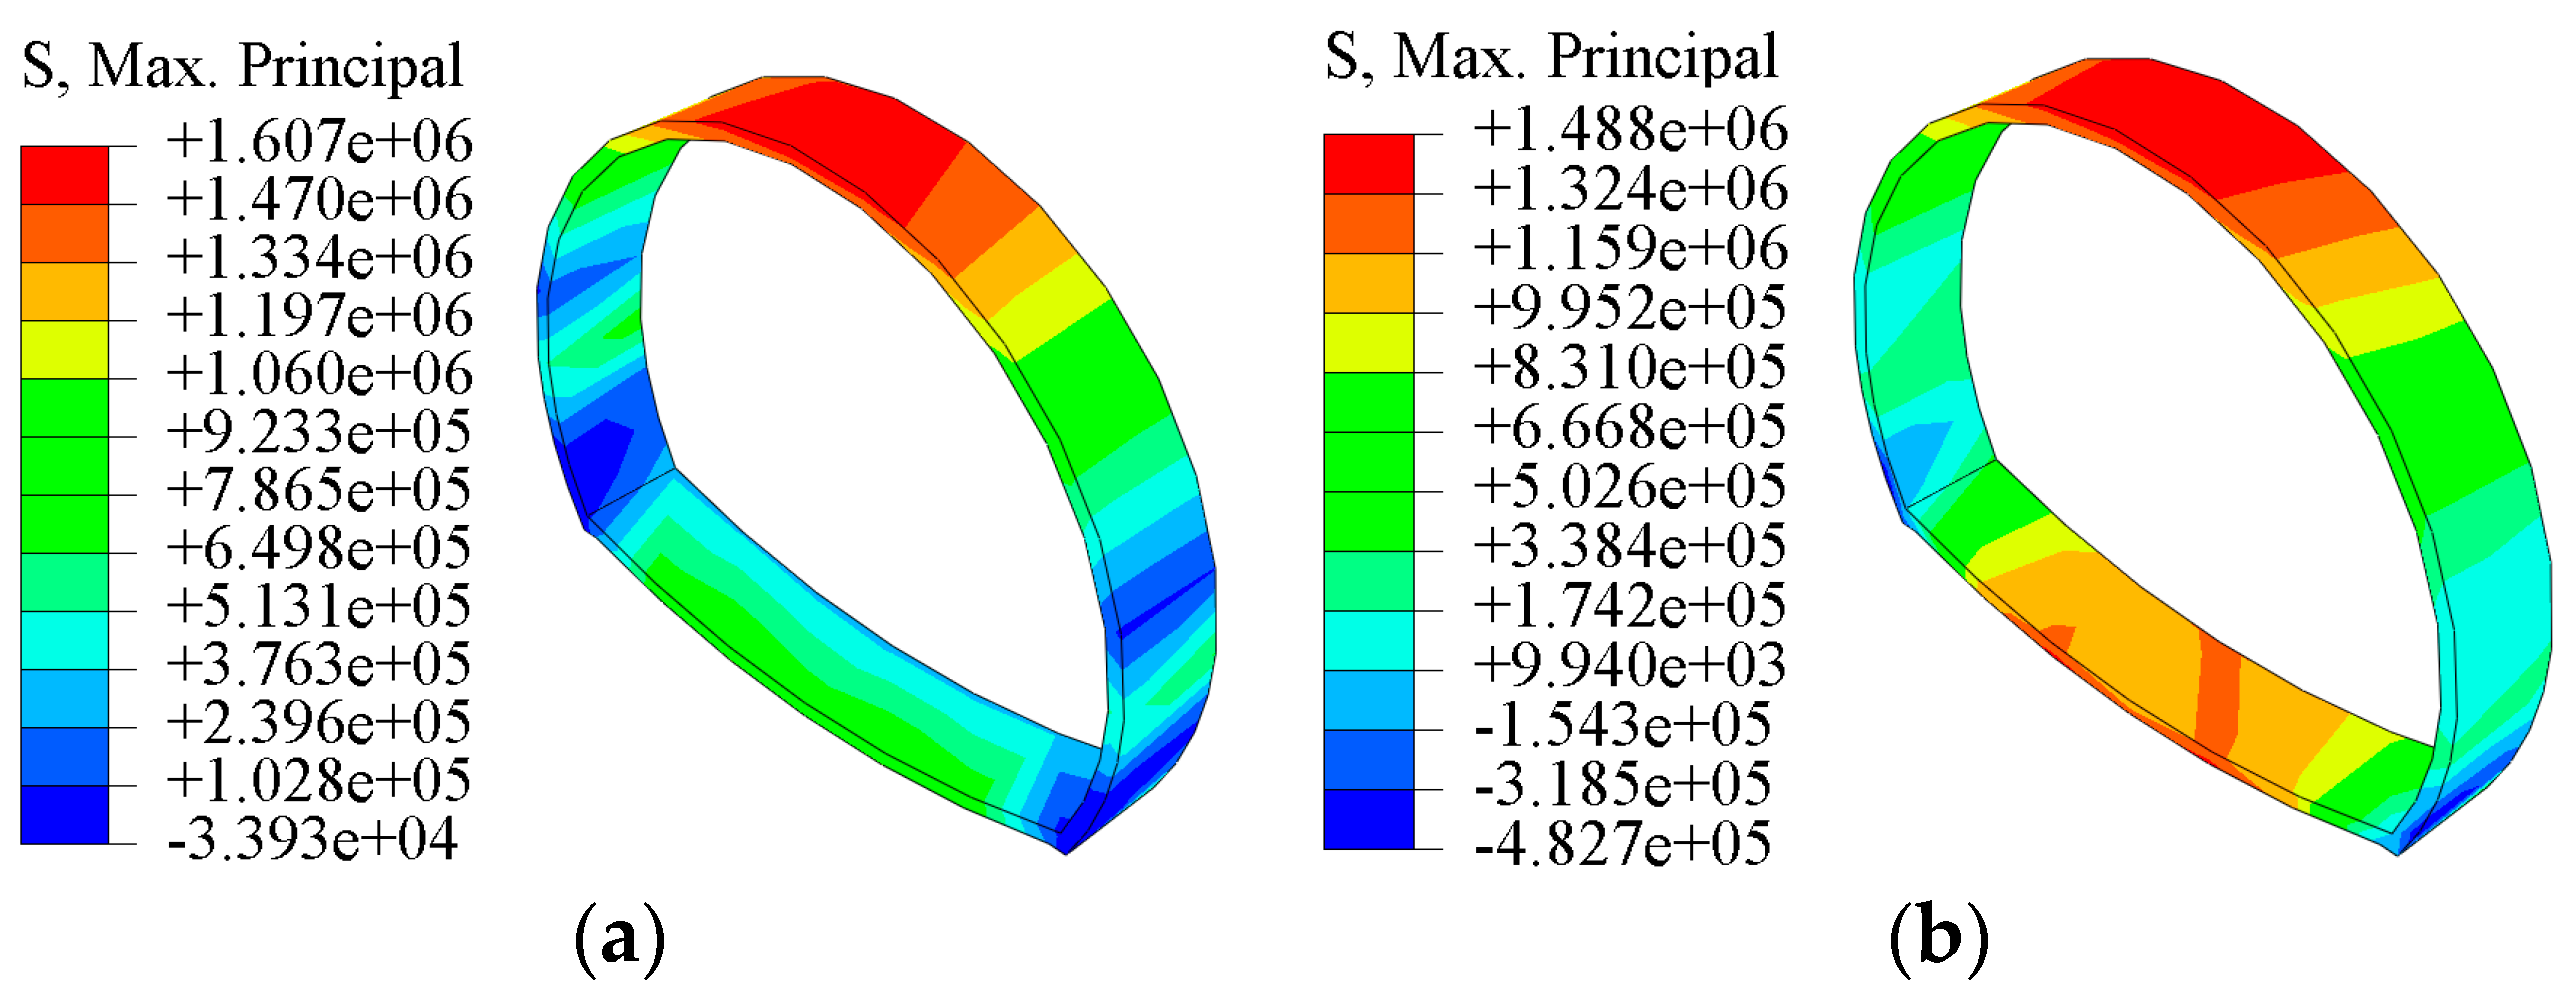
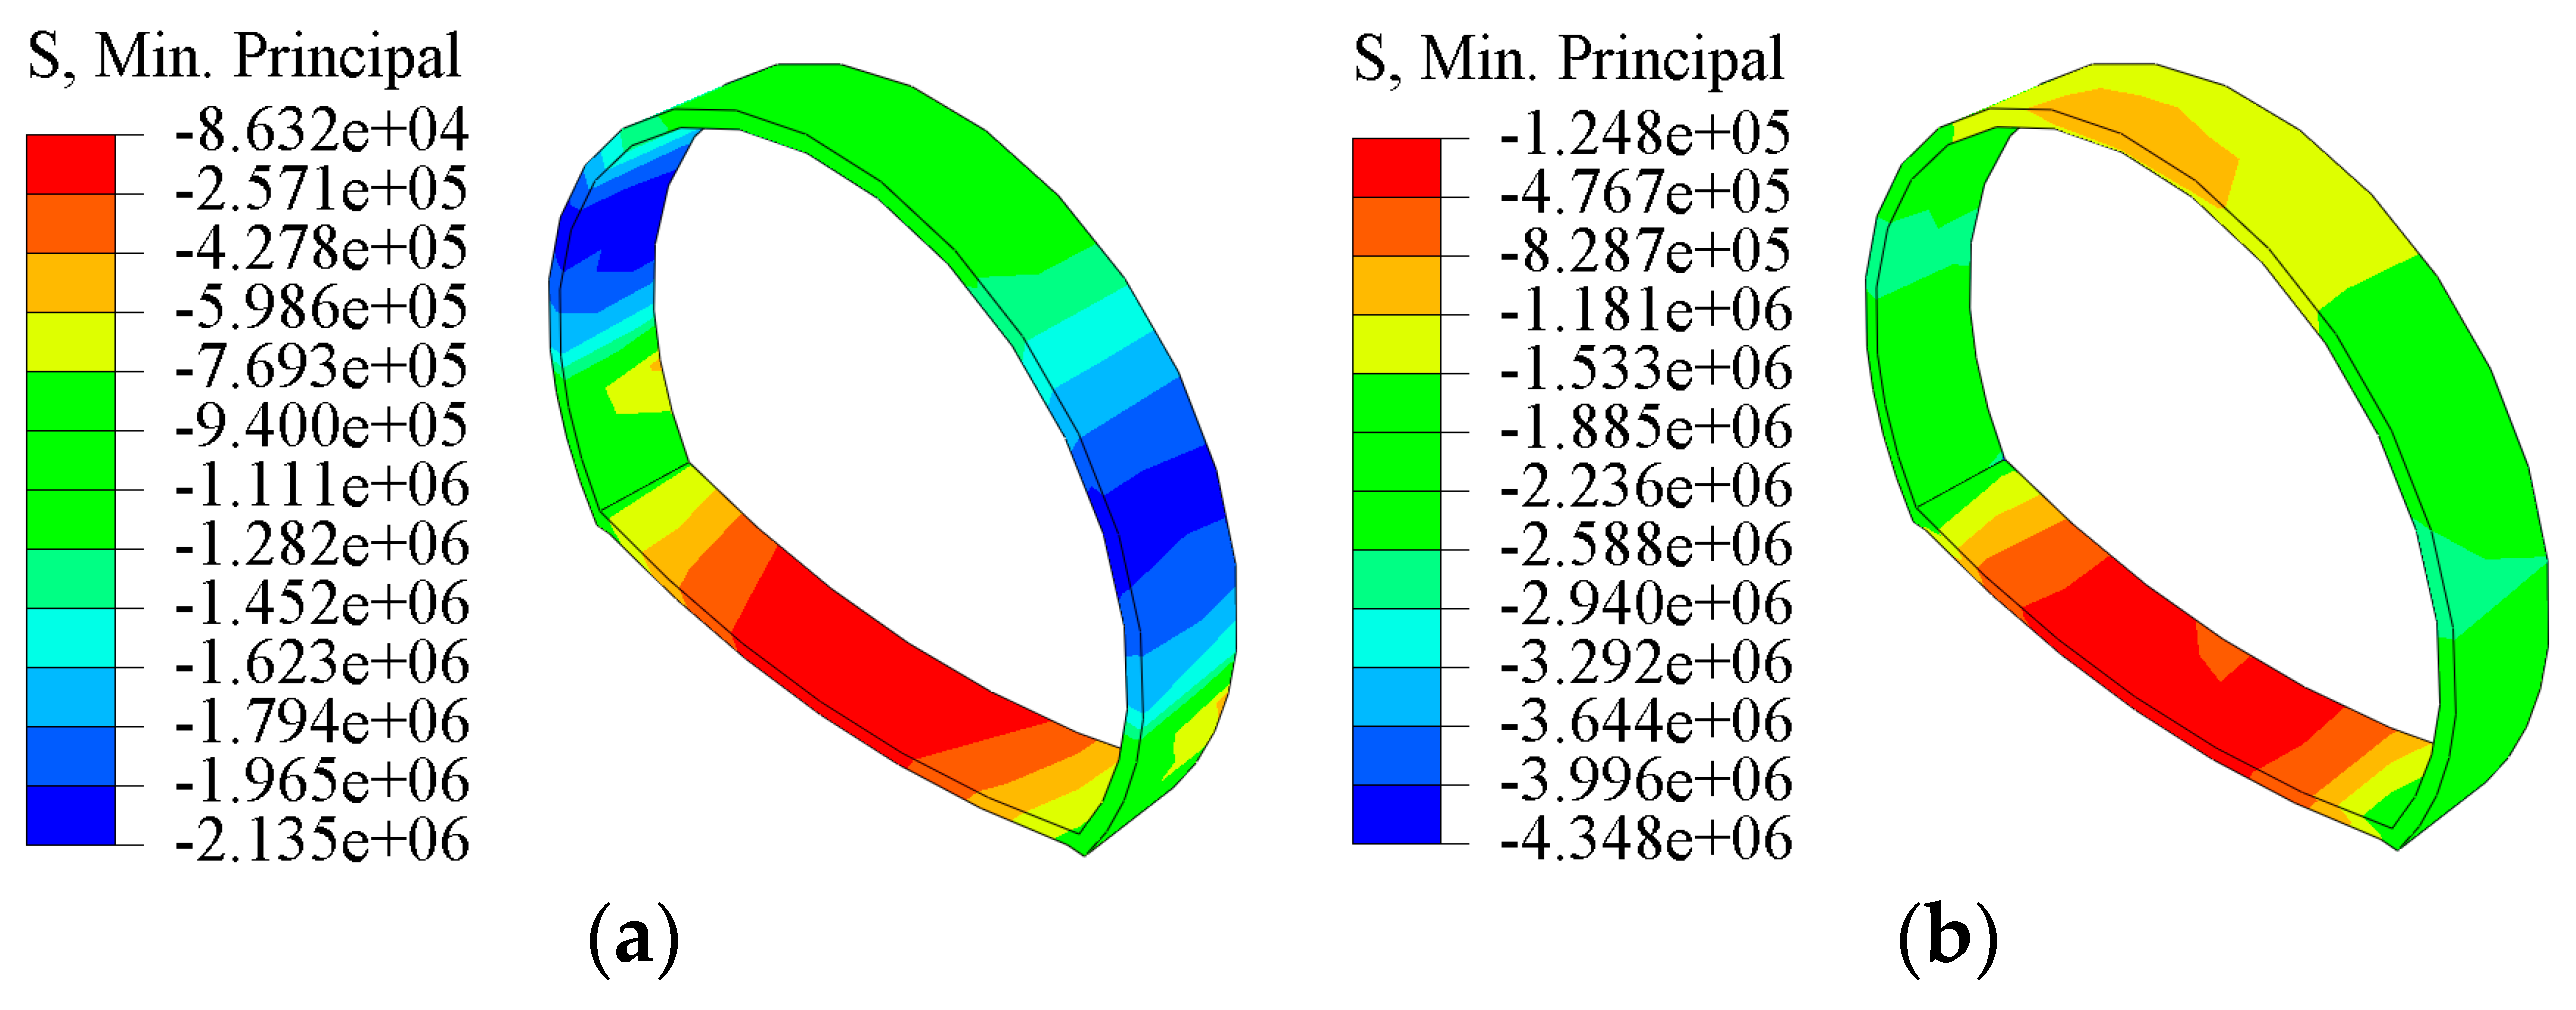
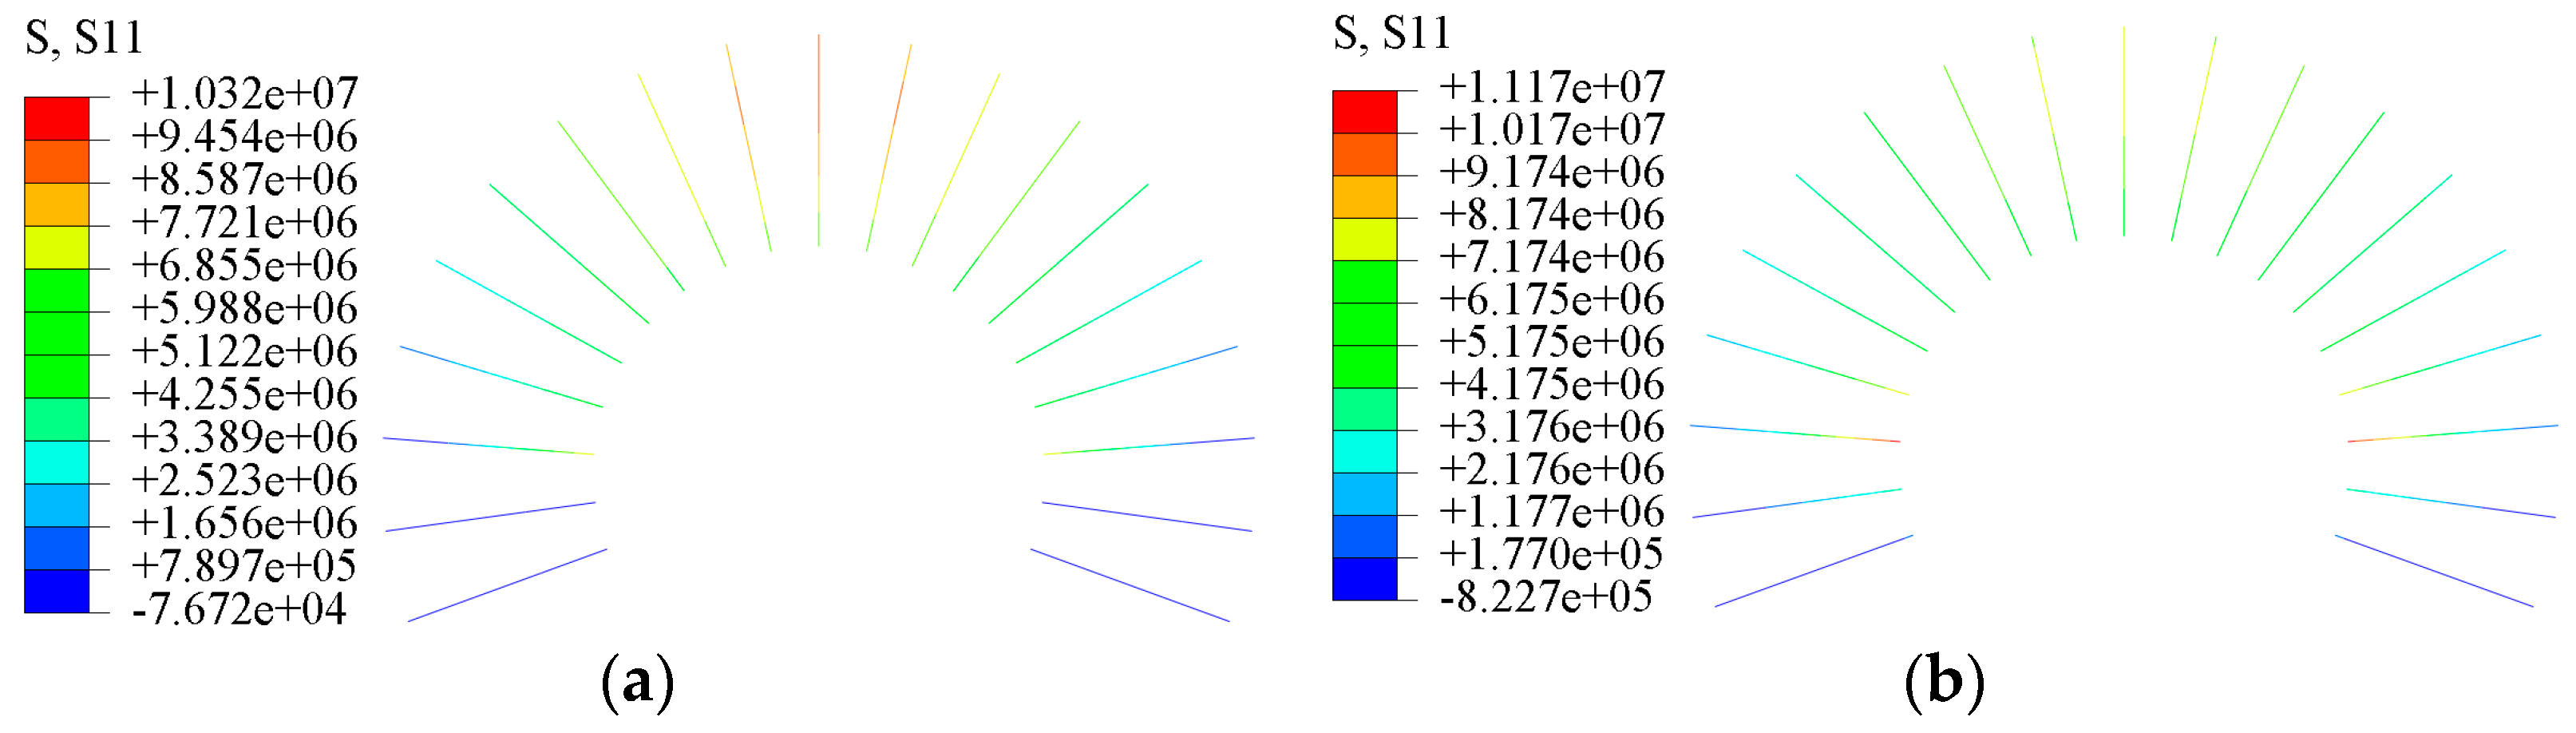
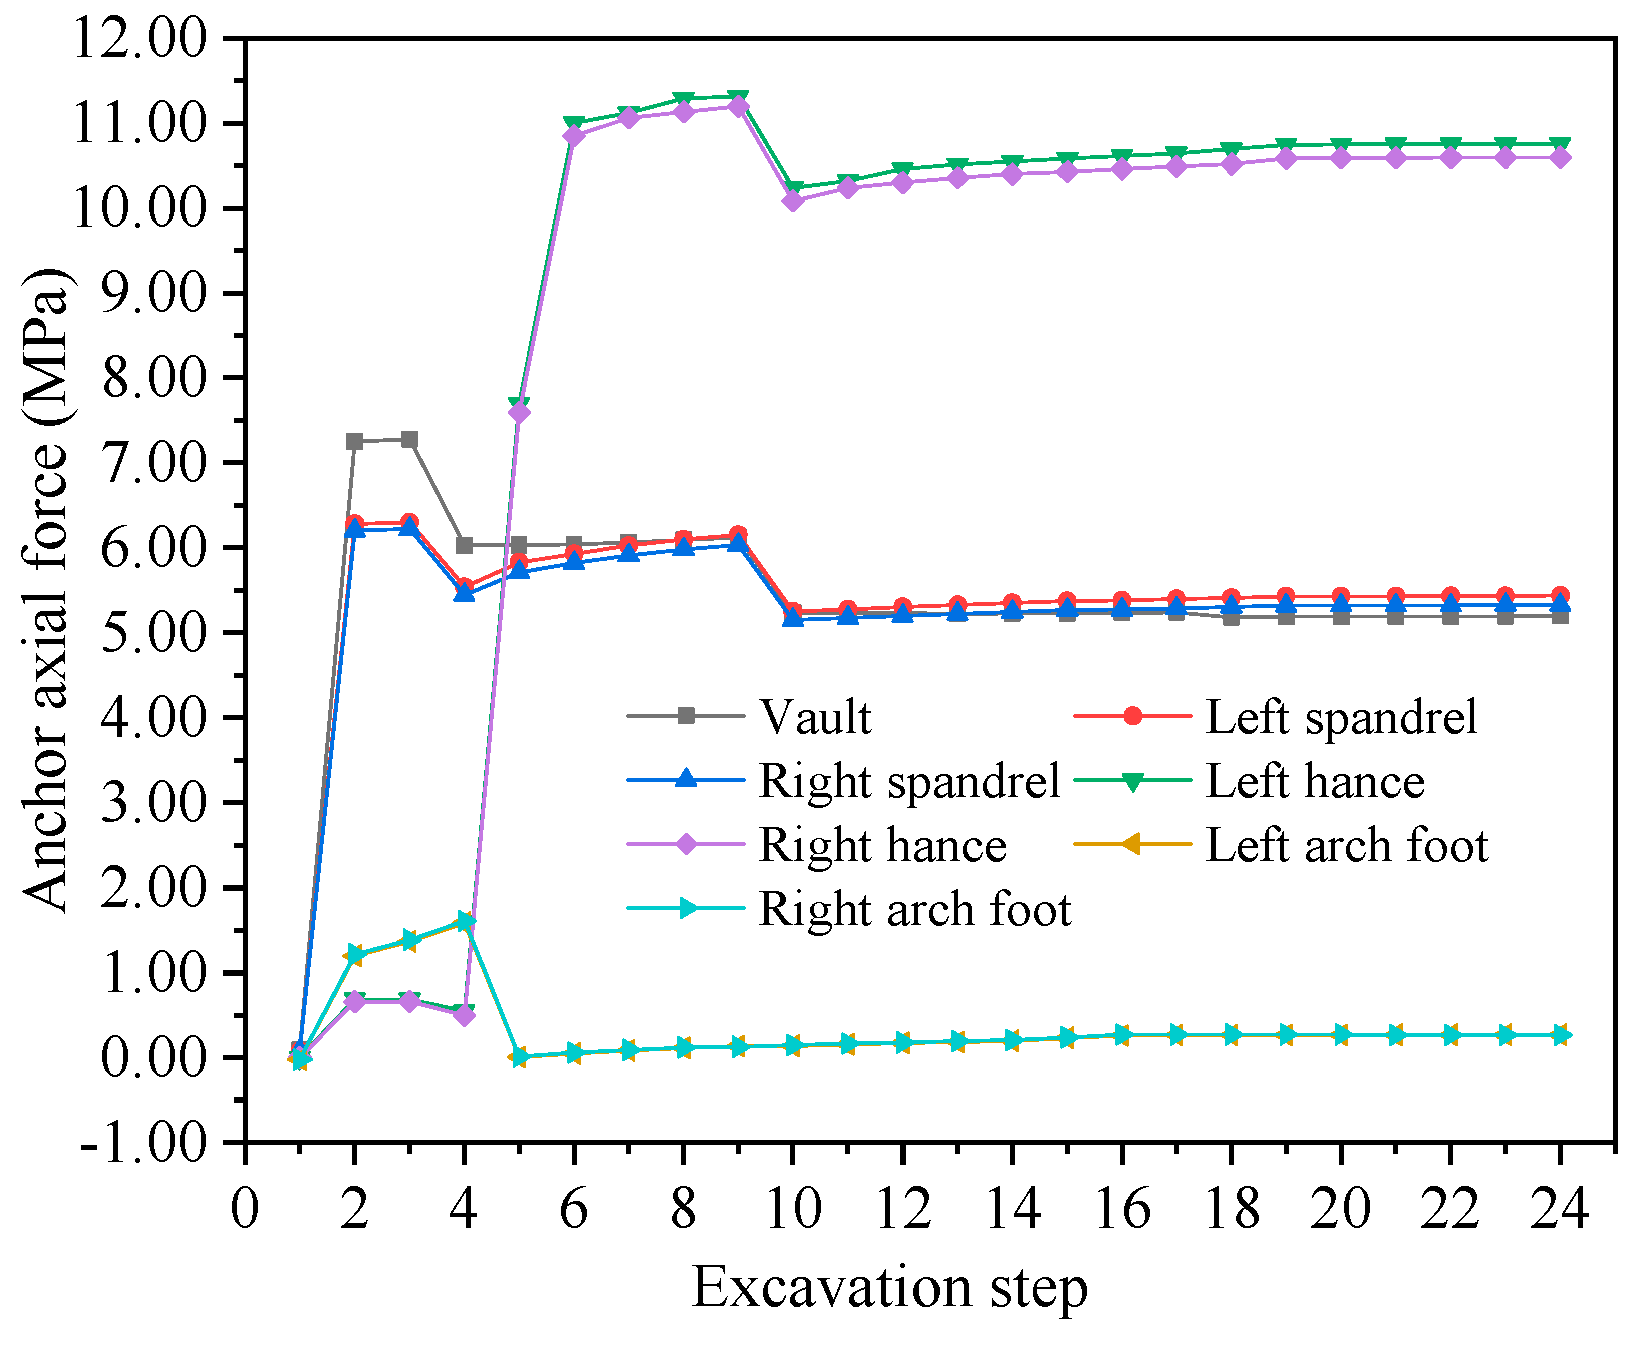
4.2.3. Stress Analysis of Supports

(1) Shotcrete stress. The corresponding nephogram of shotcrete and its variation curve can be seen in Figure 18 and Figure 19. The minimum principal stress nephogram and its variation curve are presented in Figure 20 and Figure 21.
We can obtain from Figure 18 and Figure 19 that maximum principal stress of shotcrete is tensile stress in the vault, spandrel, hance, and bottom, and the maximum is at the vault, followed by the spandrel and hance. It is compressive stress in the arch foot area. With the increase in the excavation step, the maximum principal stress of shotcrete increases gradually and tends to stabilize after the 10th step. In the 5th excavation step, the maximum stresses of the vault, spandrel, bottom, hance, and arch foot are 1.607 MPa, 1.122 MPa, 0.881 MPa, 0.077 MPa, and 0.025 MPa, respectively, whereas the convergence values are 1.443 MPa, 1.240 MPa, 0.911 MPa, 0.055 MPa, and 0.195 MPa, respectively. Convergence values of tensile stresses do not exceed the tensile strength of shotcrete structure, which indicates that the supporting structure is safe.
Figure 20 and Figure 21 show that stress of shotcrete at each key point is compressive, while and the stress at the hance is the largest, followed by the arch foot and bottom. With the increase in the excavation step, the minimum stress of shotcrete gradually increases and tends to stabilize after the 10th excavation step. In the 5th excavation step, the minimum principal stresses of the hance, arch foot, spandrel, vault, and bottom are 1.869 MPa, 1.350 MPa, 1.430 MPa, 1.158 MPa, and 0.199 MPa, respectively, and the convergence values of minimum principal stress are 2.672 MPa, 2.090 MPa, 1.635 MPa, 1.117 MPa, and 0.187 MPa, respectively.
(2) Anchor axial force. The nephogram and variation curve of anchor axial force are presented in Figure 22 and Figure 23.
Calculation results show that the anchor axial force at the hance is the largest, followed by the spandrel, and the smallest is at the arch foot. The anchor axial force increases gradually with the excavation step and tends to stabilize after the 10th excavation step. In the 5th excavation step, the anchor axial forces of the hance, spandrel, vault, and arch foot are 7.651 MPa, 5.774 MPa, 6.036 MPa, and 0.011 MPa, respectively, and their convergence values are 10.682 MPa, 5.386 MPa, 5.201 MPa, and 0.267 MPa, respectively.
(3) Secondary lining stress. The corresponding nephogram and its variation curve are presented in Figure 24 and Figure 25. The nephogram of minimum principal stress for the secondary lining and its variation curve can be found in Figure 26 and Figure 27.
As indicated in Figure 24 and Figure 25, the maximum principal stress of the secondary lining is tensile stress, and the structure bears uniform force. With the advance of the working face, the maximum principal stress at each key point does not increase. The convergence values of stress at the arch foot, vault, spandrel, hance, and bottom are 4.660 MPa, 1.066 MPa, 0.914 MPa, 0.579 MPa, and 0.223 MPa, respectively.
Figure 26 and Figure 27 show that the minimum principal stress of the secondary lining is compressive stress, and the minimum principal stress at each point does not increase obviously with the advance of the working face. The convergence values of it at the arch foot, bottom, hance, vault, and spandrel are 10.382 MPa, 2.463 MPa, 1.713 MPa, 1.021 MPa, and 0.761 MPa, respectively.

5. Conclusions

In this study, the displacement and surface settlement of the Heimaguan Tunnel, a shallow-buried tunnel with soft surrounding rock, were closely monitored. By analyzing the deformation patterns in the surrounding rock, the optimal construction time of the secondary lining for this soft-rock tunnel was determined. Additionally, numerical simulations are conducted to study various factors, including the displacement and stress within the surrounding rock and the stress distribution in the tunnel supports. The following main conclusions are drawn:
(1) The results from ground settlement monitoring align closely with the calculation outcomes predicted by Peck theory. This consistency demonstrates that Peck theory accurately estimates the surface settlement in shallow soft-rock tunnels.
(2) The rate of displacement for vault subsidence and horizontal convergence in this soft-rock tunnel remains below 0.2 mm/day between the 26th and 27th days. The measured displacement values for vault subsidence and horizontal convergence reach 97% and 94% of the predicted values, respectively. These results meet the requirements for secondary lining construction, leading to the determination that the optimal construction time for the secondary lining is between days 26 and 27.
(3) After the 10th excavation, the main stresses in surrounding rock of the tunnel, as well as those in the shotcrete and anchor axial force, stabilize. This confirms that the chosen construction method and supporting scheme ensure project stability. The principal stress within the secondary lining remains relatively unchanged and at a low value. This observation aligns with the current tunnel design concept, where the secondary lining structure primarily serves as a safety reserve.

Author Contributions

J.J., B.X. and X.W.: methodology, simulation analysis, investigation, and writing of original manuscript. V.O.T. and Z.L.: reviewing the manuscript. All authors have read and agreed to the published version of the manuscript.

Funding

This research was funded by the National Natural Science Foundation of China (grant number 42261029).

Institutional Review Board Statement

Not applicable.

Informed Consent Statement

Not applicable.

Data Availability Statement

The data presented in this study are available in article.

Conflicts of Interest

Author Zhongshuai Liu was employed by the company China Merchants Chongqing Communications Technology Research and Design Institute Co., Ltd. The remaining authors declare that the research was conducted in the absence of any commercial or financial relationships that could be construed as a potential conflict of interest.

References

  1. Wang, Z.C.; Sun, W.F.; Yang, W.L.; Wang, K.; Wang, X. Study on response regularity of tunnel supporting structure characterized with soft-rock large deformation. J. Highw. Transp. Res. Dev. 2021, 38, 91–99. [Google Scholar]
  2. Zhao, L.H.; Li, D.J.; Yang, F.; Li, L.; Cheng, X. Dimensionless parameter diagrams for the active and passive stability of a shallow 3d tunnel face. KSCE J. Civ. Eng. 2019, 23, 866–878. [Google Scholar]
  3. Wu, X.-Z.; Liu, Q.-S.; Huang, P.; Zhang, D.; Dai, C.-L. Application of “three-section and four-step” safety treatment technology for tunnel collapse. J. Highw. Transp. Res. Dev. 2022, 39, 123–131. [Google Scholar]
  4. Yuan, R.; Xiong, W.L.; He, Y.; Cui, K. Analysis on the law of ground settlement in shallow tunnel excavation in composite layered strata. J. Southwest Jiaotong Univ. 2021, 57, 1000–1005. [Google Scholar]
  5. Li, T.; Cui, Y.; Cao, Y.J.; Ji, Y.; Guo, H.M. Calculation method of surface settlement caused by tunnel construction in rock-soil composite stratum. China Railw. Sci. 2020, 41, 73–80. [Google Scholar]
  6. Su, Y.; Su, Y.H.; Zhao, M.H. Estimation method of ultimate deformation of soft rock tunnel based on Hoek-Brwon criterion. Chin. J. Rock Mech. Eng. 2021, 40, 3033–3040. [Google Scholar]
  7. Sun, Z.Y.; Zhang, D.L.; Hou, Y.J.; Li, A. Determination of deformation law and stability criterion of tunnel surrounding rock in whole process based on field measured data. Chin. J. Geotech. Eng. 2021, 43, 1261–1270. [Google Scholar]
  8. Yang, C.Z.; Wu, Y.J.; Wang, W.; Tang, Y. Analysis on spatial effect of excavation of large section soft rock tunnel. Chin. J. Undergr. Space Eng. 2021, 17, 511–519. [Google Scholar]
  9. Abdellah, W.R.; Ali, M.A.; Yang, H.-S. Studying the effect of some parameters on the stability of shallow tunnels. J. Sustain. Min. 2018, 17, 20–33. [Google Scholar] [CrossRef]
  10. Deng, B.; Rao, H.G.; Liao, W.P.; Gao, S.M. Research on support structure optimization of soft rock Tunnel. J. Railw. Sci. Eng. 2017, 14, 2203–2213. [Google Scholar]
  11. Yang, F.J.; Zhang, C.Q.; Zhou, H.; Liu, N.; Zhang, Y.; Azhar, M.U.; Dai, F. The long-term safety of a deeply buried soft rock tunnel lining under inside-to-outside seepage conditions. Tunn. Undergr. Space Technol. 2017, 67, 132–146. [Google Scholar]
  12. Lv, J.K.; Yang, J.S.; Zheng, X.C.; Tang, Y.; Xie, Y.P.; Liang, X. Study on large deformation collapse mechanism and control measures for large section tunnel face in Badong formation mudstone. J. Cent. South Univ. 2024, 55, 1418–1432. [Google Scholar]
  13. Xu, H.; Zhang, Y.; Guo, G.H.; Cai, M.; Li, Y.X.; Chen, Z. Method for calculating penetration range of grouting slurry in the reinforced tunnel by high-pressure rotary jet grouting from ground. Rock Soil Mech. 2023, 44, 2064–2072. [Google Scholar]
  14. Zuo, Q.J.; Li, X.Y.; Zhao, X.Q.; Li, P.; Zhu, S.; Han, B.X. Mechanical characteristics and force slow-release method of support structure of expansive soft rock tunnels. Chin. J. Rock Mech. Eng. 2023, 42, 2190–2202. [Google Scholar]
  15. Jia, J.Q.; Wang, H.T.; Li, J.; Zhang, X.; Hu, G.Z. Stability analysis of tunnel supports under complex conditions. Rock Soil Mech. 2010, 31, 3599–3603. [Google Scholar]
  16. Ding, X.L.; Zhang, Y.T.; Huang, S.L.; Chi, J.J.; Zhang, C.J.; Liu, D.X. Large deformation mechanism of surrounding rock masses of tunnels, prediction method of squeezing large deformation and its application. Chin. J. Rock Mech. Eng. 2023, 42, 521–544. [Google Scholar]
  17. Bian, K.; Liu, J.; Liu, Z.; Liu, S.; Ai, F.; Zheng, X.; Ni, S.; Zhang, W. Mechanisms of large deformation in soft rock tunnels: A case study of Huangjiazhai tunnel. Bull. Eng. Geol. Environ. 2019, 78, 431–444. [Google Scholar] [CrossRef]
  18. Zhao, L.L.; Yang, W.B.; Pan, W.T.; Wu, F.Y.; Wang, Z.L.; Yang, Z.C. Study on model test and numerical simulation of layered soft rock tunnel construction with different large deformation grades. Chin. J. Rock Mech. Eng. 2024, 43, 454–467. [Google Scholar]
  19. Jiang, S.; Zhu, Y.; Li, Q.; Zhou, H.; Tu, H.L.; Yang, F.J. Dynamic prediction of surface settlement and analysis of influencing factors for tunnel excavation. Rock Soil Mech. 2022, 43, 195–204. [Google Scholar]
  20. Zhang, Z.; Shi, X.; Wang, B.; Li, H. Stability of NATM tunnel faces in soft surrounding rocks. Comput. Geotech. 2018, 96, 90–102. [Google Scholar] [CrossRef]
  21. Zou, J.-F.; Qian, Z.-H.; Xiang, X.-H.; Chen, G.H. Face stability of a tunnel excavated in saturated nonhomogeneous soils. Tunn. Undergr. Space Technol. 2019, 83, 1–17. [Google Scholar] [CrossRef]
  22. Ukritchon, B.; Keawsawasvong, S. Stability of unlined square tunnels in Hoek-Brown rock masses based on lower bound analysis. Comput. Geotech. 2019, 105, 249–264. [Google Scholar] [CrossRef]
  23. Zhou, P.; Wang, Z.J.; Xu, H.Y.; Du, Y.L.; Hou, W.M. Study on deformation characteristic curve and deformation mechanism of tunnel in XiGeDa stratum. China Civ. Eng. J. 2018, 51, 107–121. [Google Scholar]
  24. Xia, C.; Lu, G.; Bai, D.; Zhu, Z.; Luo, S.; Zhang, G. Sensitivity Analyses of the Seepage and Stability of Layered Rock Slope Based on the Anisotropy of Hydraulic Conductivity: A Case Study in the Pulang Region of Southwestern China. Water 2020, 12, 2314. [Google Scholar] [CrossRef]
  25. Guo, X.L.; Tan, Z.S.; Li, L.; Zhu, Z.G. Study on the construction time of secondary liningin phyllite tunnel under high geo-stress. China J. Highw. Trans. 2020, 33, 249–261. [Google Scholar]
  26. JTG/T3660-2020; Technical Specification for Construction of Highway Tunnel. Ministry of Transport of the People’s Republic of China: Beijing, China, 2020.
  27. Xing, Y.; Kulatilake, P.H.S.W.; Sandbak, L.A. Investigation of rock mass stability around the tunnels in an underground mine in USA using three-dimensional numerical modeling. Rock Mech. Rock Eng. 2018, 51, 579–597. [Google Scholar] [CrossRef]
  28. Lee, C.-L.; Shou, K.-J.; Chen, S.-S.; Zhou, W.-C. Numerical analysis of tunneling in slates with anisotropic time-dependent behavior. Tunn. Undergr. Space Technol. 2019, 84, 281–294. [Google Scholar] [CrossRef]
  29. Wu, H.; Fan, F.; Yang, X.; Wang, Z.; Lai, J.; Xie, Y. Large deformation characteristics and treatment effect for deep bias tunnel in broken phyllite: A case study. Eng. Fail. Anal. 2022, 135, 106045. [Google Scholar] [CrossRef]
  30. Tan, Z.; Li, S.; Yang, Y.; Wang, J. Large deformation characteristics and controlling measures of steeply inclined and layered soft rock of tunnels in plate suture zones. Eng. Fail. Anal. 2022, 131, 105831. [Google Scholar] [CrossRef]
Figure 1. Cross-section of tunnel (unit: cm).
Applsci 14 06014 g001
Figure 2. Monitoring point layout of surface settlement.
Applsci 14 06014 g002
Figure 3. Monitoring point layout of vault subsidence and horizontal convergence.
Applsci 14 06014 g003
Figure 4. Vertical displacement vs. time curves of the monitoring points.
Applsci 14 06014 g004
Figure 5. Surface settlement.
Applsci 14 06014 g005
Figure 6. Displacement vs. rate of vault subsidence and horizontal convergence.
Applsci 14 06014 g006
Figure 7. Fitting curve of vault subsidence.
Applsci 14 06014 g007
Figure 8. Fitting curve of horizontal convergence.
Applsci 14 06014 g008
Figure 9. Numerical model: (a) three-dimensional model and (b) excavation sequence.
Applsci 14 06014 g009
Figure 10. Vertical displacement nephogram of surrounding rock of the tunnel: (a) the 5th excavation step and (b) the 24th excavation step.
Applsci 14 06014 g010
Figure 11. Variation curves of vertical displacement of the key points.
Applsci 14 06014 g011
Figure 12. Horizontal displacement nephogram of surrounding rock: (a) the 5th excavation step and (b) the 24th excavation step.
Applsci 14 06014 g012
Figure 13. Variation curves of horizontal displacement of the key points.
Applsci 14 06014 g013
Figure 14. The nephogram of maximum principal stress of surrounding rock of the tunnel: (a) the 5th excavation step and (b) the 24th excavation step.
Applsci 14 06014 g014
Figure 15. Variation curves of maximum principal stress of surrounding rock of the tunnel.
Applsci 14 06014 g015
Figure 16. The nephogram of minimum principal stress of surrounding rock of the tunnel: (a) the 5th excavation step and (b) the 24th excavation step.
Applsci 14 06014 g016
Figure 17. Variation curves of minimum principal stress of surrounding rock of the tunnel.
Applsci 14 06014 g017
Figure 18. Maximum principal stress nephogram of shotcrete: (a) the 5th excavation step and (b) the 24th excavation step.
Applsci 14 06014 g018
Figure 19. Maximum principal stress curve for shotcrete.
Applsci 14 06014 g019
Figure 20. Minimum principal stress nephogram of shotcrete: (a) the 5th excavation step and (b) the 24th excavation step.
Applsci 14 06014 g020
Figure 21. Minimum principal stress curve of shotcrete.
Applsci 14 06014 g021
Figure 22. Anchor axial stress nephogram: (a) the 5th excavation step and (b) the 24th excavation step.
Applsci 14 06014 g022
Figure 23. Variation curves of anchor axis stress.
Applsci 14 06014 g023
Figure 24. Maximum principal stress nephogram of the secondary lining: (a) the 9th excavation step and (b) the 24th excavation step.
Applsci 14 06014 g024
Figure 25. Variation curve of maximum principal stress for the secondary lining.
Applsci 14 06014 g025
Figure 26. Minimum principal stress nephogram of the secondary lining: (a) the 9th excavation step and (b) the 24th excavation step.
Applsci 14 06014 g026
Figure 27. Variation curve of minimum principal stress of the secondary lining.
Applsci 14 06014 g027
Table 1. Parameters of tunnel supports.
Primary SupportsSecondary Lining
AnchorReinforcing MeshShotcreteSteel Arch
φ22, L = 6.0 m, spacing is 75 × 150 (longitudinal × ring)φ8(double layers), 25 × 25 cmC25, thickness is 28 cmI22a, spacing is 75 cmC35 reinforced concrete, thickness = 50 cm
Table 2. Physical and mechanical parameters for surrounding rock and tunnel supports.
TypesBulk Density
/(kN·m−3)
Elastic Modulus
/GPa
Poisson’s RatioCohesion
/MPa
Internal Friction Angle/Degrees
Surrounding rock22.50.080.300.122
Primary supports22.0260.25
Secondary lining25.031.50.20
Anchor78.52100.20
Disclaimer/Publisher’s Note: The statements, opinions and data contained in all publications are solely those of the individual author(s) and contributor(s) and not of MDPI and/or the editor(s). MDPI and/or the editor(s) disclaim responsibility for any injury to people or property resulting from any ideas, methods, instructions or products referred to in the content.

