Article

Modeling and Prediction of Surface Roughness in Hybrid Manufacturing–Milling after FDM Using Artificial Neural Networks

1
Kosovo and Metohija Academy of Applied Science, 38218 Leposavić, Serbia
2
Faculty of Technical Sciences, University of Priština, 38220 Kosovska Mitrovica, Serbia
3
Faculty of Engineering, University of Kragujevac, 34000 Kragujevac, Serbia
4
Faculty of Economics and Engineering Management, University Business Academy, Cvećarska 2, 21000 Novi Sad, Serbia
*
Author to whom correspondence should be addressed.
Appl. Sci. 2024, 14(14), 5980; https://doi.org/10.3390/app14145980
Submission received: 12 June 2024 / Revised: 29 June 2024 / Accepted: 2 July 2024 / Published: 9 July 2024

Abstract

:
Three-dimensional printing, or additive manufacturing, represents one of the fastest growing branches of the industry, and fused deposition modeling (FDM) is one of most frequently used technologies. Three-dimensional printing does not provide high-quality surfaces, so finishing is required, and milling is one of the best methods for improving surface quality. The combination of 3D printing and traditional manufacturing technologies is known as hybrid manufacturing. In order to improve quality and determine optimal machining parameters, researchers increasingly use artificial intelligence methods. In the context of manufacturing technologies, both multiple regression analysis (MRA) and artificial neural networks (ANNs) have proven to be highly reliable in predicting and optimizing machining processes. This study focuses on the use of MRA and an ANN to analyze the influence of machining parameters such as feed rate, depth of cut, and spindle speed on the surface roughness of a 3D-printed part in a milling process. The study compares the measured results with the outcomes obtained through MRA and the ANN to assess their effectiveness in predicting and optimizing surface roughness. The results show that higher accuracy was obtained from the ANN method.

1. Introduction

Three-dimensional printing, or additive manufacturing (AM), is increasingly used in the manufacturing industry, and fused deposition modeling (FDM) technology is one of the most frequently used 3D printing methods. One of the most important characteristics in production processes is the quality of surfaces. Notably, 3D printing does not produce a sufficiently good surface quality, so additional processing is required, and one of the best methods for this is CNC machining. One of the most frequently used methods for CNC machining is milling. Milling is a commonly used method for post-processing 3D-printed parts that helps to remove any defects present on the parts after printing. The combination of FDM and milling post-processing technology represents a method that is fast, cheap, and gives a good-quality finish [1]. Surface roughness is an indicator related to the quality of treated surfaces and is expressed through mean arithmetic roughness, Ra. High-quality machined surfaces are characterized by low surface roughness [2,3]. In the machining process, factors such as depth of cut, feed rate, and spindle speed that control the cutting operation can be set up in advance. However, factors such as tool geometry, tool wear, and chip formation must be monitored, or the material properties of both the part and the tool will be uncontrolled [4]. In order to improve the machining process and reduce manufacturing time and costs, the industry is increasingly turning to modeling techniques [5]. Artificial neural networks (ANNs) are machine learning algorithms that are highly effective, and they take inspiration from the human brain’s functionality and complex structure. ANNs consist of interconnected neurons, which make it possible for them to transmit and process information with great efficiency. ANNs are useful in various applications, such as prediction, pattern recognition, image and speech recognition, and classification [6].
Several researchers have investigated the impact of 3D printing parameters on surface quality. Models have been developed to predict surface roughness using artificial neural networks and multiple regression analysis.
Shukor et al. [7], in their study, machined polypropylene parts and concluded that average surface roughness values of 0.599 μm can be obtained with the parameters of 1241 mm/min feed rate, 4138 rpm speed, and 0.5 mm depth. Saad et al. [8] concluded that decreasing the printing speed, outer shell speed, layer thickness, and print temperature, which are FDM input parameters for ANNs, resulted in 12.36% higher accuracy than the RSM method, and minimum surface roughness was approximately 2.011 µm. In a study conducted by Boschetto et al. [9], an artificial neural network was employed to forecast the surface roughness of Acrylonitrile Butadiene Styrene (ABS) parts. The study investigated the influence of varying numbers of neurons and activation functions. Using an artificial neural network and feed-forward backpropagation, Plaza et al. [10], in their study, discovered that layer thickness greatly affects the surface roughness of PLA components, whereas feed rate has no significant effect on it. Lyu et al. [11] developed models for surface roughness prediction in fused deposition modeling, considering extruder temperature, layer thickness, and infill density. They used artificial neural networks, support vector machine regression, and regression analysis models. The study found that the artificial neural networks produced better results than the SVR and multivariate linear regression models. Nagarajan et al. [12] introduced an artificial neural network that combined dimensional analysis conceptual modeling and a classic ANN. They improved the quality of parts manufactured with fused deposition modeling by introducing their model. Kandananond et al. [13] used an artificial neural network in their research to predict the surface roughness of parts printed by fused deposition modeling. They used layer thickness, bed temperature, and printer speed as model parameters.
In addition to the optimization of 3D printing, there are also a large number of studies dealing with the application of artificial neural networks in the process of optimizing machining parameters.
Benardos et al. [14] used an artificial neural network for the face milling of an Al alloy. Parameters such as depth of cut, feed rate per tooth, cutting fluid, engagement of the cutting tool, and cutting forces were used in the model. The obtained results from this study showed that artificial neural networks can be highly accurate. Anuja and Kirubakaran [15] developed an artificial neural network model to predict surface roughness in the machined surface turning of AISI H13 steel. They assessed the model’s predictive capacity and calculated the root mean square error. The model achieved a mean accuracy of up to 95.96% with a smaller training data size. In their study, Nalbant et al. [16] examined the correlations among cutting parameters during the turning of AISI 1030 steel and their impact on surface roughness. They constructed a model that utilized artificial neural networks (ANNs) to forecast surface roughness. In the area of artificial neural network (ANN) modeling, the SCG training algorithm with nine neurons produced the highest prediction accuracy. Hossein et al. [17], in their research, employed an artificial neural network and multiple regression analysis in order to predict and minimize surface roughness in the milling process of an AL-7075 alloy. After the milling process, it was necessary to compare the predicted model with the real Ra measured data. They concluded that the results showed almost the same values in both cases (measured and predicted). Meral et al. [18] found that factors like feed rate and cutting speed have an important impact on surface roughness in the drilling of AISI 1050 materials. They concluded that second-order regression models are the most suitable method for predicting surface roughness. Asiltürk and Çunkaş [19] used different cutting parameters to measure surface roughness in the turning process of AISI 1040 steel. They used multiple regression and artificial neural networks in order to build predictive models depending on speed, feed rate, and depth of cut. The highest correctness was achieved with the ANN model for surface roughness prediction with multiple regression analysis.
Lin et al. [20] proposed a model developed by utilizing MRA and an ANN based on cutting parameters and vibration in the milling process of an Al6061 aluminum alloy. Their results indicated that the ANN consistently outperformed MRA in terms of prediction accuracy across all training data. In a study by Yilmaz et al. [21], a neural network model was developed to predict surface roughness in the milling process of polyamide. The model utilized spindle speed and feed rate as inputs and produced accurate results. Tsai et al. [22] developed ANN and MRA models to predict surface roughness in aluminum 6061 alloy milling. The ANN model outperformed the MRA model in accurately predicting surface quality, with a model with two hidden layers achieving a higher accuracy rate (99.27%). Zain et al. [23] determined that, in artificial neural network modeling, the key factors affecting prediction accuracy are the number of neurons and layers in the hidden layers. According to the prediction model, the optimal surface roughness value in the end-milling process of titanium alloys is achieved at a high speed, low feed rate, and radial rake angle. Shie et al. [24] worked with high-purity graphite and created an ANN model in order to predict surface roughness in their research. The prediction results were much more accurate with the ANN model than with traditional methods, the experimental design method, and the Taguchi method. Jafarian et al. [25] used three artificial neural networks (ANNs) to predict surface roughness in the turning process of particulate-reinforced aluminum matrix composites. They used evolutionary algorithms instead of traditional backpropagation, demonstrating that genetic algorithms significantly improved the accuracy of the output model. According to Kosarac et al. [26], ANNs trained with small data can predict average surface roughness (Ra) in machining processes. Yanis et al. [27] investigated the performance of RSM and an ANN in predicting Ra in the machining process of carbon steel SS400. According to their results, the ANN model predicted the Ra more accurately than the RSM model. Krayel [28] proposed a novel approach for predicting surface roughness in the CNC machining of aluminum alloys using artificial neural networks, demonstrating a close correlation between the measured and predicted results. Dhokia et al. [29] conducted a study on utilizing neural networks to predict surface roughness in the CNC machining process of polypropylene. The results showed that an intermediate range of CNC parameters would lead to better surface roughness, and at maximum feed rate, depth of cut, and speed, the average surface roughness was the highest.
Limitations in the 3D printing process, such as low roughness and low dimensional accuracy, lead to the need to combine it with traditional manufacturing methods. This concept led to the development of a hybrid manufacturing process (HM) that combines AM and CNC manufacturing.
Pămărac et al. [30] conducted a study on optimal milling parameters for machining FDM-printed parts using ABS and PLA as the primary materials. Their findings indicated that a spindle speed of 3500 rev/min was optimal for the face milling of 3D-printed components. Amanullah, in [31], designed a hybrid manufacturing form able to combine milling and printing operations on the same structure. Gurguras et al. [32] used MRA to predict optimal values for parameters like layer spindle speed, height, printing speed, material compensation flow, milling depth, and feed speed. They concluded that layer height was the primary factor influencing surface roughness, with minimal roughness achieved at the highest layer height. Li et al. [33] conducted a study on the combination of computer numerical control (CNC) and 3D printing processes, which is a hybrid technique. Following the milling process in this hybrid approach, the surface roughness was reduced to 4.870–24.511 μm from 17.332–56.021 μm.
From this review of the literature, it can be concluded that previous research has mainly focused on the application of ANNs in process parameter optimization, both in AM and in process parameter optimization in the CNC machining of metal parts. ANN and MRA methods are used to obtain a better prediction of surface roughness. Research in the area of HM has included some investigation into the use of artificial neural networks (ANNs) for modeling and predicting surface roughness in HM after CNC milling. The aim of this study is to represent how milling processing parameters affect the surface quality of 3D-printed components and to create artificial neural network (ANN) models for predicting surface roughness.

2. Materials, Methods and Equipment

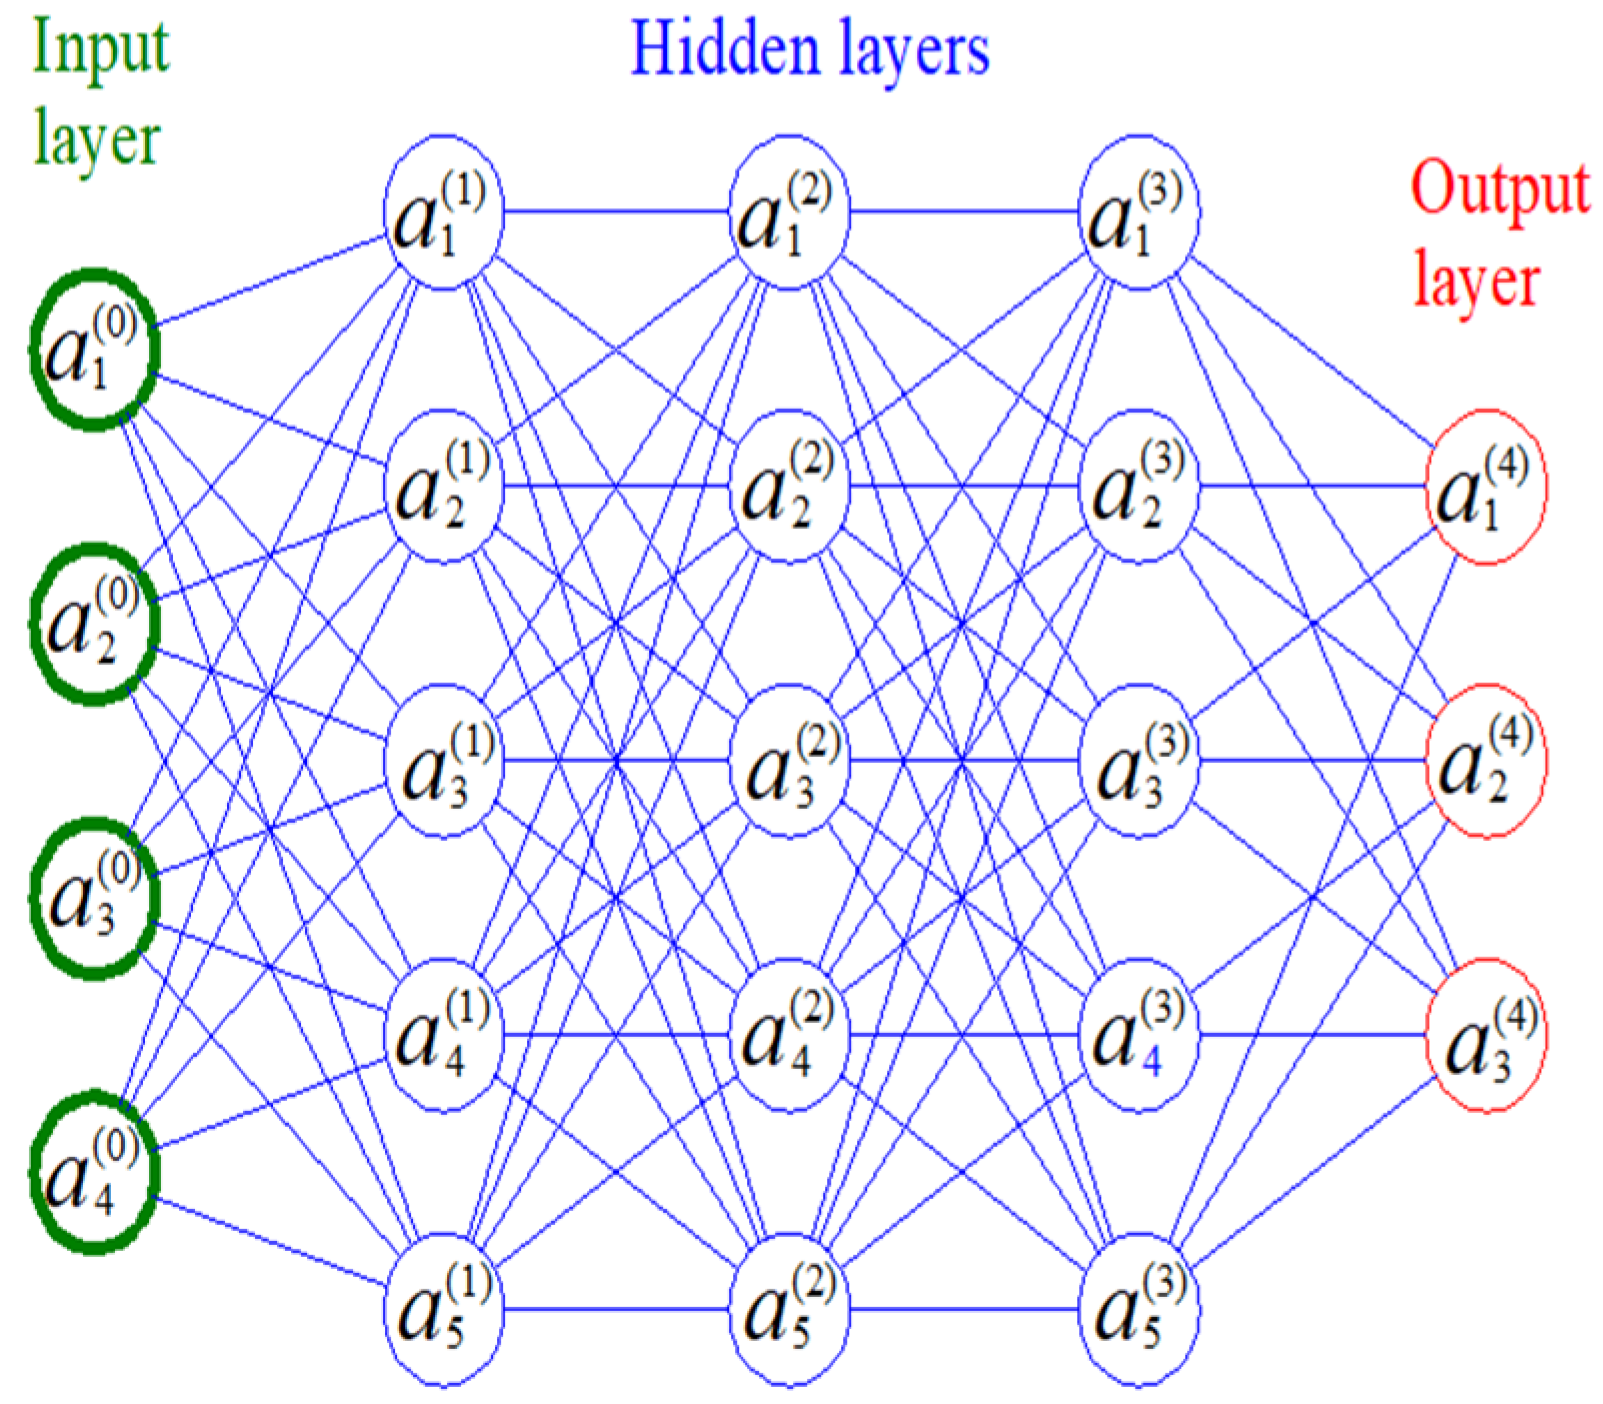
2.1. Artificial Neural Networks

A mathematical model or computer model that is inspired by the characteristics and structure of biological neural networks is known as an artificial neural network (ANN), and sometimes known as a neural network (NN) [34]. ANNs are powerful, parallel-connected processors that have a natural ability to gather knowledge from experimental data and use that knowledge in a similar way to the human brain [35].
A three-layered structure is present in a neural network (as illustrated in Figure 1). The input layer, which directly communicates with the external environment, is the first layer. The second layer consists of hidden units where computations are performed based on the given function, and the last layer is the output layer that generates the output. The knowledge in neural networks is stored as synaptic weights between neurons. The input data are transmitted from layer to layer through the network until the output data are produced. If the network is a multilayer perceptron using a backpropagation algorithm, and the output is different from the desired output, an error is computed and propagated back through the network. As the error is propagated, the synaptic weights are changed [36].
When compared to statistical methods, ANN analysis is more flexible in terms of the quantity and nature of the training (experimental) data, allowing for the use of less formal experimental designs [37].
Figure 1. Structure of ANN [38].
Applsci 14 05980 g001
Each layer in a neural network has an activation vector, and the accuracy of the network can be affected by parameters such as training data, learning rate, and number of iterations and hidden layers.
The input layer is denoted by a(0) and the output layer is denoted by a(n). Any layers that exist between the input and output layers are considered to be hidden layers. Input layer activation is identical as the input. Each relation between neurons is appointed a unique weight, represented by “w”. To calculate the output layer, the forward propagation algorithm is used, while the backpropagation algorithm is used for training.
Activation functions play a critical role in artificial neural networks, as they facilitate the learning and comprehension of complex, non-linear relationships between input and output data. In an artificial neural network (ANN), the output of each layer is calculated by taking the totality of the products of the inputs and their corresponding weights, followed by the application of a function of activation. This output is then passed as the input to the following layer in the network. The accuracy of neural network predictions depends on the number of layers used and the type of activation function used. A neural network without activation functions acts as a linear regression model with limited performance. The activation function must be differentiable in order to involve backpropagation for error estimation, and finally, weight optimization. There are a large number of activation functions, the most famous of which include binary, linear, sigmoid, tanh, ReLU, exponential, etc. [39].
Rectified Linear Unit, or ReLU (Figure 2), has a derivative function, although it gives the impression of a linear function. ReLU enables backpropagation while making it computationally efficient. The main advantage of the ReLU function is that it does not activate all neurons simultaneously. For a neuron to be deactivated, the output of the linear transformation must be below zero. In other words, the neuron will only deactivate when the output of the linear transformation is exactly zero. This can be mathematically described by Equation (1):
g Z = max 0 , Z
Tanh, short for hyperbolic tangent, is a mathematical function that shares similarities with the sigmoid function. However, unlike the sigmoid function, tanh is symmetric around the origin. This symmetry results in different signs of outputs from previous layers being provided as input to the following layer. Mathematically, tanh can be described by Equation (2):
g Z = e Z e Z e Z + e Z
The hyperbolic tangent (tanh) function is a constant and differentiable function whose output values range from −1 to 1 (Figure 2).

2.2. Multiple Regression Analysis

A modeling technique that is one step beyond simple regression is multiple regression analysis. In multiple regression analysis, the key distinction from simple regression lies in the inclusion of two or more independent variables (also known as predictor variables) in the model, as opposed to just one [40]. There are two primary forms of regression involving multiple independent variables:
  • Single step or standard: All predictors enter the regression together.
  • Hierarchical or sequential: Each block defines a single step, and all predictors are incorporated in the blocks.
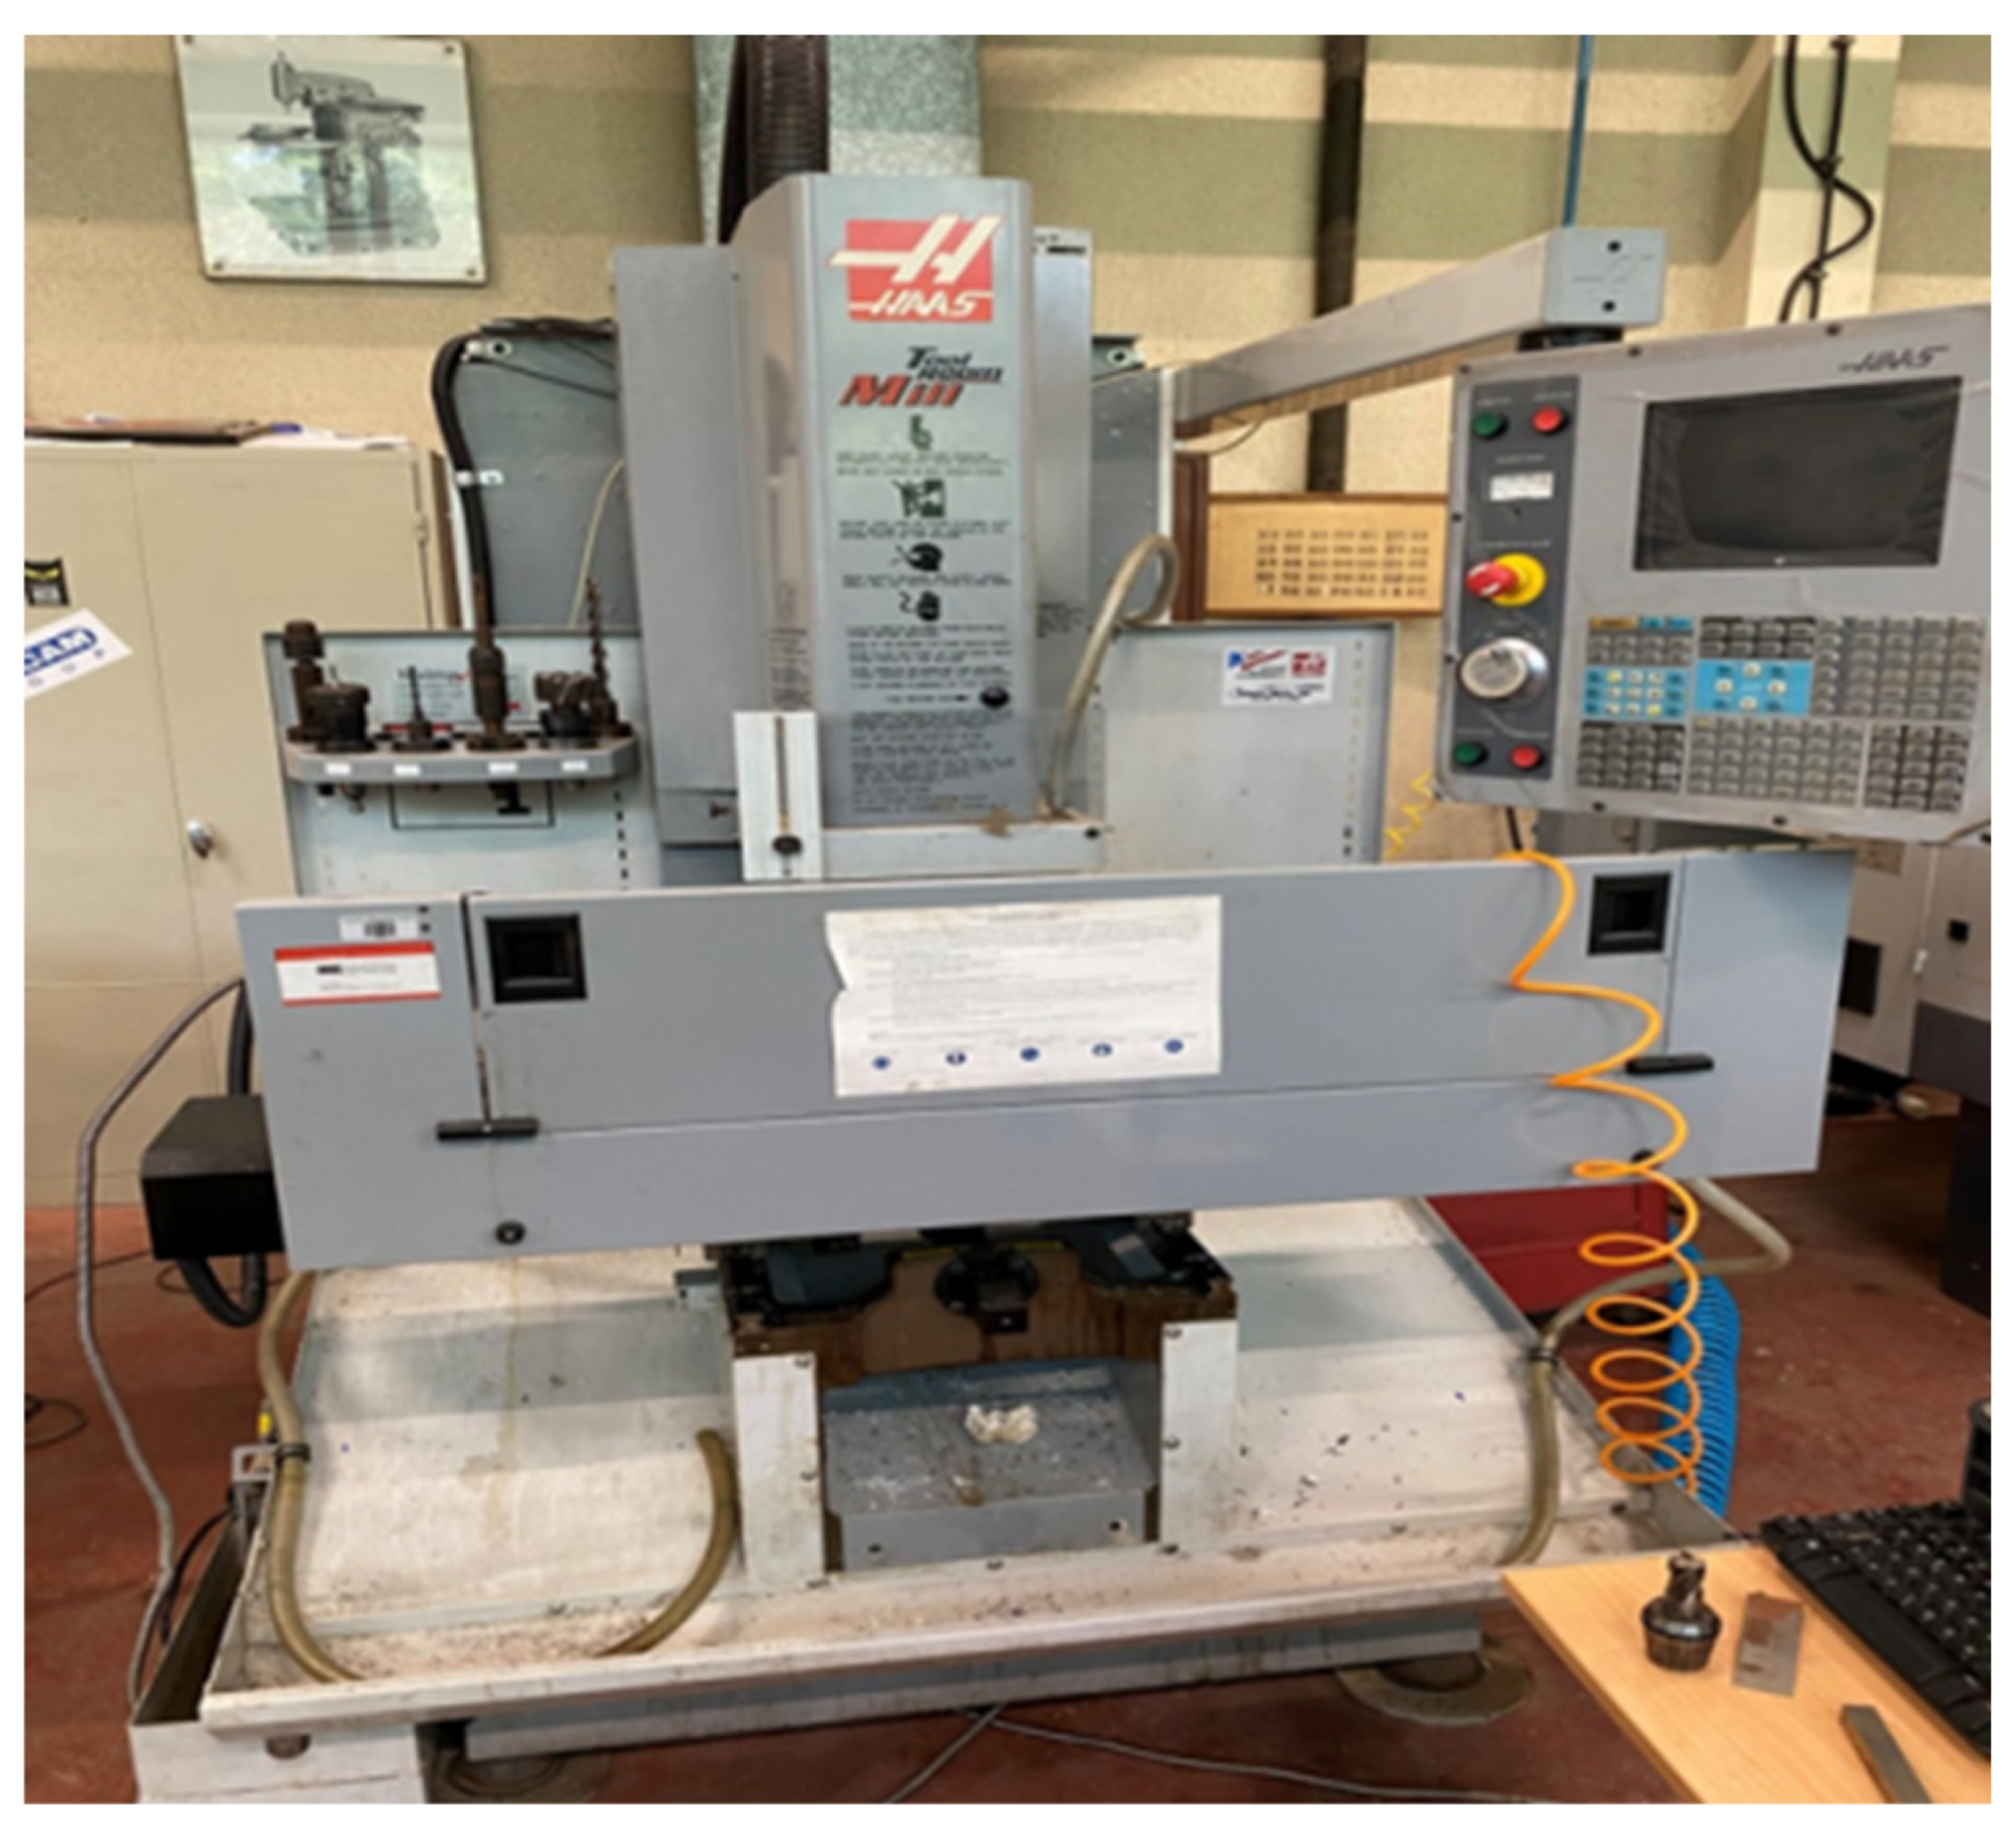
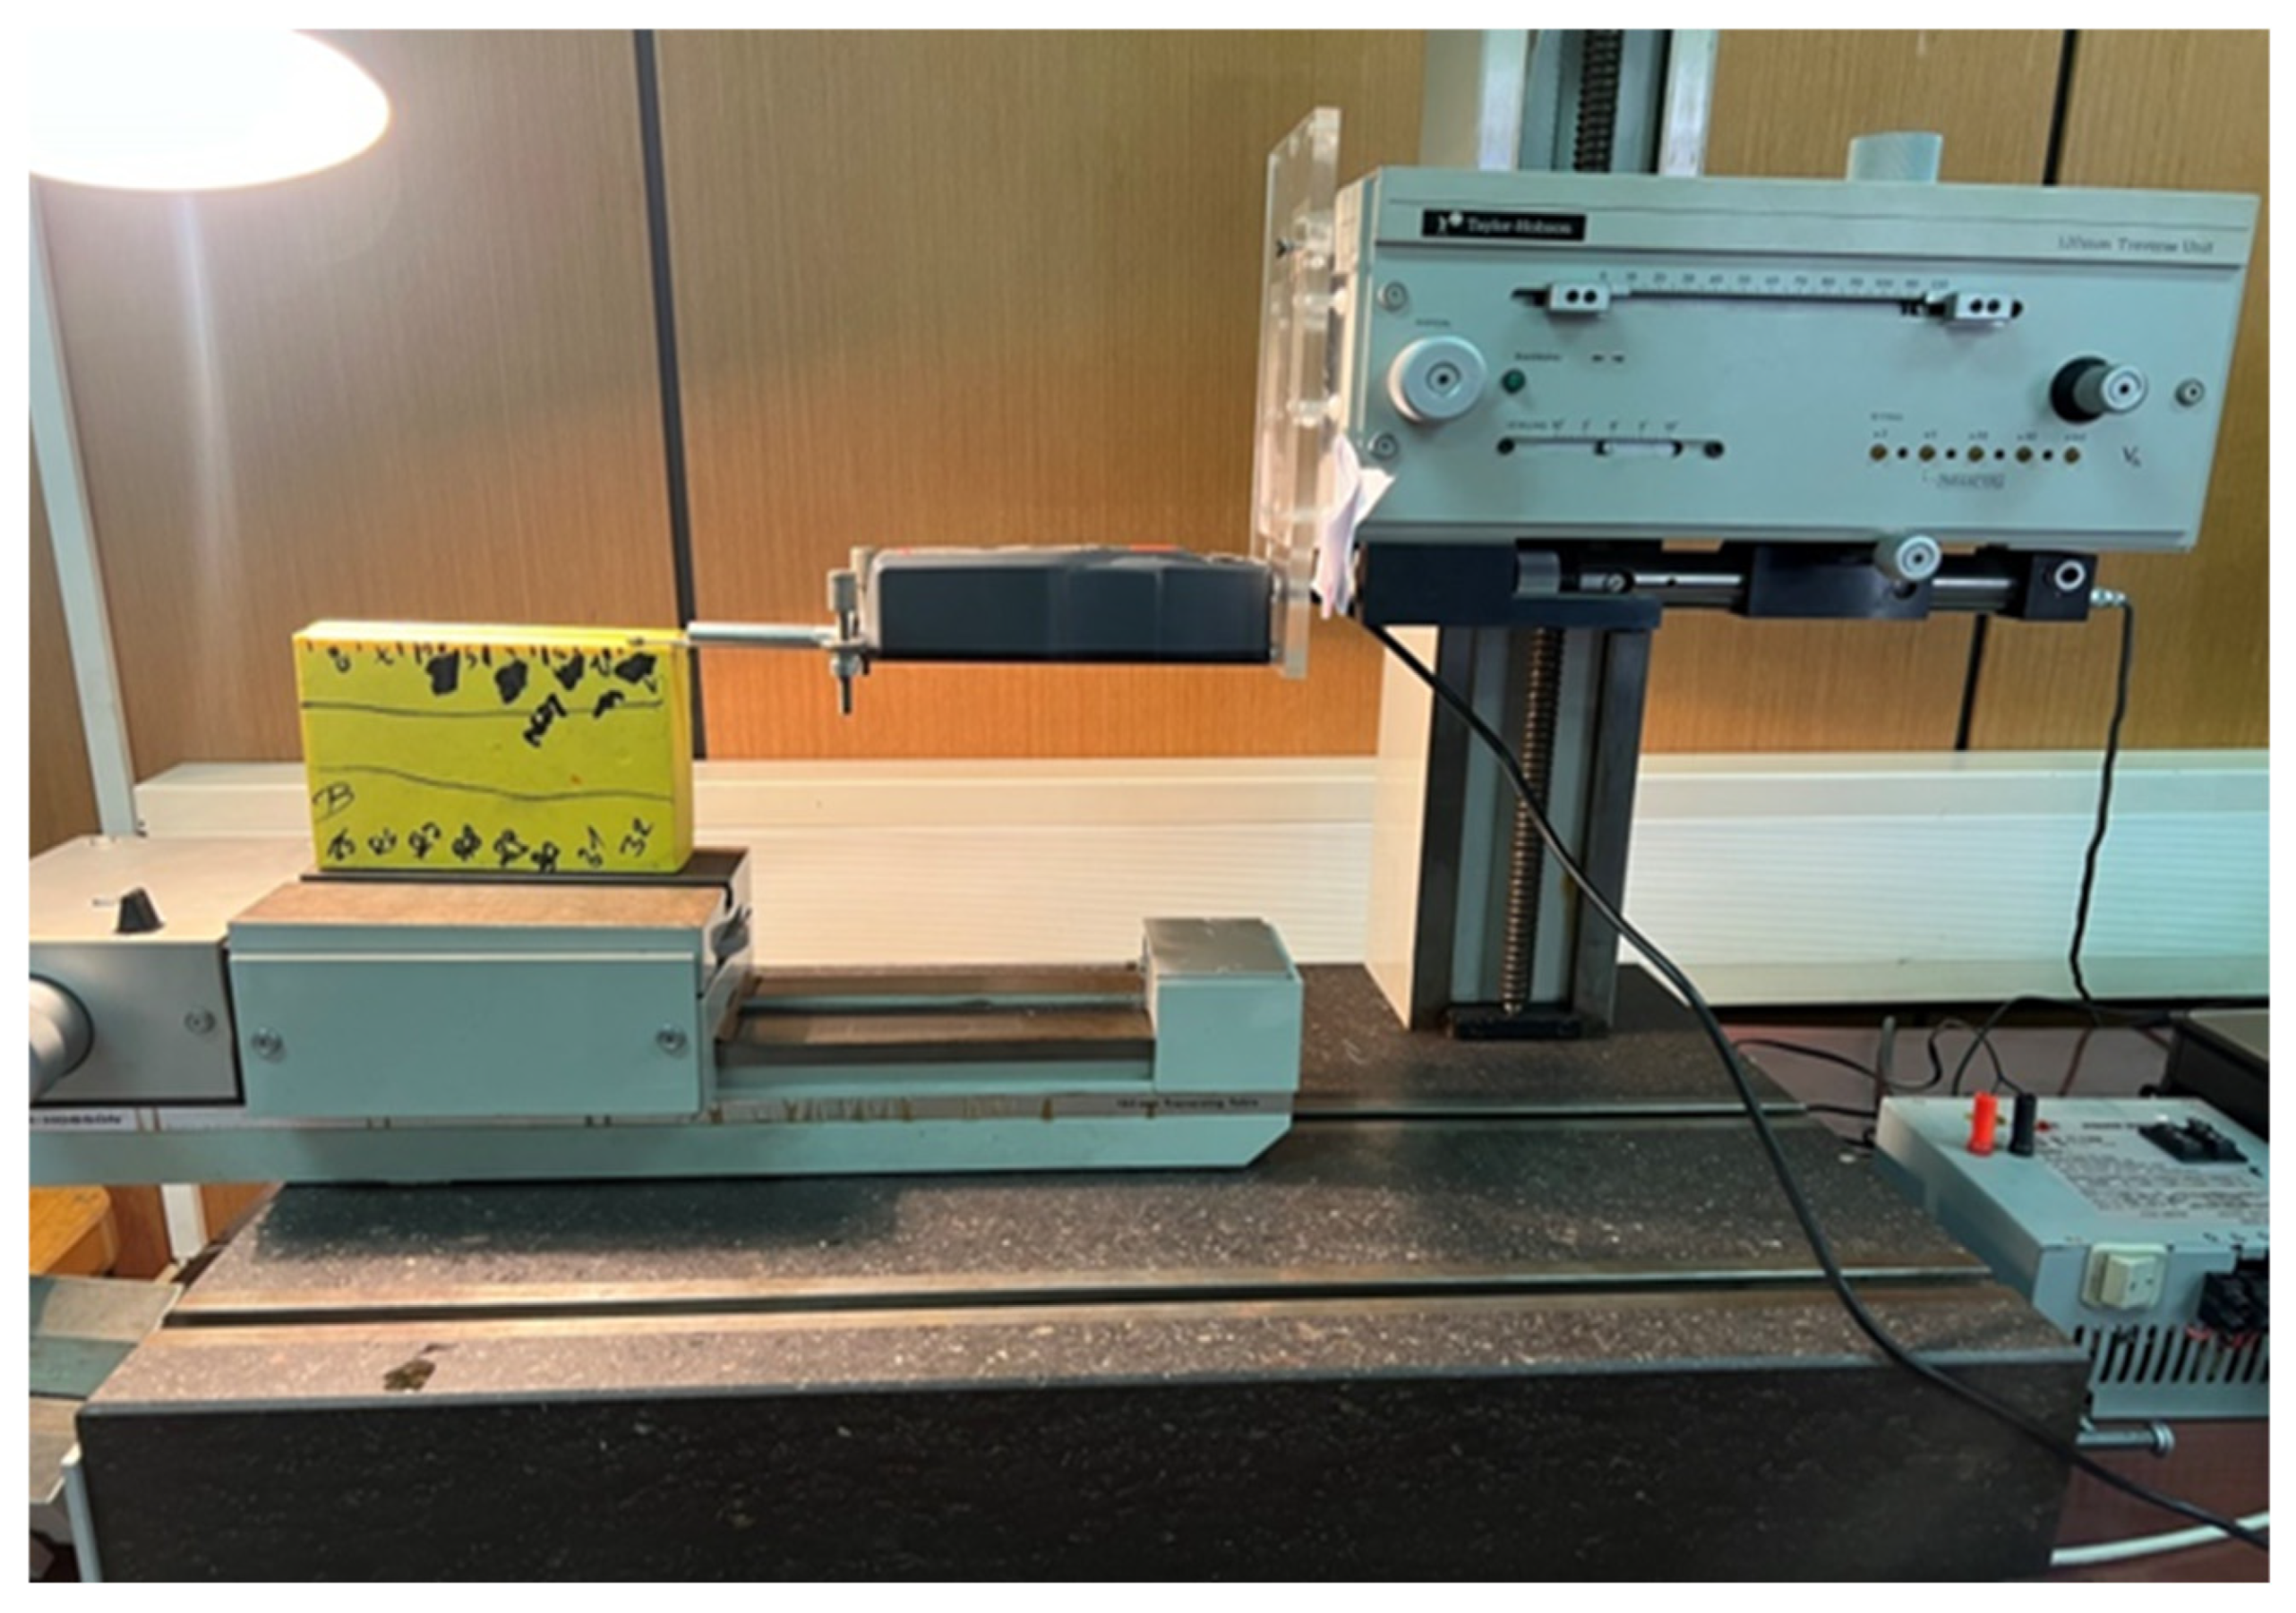
This statistical method is versatile in its ability to analyze various types of data, such as categorical, ordinal, or interval data, and it offers estimations of the importance and intensity of connections between variables. For making predictions about surface roughness using predictor variables like feed rate, depth of cut, and spindle speed, multiple regression analysis can be highly beneficial [41]. Second-order Equation (3), for predicting surface roughness, can be expressed in the following way:
R a = Ө 0 Ө 1 Ө 2 . . . Ө 9 × [   1   n   V f   a p   n 2   n V f   n a p   V f 2     V f a p   a p 2   ]
The third order can be expressed as Equation (4):
R a = Ө 0 Ө 1 Ө 2 . . . Ө 19 × [   1   n   V f   a p   n 2   n V f   n a p   V f 2     V f a p   a p , 2     n 3 , n 2 V f   n 2 a p   n V f 2     n V f a p   n a p 2     V f 3     V f 2 a p   n a p 2     a p 3     ]
The equation for Ra involves estimated surface roughness, with Vf representing feed rate, n as spindle speed, and ap as depth of cut. To obtain the coefficients for the second-order equation, Ө0, Ө1, Ө2… Ө9, and for the third-order equation, Ө1, Ө2, Ө3… Ө19, appropriate methods must be used for estimation.

2.3. Equipment

A 3D CAD model of the workpiece was modeled in Solidworks 2015 ×64 edition CAD software (Figure 3a), saved as an Stl file, and imported to Ultimaker Cura 4.11.0 software, where infill density was changed to 100% and the build orientation was flat (Figure 3b). PLA material was used for printing the workpiece. The workpiece was printed using a Creality 10-s printer, located at the Faculty of Technical Sciences in Kosovska Mitrovica. The characteristics of the printer are as follows: print speed: normal 60 mm/s–max 100 mm/s; nozzle diameter: 0.4 mm; build area of 300 × 300 × 400 mm3; and a wide range of materials like PLA, PETG, TPU, and ABS.
The machine used for machining was a Haas VF-3SS vertical milling machine with three CNC-controlled axes (Figure 4), located at the Faculty of Engineering, Kragujevac.
This vertical milling machine has an axis of rotation in the Z direction, while the X axis represents the length of the worktable, and the Y axis is aligned with the movement of the table forward and back. All axis movements are provided by spiral spindles with a nut, and as a measuring device the system uses a linear encoder. The control unit of the HAAS VF-3SS is HAAS 2. The features of the Haas VF-3SS vertical milling machine are as follows: X-Y-Z axis range: 1016–508–635 mm; maximum number of revolutions: 12,000 rpm; maximum speed of auxiliary movement: 21.1 m/min; total power: 22.4 kW; capacity of tools in the magazine: 24 + 1. The tool used for machining was a spindle cutter with 3 teeth and a 6 mm diameter made of hard metal (VHM), as given in Figure 5.
The measuring of surface roughness was performed with a TALYSURF-6 measuring system (Figure 6) connected to a computer.

2.4. Experimental Setup

The parameters related to roughness are usually reliant on factors such as manufacturing conditions, depth of cut, cutting speed, feed, and machine tool used. For this particular study, the three primary variables chosen were the spindle speed (n), the feed rate (Vf), and the depth of cut (ap). Data from 48 experiments conducted on the machining of PLA material were collected and are presented in Table 1.

3. Results and Discussion

The following section compares and discusses the results obtained from the artificial neural network (ANN) and the multiple regression analysis (MRA).

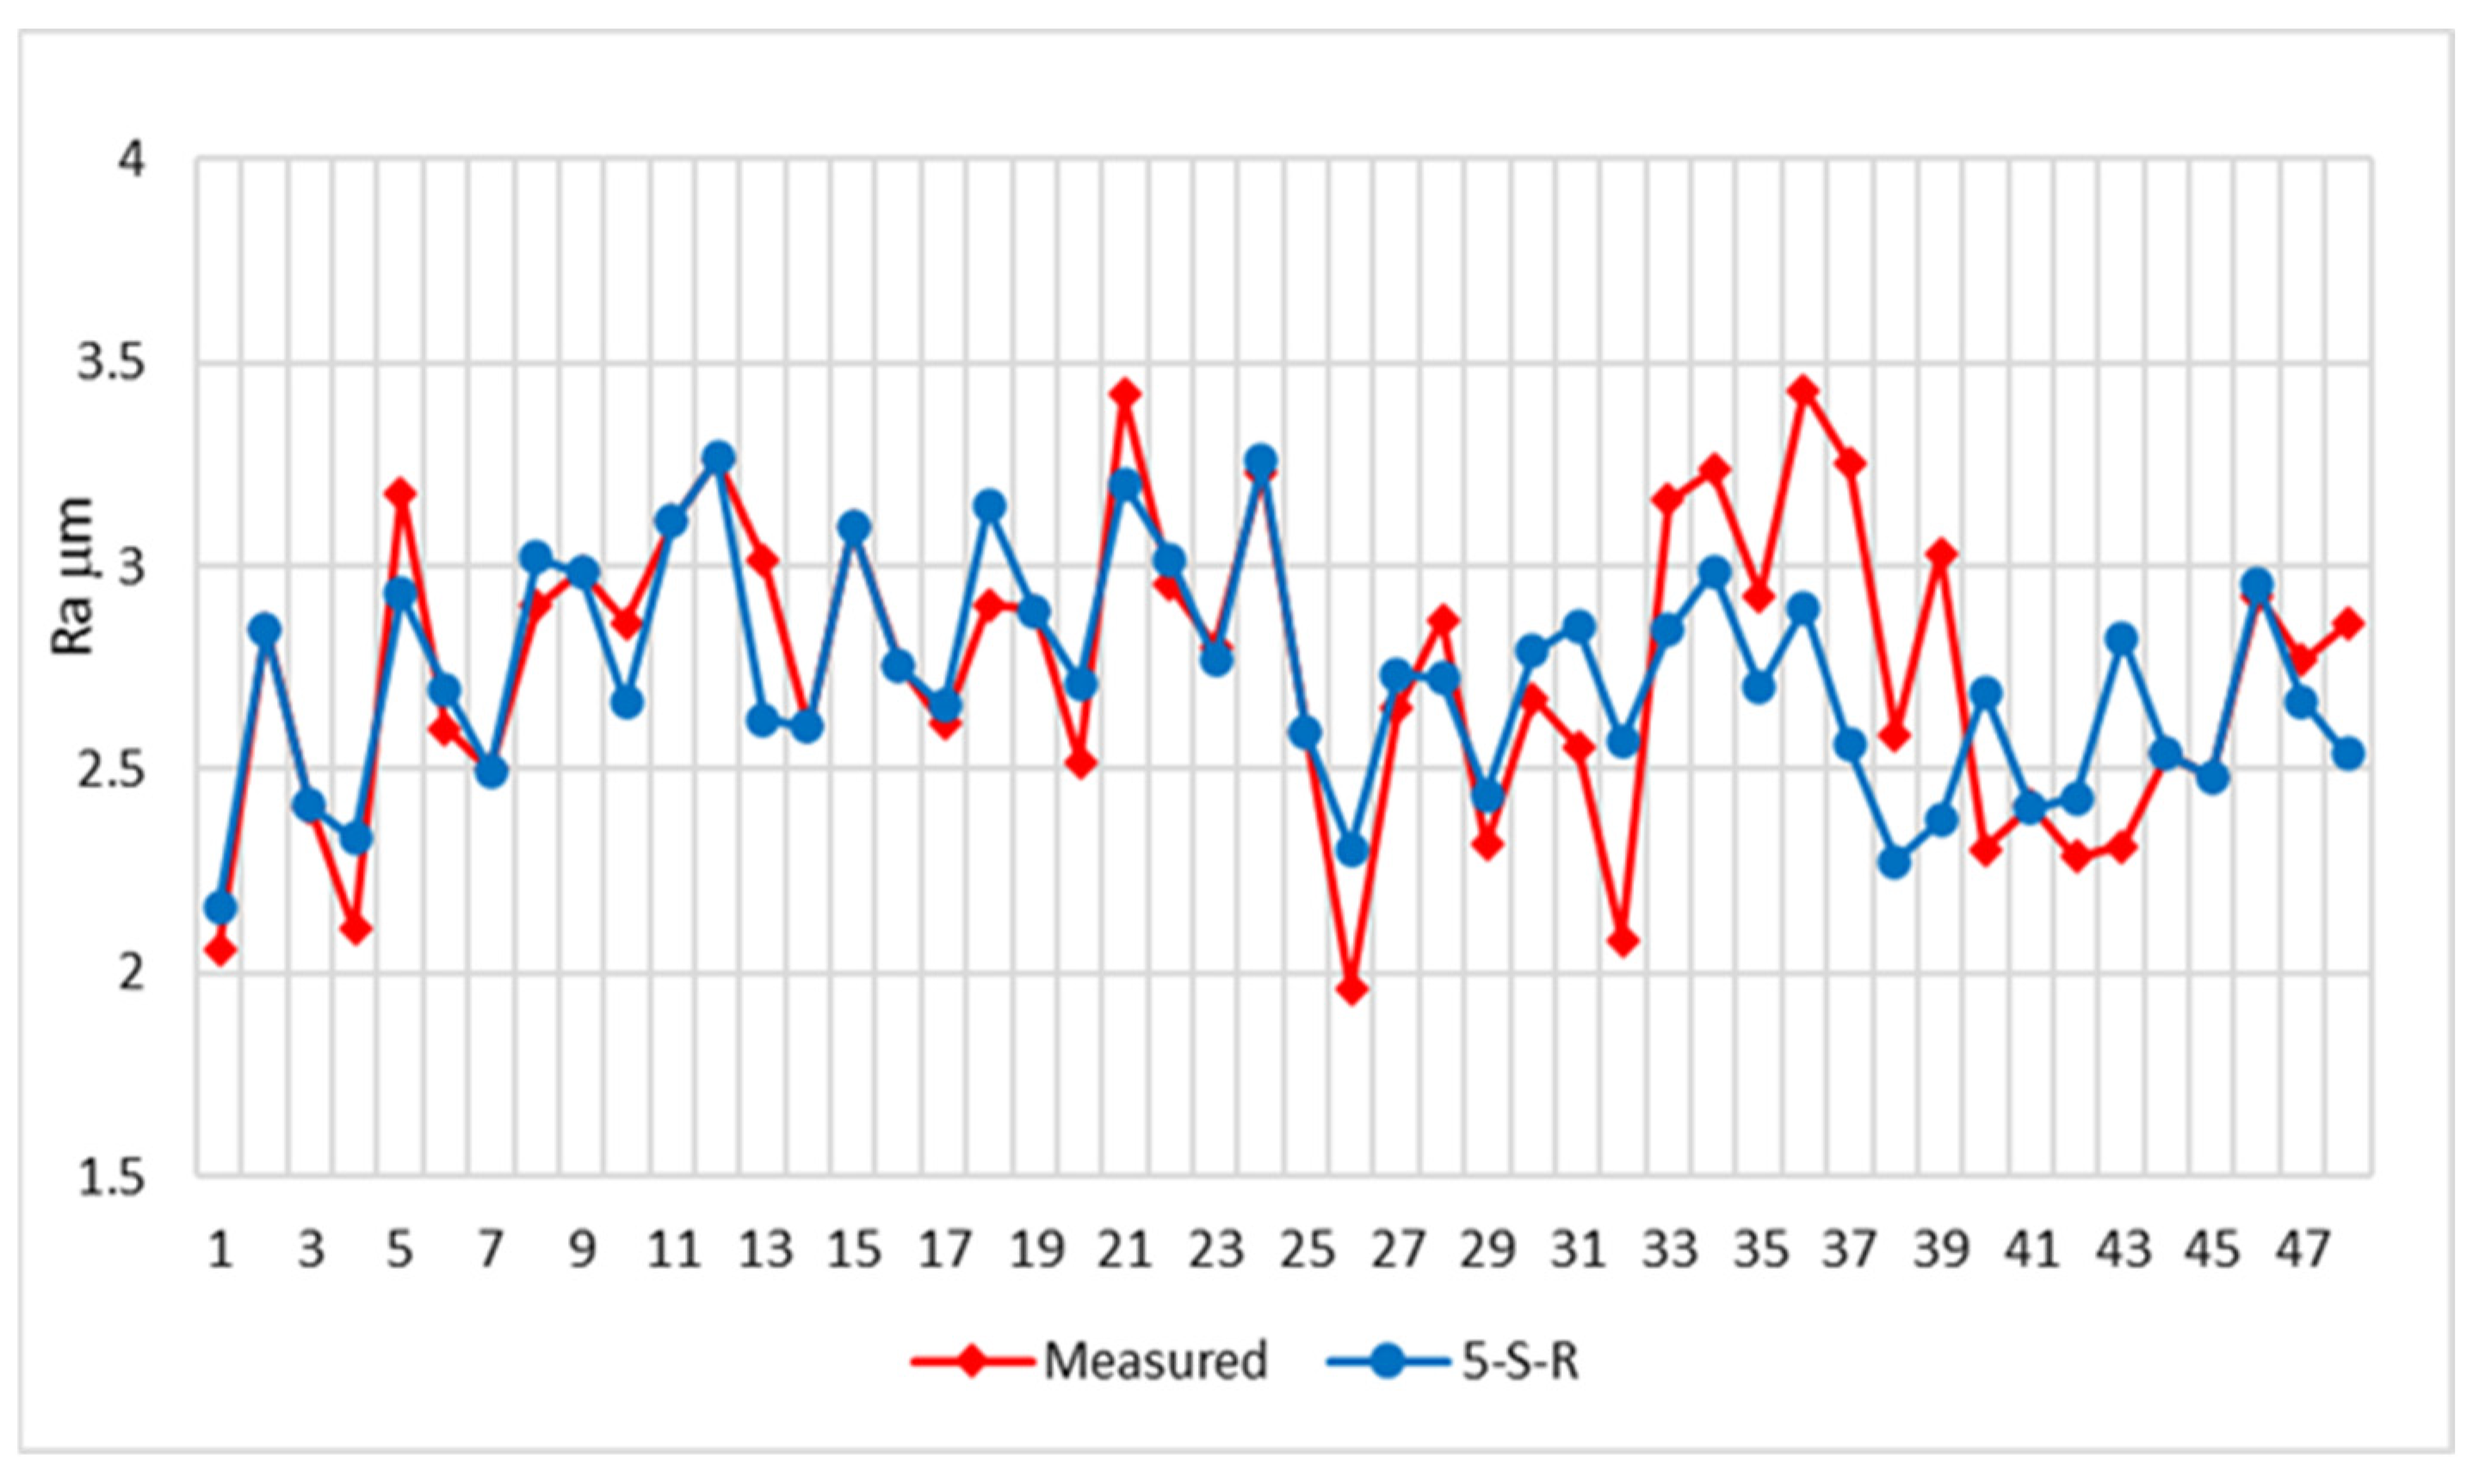
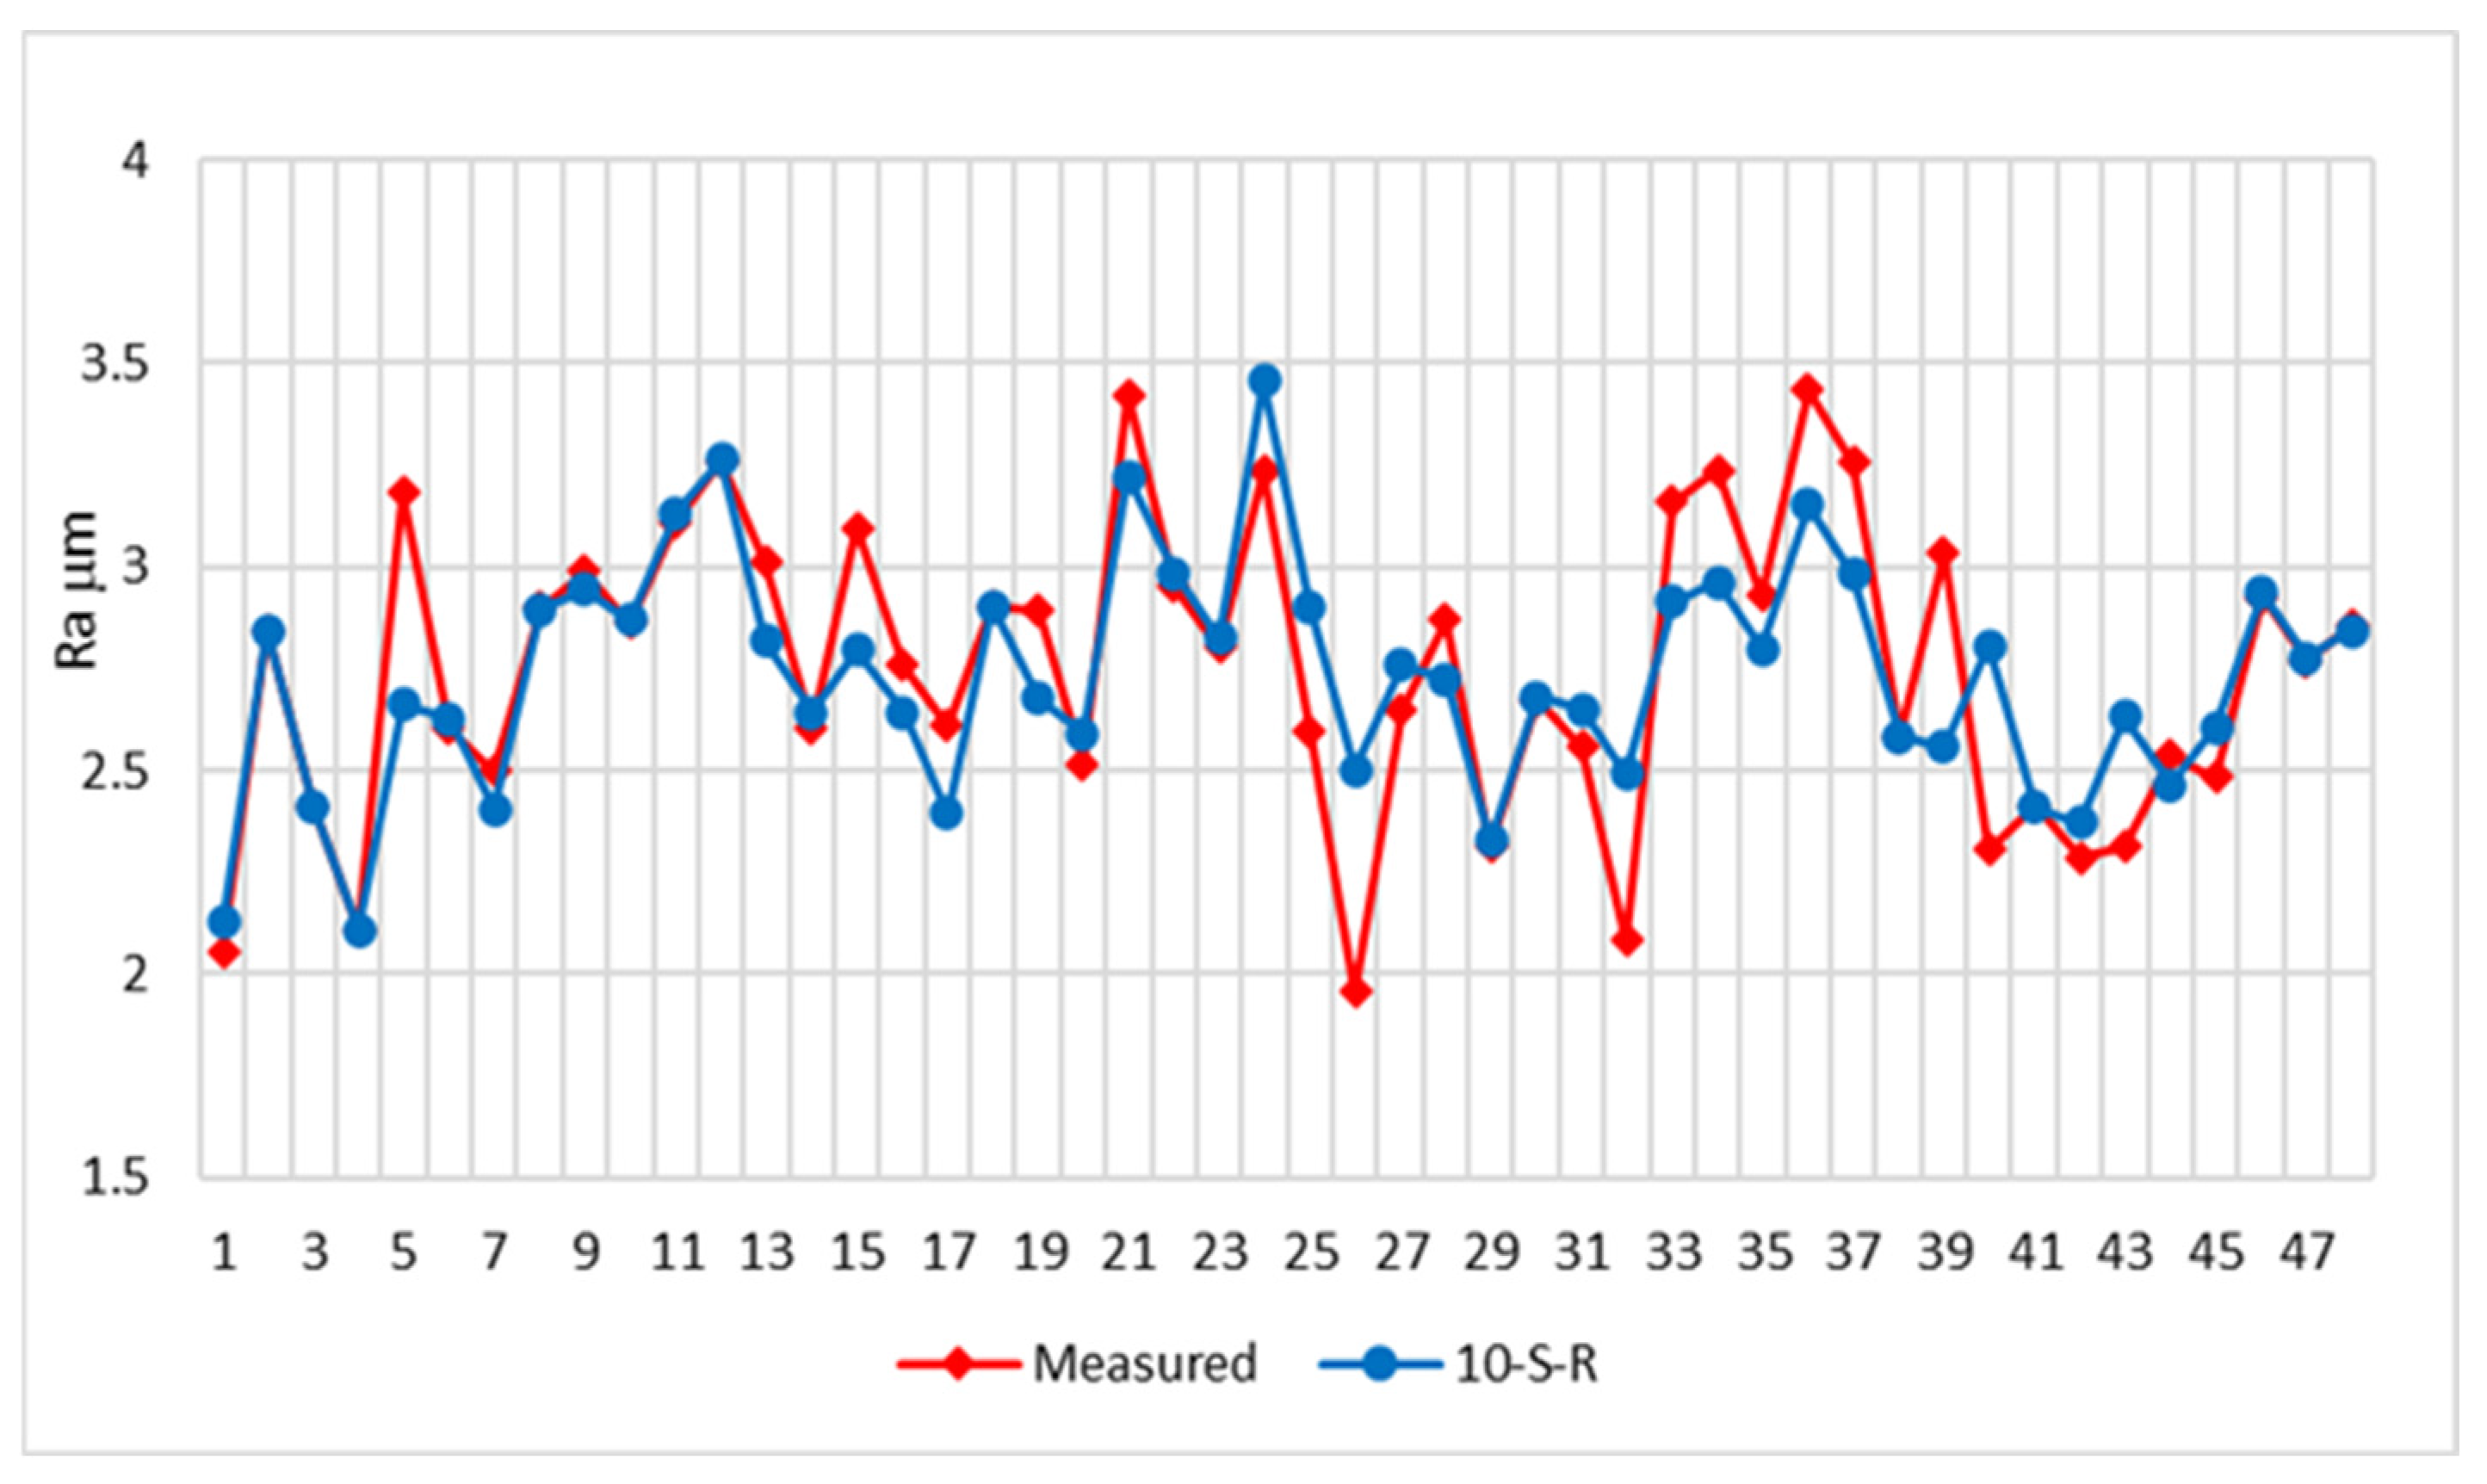
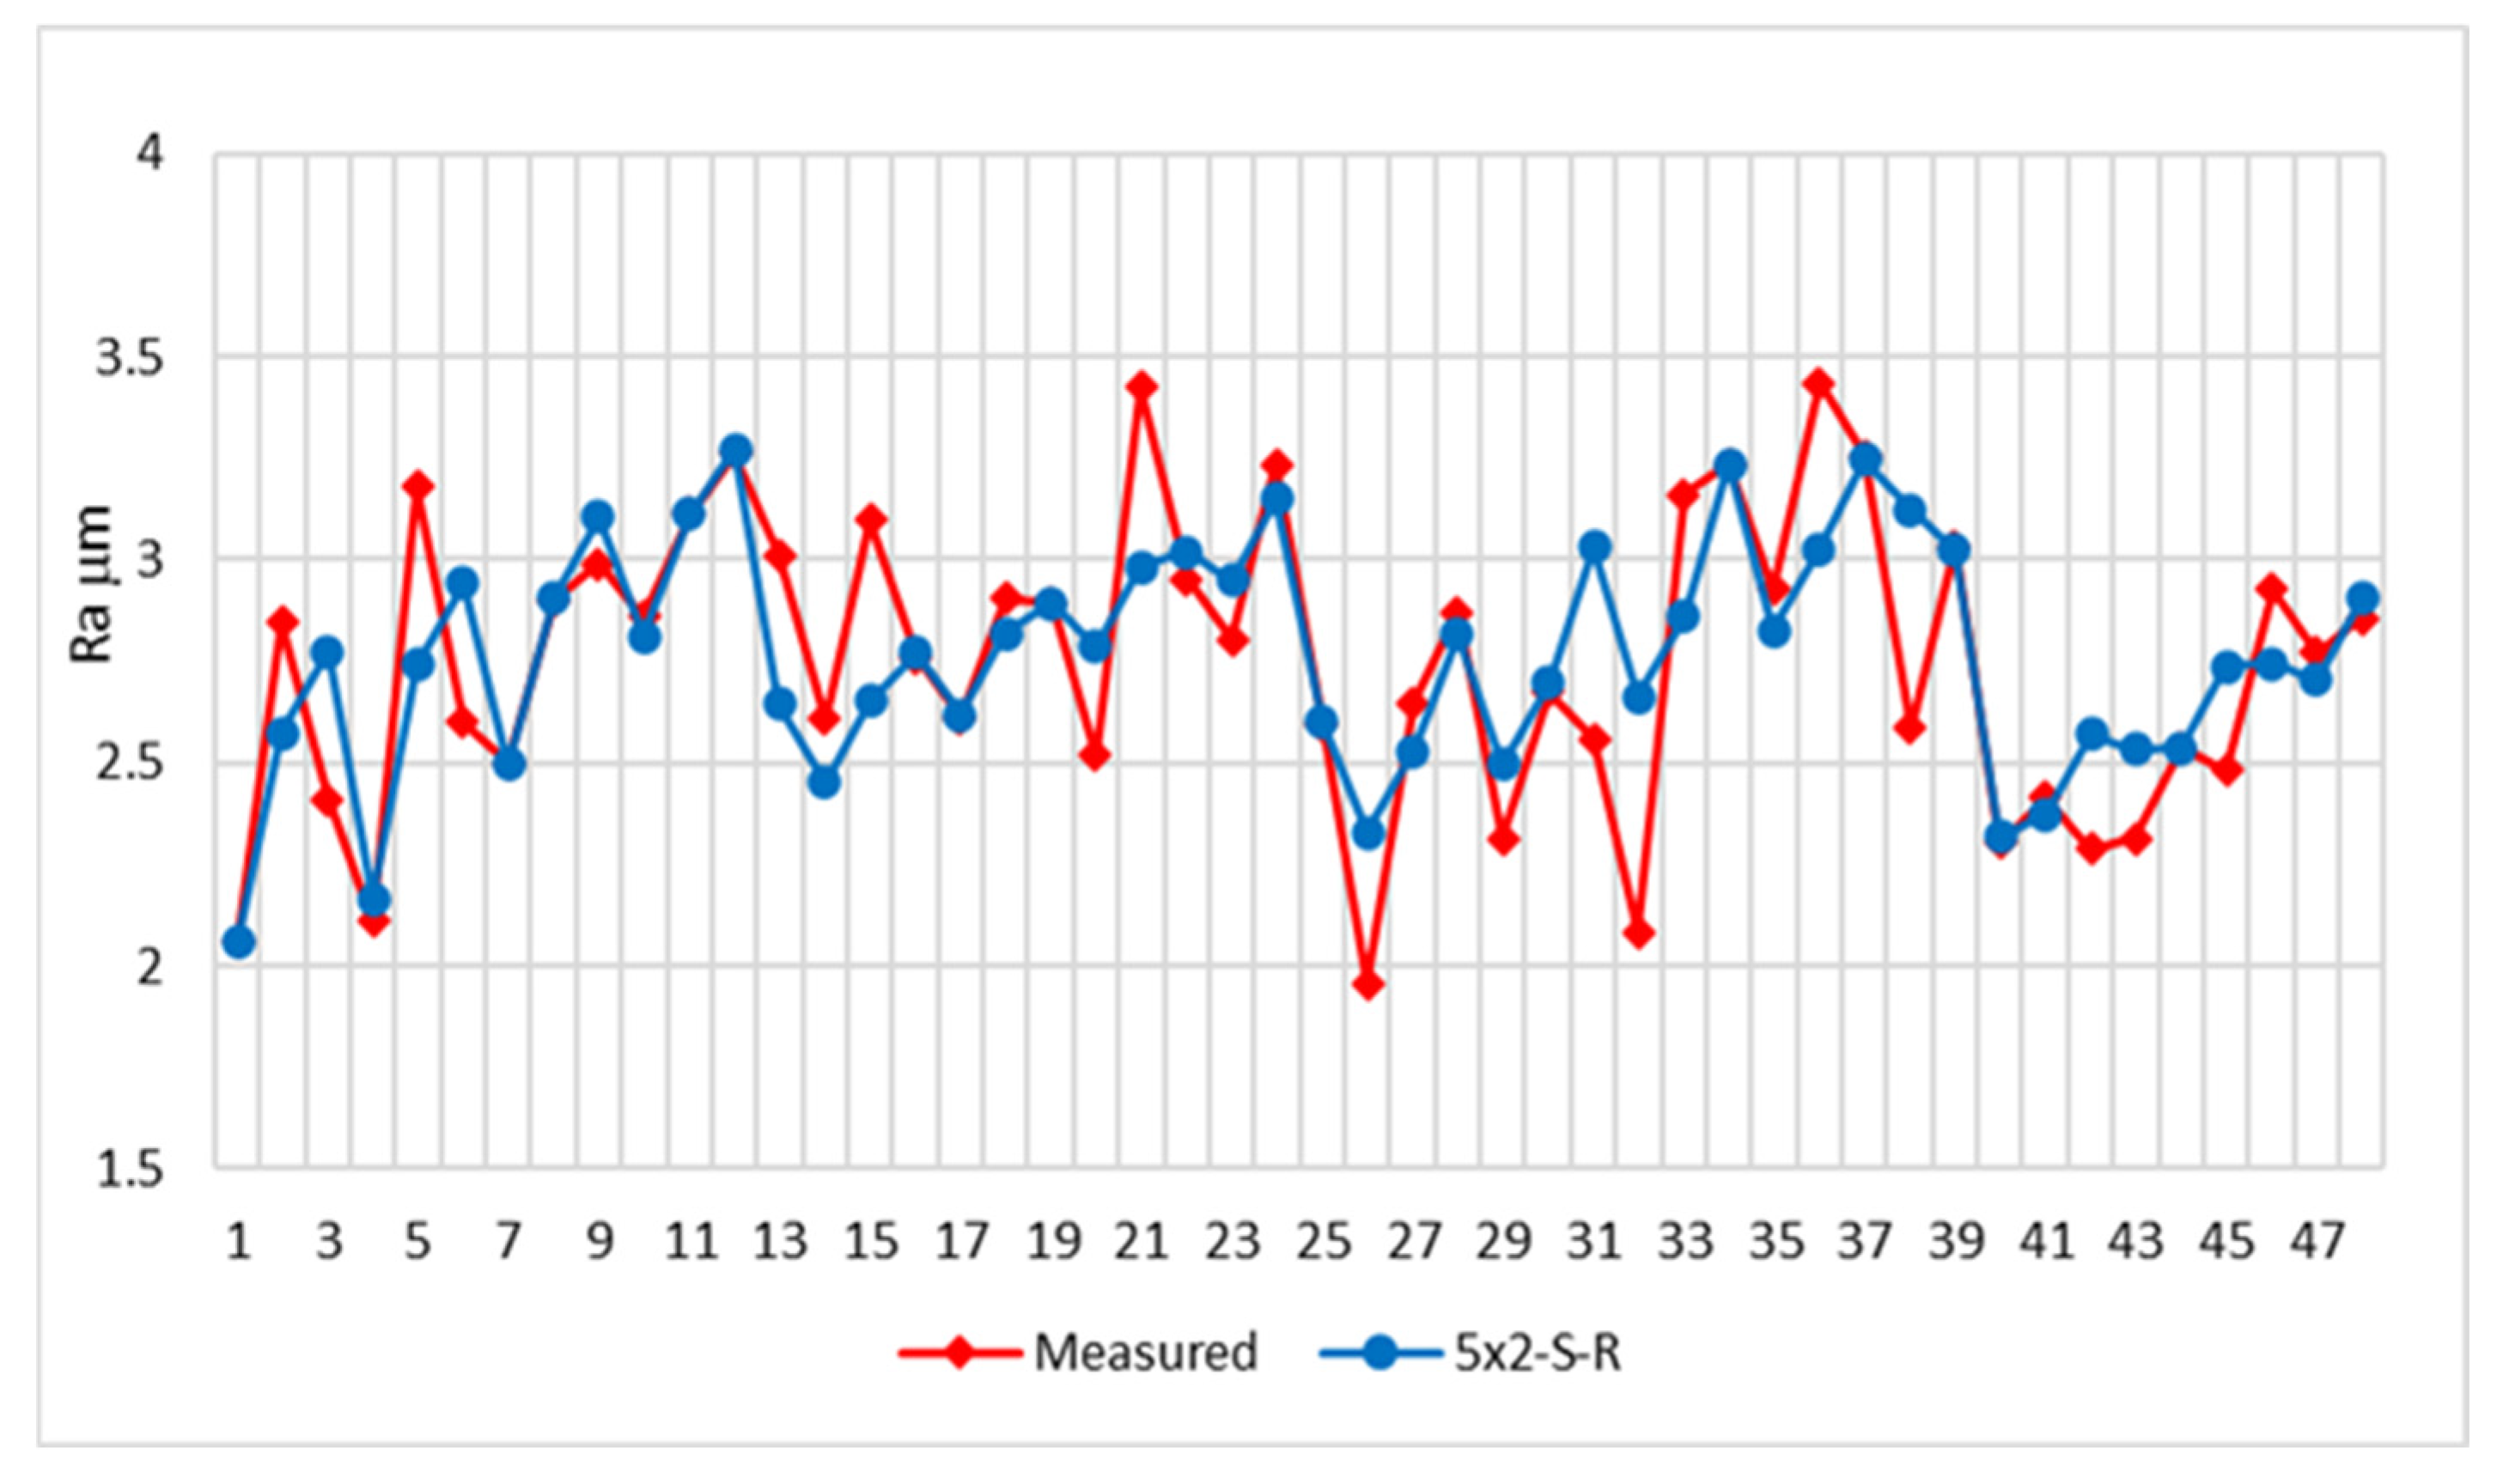
3.1. Artificial Neural Network Results

We utilized the parameters listed in Table 1 to construct predictive models using an ANN. Our model employed two activation functions, namely Tahn and ReLu, and five further different structures: 5-S-T, 5-S-R, 7-S-R, 10-S-R, and 5 × 2-S-R. The ANN structure learning parameters can be found in Table 2.
After the network was successfully trained, the coefficient of determination (R2) was used as a criterion for comparing results, as represented in Equation (5).
R 2 = 1 ( i   ( y i y ^ i ) 2 i   ( y ^ i ) 2 )
where y presents the measured (exact) value and y ^ presents the obtained values. The functions of activation in this study were ReLU and Tanh. The ANN model was developed using Python 3.10 and the backpropagation algorithm.

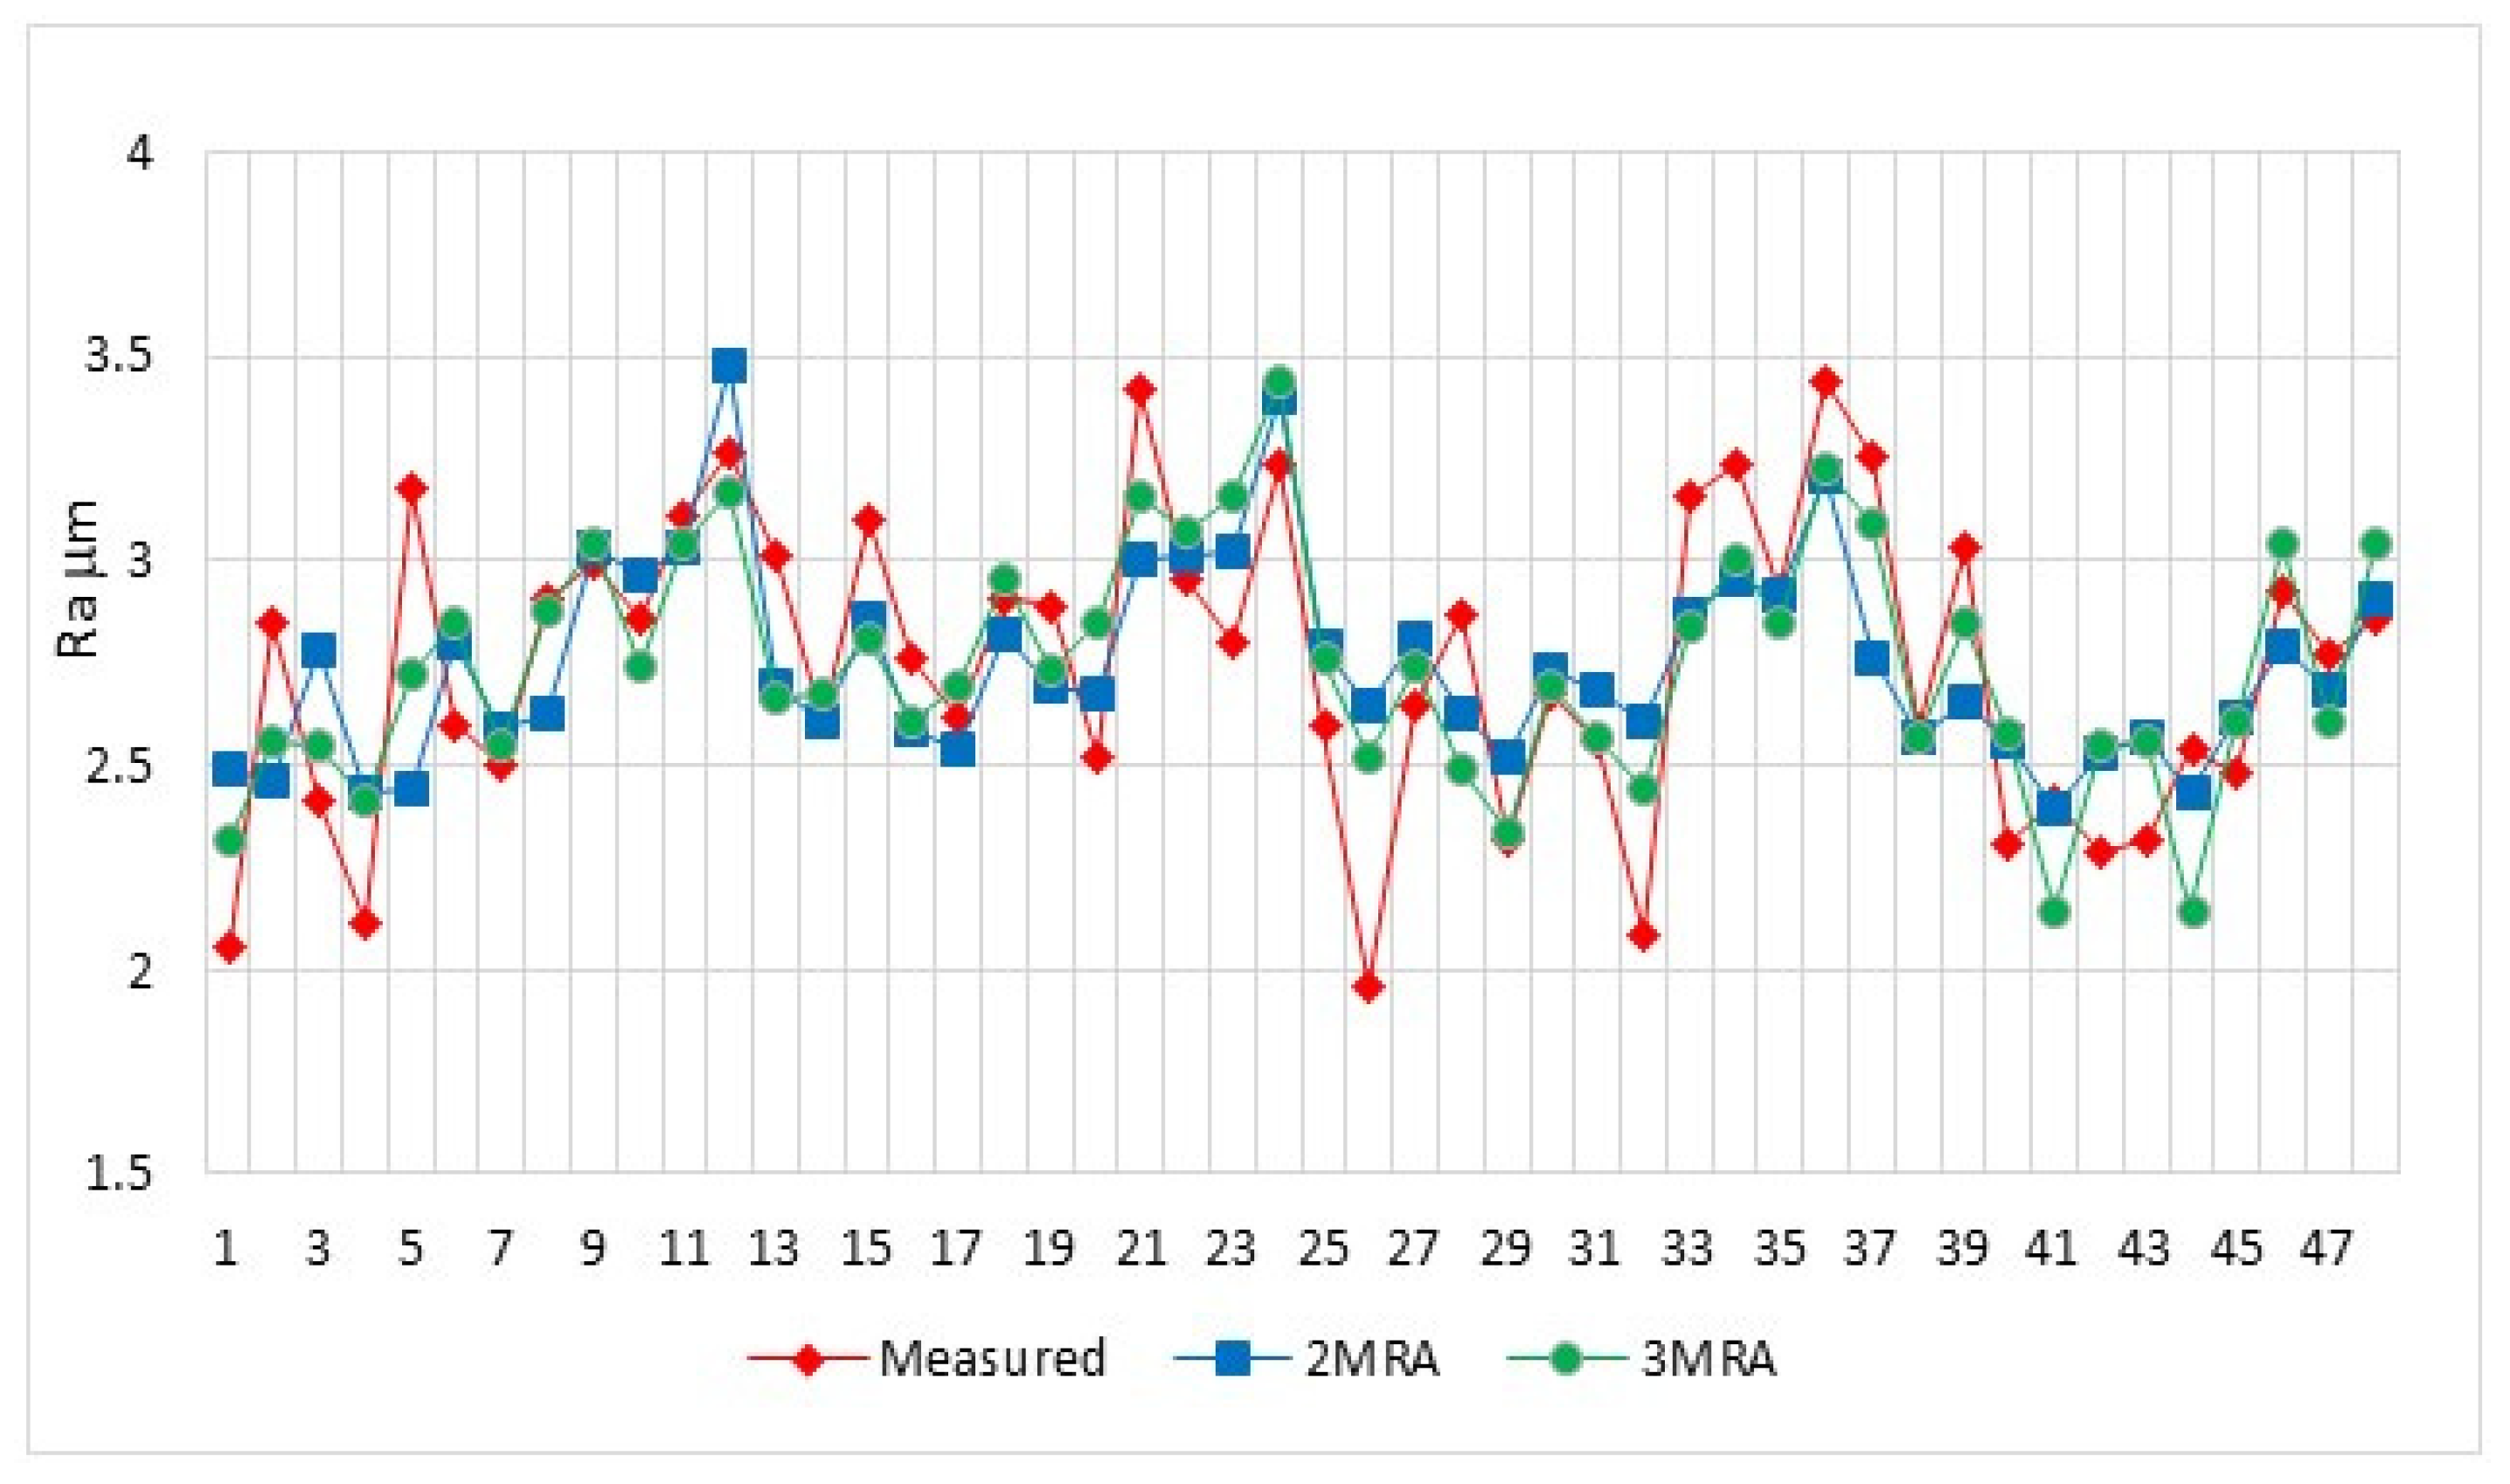
3.2. Multiple Regression Analysis Results

The multiple regression model was built using the data in Table 1. PYTHON-3.10 was used to estimate the coefficients for the second-order equation (Ө0, Ө1… Ө9) and the third-order equation (Ө0, Ө1… Ө19). Equation (6) provides the second-order model:
R a = 1.81033874 e + 00     7.51080270 e 04 2.34809595 e 03   8.87987412 e 01 5.58541667 e 08 2.49050000 e 07 1.89841216 e 04 2.65468750 e 06 5.38631757 e 04 1.27641369 e + 00 × [   1   n   V f   a p   n 2   n a p   V f 2 V f a p   a p 2   ]
And the third-order model is depicted by Equation (7):
R a = 4.50556984 e + 01 5.95991324 e 03 6.06482958 e 03 2.25539937 e + 02 1.06164454 e 06 1.82648851 e 06 1.75941348 e 03 5.35423846 e 06 3.16716023 e 03 3.91033080 e + 02 8.32361111 e 11 1.20458333 e 10 5.30152027 e 08 1.87937500 e 09 4.80608109 e 08 1.52943452 e 03 4.87847225 e 10 2.32538007 e 06 3.12053572 e 04 2.02741369 e + 02 × [   1   n   V f   a p   n 2   n V f   n a p   V f 2     V f a p   a p 2     n 3   n 2 V f   n 2 a p   n V f 2     n V f a p   n a p 2     V f 3     V f 2 a p   n a p 2     a p 2     ]

3.3. Obtained Evaluation

An investigation was conducted using an experimental design to study the impact of cutting parameters like spindle speed, feed rate, and depth of cut on surface roughness. Measurements were recorded after the completion of the milling operation. With the help of experimental data, both the ANN and MRA models were developed to forecast surface roughness. Table 3 shows the measured roughness values according to the values obtained by the ANN and MRA models. The RA-2 and RA-3 values are obtained using the MRA model (second and third order), while the values obtained by the ANN method are marked with a number indicating the number of neurons (5 and 10) and a letter for the (R) ReLU or (T) Tanh activation function. Moreover, 5 × 2 means two hidden layers with five neurons each.
From Table 3, it can be observed that the maximum roughness (3.435) was achieved at cutting parameters of n = 5000 rev/min, Vf = 1000 mm/min, and ap = 1 mm. The best surface quality (Ra = 1.958 µm) was achieved at 5000 rev/min, 400 mm/min, and 0.6 mm.
Figure 7, Figure 8, Figure 9 and Figure 10 show compared diagrams of the measured and predicted values of Ra using the ANN model.
From Figure 7 and Table 3, it can be seen that the 5-S-R model predicted the highest roughness in the case of a speed of 3000 rev/min, feed rate of 1000 mm/min, and a depth of cut of 1 mm. The lowest roughness, i.e., the best surface quality after machining, was predicted with 3000 rev/min, 400 mm/min, and 0.3 mm.
Model 10-S-R (Figure 8) predicted the highest roughness (3.277 µm) in the case of a speed of 4000 rev/min, a step of 1000 mm/min, and a depth of cut of 1 mm. The lowest roughness (2.318 µm) was predicted with 3000 rev/min, 400 mm/min and 0.3 mm.
The 5-S-T model (Figure 9) predicted the highest roughness (3.336 µm) in the case of a speed of 4000 rev/min, a step of 1000 mm/min, and a depth of cut of 1 mm. The lowest roughness (2.056 µm) was predicted with 3000 rev/min, 400 mm/min, and 0.3 mm.
The 5 × 2-S-R model (Figure 10) predicted the highest roughness (3.272 µm) in the case of a speed of 3000 rev/min, a step of 1000 mm/min, and a depth of cut of 1 mm. The lowest roughness (2.056 µm) was predicted with 3000 rev/min, 400 mm/min, and 0.3 mm.
Figure 11 shows comparison diagrams of the measured Ra values and predicted values for the MRA models. The RA-2 model predicted the highest roughness (3.478 µm) in the case of a speed of 3000 rev/min, a step of 1000 mm/min, and a depth of cut of 1 mm. The lowest roughness (2394 µm), i.e., the best surface quality after machining, was predicted with 6000 rev/min, 600 mm/min, and 0.6 mm. The RA-3 model had the highest roughness (3434 µm) in the case of 4000 rev/min, 1000 mm/min, and 1 mm. The lowest roughness (2140 µm), i.e., the best surface quality after machining, was predicted with 6000 rev/min, 600 mm/min, and 0.6 mm.
The highest degree of correlation was achieved by the 5-S-R model, followed by 10-S-R, 5 × 2-S-R, and 5-S-T, while models RA-3 and RA-2 achieved a lower correlation. Figure 12 represents the tabular relationship of the determination coefficient R2 for all prediction models.

4. Conclusions

This paper presents procedures for generating surface roughness prediction models in a hybrid manufacturing process using MRA and an ANN. After the FDM 3D printing process, the part was machined with a milling operation in order to enhance the surface quality, varying the spindle speed, feed rate, and depth of cut 48 times. After the analysis, the following can be concluded:
  • ANN and MRA modeling can effectively predict surface roughness, with the ANN outperforming MRA. Models with more input parameters (48 in this case) produce better predictions than those with fewer parameters (27 in previous research).
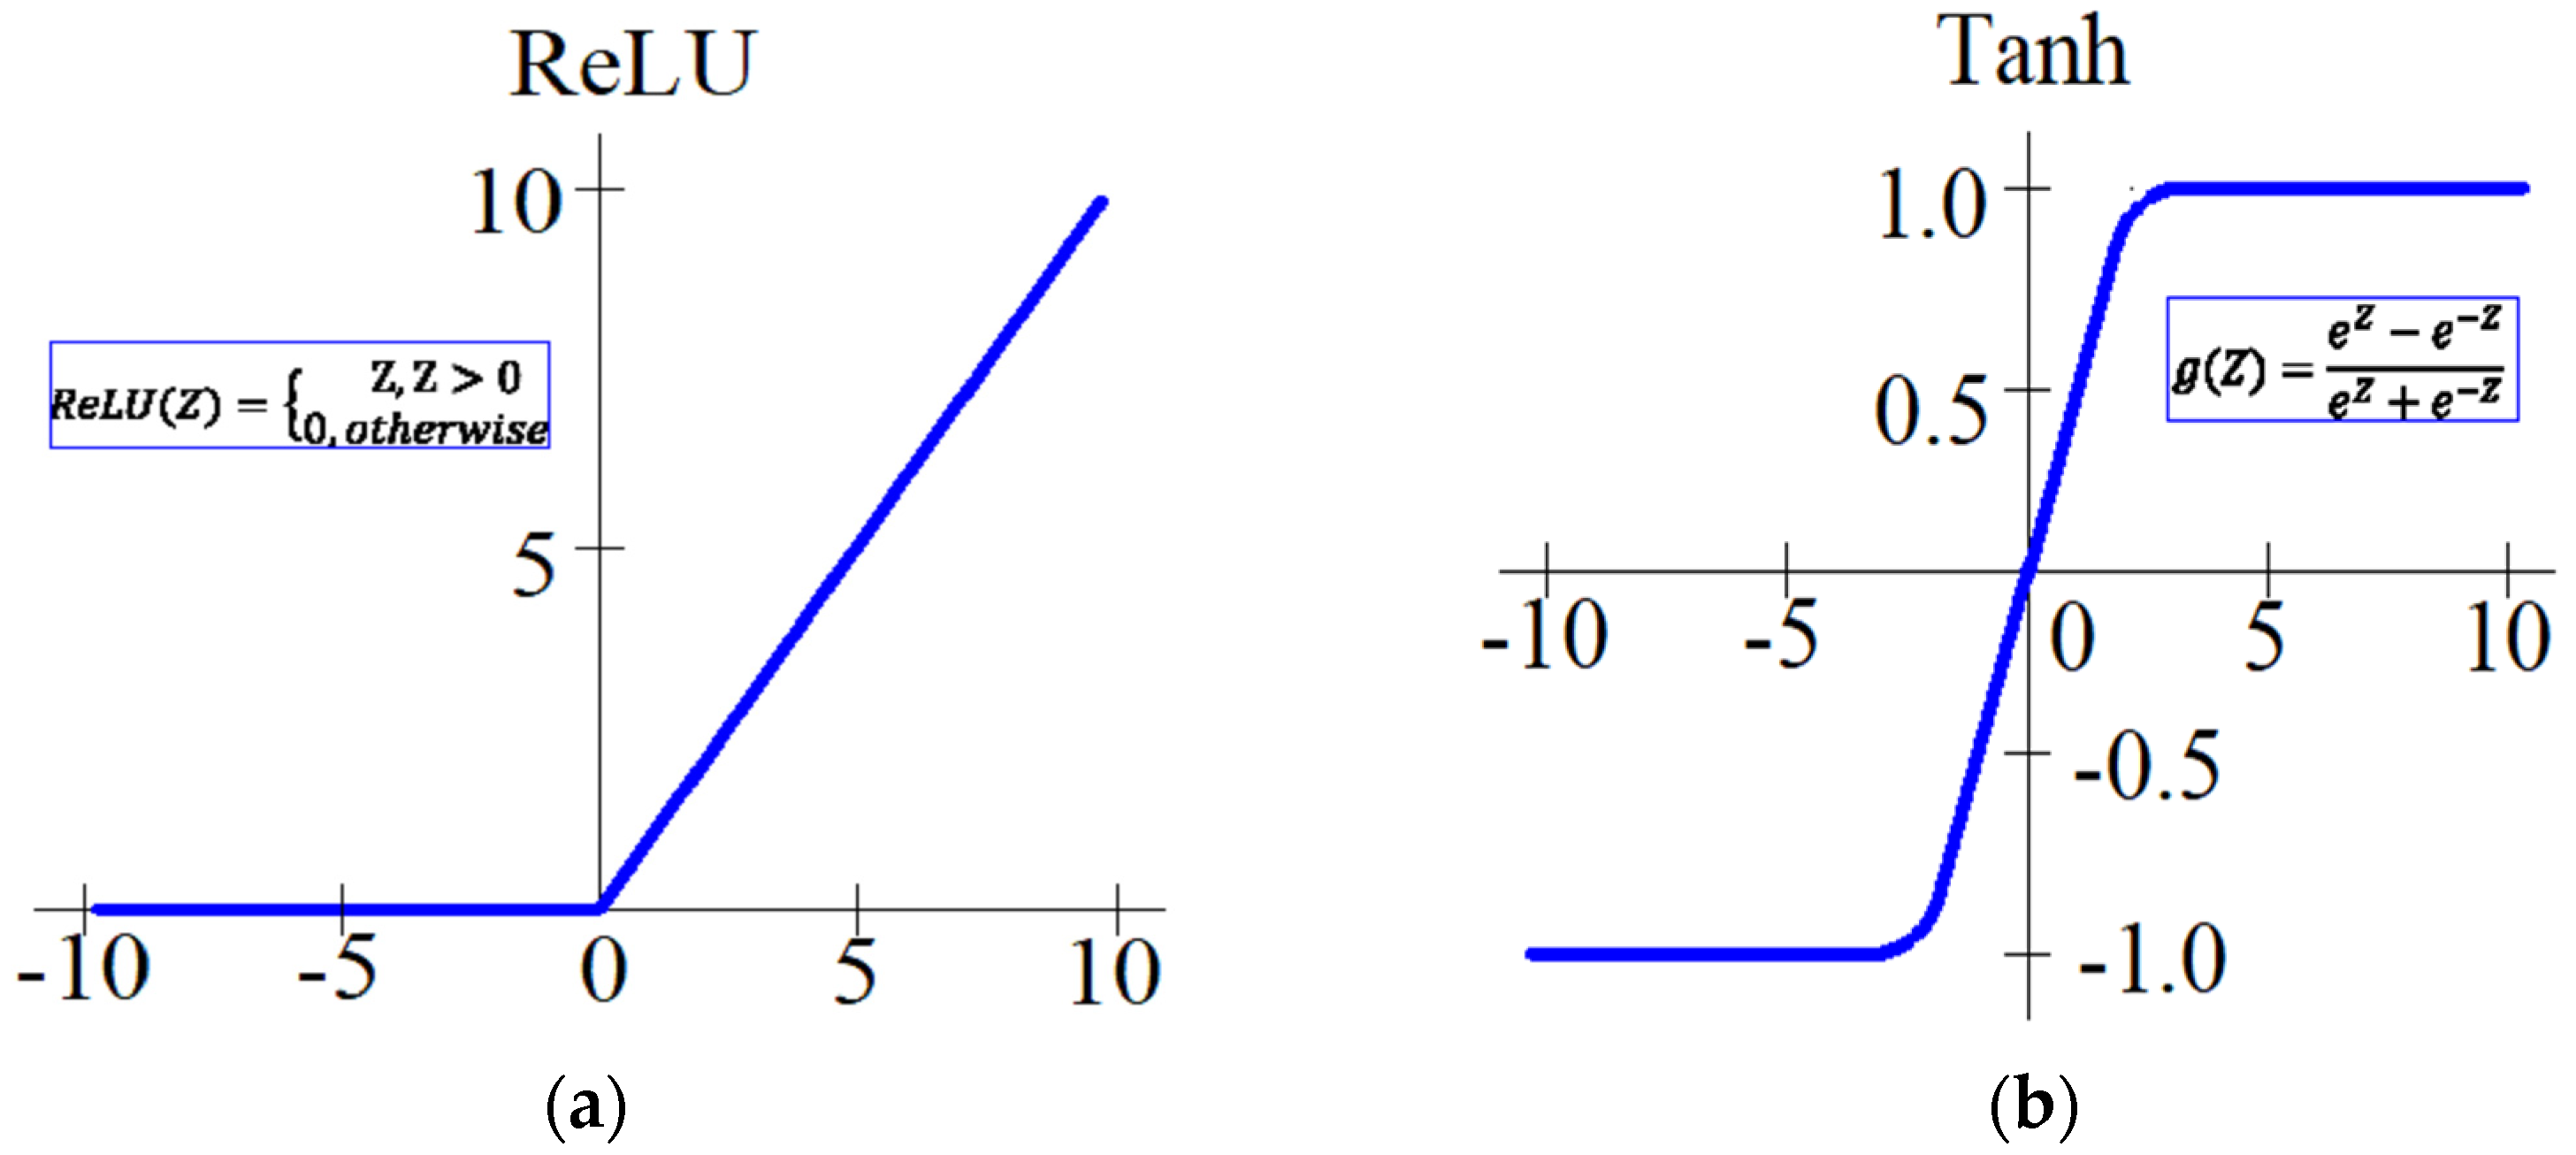
  • The ANN model that used the RuLU activation function gave better predictions than the model with the tanh activation function.
  • ANN models with smaller numbers of neurons and hidden layers give better predictions for a small number of training parameters due to a complicated network of neurons. The ANN network itself has too many parameters in relation to the number of training examples.
  • The best measured surface roughness was 1.958 μm. In the case of MRA, this was measured at 2.372 μm and calculated at 2.14 μm, while with the ANN, it was measured at 2.058 μm and calculated at 2.056 μm.
  • All ANN models predict a high surface quality at a speed of 3000 or 1000 rev/min, a feed rate of 400 mm/min, and a cutting depth of 0.3 mm.
  • The highest degree of correlation (determination coefficient) R2 = 0.9771 was achieved by the ANN 5-S-R model, while MRA methods gave a smaller correlation.
ANNs are a powerful tool with complicated networks of neurons. So, for a more accurate prediction of the quality of the surface and a more accurate model, it is necessary to increase the number of input parameters. This would unify the research results so far and involve creating the largest database possible.

Author Contributions

Conceptualization, S.D. and D.L.; methodology, S.D.; software, B.Ć.; validation, M.M., D.L. and M.I.; formal analysis, B.S.; investigation, S.D.; resources, M.M.; data curation, M.I.; writing—original draft preparation, M.I.; writing—review and editing, A.A.; visualization, M.P.; supervision, D.L.; project administration, M.P.; funding acquisition, B.Ć. All authors have read and agreed to the published version of the manuscript.

Funding

This research received no external funding.

Institutional Review Board Statement

Not applicable.

Informed Consent Statement

Not applicable.

Data Availability Statement

The original contributions presented in the study are included in the article; further inquiries can be directed to the corresponding author.

Conflicts of Interest

The authors declare no conflicts of interest.

References

  1. Zhou, H.; Cheng, X.; Jiang, X.; Zheng, G.; Zhang, J.; Li, Y.; Tang, M.; Lv, F. Green Manufacturing-Oriented Polyetheretherketone Additive Manufacturing and Dry Milling Post-Processing Process Research. Processes 2022, 10, 2561. [Google Scholar] [CrossRef]
  2. Khorasani, A.M.; Yazdi, M.R.S.; Safizadeh, M.S. Analysis of machining parameters effects on surface roughness: A review. Int. J. Comput. Mater. Sci. Surf. Eng. 2012, 5, 68–84. [Google Scholar] [CrossRef]
  3. Lu, C. Study on prediction of surface quality in machining process. J. Mater. Process. Technol. 2008, 205, 439–450. [Google Scholar] [CrossRef]
  4. Huynh, V.M.; Fan, Y. Surface-texture measurement and characterisation with applications to machine-tool monitoring. Int. J. Adv. Manuf. Technol. 1992, 7, 2–10. [Google Scholar] [CrossRef]
  5. Van Luttervelt, C.A.; Childs, T.H.C.; Jawahir, I.S.; Klocke, F.; Venuvinod, P.K.; Altintas, Y.; Sato, H. Present situation and future trends in modelling of machining operations progress report of the CIRP Working Group ‘Modelling of Machining Operations’. CIRP Ann. 1998, 47, 587–626. [Google Scholar] [CrossRef]
  6. Dastres, R.; Soori, M. Artificial neural network systems. Int. J. Imaging Robot. 2021, 21, 13–25. [Google Scholar]
  7. Abdul Shukor, J.; Said, S.; Harun, R.; Husin, S.; Kadir, A. Optimising of machining parameters of plastic material using Taguchi method. Adv. Mater. Process. Technol. 2016, 2, 50–56. [Google Scholar] [CrossRef]
  8. Saad, M.S.; Mohd Nor, A.; Abd Rahim, I.; Syahruddin, M.A.; Mat Darus, I.Z. Optimization of FDM process parameters to minimize surface roughness with integrated artificial neural network model and symbiotic organism search. Neural Comput. Appl. 2022, 34, 17423–17439. [Google Scholar] [CrossRef]
  9. Boschetto, A.; Giordano, V.; Veniali, F. Surface roughness prediction in fused deposition modelling by neural networks. Int. J. Adv. Manuf. Technol. 2013, 67, 2727–2742. [Google Scholar] [CrossRef]
  10. García Plaza, E.; Núñez López, P.J.; Caminero Torija, M.Á.; Chacón Muñoz, J.M. Analysis of PLA Geometric Properties Processed by FFF Additive Manufacturing: Effects of Process Parameters and Plate-Extruder Precision Motion. Polymers 2019, 11, 1581. [Google Scholar] [CrossRef]
  11. Lyu, J.; Manoochehri, S. Dimensional prediction for FDM machines using artificial neural network and support vector regression. In Proceedings of the ASME 2019 International Design Engineering Technical Conferences and Computers and Information in Engineering Conference, Anaheim, CA, USA, 18–21 August 2019; American Society of Mechanical Engineers: New York, NY, USA, 2019. V001T02A033. [Google Scholar]
  12. Nagarajan, H.P.; Mokhtarian, H.; Jafarian, H.; Dimassi, S.; Bakrani-Balani, S.; Hamedi, A.; Haapala, K.R. Knowledge-based design of artificial neural network topology for additive manufacturing process modeling: A new approach and case study for fused deposition modeling. J. Mech. Des. 2019, 141, 021705. [Google Scholar] [CrossRef]
  13. Kandananond, K. Surface roughness prediction of FFF-fabricated workpieces by artificial neural network and Box–Behnken method. Int. J. Metrol. Qual. Eng. 2021, 12, 17. [Google Scholar] [CrossRef]
  14. Benardos, P.G.; Vosniakos, G.C. Prediction of surface roughness in CNC face milling using neural networks and Taguchi’s design of experiments. Robot. Comput.-Integr. Manuf. 2002, 18, 343–354. [Google Scholar] [CrossRef]
  15. Beatrice, B.A.; Kirubakaran, E.; Thangaiah, P.R.J.; Wins, K.L.D. Surface roughness prediction using artificial neural network in hard turning of AISI H13 steel with minimal cutting fluid application. Procedia Eng. 2014, 97, 205–211. [Google Scholar] [CrossRef]
  16. Nalbant, M.; Gokkaya, H.; Toktaş, İ. Comparison of regression and artificial neural network models for surface roughness prediction with the cutting parameters in CNC turning. Model. Simul. Eng. 2007, 2007, 092717. [Google Scholar] [CrossRef]
  17. Hussein, H.K.; Shareef, I.R.; Zayer, I.A. Comparative Prediction and Modelling of Surface Roughness in Milling of AL-7075 Using Regression Analysis and Neural Network. Math. Model. Eng. Probl. 2022, 9, 186. [Google Scholar] [CrossRef]
  18. Meral, G.; Dilipak, H.; Sarikaya, M. Modeling with Regression Methods of the Thrust Forces and the Surface Roughness in the Drilling of AISI 1050 Materials. Turk. Sci. Res. Found. 2011, 4, 31–41. [Google Scholar]
  19. Asiltürk, I.; Çunkaş, M. Modeling and prediction of surface roughness in turning operations using artificial neural network and multiple regression method. Expert Syst. Appl. 2011, 38, 5826–5832. [Google Scholar] [CrossRef]
  20. Lin, Y.-C.; Wu, K.-D.; Shih, W.-C.; Hsu, P.-K.; Hung, J.-P. Prediction of Surface Roughness Based on Cutting Parameters and Machining Vibration in End Milling Using Regression Method and Artificial Neural Network. Appl. Sci. 2020, 10, 3941. [Google Scholar] [CrossRef]
  21. Yilmaz, S.; Arici, A.A.; Feyzullahoglu, E. Surface roughness prediction in machining of cast polyamide using neural network. Neural Comput. Appl. 2011, 20, 1249–1254. [Google Scholar] [CrossRef]
  22. Tsai, Y.-H.; Chen, J.C.; Lou, S.-J. An in-process surface recognition system based on neural networks in end milling cutting operations. Int. J. Mach. Tools Manuf. 1999, 39, 583–605. [Google Scholar] [CrossRef]
  23. Zain, A.M.; Haron, H.; Sharif, S. Prediction of surface roughness in the end milling machining using Artificial Neural Network. Expert Syst. Appl. 2010, 37, 1755–1768. [Google Scholar] [CrossRef]
  24. Shie, J.R. Optimization of dry machining parameters for high-purity graphite in end-milling process by artificial neural networks: A case study. Mater. Manuf. Process. 2006, 21, 838–845. [Google Scholar] [CrossRef]
  25. Jafarian, F.; Taghipour, M.; Amirabadi, H. Application of artificial neural network and optimization algorithms for optimizing surface roughness, tool life and cutting forces in turning operation. J. Mech. Sci. Technol. 2013, 27, 1469–1477. [Google Scholar] [CrossRef]
  26. Kosarac, A.; Mladjenovic, C.; Zeljkovic, M.; Tabakovic, S.; Knezev, M. Neural-Network-Based Approaches for Optimization of Machining Parameters Using Small Dataset. Materials 2022, 15, 700. [Google Scholar] [CrossRef]
  27. Yanis, M.; Mohruni, A.S.; Sharif, S.; Yani, I.; Arifin, A.; Khona’Ah, B. Application of RSM and ANN in predicting surface roughness for side milling process under environmentally friendly cutting fluid. J. Phys. Conf. Ser. 2019, 1198, 042016. [Google Scholar] [CrossRef]
  28. Karayel, D. Prediction and control of surface roughness in CNC lathe using artificial neural network. J. Mater. Process. Technol. 2009, 209, 3125–3137. [Google Scholar] [CrossRef]
  29. Dhokia, V.G.; Kumar, S.; Vichare, P.; Newman, S.T.; Allen, R.D. Surface roughness prediction model for CNC machining of polypropylene. Proc. Inst. Mech. Eng. Part B J. Eng. Manuf. 2008, 222, 137–157. [Google Scholar] [CrossRef]
  30. Pămărac, R.G.; Petruse, R.E. Study regarding the optimal milling parameters for finishing 3D printed parts from ABS and PLA materials. Acta Univ. Cibiniensis Tech. Ser. 2018, 70, 66–72. [Google Scholar] [CrossRef]
  31. Amanullah, A.N.M.; Saleh, T.; Khan, R. Design and development of a hybrid machine combining rapid prototyping and CNC milling operation. Procedia Eng. 2017, 184, 163–170. [Google Scholar] [CrossRef]
  32. Grguraš, D.; Kramar, D. Optimization of hybrid manufacturing for surface quality, material consumption and productivity improvement. Stroj. Vestn.-J. Mech. Eng. 2017, 63, 567–576. [Google Scholar] [CrossRef]
  33. Li, L.; Haghighi, A.; Yang, Y. Theoretical modelling and prediction of surface roughness for hybrid additive–subtractive manufacturing processes. IISE Trans. 2019, 51, 124–135. [Google Scholar] [CrossRef]
  34. Abbasbhai, K.T.; Vijay, C.N.; Sourabh, J. Evaluation of Artificial Neural Networks. Int. J. Eng. 2012, 1, 1–8. [Google Scholar]
  35. Nigrin, A. Neural Networks for Pattern Recognition; MIT Press: Cambridge, MA, USA, 1993. [Google Scholar]
  36. Nielsen, F. Neural Networks Algorithms and Applications; Niels Brock Business College: Copenhagen, Denmark, 2001; Volume 12. [Google Scholar]
  37. Lahiri, S.K.; Ghanta, K.C. Development of an artificial neural network correlation for prediction of hold-up of slurry transport in pipelines. Chem. Eng. Sci. 2008, 63, 1497–1509. [Google Scholar] [CrossRef]
  38. Djurović, S.; Stanojković, J.; Lazarević, D.; Ćirković, B.; Lazarvić, A.; Džunić, D.; Šarkoćević, Ž. Modeling and Prediction of Surface Roughness in the End Milling Process using Multiple Regression Analysis and Artificial Neural Network. Tribol. Ind. 2022, 44, 540–549. [Google Scholar] [CrossRef]
  39. Sharma, S.; Sharma, S.; Athaiya, A. Activation functions in neural networks. Towards Data Sci. 2017, 6, 310–316. [Google Scholar] [CrossRef]
  40. Multiple Regression Explanation, Assumptions, Interpretation, and Write Up. Available online: https://usq.pressbooks.pub/statisticsforresearchstudents/chapter/multiple-regression-assumptions/ (accessed on 6 March 2024).
  41. Reddy, B.S.; Padmanabhan, G.; Reddy, K.V.K. Surface roughness prediction tehniques for CNC turning. Asian J. Sci. Res. 2008, 1, 256–264. [Google Scholar] [CrossRef]
Figure 2. Activation functions: (a) ReLU activation function; (b) tanh activation function.
Applsci 14 05980 g002
Figure 3. Workpiece: (a) CAD software; (b) Ultimaker Cura software.
Applsci 14 05980 g003aApplsci 14 05980 g003b
Figure 4. HAAS VF-3SS milling machine.
Applsci 14 05980 g004
Figure 5. Spindle cutter.
Applsci 14 05980 g005
Figure 6. Talysurf-6 measuring system.
Applsci 14 05980 g006
Figure 7. Comparison of predicted and measured results of Ra with 5-S-R model.
Applsci 14 05980 g007
Figure 8. Comparison of predicted and measured results of Ra with 10-S-R model.
Applsci 14 05980 g008
Figure 9. Comparison of predicted and measured results of Ra with 5-S-T model.
Applsci 14 05980 g009
Figure 10. Comparison of predicted and measured results of Ra with 5 × 2-S-R model.
Applsci 14 05980 g010
Figure 11. Comparison of predicted and measured results of Ra for RA-2 and RA-3 MRA models.
Applsci 14 05980 g011
Figure 12. Accuracy values (R2) of ANN and MRA models.
Applsci 14 05980 g012
Table 1. Experimental data for model construction.
Test No.n, [rev/min]Vf, [mm/min]ap, [mm]Ra, [μm]
130004000.32.058
230004000.62.845
3300040012.41
430006000.32.108
530006000.63.18
6300060012.601
730008000.32.5
830008000.62.901
9300080012.989
10300010000.32.861
11300010000.63.111
123000100013.261
1340004000.33.012
1440004000.62.606
15400040013.097
1640006000.32.759
1740006000.62.611
18400060012.905
1940008000.32.891
2040008000.62.519
21400080013.422
22400010000.32.953
23400010000.62.802
244000100013.233
2550004000.32.595
2650004000.61.958
27500040012.648
2850006000.32.87
2950006000.62.314
30500060012.674
3150008000.32.557
3250008000.62.082
33500080013.161
34500010000.33.236
35500010000.62.928
365000100013.435
3760004000.33.256
3860004000.62.585
39600040013.034
4060006000.32.304
4160006000.62.413
42600060012.286
4360008000.32.313
4460008000.62.537
45600080012.482
46600010000.32.927
47600010000.62.769
486000100012.856
Table 2. The training parameters.
ParameterSpecification
The layer numbers3 and 4
The number of neurons on the layersInput 3, Hidden 5, 7, 10, 5 × 2, Output 1
The initial weights and biasesRandomly between 0 and +1
Activation functionRelu and Tanh
Learning rate0.03
Data normalizationFrom −0.5 to +0.5
Data normalization10,000–30,000
Table 3. Obtained results of roughness Ra [μm].
Test No.MeasuredRA-2RA-35-S-R10-S-R5-S-T5 × 2-S-R
12.0582.4902.3202.1642.3182.0562.056
22.8452.4622.5532.8432.5522.8012.575
32.412.7822.5522.4122.4142.4072.774
42.1082.4342.4162.3302.4132.1052.166
53.182.4382.7252.9322.8182.7162.741
62.6012.8022.8432.6972.7032.6412.940
72.52.5912.5492.4972.6282.5102.497
82.9012.6272.8783.0222.9042.9202.907
92.9893.0343.0412.9822.9922.9873.106
102.8612.9602.7432.6632.8432.8552.811
113.1113.0293.0363.1113.1133.1073.111
123.2613.4783.1693.2673.2673.2593.272
133.0122.6932.6652.6232.5253.0102.643
142.6062.6082.6782.6042.4872.8722.452
153.0972.8532.8113.0942.8142.7242.652
162.7592.5882.6062.7552.6632.6302.769
172.6112.5352.6972.6592.6522.6692.618
182.9052.8222.9543.1492.9432.8402.817
192.8912.6942.7342.8872.7832.7472.893
202.5192.6742.8492.7142.8192.8492.784
213.4223.0053.1533.2033.1103.1152.983
222.9533.0143.0743.0192.9642.9743.018
232.8023.0263.1552.7682.9873.0602.949
243.2333.3993.4343.2583.2773.3363.149
252.5952.7852.7572.5922.6022.9632.601
261.9582.6432.5172.3062.3552.7312.329
272.6482.8112.7422.7342.6672.6922.529
282.872.6302.4942.7232.6442.5262.815
292.3142.5202.3362.4382.3982.4652.495
302.6742.7312.6882.7892.6802.6702.694
312.5572.6872.5692.8552.7712.6343.029
322.0822.6092.4372.5702.5572.6612.661
333.1612.8642.8412.8442.8472.8972.860
343.2362.9563.0062.9873.0562.8973.235
352.9282.9112.8442.7012.7242.9262.827
363.4353.2093.2262.8993.0143.1253.026
373.2562.7653.0942.5602.7042.8903.246
382.5852.5662.5702.2742.4592.5833.123
393.0342.6592.8452.3752.5202.4213.021
402.3042.5602.5802.6912.6292.4002.317
412.4132.3942.1402.4062.4172.2612.372
422.2862.5292.5462.4302.4862.3282.572
432.3132.5672.5542.8232.7532.4802.531
442.5372.4332.1432.5382.5452.4602.538
452.4822.6112.6052.4842.5842.5682.737
462.9272.7873.0392.9552.9402.7712.745
472.7692.6852.6022.6702.7052.7692.704
482.8562.9063.0452.5392.7512.8542.903
Disclaimer/Publisher’s Note: The statements, opinions and data contained in all publications are solely those of the individual author(s) and contributor(s) and not of MDPI and/or the editor(s). MDPI and/or the editor(s) disclaim responsibility for any injury to people or property resulting from any ideas, methods, instructions or products referred to in the content.

