Article

Statistical Analysis Applied to the Production of Mirto Liqueur

1
Department of Medicine, Surgery and Farmacy, University of Sassari, 07100 Sassari, Italy
2
Department of Chemistry, Materials and Chemical Engineering “G. Natta”, Politecnico di Milano, Piazza L. da Vinci 32, 20133 Milano, Italy
*
Authors to whom correspondence should be addressed.
Appl. Sci. 2024, 14(14), 5973; https://doi.org/10.3390/app14145973
Submission received: 31 May 2024 / Revised: 1 July 2024 / Accepted: 5 July 2024 / Published: 9 July 2024

Abstract

:

Featured Application

Featured Application: A Design of Experiments approach and multivariate analysis can help to understand the complex relationship between the chemical profile and the extraction conditions in the preparation of liqueurs such as the myrtle alcoholic drink.

Abstract

Preparation of myrtle liqueur through ethanol-based extraction is a widely employed methodology. Nevertheless, optimization of existing processes is possible, especially through a modern statistical multivariate approach. In this context, a Design of Experiments (DoE) approach was used to quantitatively assess for the first time the effect of the time, ethanol concentration, temperature, and the ratio between the Myrtus communis berries’ weight and the extractant volume (v/w) on the amounts of anthocyanins, volatile compounds and dry residues in the liqueur. The kinetic profile relative to the volatile fraction variation during the process was described by gas chromatography (GC), while spectrophotometric analysis allowed quantification of the total anthocyanins and total polyphenols. Multiple response analysis showed that the maximum efficiencies in terms of the considered parameters (desirability function) were reached by setting the temperature to 25 °C and the ethanol percentage to 96% after 20 days of processing. Some hints as to the chemical instability and not negligible sensitivity of anthocyanins in relation to the experimental conditions for longer extraction times were also observed. The statistical model represents a novel tool for industrial production of myrtle liqueur.

1. Introduction

Myrtus communis L. (myrtle) is a wild aromatic plant belonging to the Myrtaceae family [1]. The genus Myrtus is the only spontaneous genus in Europe, represented by the M. communis species [2]. It is an evergreen species of the Mediterranean scrub, known for its summer flowering, the intense green color of its leaves, and their characteristic resinous aromatic scent. It grows naturally in some Mediterranean areas, such as the coastal regions of Southern Italy, particularly Sardinia [3]. Myrtle is often used in the production of essential oils, for flavoring meat, and in the perfume and cosmetic industries. Its berries are industrially processed into liqueurs, producing more than three billion bottles each year. Additionally, the berries are commonly made into jams and sweets [4]. Typically, myrtle liqueur is obtained through the cold hydroalcoholic infusion of berries (red myrtle) or leaves (white myrtle) [5]. However, only a few authors have focused on optimizing the extraction parameters [6].
Nowadays, multivariate analysis offers perhaps the best approach to establishing the optimized parameters in a process. Design of Experiments (DoE) has been successfully applied in various industrial and academic research fields, such as optimizing the recycling of waste cooking oils [7], customizing the synthesis of important pharmaceutical intermediates through Nazarov cyclization [8] and studying low-melting mixtures [9].
Regarding the chemical composition of myrtle berries, the typical color and flavor are related to their polyphenol and volatile content [10]. Anthocyanins can undergo several transformations during the extraction procedure, showing limited stability depending on the pH, light exposure, water activity, oxygen, temperature, duration of processing, and storage conditions [11,12,13]. Thus, the extraction method plays a key role and strongly affects the chemical profile of the liquor [14].
In accordance with European regulation CE n. 110/2008 [15] regarding spirit beverages, details concerning the extraction process for the production of Myrtus liquor are outlined. The provided data, however, are somewhat broad and generic. For instance, the extraction time is specified to fall within a range of 15 days to 8 months, and the ethanol concentration required for extraction is stated to be a minimum of 40%. The present study aimed to provide a suitable statistical model to customize the chemical profile of myrtle liquor obtained by ethanolic extraction. Using a Design of Experiments (DoE) approach and multivariate analysis, the influence of the time, ethanol concentration, temperature, and the ratio between the amount of M. communis berries and the extractant volume (v/w) on the amounts of anthocyanins, volatile compounds, and dry residues in the liqueur was assessed. The kinetics of the main parameters of the optimized extracts were also measured by fixed-wavelength UV–VIS spectroscopy and gas chromatography coupled with mass spectrometry (GC/MS). Our results could assist the spirit beverage industry in enhancing the extraction methods for liqueur production.

2. Materials and Methods

2.1. Materials

Deionized water was obtained by treatment with a Milli-Q apparatus (Millipore, Milan, Italy). Unless stated otherwise, all the standards were purchased from Merck Europe (Darmstadt, Germany).

2.2. Sample Collection

Plant materials were collected during autumn 2021 from near Alghero (Italy); more precisely, in the Val Verde Sanctuary locality. Myrtle berries were separated from the leaves and used for the assays immediately after collection.

2.3. Design of Experiments

A two-level full-factorial 2k screening Design of Experiments (DoE) approach was employed, as indicated below. The effect of four factors (time, ethanol concentration, temperature and the ratio between the amount of M. communis berries and the extractant volume) and their combination on the anthocyanin amount, on the fixed residue, and on the volatile content were assessed. For the multivariate analysis, Statgraphics Centurion 18 was used as software.

2.4. Extraction Procedure

The experimental protocol was the following: myrtle berries were placed in a beaker and the specified amount of ethanol, according to Table 1, was added. Then, the mixture was stirred at the selected temperature for the indicated time (Table 1).
According to the DoE, 16 experiments were planned. In Table 2, the full list of experiments is reported, with the outcomes relative to the anthocyanin content (absorbance at 545 nm), dry matter, and volatiles amount (as the TIC, total ion chromatogram, total area). The description of these three parameters and the specific calculation procedure is discussed in the following paragraphs.
Once the experimental conditions were set, M. communis berries were subjected to maceration with absolute ethanol at room temperature for 20 days. For the kinetics of the extraction, a sample was collected on 3 to 6 consecutive days until 12 samples were obtained.

2.5. Volatile Organic Compounds Determination

The GC/MS analysis was carried out using an Agilent 6890 GC (Palo Alto, Santa Clara, CA, USA), coupled with an Agilent 5973 MSD detector. The chromatographic separation was performed on an HP-5MS capillary column (30 m × 0.25 mm, film thickness 0.17 µm), and the following temperature program was used: 60 °C hold for 3 min, then increased to 210 °C at a rate of 4 °C/min, then held at 210 °C for 15 min, then increased to 280 °C at a rate of 10 °C/min. Helium was used as the carrier gas at a constant flow of 1 mL/min for both columns. The data were analyzed using a MassHunter Workstation B.06.00 SP1, with identification/tentative identification of the individual components performed by comparison with the co-injected pure compounds and by matching the MS fragmentation patterns and retention indices with the built-in libraries or the literature data or commercial mass spectral libraries (NIST/EPA/NIH 2008; HP1607 purchased from Agilent Technologies (Palo Alto, Santa Clara, CA, USA)).

SPME Conditions

The isolation of the headspace volatile compounds was carried out from a raw extract/aqueous saturated NaCl solution (4 mL, 1:3 v/v) in a 20 mL Solid Phase Micro Extraction (SPME) vial, 75.5 × 22.5 mm, which was tightly closed with a septum and allowed to equilibrate under agitation for 10 min at 40 °C. A 1 cm, PDMS 50/30 StableFlex (Supelco, Milano, Italy) SPME fiber was preconditioned at 250 °C, according to the manufacturer’s instructions, before being introduced to the headspace for extraction. Prior to and after each analysis, the fiber underwent a further bake-out step for 5 min at 250 °C. The extraction time was fixed at 30 min, after which it was desorbed for 2 min into the injector operating at 250 °C in a splitless mode.

2.6. Anthocyanin Measurements

The total anthocyanin measurements of 12 samples were conducted by spectrophotometric analysis. Briefly, 200 µL of the sample and negative control (distilled water) was mixed with 1800 µL of absolute ethanol and 30 µL of 10% HCl. The absorbance of the solutions at 545 nm was read using a 1 cm quartz cuvette on an Ultrospec 4300 pro UV–vis spectrophotometer, equipped with a temperature controller set to 25 °C. The total anthocyanins amount (TA, mg/L) was calculated by using a molar extinction coefficient (ε) of cyanidin-3-glucoside in the same solvent (30,400 mol−1 cm−1).

2.7. Determination of Total Phenols

The total phenols were estimated by a colorimetric assay based on procedures described by Maldini et al., with some modifications [10]. Basically, 100 µL of the sample at various concentrations (from 1 to 5000 µg/mL) were mixed with 900 µL of bi-distillated water and 75 µL of Folin–Ciocalteu phenol reagent. After 2 min, 200 µL of sodium bicarbonate (75 g/L) was added to the mixture and the tubes were kept in the dark for 60 min at room temperature. The absorbance was recorded at 770 nm using a 1 cm quartz cuvette on an Ultrospec 4300 pro UV–vis spectrophotometer, equipped with a temperature controller set to 25 °C. Gallic acid (1–200 µg) was used for constructing the standard curve. The results were expressed as µg of gallic acid equivalent (GAE) per mg of the fresh plant part.

2.8. Statistical Analysis

All the experiments were performed in triplicate. All the statistical analyses were performed by comparing ethanolic extracts of Myrtus communis with the unpaired Student’s t-test, when the data followed a normal distribution, using Graph Pad Prism 5 software. Moreover, the amounts of each compound from Myrtus communis were analyzed with the one-way analysis of variance (ANOVA) test, with Turkey’s post hoc test, when the data followed a normal distribution. The distribution of the sample was evaluated by the Kolmogorov–Smirnov and Shapiro tests. Differences in the total phenols contents over the concentrations were assessed using linear regression in which the slope variations were compared with a global test of coincidence using Graph Pad Prism 5 software. The strength of the association between variables was analyzed with the Spearman product moment correlation coefficient when the data did not follow a normal distribution. A p ≤ 0.05 was considered statistically significant.

2.9. Multivariate Analysis

The multivariate analysis was conducted with the software Statgraphics Centurion 18.

3. Results

3.1. Multivariate Analysis
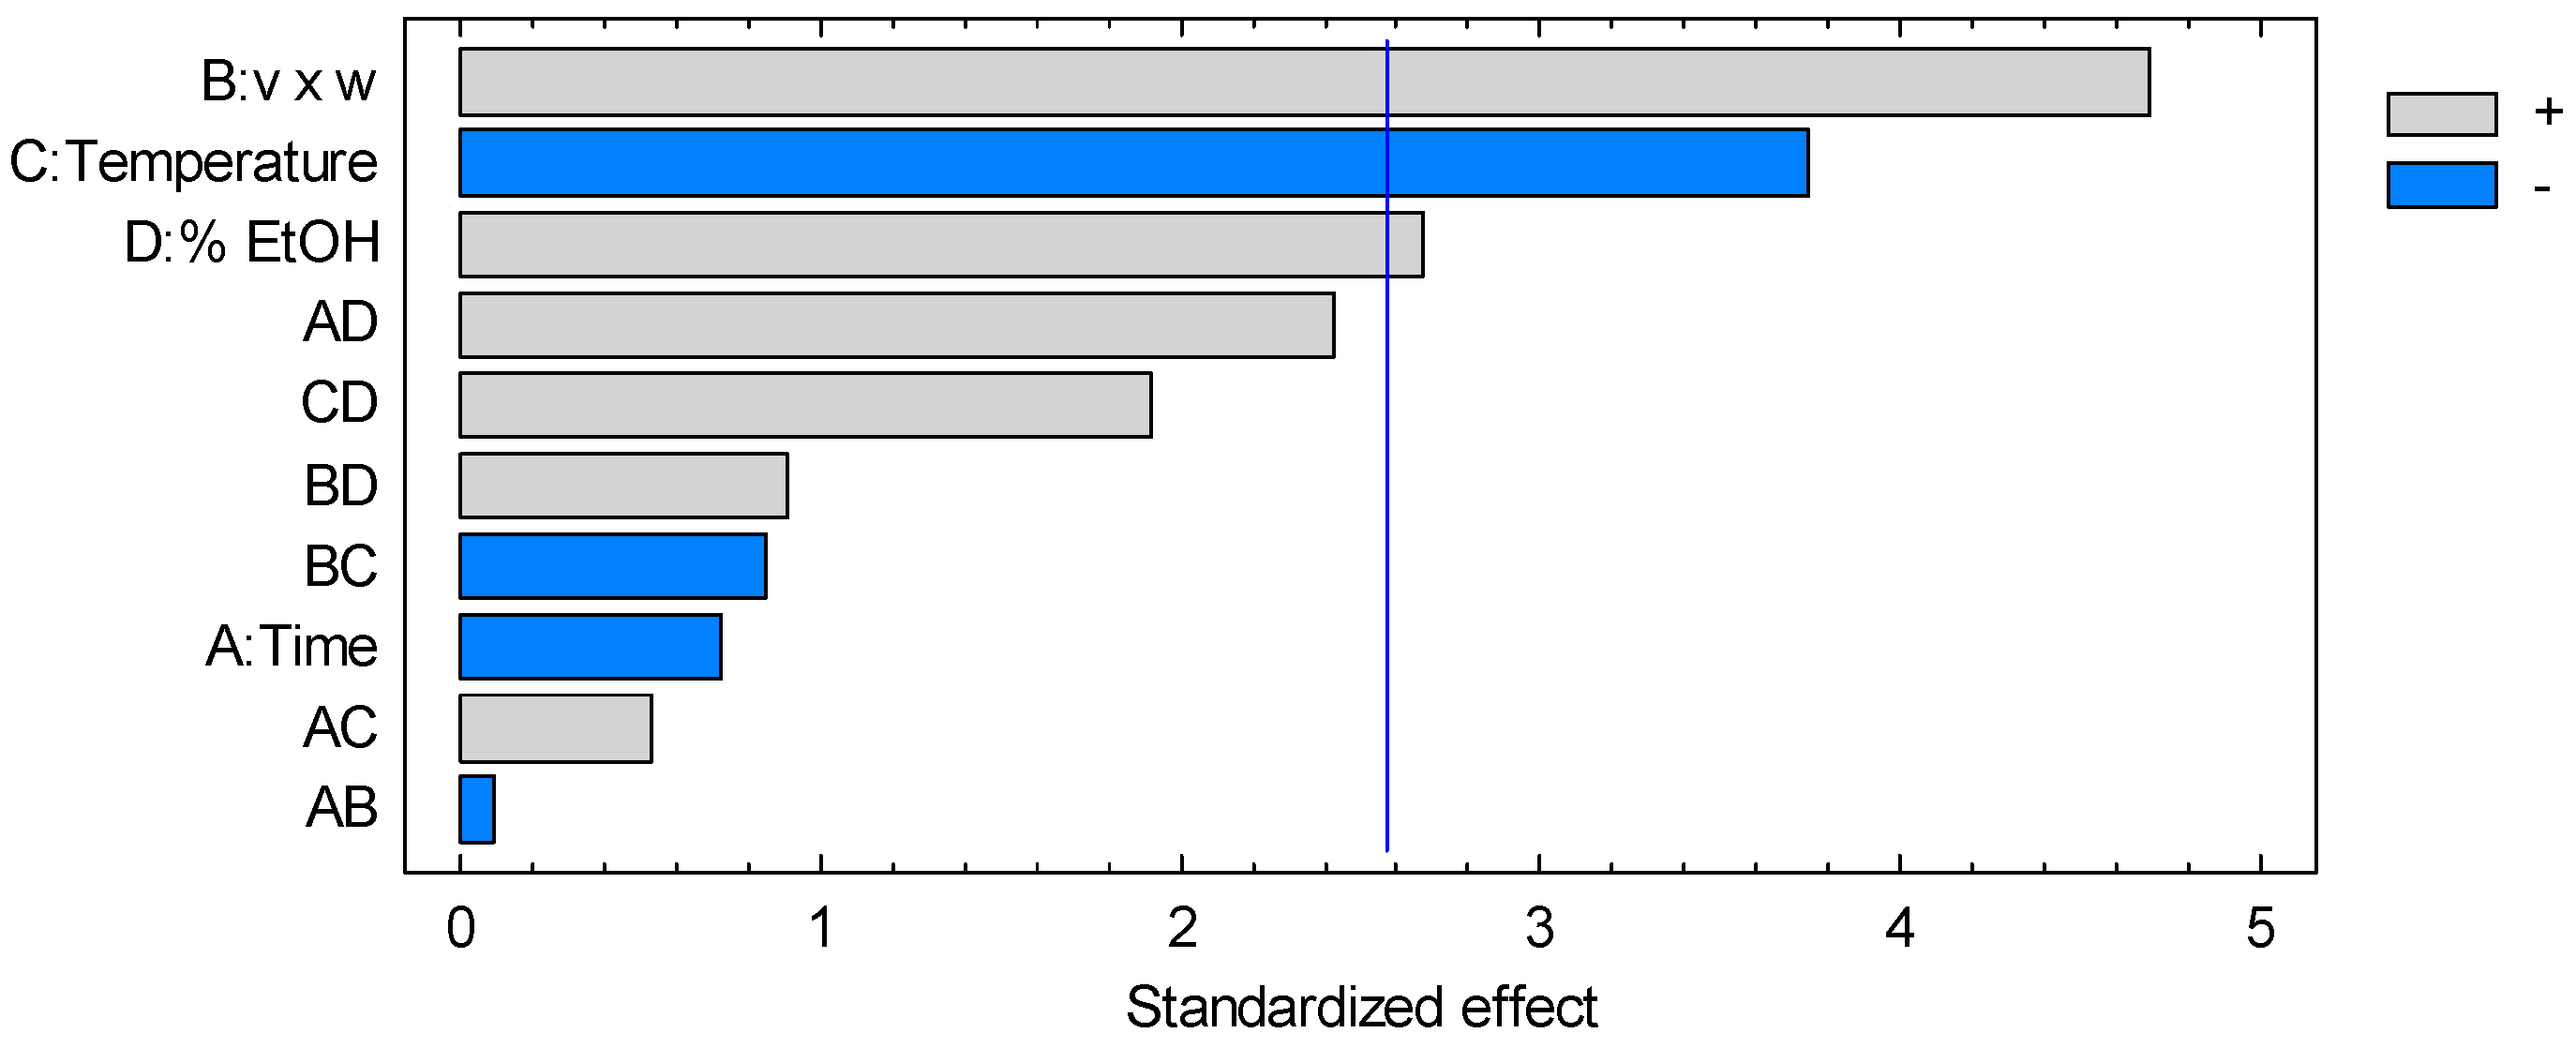
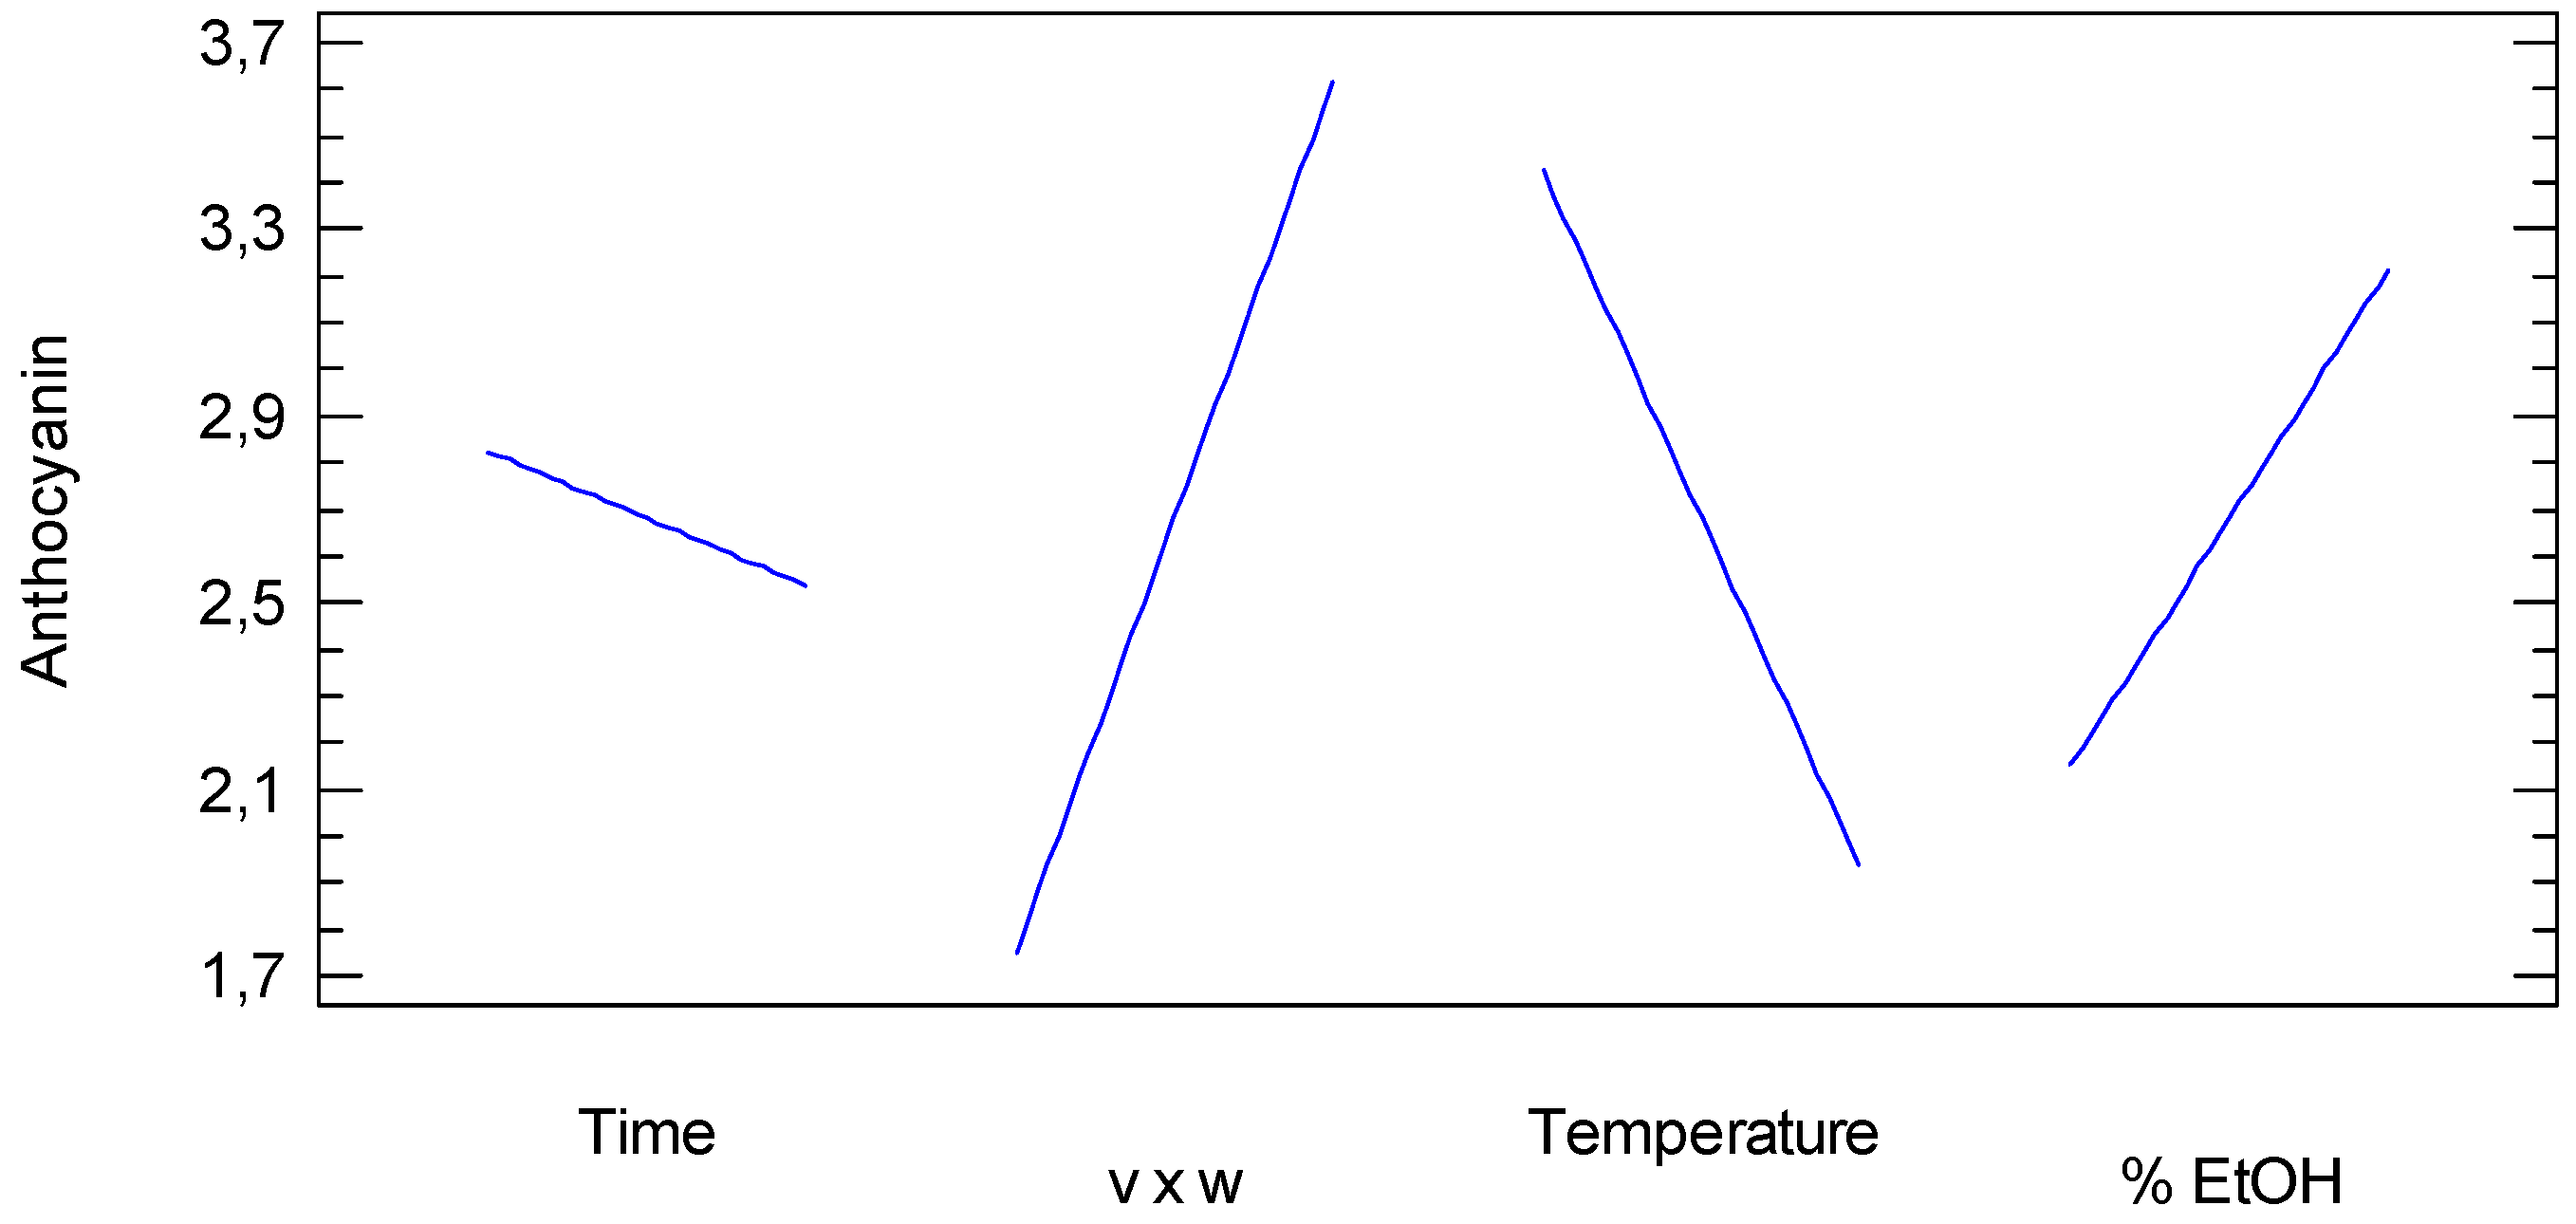
The 16 experiments designed to clarify the effect of the time, ethanol concentration, v/p ratio, and temperature on the anthocyanin content, the fixed residue, and the volatile amount were conducted in the order reported in Table 2.

3.1.1. Anthocyanin

The multivariate analysis relative to the variation of the anthocyanin content shows some interesting aspects. From the analysis of variance (ANOVA), three factors were statistically significant with a p-value < 0.05 (Table 3).
For the considered system, there is an R-squared of 91.6858%, and a R-squared (adjusted for d.f.) of 75.0573%. The standard error of the estimates corresponds to 0.794119. The mean absolute error (MAE) is 0.360938, with a Durbin–Watson (DW) statistic value of 3.28444 (p = 0.9963).
The ANOVA table partitions the variability in anthocyanin into separate pieces for each of the effects. It then tests the statistical significance of each effect by comparing the mean square against an estimate of the experimental error. In this case, three effects have p-values less than 0.05, indicating that they are significantly different from zero at the 95.0% confidence level. The R-squared statistic indicates that the model as fitted explains 91.6858% of the variability in anthocyanin. The adjusted R-squared statistic, which is more suitable for comparing models with different numbers of independent variables, is 75.0573%.
The standard error of the estimate shows the standard deviation of the residuals to be 0.794119. The MAE of 0.360938 is the average value of the residuals. The Durbin–Watson DW statistic tests the residuals to determine if there is any significant correlation based on the order in which they occur in the data file. Since the p-value is greater than 5.0%, there is no indication of serial autocorrelation in the residuals at the 5.0% significance level.
The Pareto plot (Figure 1) reports such results in terms of the horizontal bars, indicating which one is statistically relevant for the variation of the anthocyanin content (p-value < 0.05 indicated by the vertical line, Figure 1).
Looking at the Pareto plot, as expected, the anthocyanin content is affected by the temperature, the ethanol percentage, and the ratio between ethanol and Myrtus. It is interesting to notice that the time of extraction has no relevant effect on the anthocyanin content. This represents very useful information for industrial production as it indicates that 20 days should be fine for the complete extraction of anthocyanin, with no advantage of prolonging the extraction protocol to 40 days.
The specific effect of each relevant factor can be observed in the so-called main effect plot (Figure 2).
The main effects plot shows that to higher ethanol content corresponds an increase of the anthocyanin amount. This is related to the ratio between ethanol and myrtle berries’ weight according to the Equation (1). Also, low temperatures guarantee a better outcome. This counterintuitive evidence suggests that elevated temperature could promote with time some kind of decomposition of the anthocyanins.
Considering the behavior of the factors and their influence on the anthocyanin content, it is possible to conduct a multiple regression and to extract a mathematical equation that describes the system (Equation (1)).
Anthocyanin content = −3.29375 + 0.0664063 × %EtOH − 0.074375 × Temperature − 0.014375 × Time + 1.8625 × v × w

3.1.2. Dry Matter

The ANOVA for the dry matter data revealed that its content is not significantly affected by any of the considered parameters or their combinations. As for the effect of the time on the anthocyanin content, this represents important information for industrial purposes. In fact, it is possible to operate the required extraction procedure without being worried about producing excessive and undesired fixed residue.

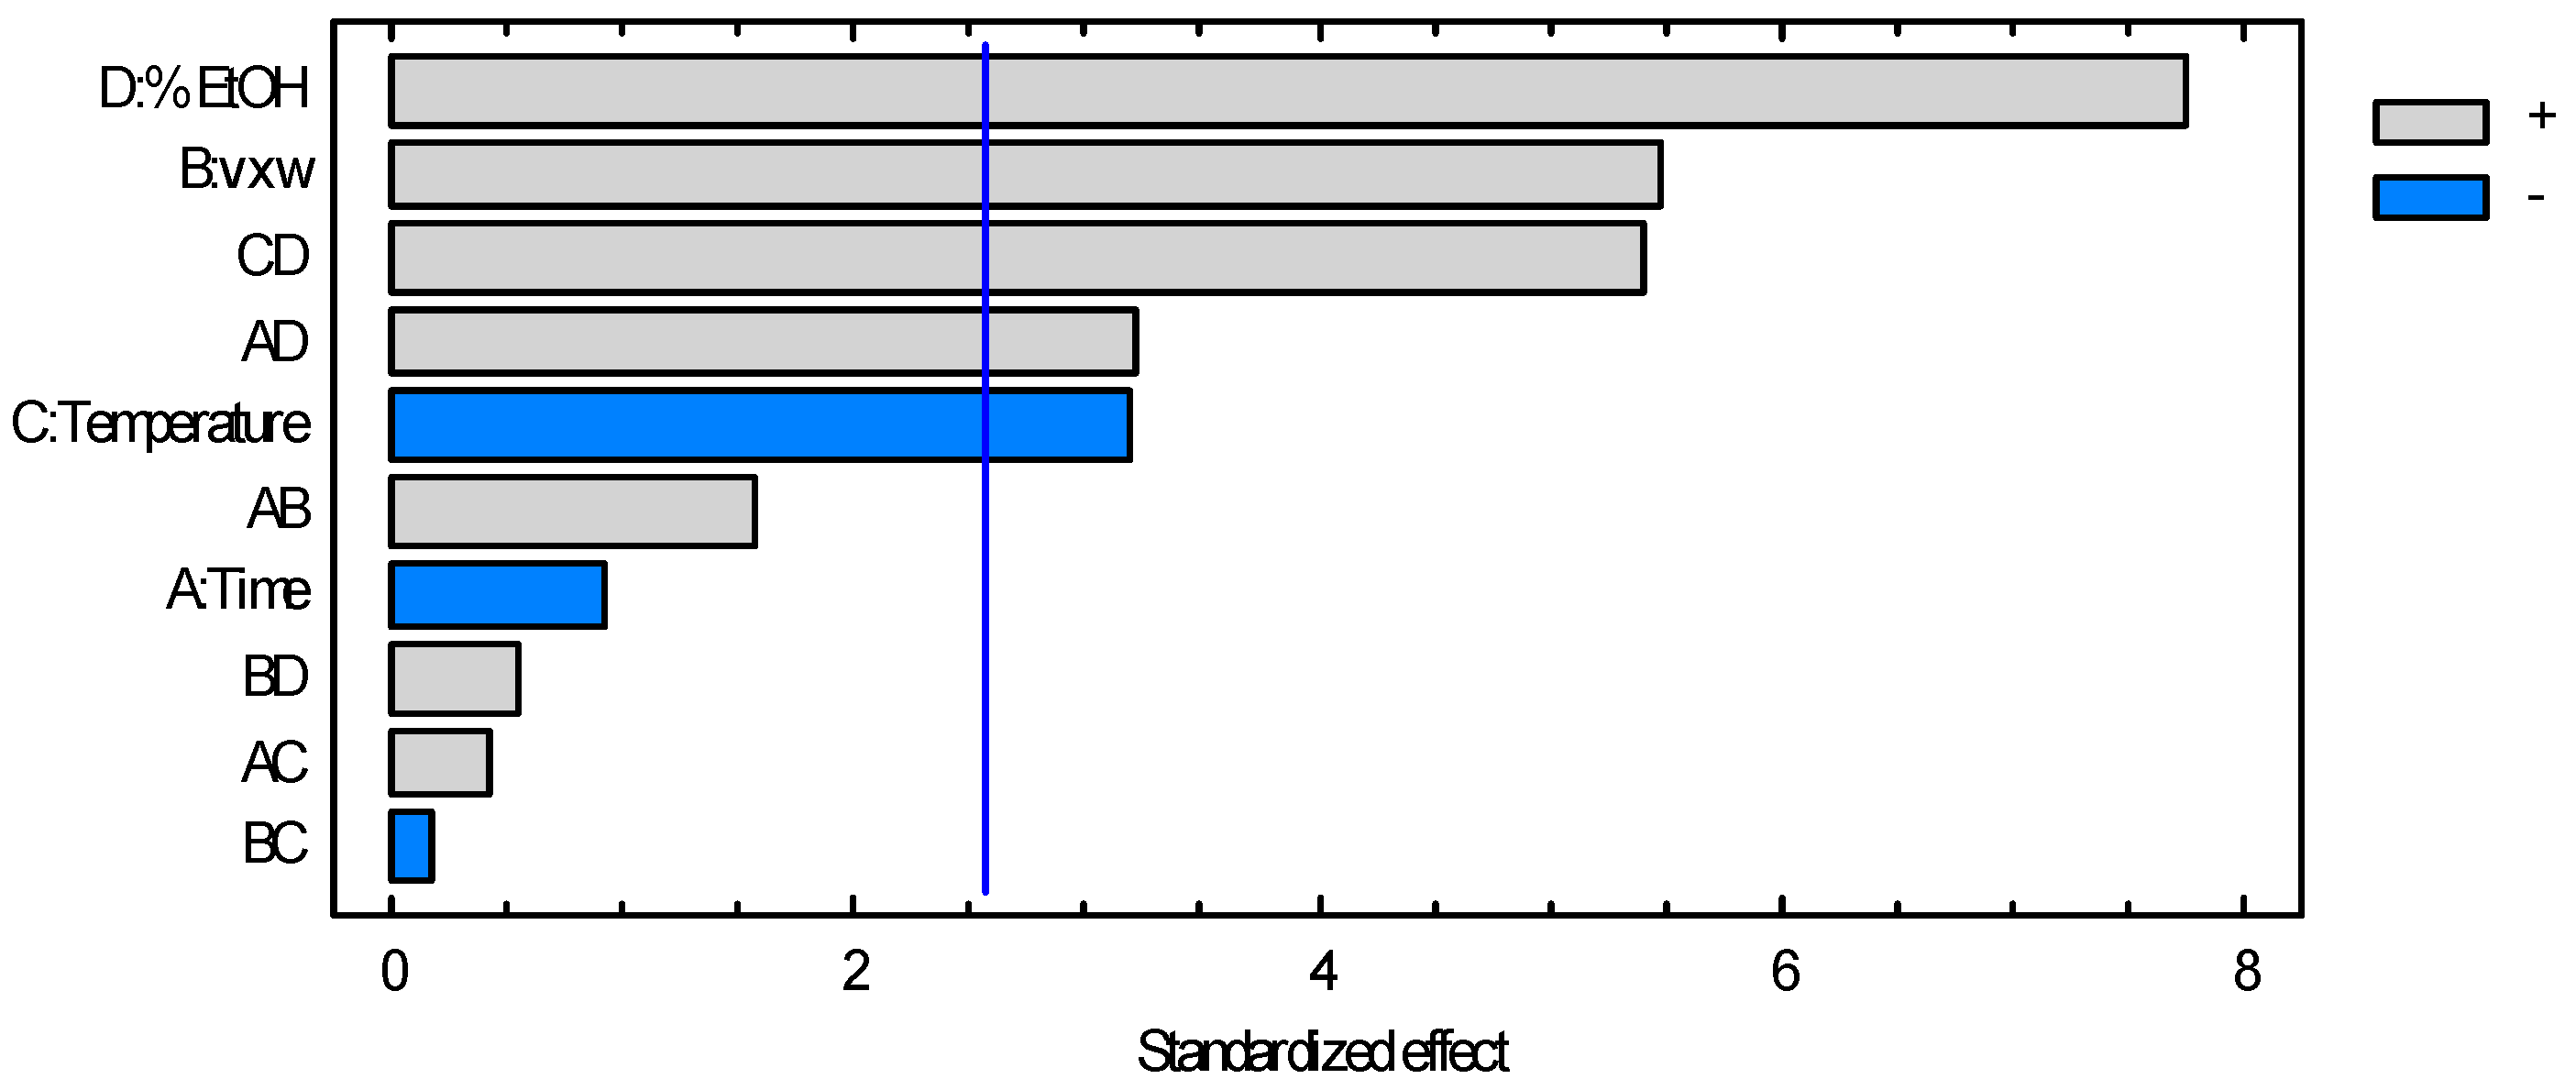
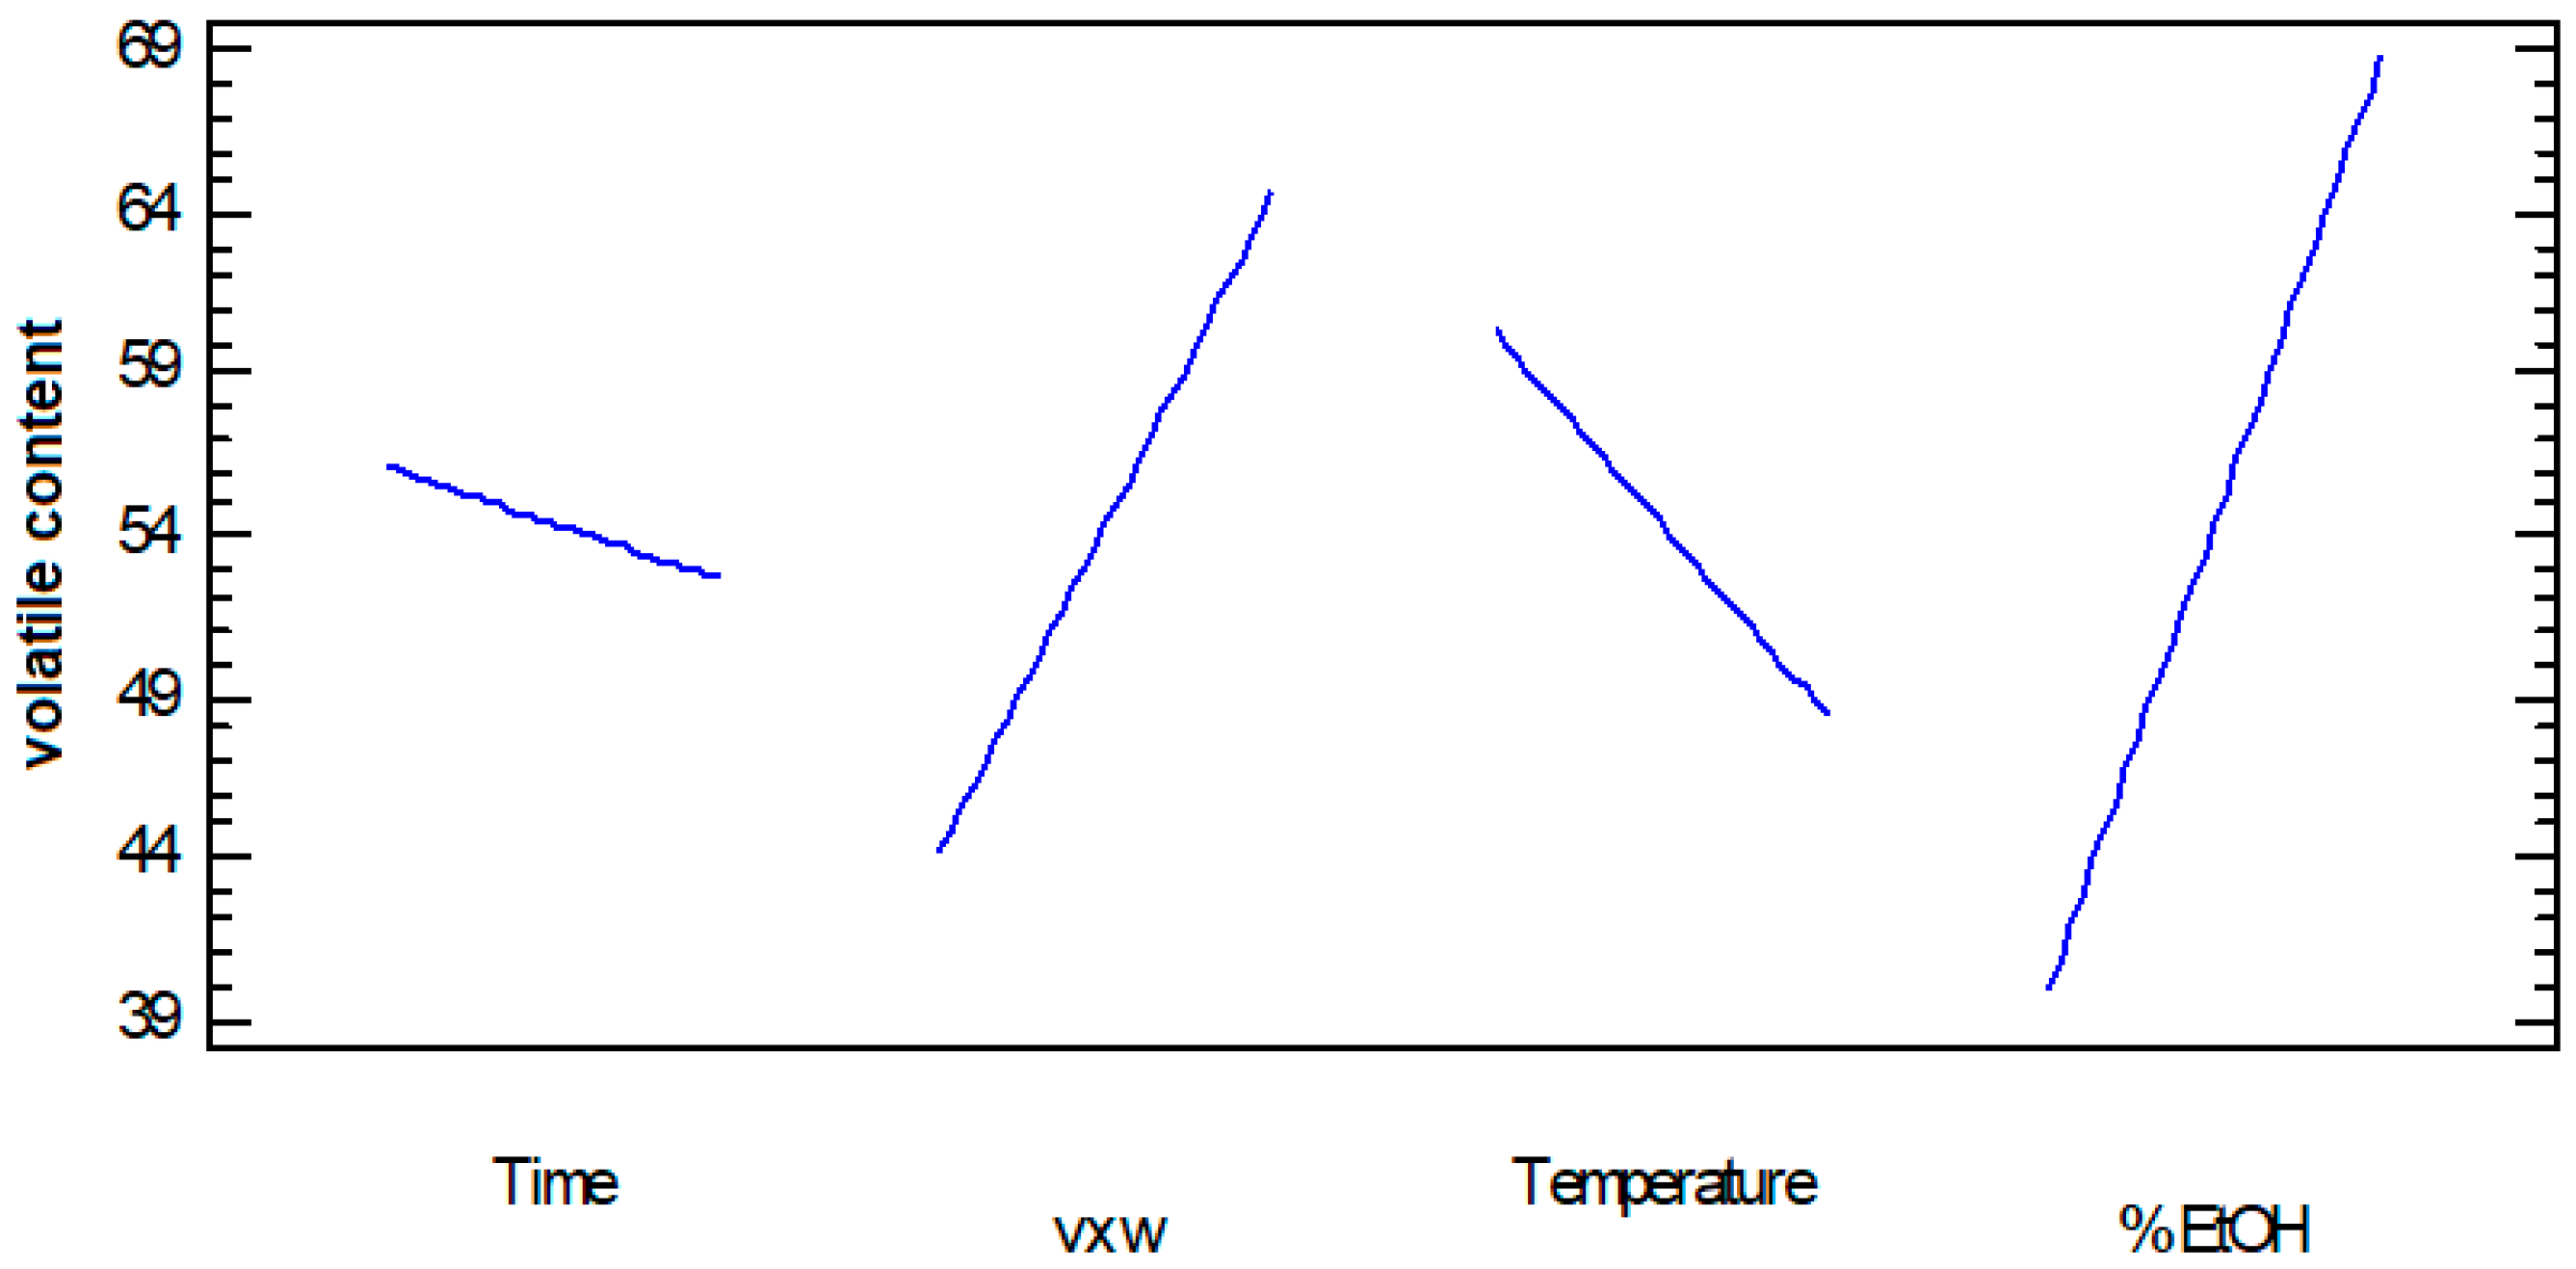
3.1.3. Volatiles Content

Volatile organic compounds are one of the parameters strongly linked to the sensory characteristics of food products. The variability of this class of molecules was evaluated by measuring the TIC (total ion chromatogram) total area, as previously reported [16].
The analysis of the influence of the factors on the volatile content resulted in richer information. In fact, the ANOVA showed five factors and combinations with a p-value < 0.05 (Table 4 and Figure 3).
Concerning the volatiles content, five effects have p-values less than 0.05, indicating that they are significantly different from zero at the 95.0% confidence level. The R-squared statistic indicates that the model as fitted explains 96.6394% of the variability in the volatiles content. The adjusted R-squared statistic, which is more suitable for comparing models with different numbers of independent variables, is 89.9183%. The standard error of the estimate shows the standard deviation of the residuals to be 745187. Since the p-value is greater than 5.0%, there is no indication of serial autocorrelation in the residuals at the 5.0% significance level. The analysis of the Pareto plot (Figure 3) shows that the order of significancy for the five terms with a p-value < 0.05 is the following: ethanol percentage, ratio between ethanol volume and weight of myrtle, the combination between temperature and ethanol percentage, the combination between time and ethanol percentage, and finally, the temperature (Figure 3).
Of particular interest are the statistically relevant combinations of factors, as they indicate synergic effects that are usually very difficult to highlight with a classic approach and impossible to quantify without a proper DoE. Thus, the ethanol content, which is a determinant in defining the volatiles extraction ability of the system, has different effects. One is related to its content and is the same increasing effect shown for the anthocyanins (more ethanol, more amount of chemicals extracted, main effect plot, Figure 4). Along with this expected effect, two more underlying dynamics are present: the combination between ethanol and temperature and the combination between ethanol and time. The first means that the capacity of the ethanol to extract volatile compounds differs with the temperature, suggesting that the temperature is responsible for the non-linear behavior of the ethanol percentage. This can be explained by assuming, as in the previous paragraphs, that elevated temperatures promote some decomposition pathways, reducing the amount of chemical potentially extractable from the vegetable mass. Regarding the second combined effect observed (ethanol % and time), it is interesting to notice that the time, which has no relevant influence on the volatiles amount in the extracts, has an indirect effect on it, as it affects the extraction ability of the ethanol. Regarding the second combined effect observed (ethanol percentage and time), it is interesting to note that the time, which does not have a significant influence on the quantity of volatiles in the extracts, has an indirect effect by influencing the extraction capacity of ethanol. Hypothetically, even though the time itself does not affect the quantity of volatiles extracted, it impacts ethanol’s ability to extract them. From this hypothesis, it could be inferred that since volatiles evaporate easily, an analysis with prolonged durations might distort the distribution of volatiles in the sample, as the lighter ones evaporate. This makes it appear as if ethanol’s extraction capacity deteriorates over time.
Also, in this case, through a multiple regression procedure, it is possible to generate a mathematical equation that describes the variation of the volatiles content (Equation (2)).
volatile content = −1.11981E7 + 180,528 × %EtOH − 59,550.2 × Temperature − 17,498.3 × Time + 2.04126E6 × v × w.
Since the p-value in the ANOVA table is less than 0.05, there is a statistically significant relationship between the variables at the 95.0% confidence level. This guarantees the viability of Equation (2), which is then statistically affordable for describing the volatile content in terms of the EtOH%, temperature, time and v × w.

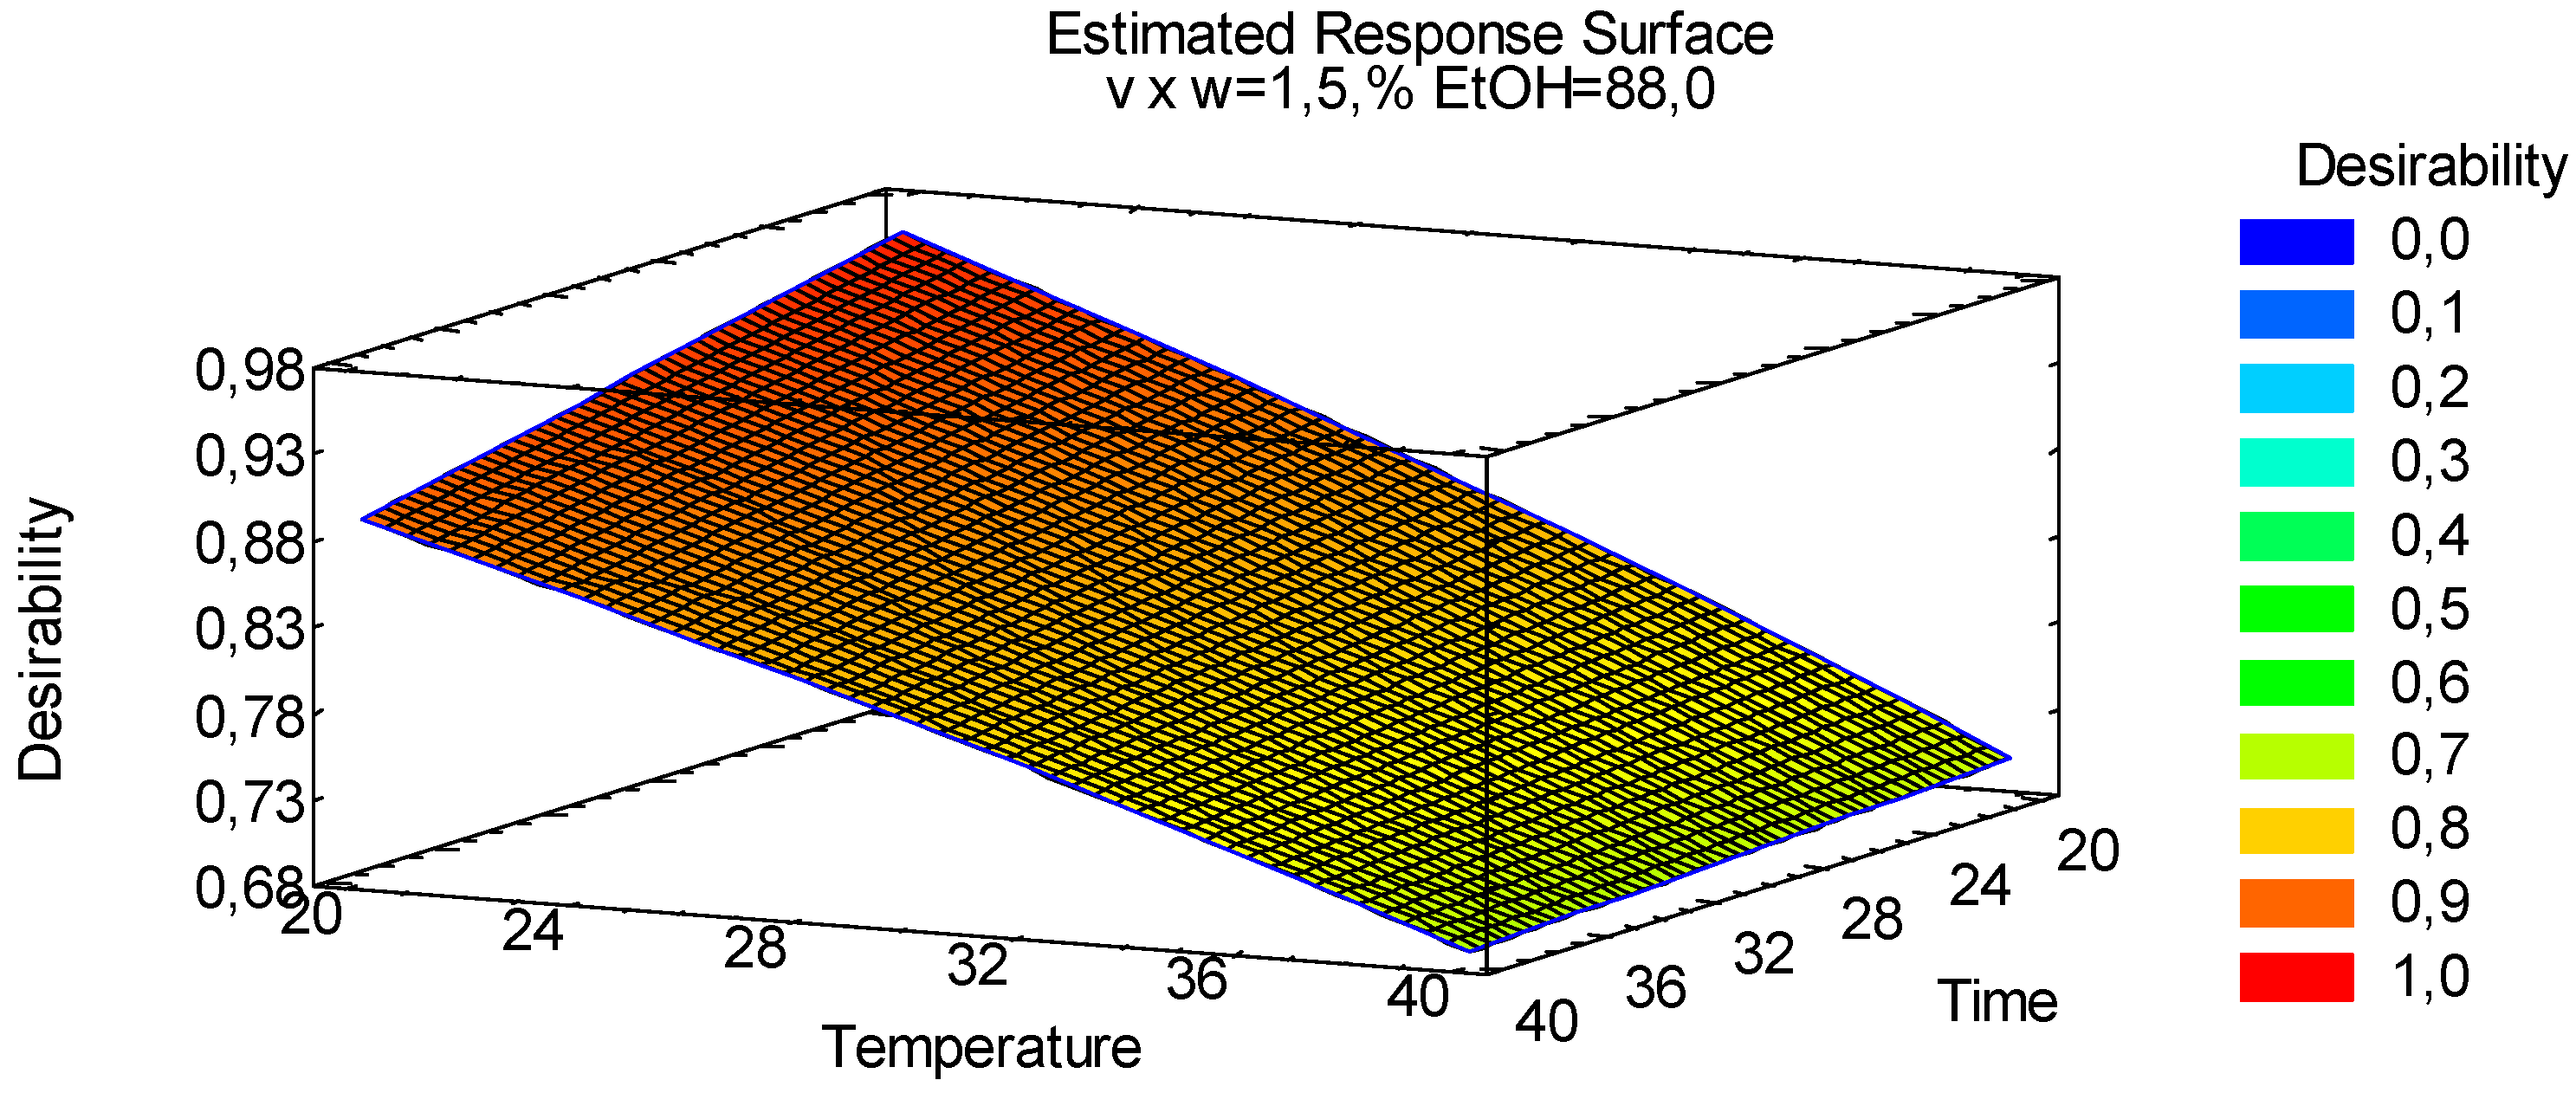
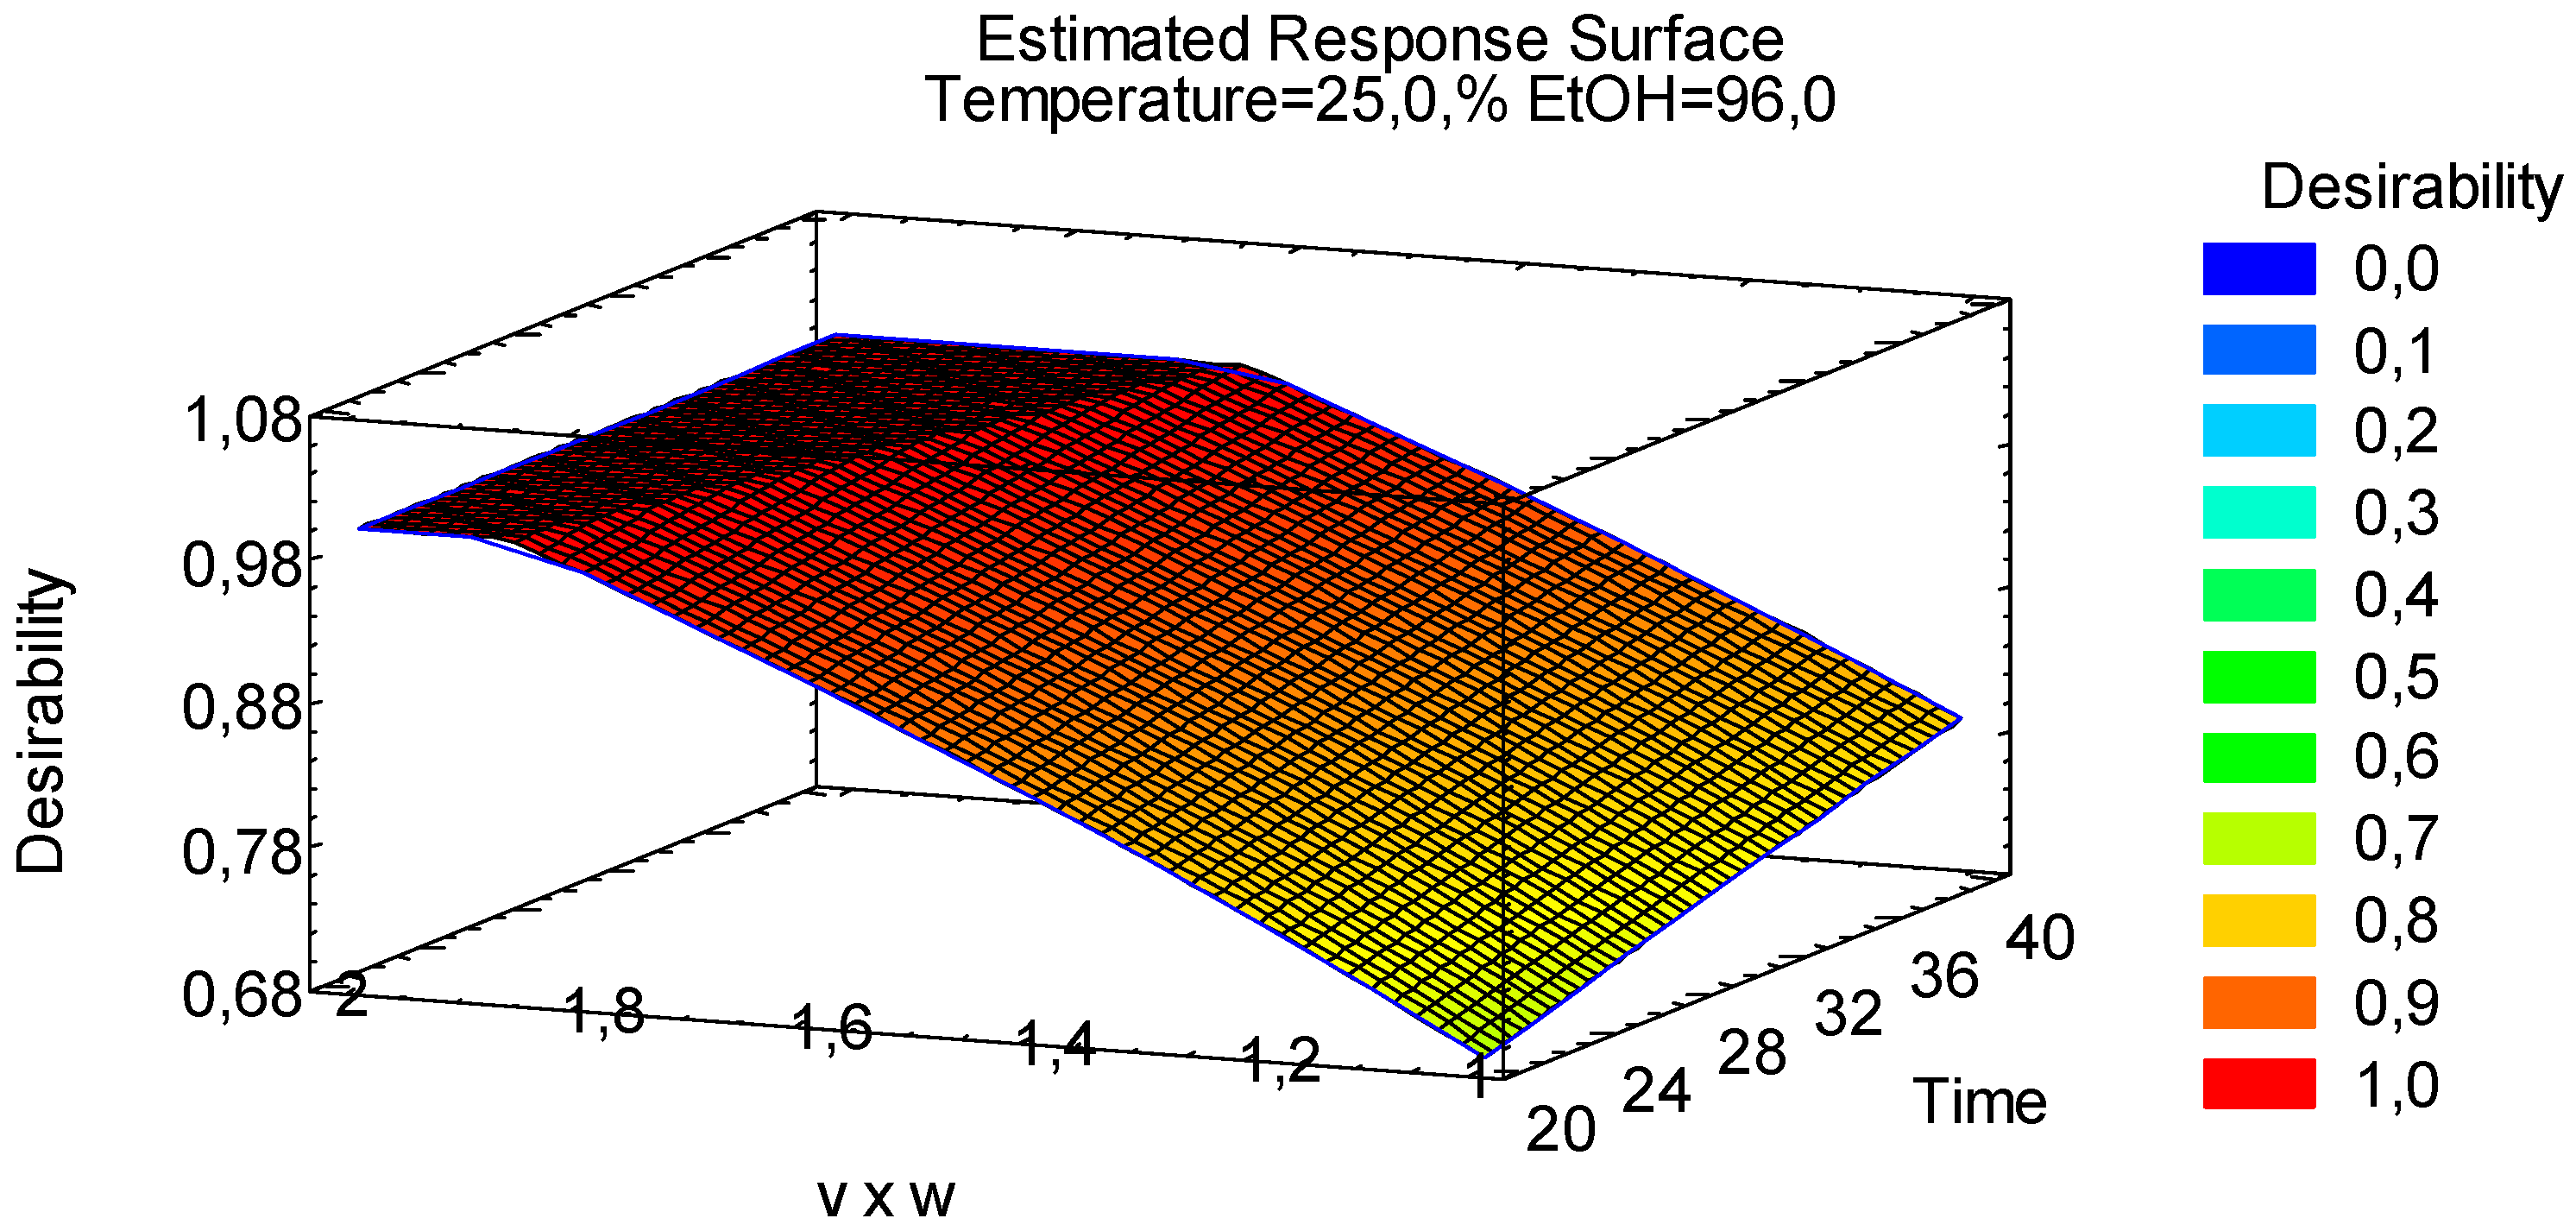
3.1.4. Multiple Response Optimization

Once it is determined which parameters are statistically relevant for the target outcomes, it is possible to use this know-how for implementing a multiple response optimization study (MRO). This target can be reached through a surface responding analysis (SRA). This procedure is advised when multiple outcomes should be considered and when multiple factors simultaneously influence multiple responses. Considering that the fixed residue is not influenced by the factors studied, the SRA has been implemented on the combination between the anthocyanin and volatiles contents (data variables).
This procedure has been used with good results and shows a suitable predictive ability in industrial relevant processes [17], such as the extraction of pectin from sunflowers [18] for the mercerization of cellulose [19], in the optimization of lubricant generation from used vegetable oils [20], in the study of grinding processes [21], in wastewater treatment [22] as well as for the optimization of the Nazarov cyclization reaction [8].
For a proper SRA, a desirability function is generated by the combination of the multiple regressions reported in Section 3.1.1 and Section 3.1.3 (Equations (1) and (2)), considering the aim of the optimization, which in this specific case is to maximize the amount of anthocyanin and volatiles in the extract (Table 5 and Table 6).
Looking at the data reported in Table 6, the maximum desirability is achieved at run 1. In Figure 5, an SRA plot is reported.
By fixing the values of the ethanol volume/weight of the vegetable mass ratio and the concentration of ethanol, it is possible to study the behavior of the system with respect to the desirability function. As expected, the time does not play any relevant role, while the temperature is highly relevant, showing the best results at low values.
Thus, setting the temperature to 25 °C and the ethanol percentage to 96% (typical commercially available ethanol), it is possible to obtain an SRA plot, which can be used to set the best parameters for industrial production (Figure 6).
The SRA plot reported in Figure 6 is the result of the stepwise multivariate analysis described until now. It represents a fundamental tool for setting up the sustainable production of myrtle liqueur. To simultaneously maximize the anthocyanin and volatiles contents in the final extract, it is possible to work at room temperature, with an ethanol/plant ratio of about 2. Also, it is possible to reach a desirability of 0.98 after only 20 days of extraction. In fact, longer times of extractions represent not just a waste of time but also affect the extraction capacity of the ethanol, reducing the quality of the liqueur.

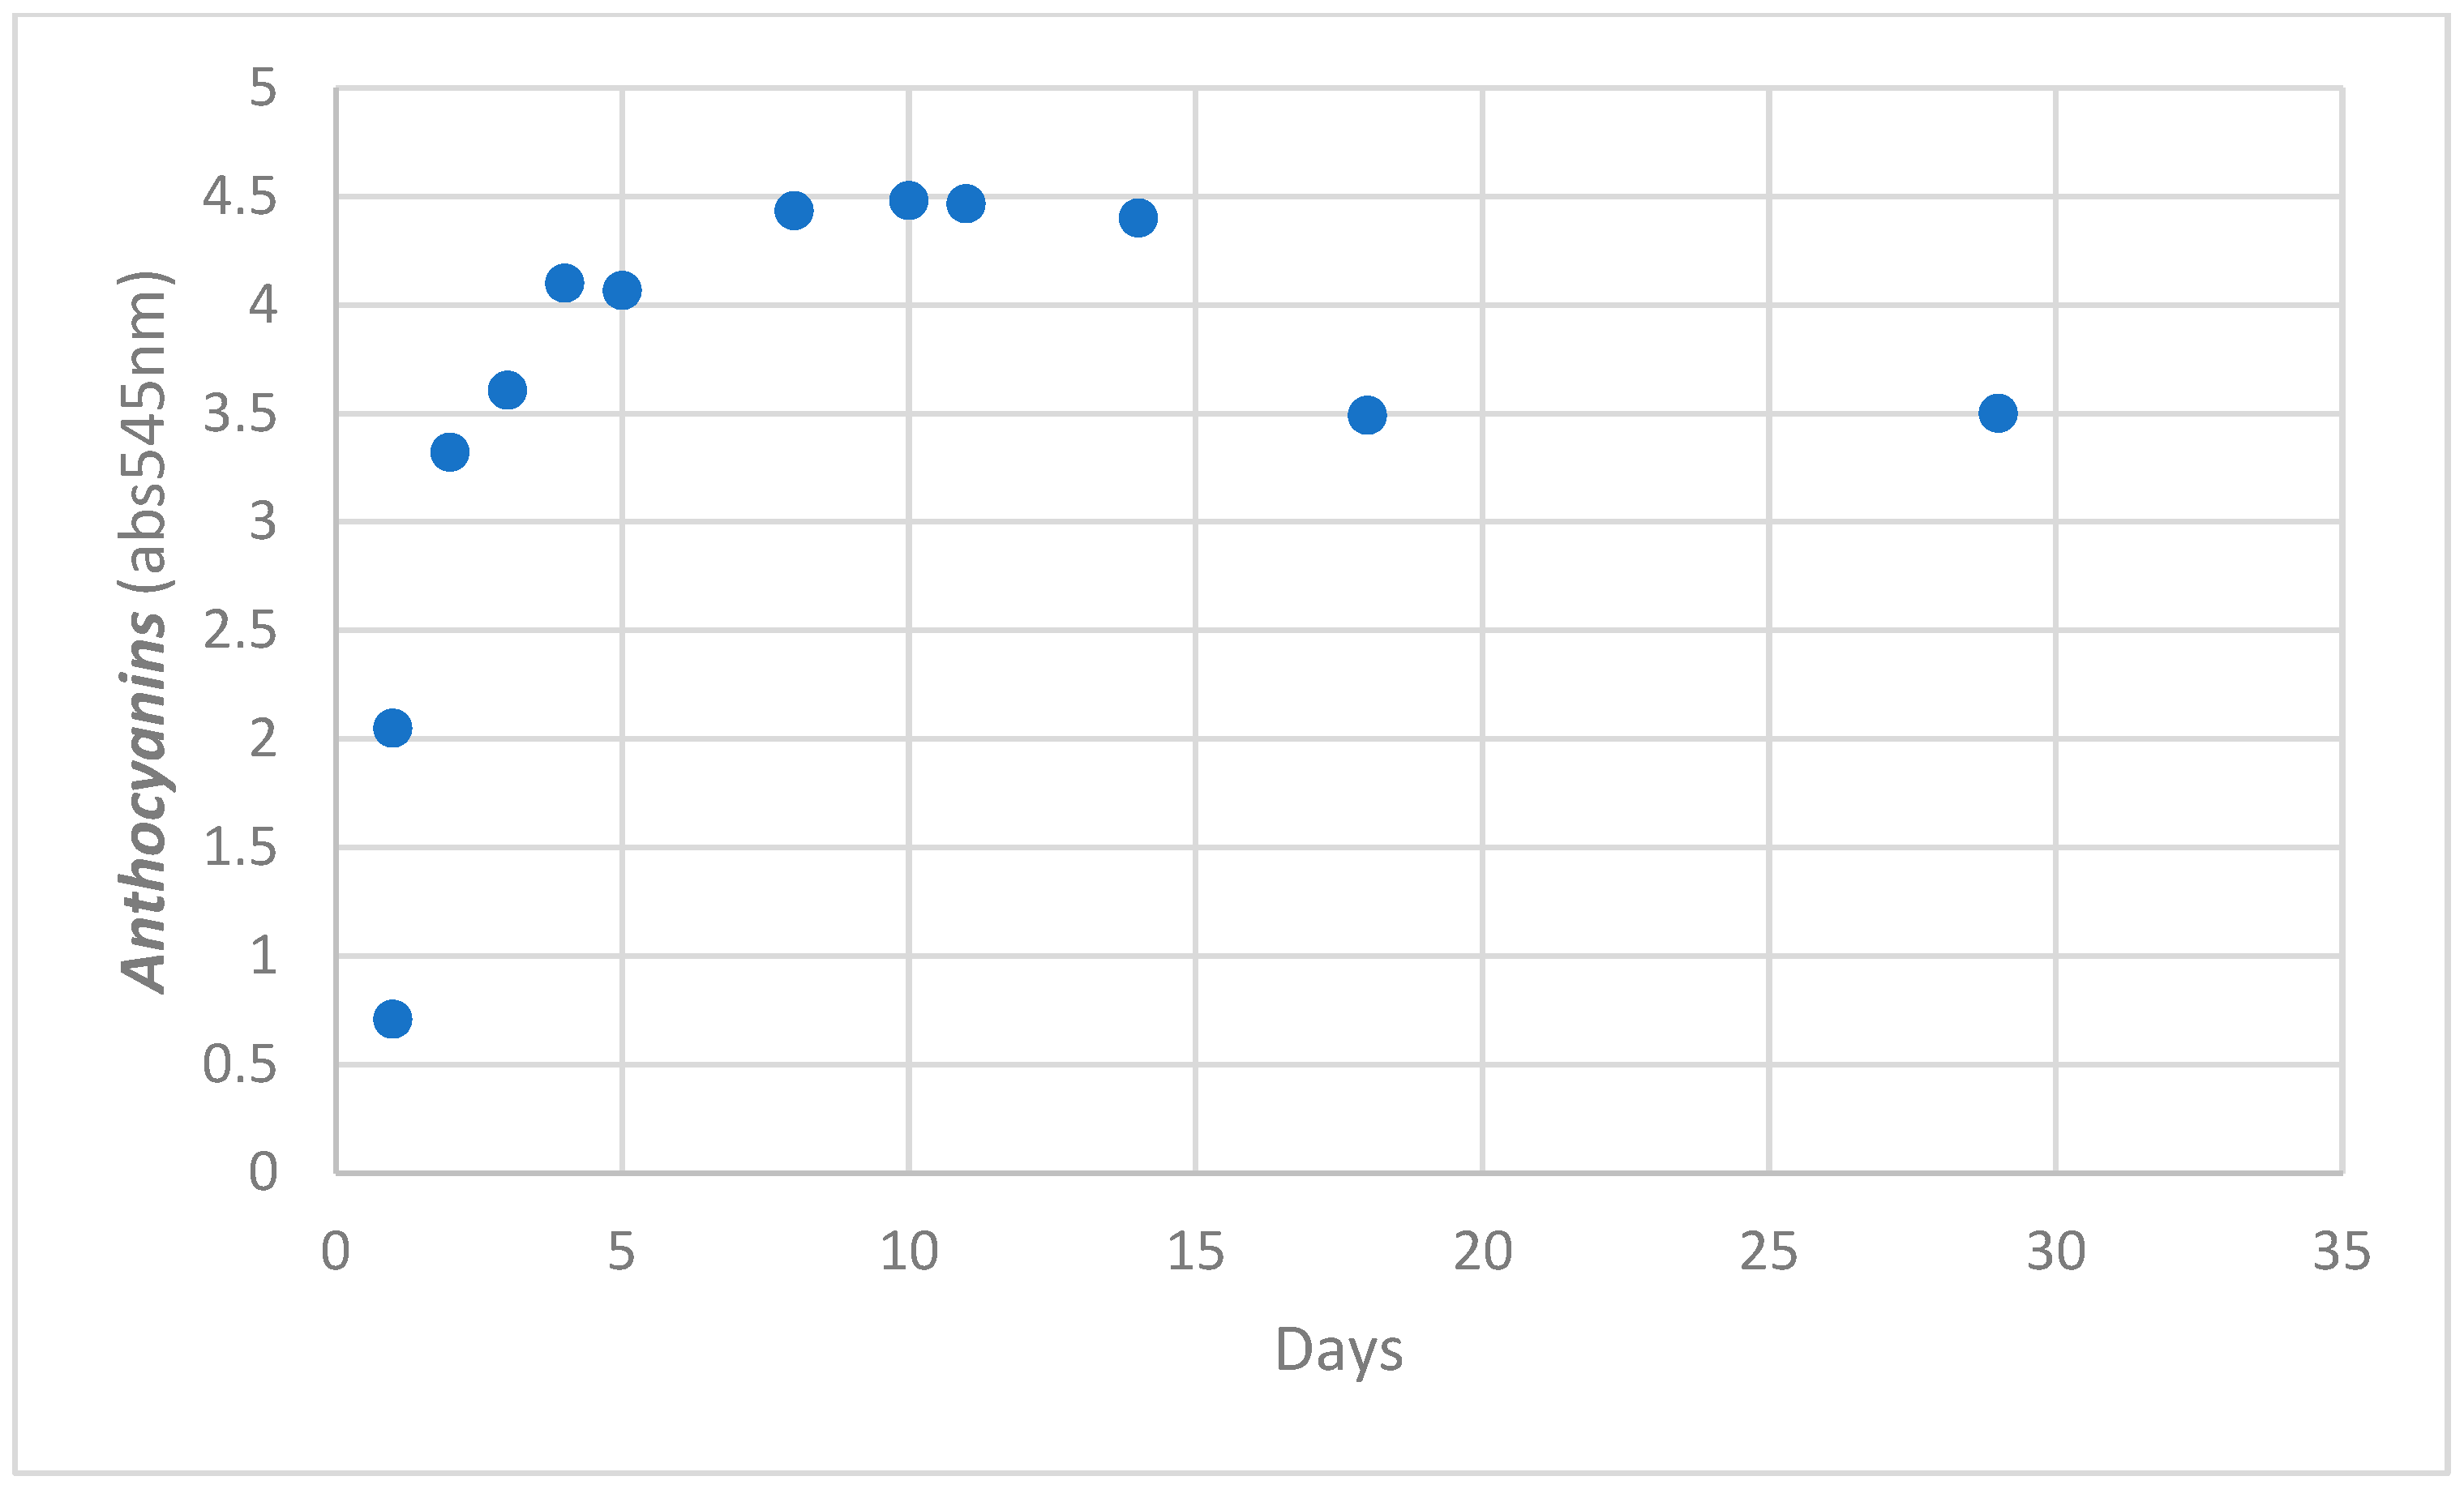
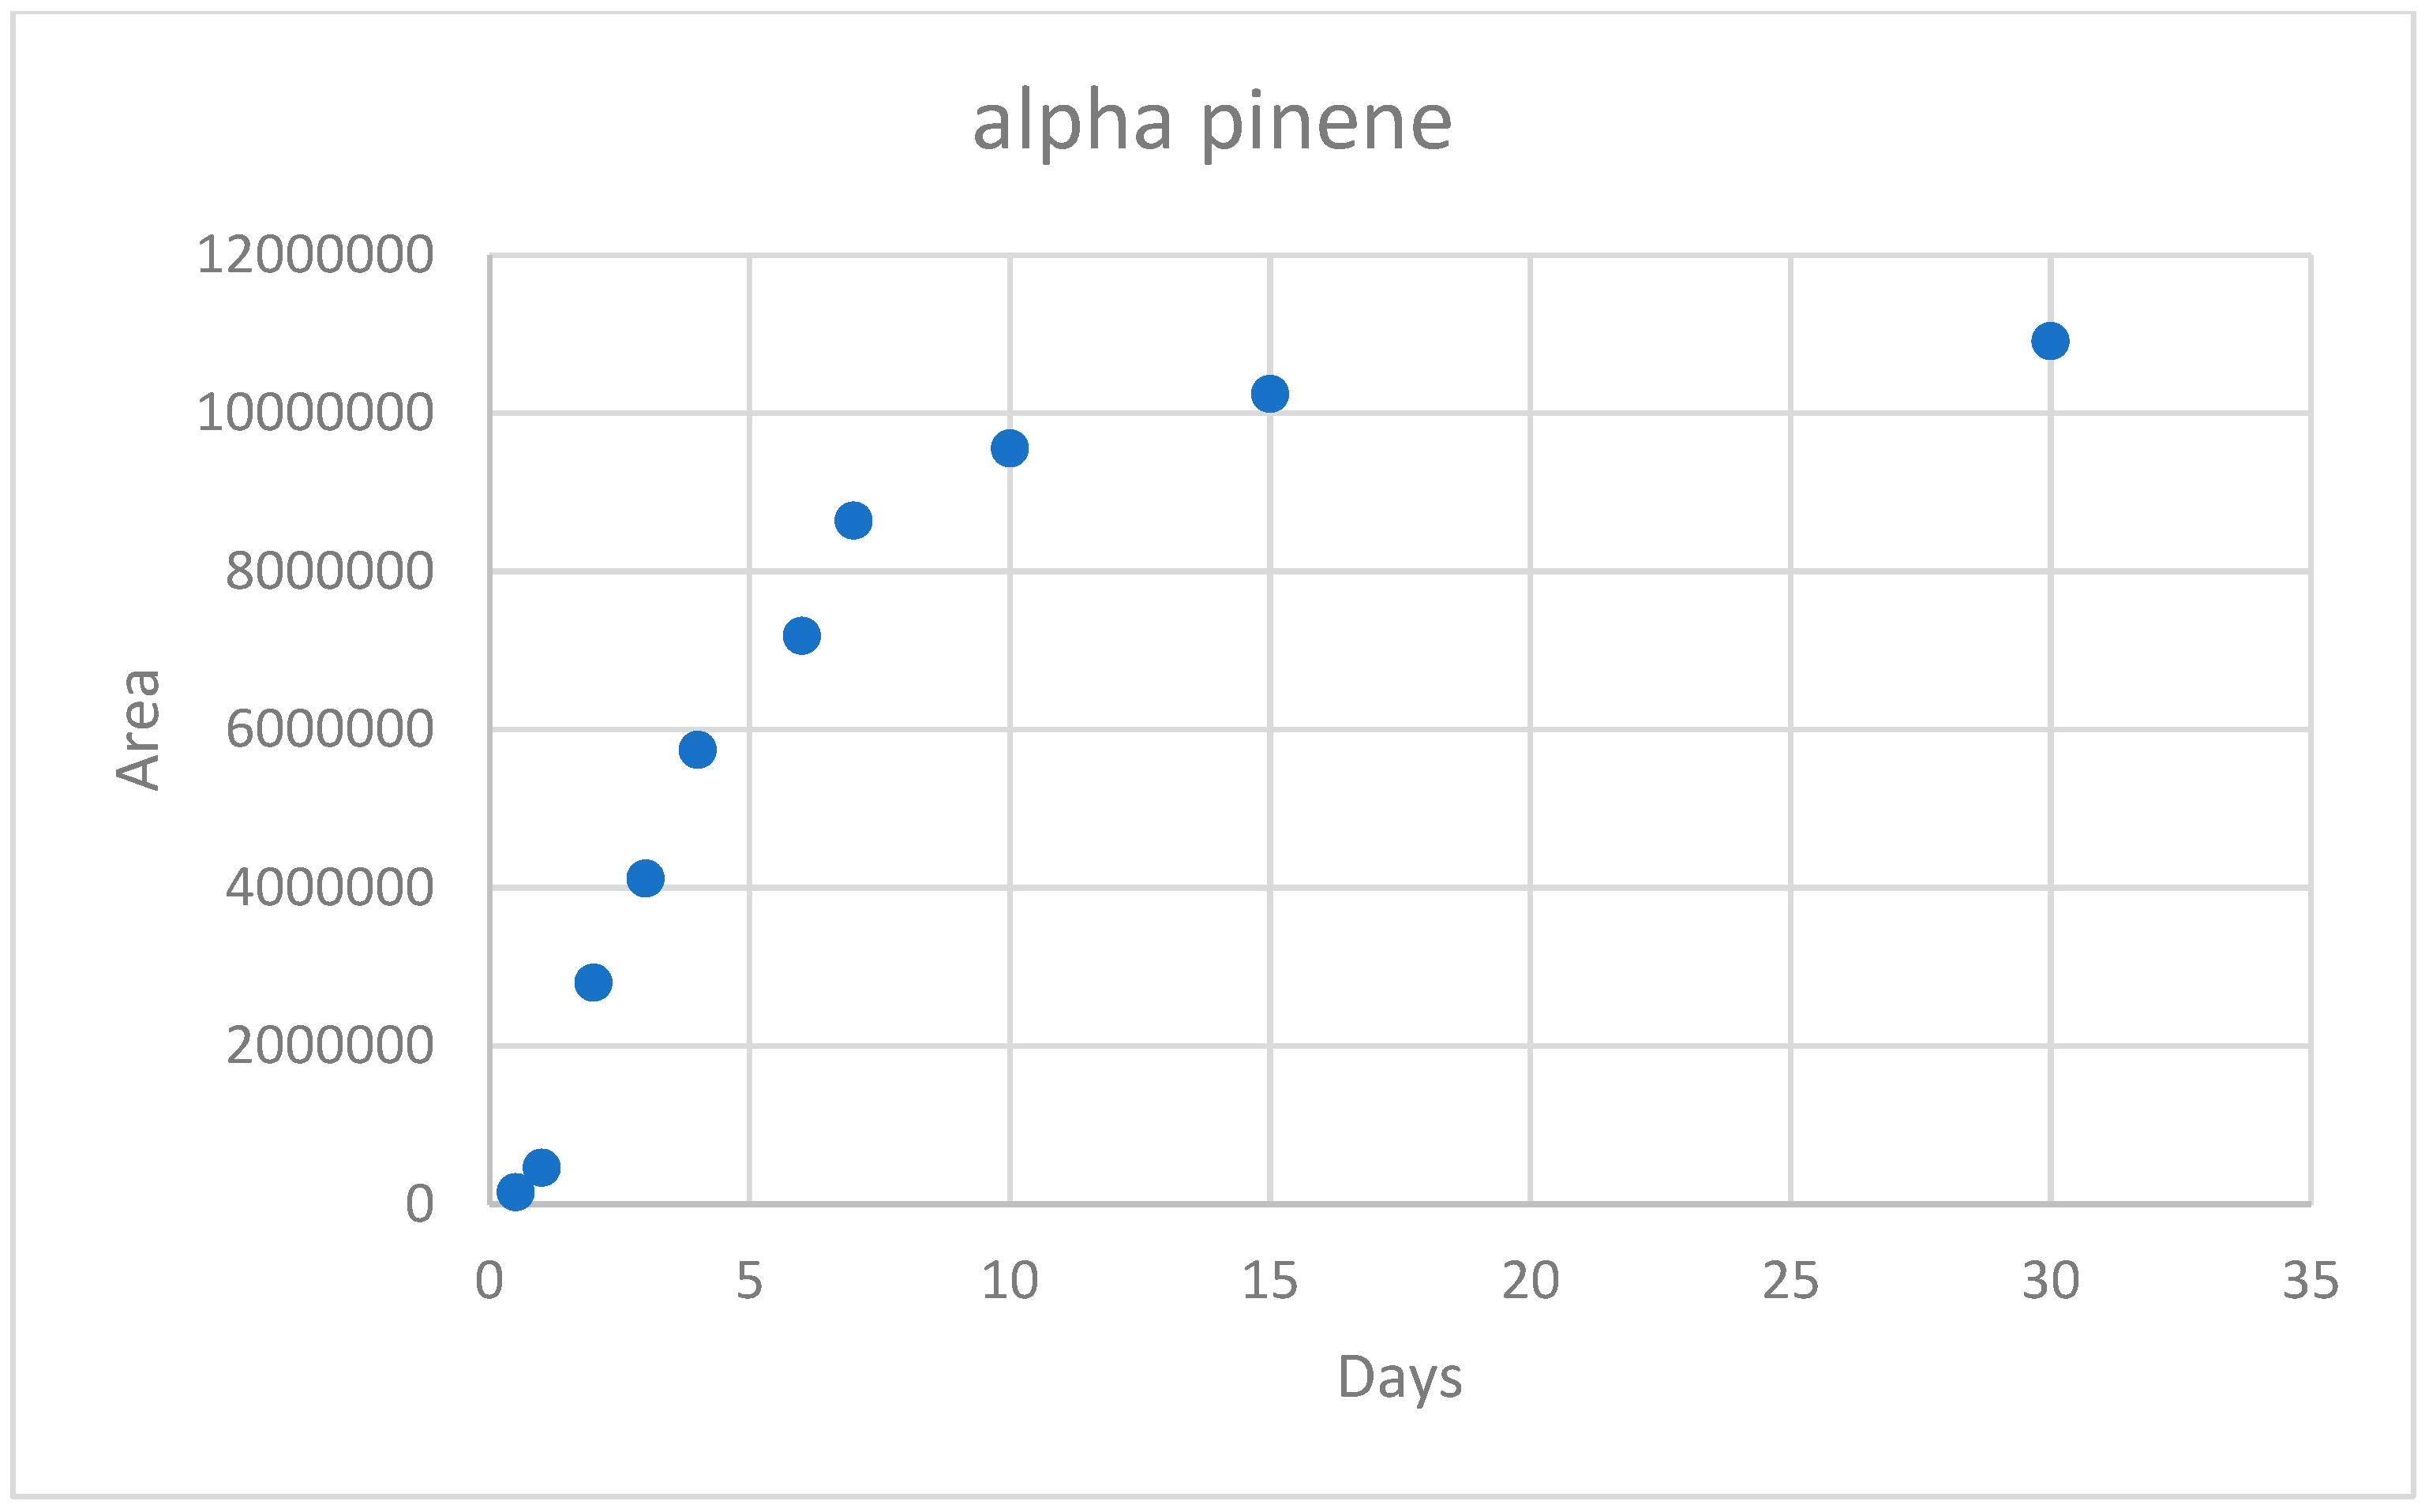
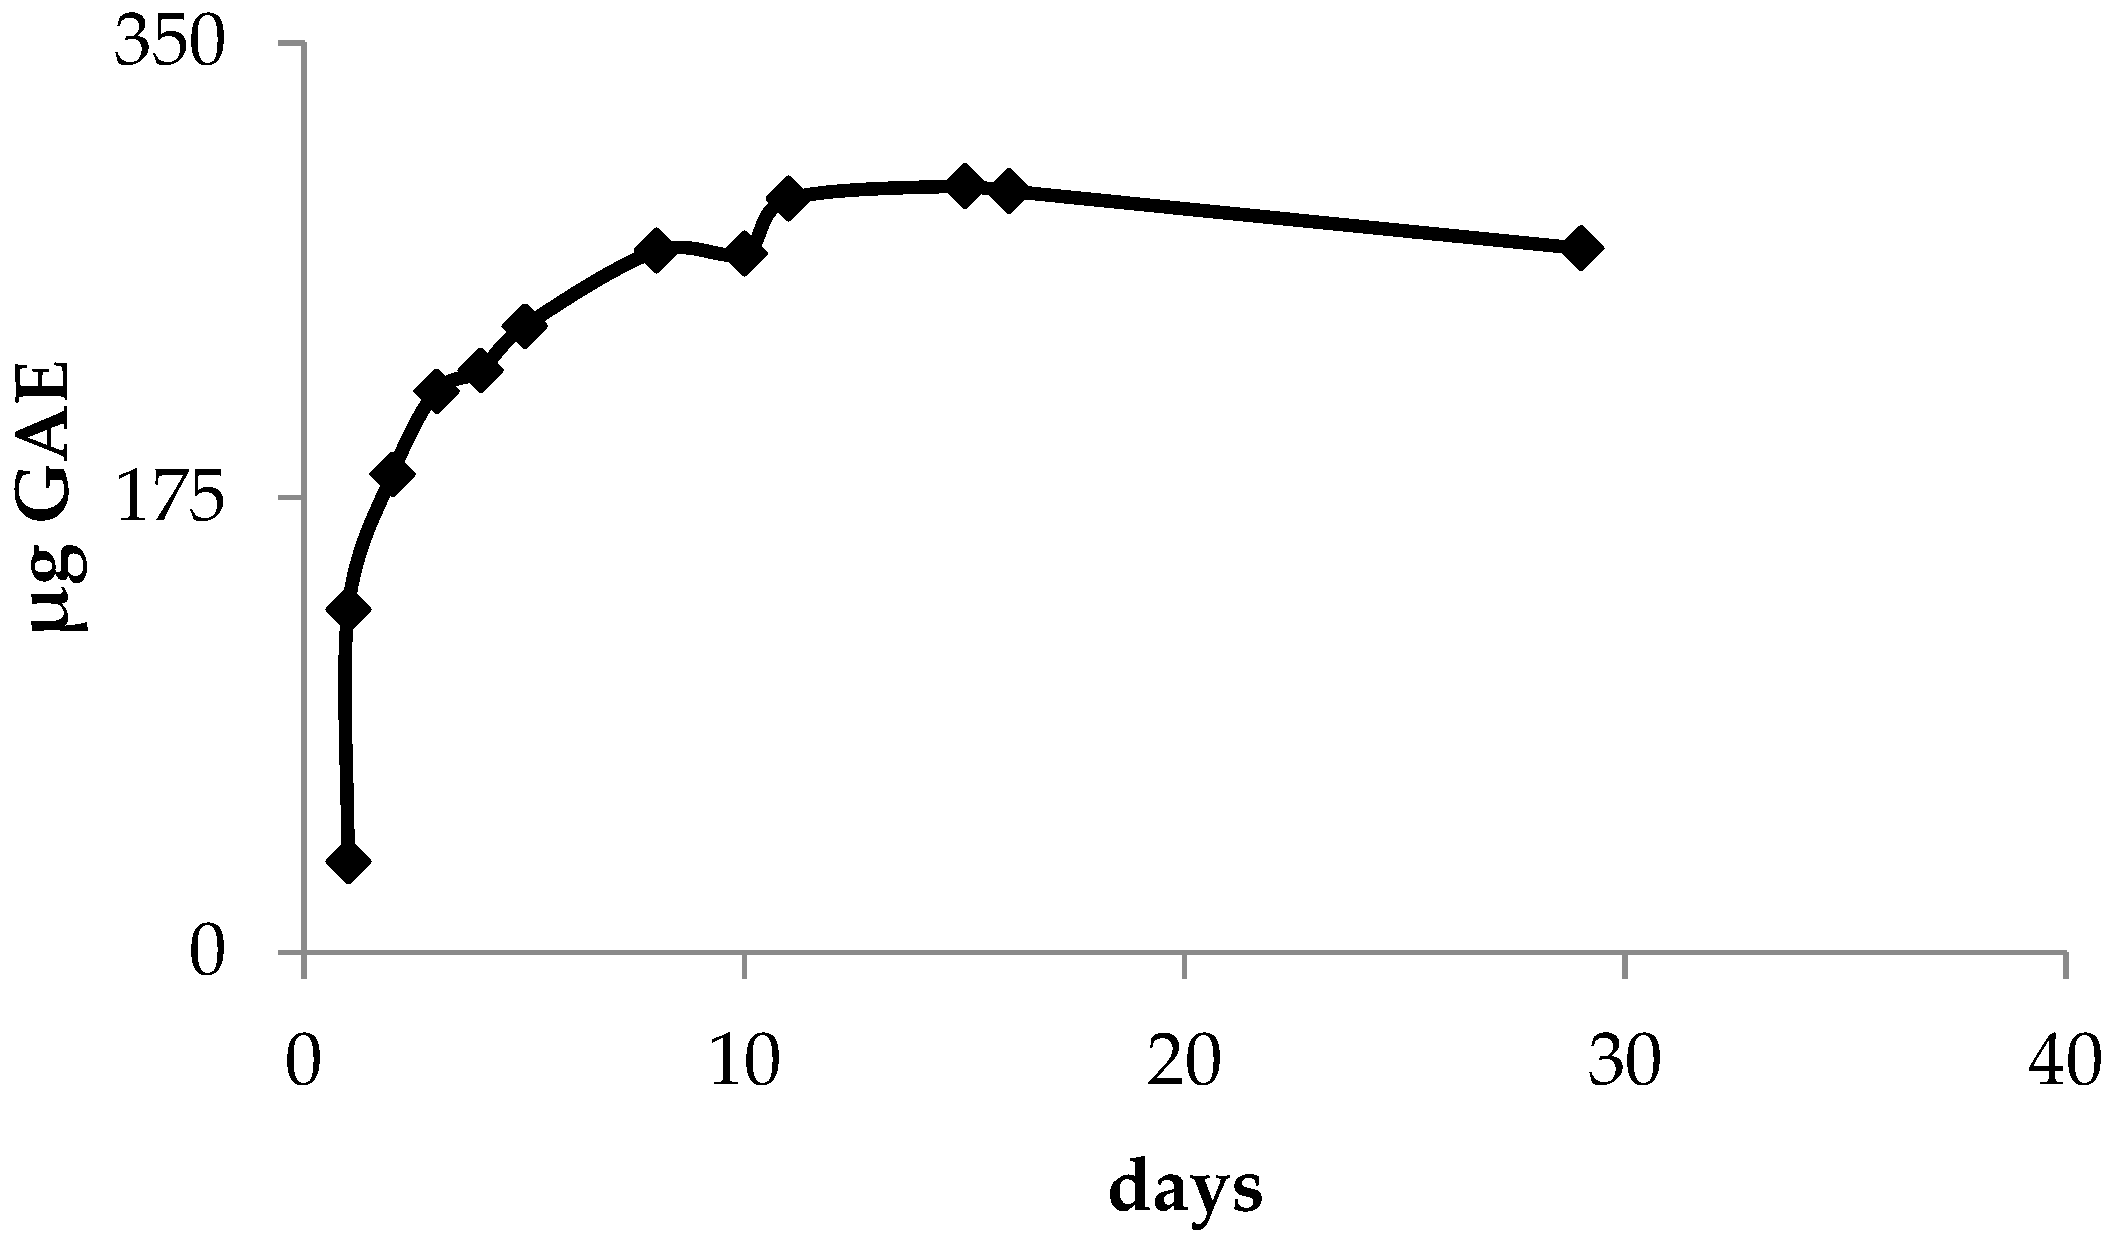
3.2. Kinetics Measurement

Once the experimental conditions were established, a study on the extraction kinetics was conducted by monitoring the total anthocyanins, alpha-pinene content, and total polyphenols in the extract as a function of the time. Specifically, the extraction kinetics were studied over a period of 30 days. Since the objective of the analyses was to monitor the extraction kinetics, the analyses were conducted by measuring the relative differences in the various parameters, without focusing on the quantitative values.

3.3. Anthocyanin Measurements

The anthocyanin content was monitored by measuring the absorbance of the extracts at 545 nm, the typical wavelength where these molecules exhibit maximum absorption. As shown in the Figure 7, the quantity of anthocyanins increased up to 10 days, then plateaued, before gradually decreasing over the subsequent 15 days. This trend in the concentration of these compounds can be explained by considering the extremely low stability of anthocyanins, which is influenced by a wide range of parameters, such as the relative humidity, light, pH, temperature, sugars (acylated and non-acylated), vitamin C, oxygen levels, sulfur dioxide or sulfites, enzymes, co-pigments, and metal ions [11]. Additionally, partial reabsorption of these compounds into the plant material still in infusion cannot be excluded. The similar kinetics of anthocyanins extraction have been well-documented during the red wine production [21]. Therefore, although these factors and processes can lead to changes in the concentration and bioactivity of anthocyanins, our experimental selection might maximize the anthocyanin content in the final product procedure.

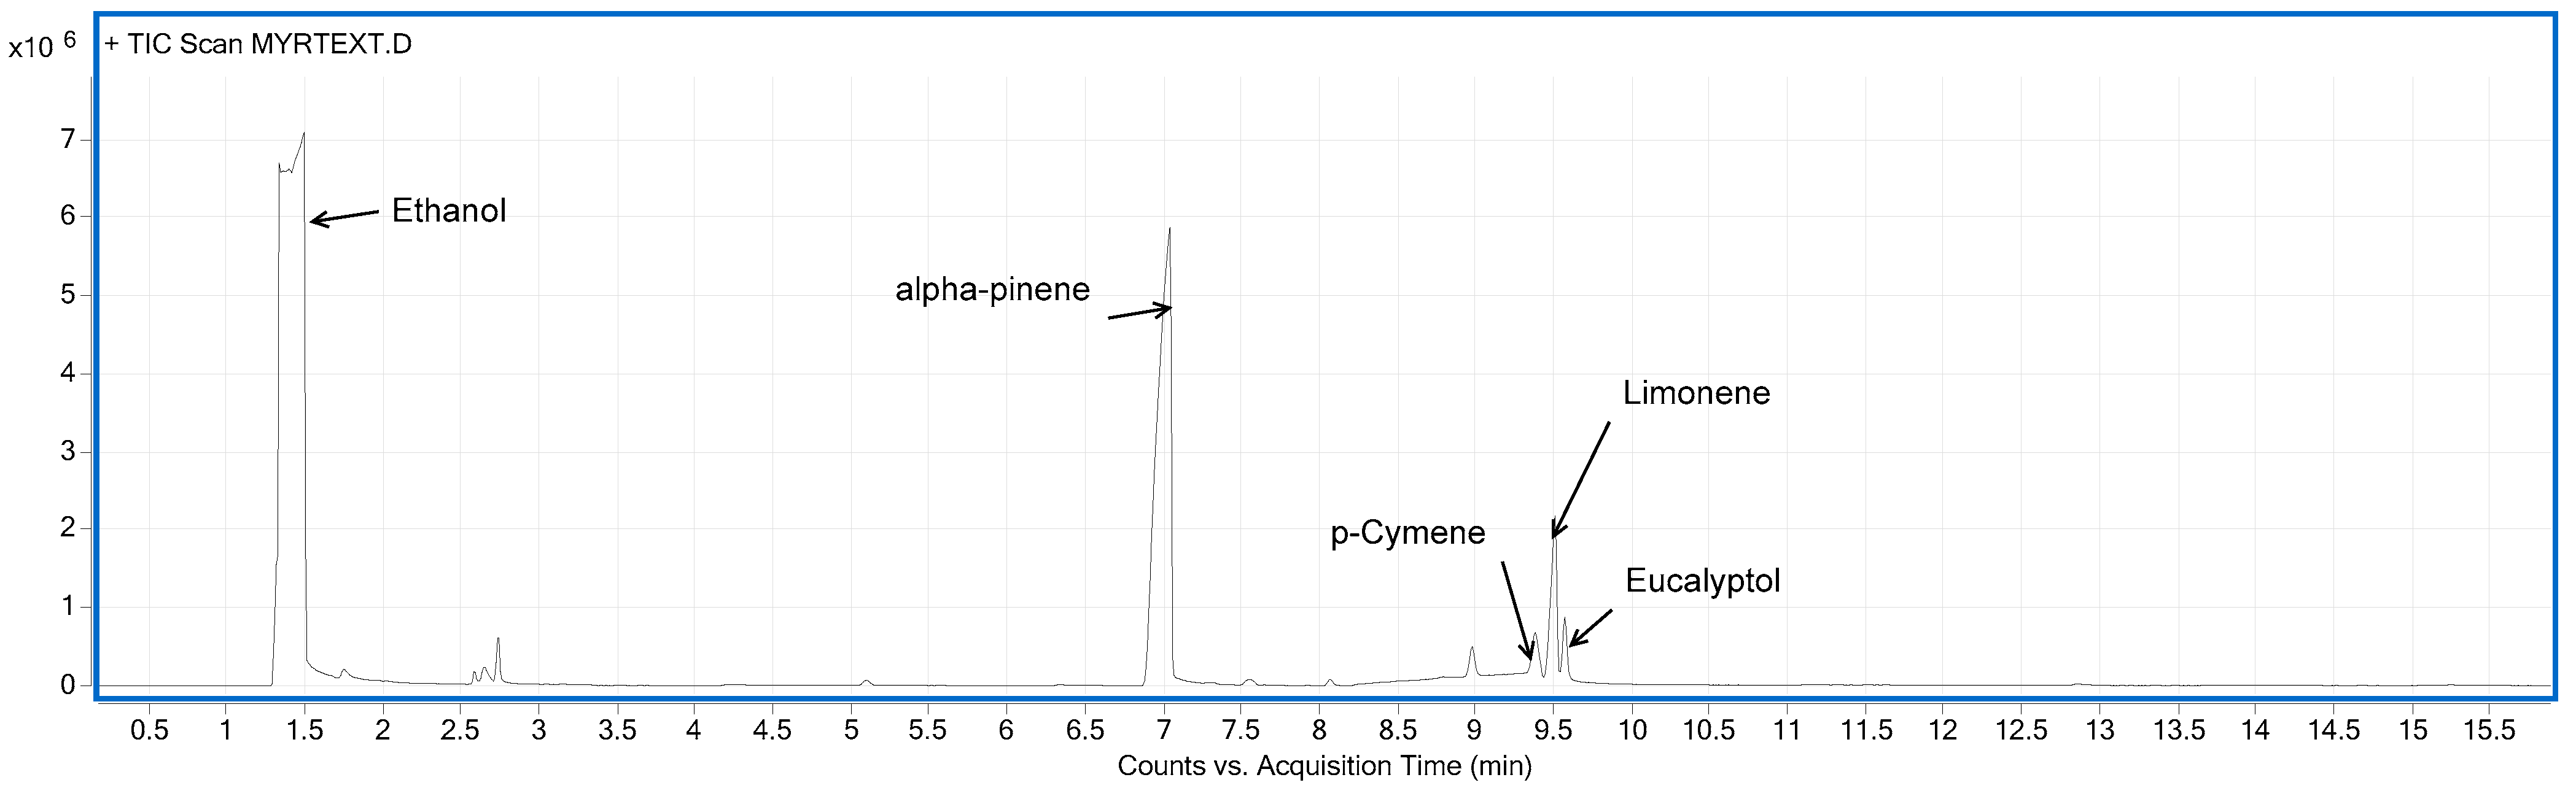
3.4. Volatile Organic Compounds

Recently, Usai and collaborators studied the chemical variability of the volatiles from myrtle berries belonging to the leucocarpa and melanocarpa varieties, totaling 52 samples. Although the chemical composition of the volatiles from myrtle berries shows significant variability, the volatile fraction is consistently characterized by three main compounds: alpha-pinene, limonene, and 1,8-cineole. The authors also highlighted that alpha-pinene was always the principal compound in the volatile fraction [3]. The same samples previously used for the anthocyanin analysis were subjected to solid-phase microextraction followed by gas chromatographic analysis. The analysis of the gas chromatograms confirmed the literature data on myrtle berries, showing a predominance of alpha-pinene, followed by limonene, eucalyptol and p-cymene (Figure 8).
Therefore, also considering the results reported by Usai and coworkers [3], the trend of the total volatile organic compounds were monitored by selecting and analyzing the area corresponding to alpha-pinene in the gas chromatograms (Figure 9).

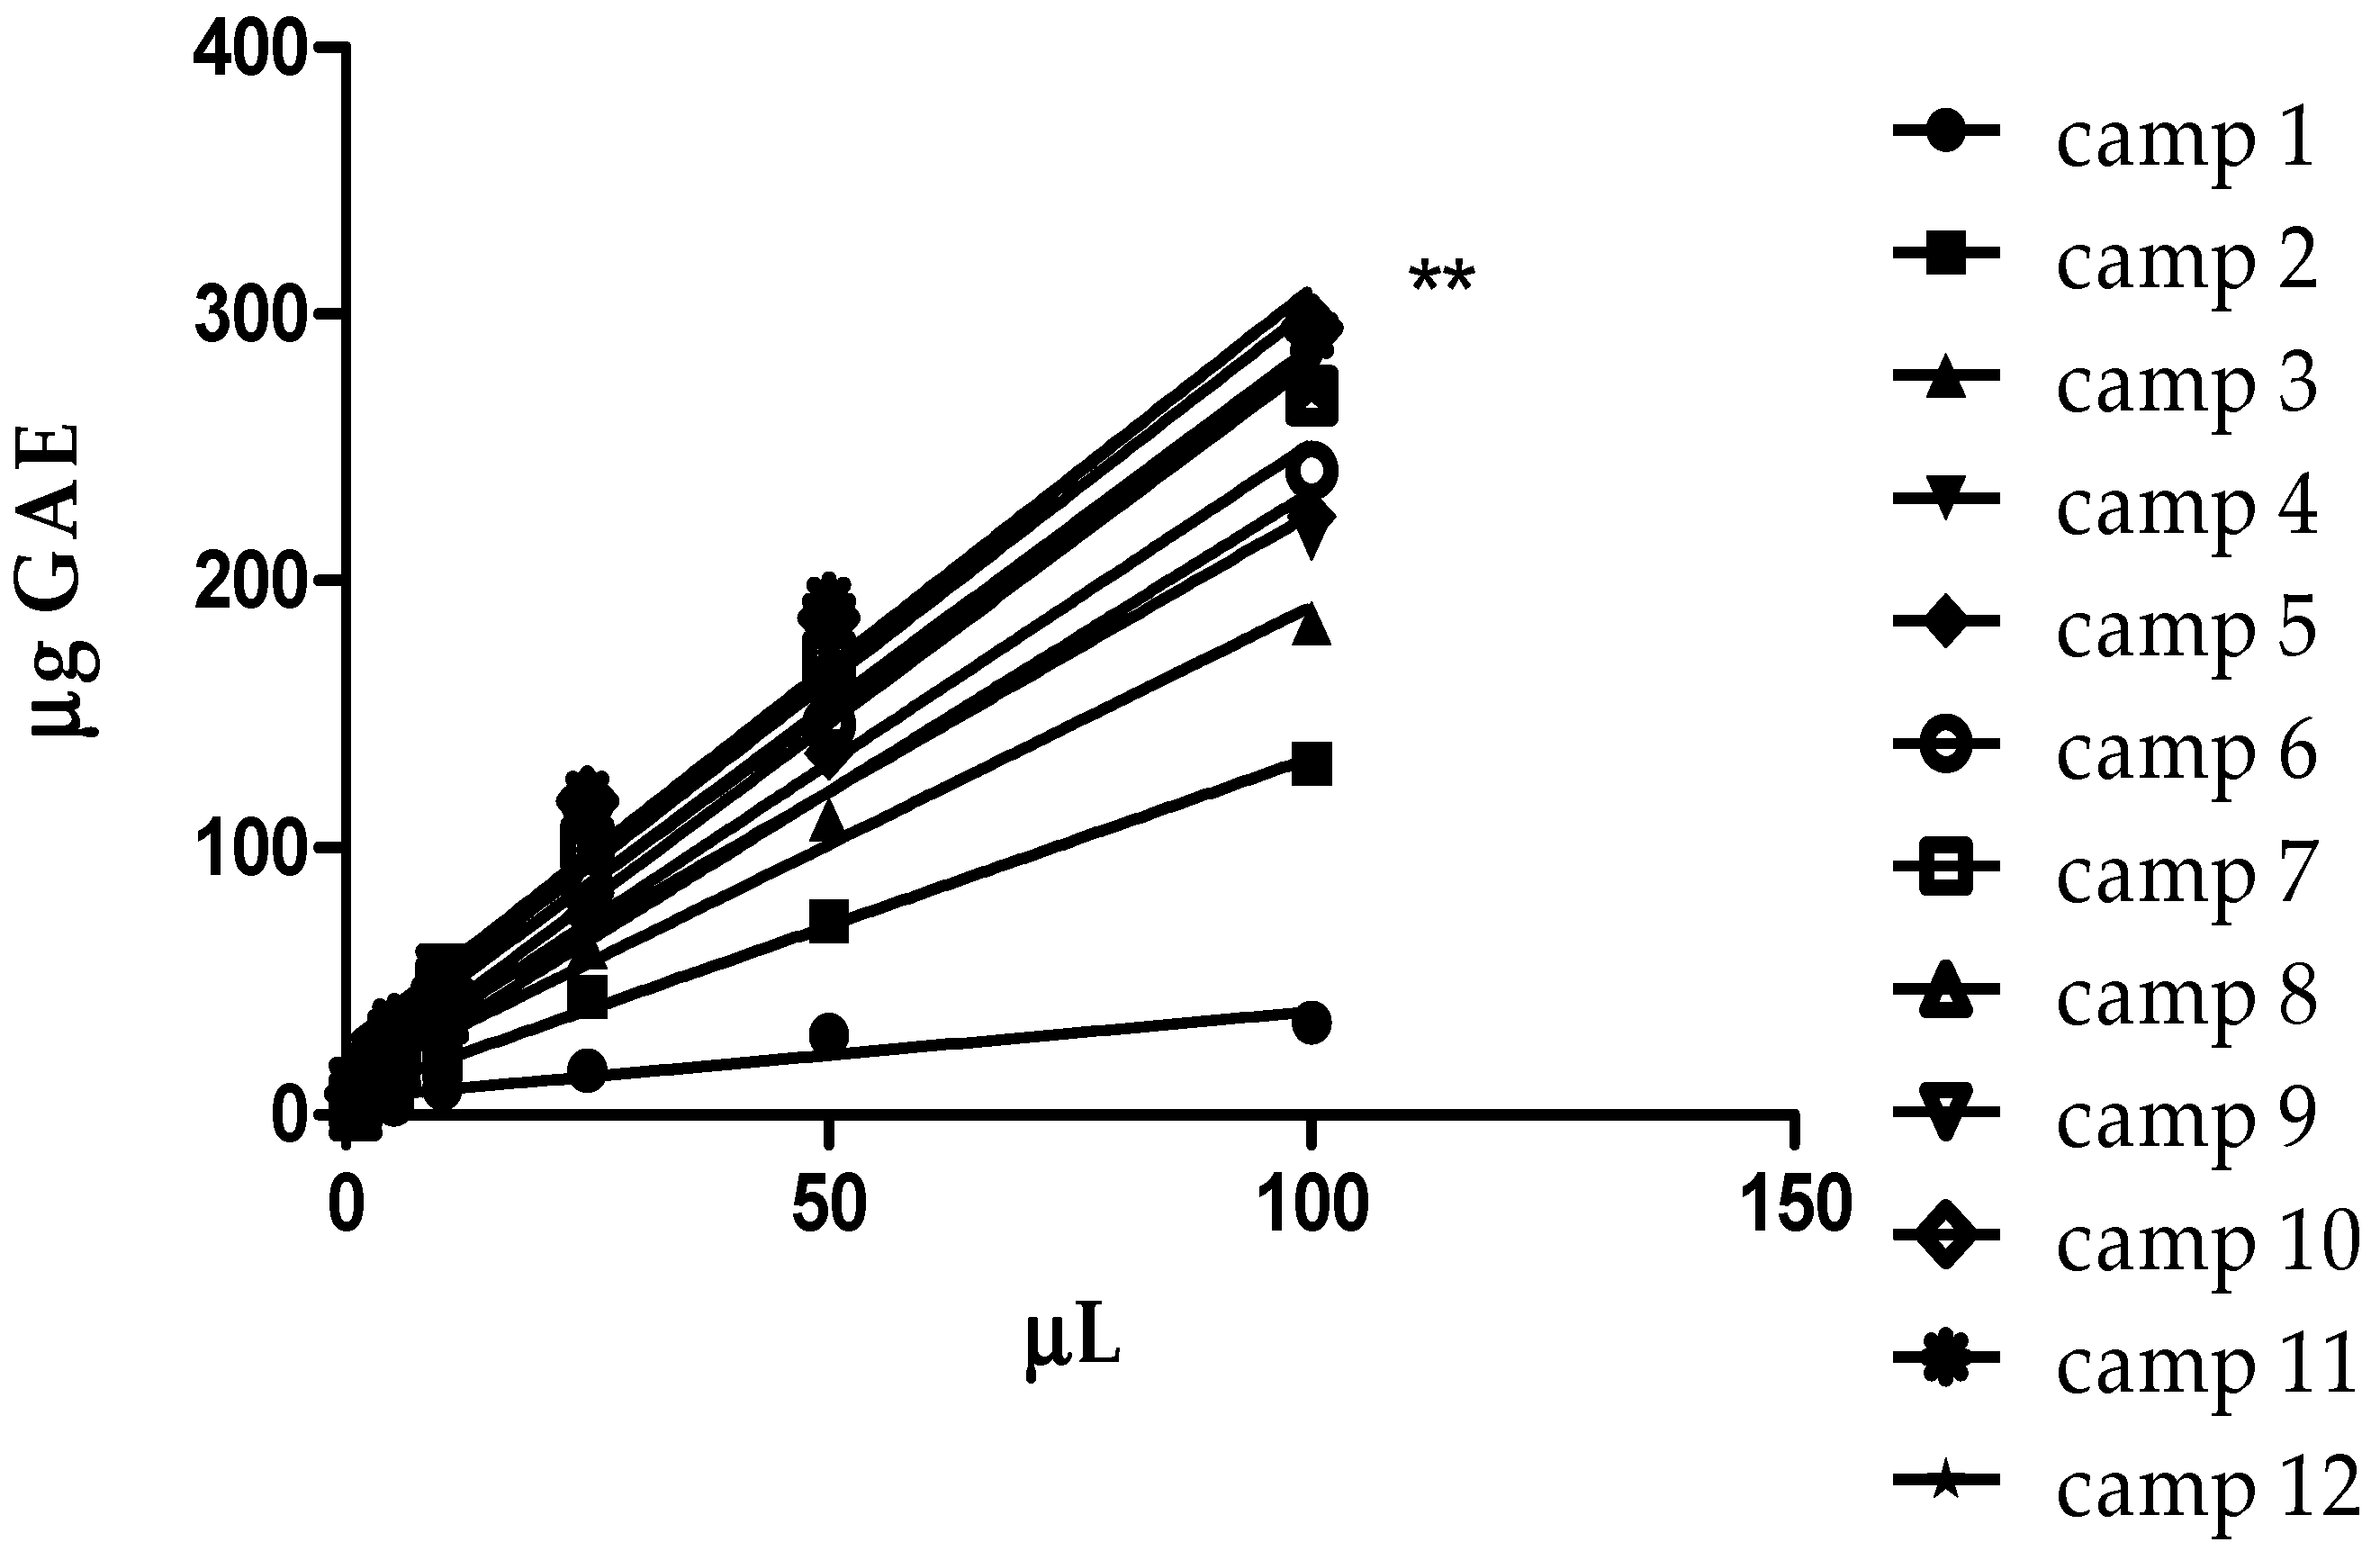
3.5. Total Polyphenols

The total polyphenols profile versus the time during the extraction process was assessed using the Folin–Ciocalteu method. As reported in Figure 10, the highest value for the total polyphenols extraction, expressed as GAE, was reached after 14–15 days (295 µg GAE).
As expected, the shape of the curve describing the total polyphenols during extraction is similar to the one obtained during anthocyanins monitoring. However, a different variation in the maximum of the analyte concentration is observed (10 days for anthocyanins and 15 days of polyphenols, respectively). A similar trend was already reported during the extraction of anthocyanins and polyphenols from grapes in red wine production [23,24].
The data relative to the samples at different extraction times were (camp1–camp12) were used for a linear regression (Figure 10). If we considered the differences between the linear regressions, the slopes (camp1–camp 12) were significantly different, with a p-value < 0.0001 for all the samples (Figure 11).
The plot in Figure 11 confirms statistically relevant differences for the samples analyzed after different extraction times, which is in accordance with the already observed different composition (e.g., anthocyanins and phenolic content). These differences are less appreciable after large extraction times (vide ultra).

4. Conclusions

The optimization of the extraction parameters for Myrtus communis berries has been studied for the first time using a Design of Experiments approach. Multivariate analysis of the effect of the time, concentration of biomasses, temperature, and ethanol percentage on the ability to extract anthocyanins revealed many relevant effects. The ethanol amount, the concentration of biomasses, and the temperature have been revealed as determinant factors in relation to the anthocyanins content of the resulting liqueur. On the other hand, the treatment time itself was not relevant for the outcome of the process, while its combination with the percentage of ethanol revealed an important synergic effect. Finally, an additional synergy between the temperature and the ethanol amount was found, completing the overview of relevant parameters and combinations to be tuned to predict the extraction outcome. Through a regression analysis, the statistical model was parametrized for practical applications. Looking at the kinetic profile of the polyphenol fraction, a decrease in the extraction capability for prolonged maceration times (over twenty days) is observed, which suggests avoiding high temperatures when processing. Surface responding analysis, on the other hand, provides a highly useful tool to cope with this issue, allowing adjustment of all the process parameters depending on the temperature required by keeping the extraction performance high.

Author Contributions

Conceptualization, A.M. and G.L.P.; methodology, A.M. and G.L.P.; software, A.M. and G.L.P.; investigation, R.A.; resources, G.L.P. and G.P.; data curation, A.M. and G.L.P.; writing—original draft preparation, R.A., A.M. and G.L.P.; writing—review and editing, A.M., G.L.P. and G.P. All authors have read and agreed to the published version of the manuscript.

Funding

This research received no external funding.

Institutional Review Board Statement

Not applicable.

Informed Consent Statement

Not applicable.

Data Availability Statement

The data presented in this study are available on request from the corresponding author.

Conflicts of Interest

The authors declare no conflicts of interest.

References

  1. Migliore, J.; Baumel, A.; Juin, M.; Médail, F. From Mediterranean shores to central Saharan mountains: Key phylogeographical insights from the genus Myrtus. J. Biogeogr. 2012, 39, 942–956. [Google Scholar] [CrossRef]
  2. Usai, M.; Marchetti, M.; Mulas, M. Chemical composition of essential oils of leaves and flowers from five cultivars of myrtle (Myrtus communis L.). J. Essent. Oil Res. 2015, 27, 465–476. [Google Scholar] [CrossRef]
  3. Usai, M.; Marchetti, M.; Culeddu, N.; Mulas, M. Chemical composition of Myrtle (Myrtus communis L.) berries essential oils as observed in a collection of genotypes. Molecules 2018, 23, 2502. [Google Scholar] [CrossRef] [PubMed]
  4. Mulas, M. The myrtle (Myrtus communis L.) case: From a wild shrub to a new fruit crop. ISHS Acta Hortic. 2012, 948, 235–242. [Google Scholar] [CrossRef]
  5. Tuberoso, C.I.G.; Orrù, C.D. Myrtle (Myrtus communis L.) berries: Composition and properties. In Berries: Properties, Consumption and Nutrition; Tuberoso, C.I.G., Ed.; Nova Science Publishers, Inc.: Hauppauge, NY, USA, 2012; pp. 145–155. [Google Scholar]
  6. Tuberoso, C.I.G.; Barra, A.; Cabras, P. Effect of different technological processes on the chemical composition of myrtle (Myrtus communis L.) alcoholic extracts. Eur. Food Res. Technol. 2008, 226, 801–808. [Google Scholar] [CrossRef]
  7. Mannu, A.; Ferro, M.; Colombo Dugoni, G.; Panzeri, W.; Petretto, G.L.; Urgeghe, P.; Mele, A. Improving the recycling technology of waste cooking oils: Chemical fingerprint as tool for non-biodiesel application. Waste Manag. 2019, 96, 1–8. [Google Scholar] [CrossRef]
  8. Nejrotti, S.; Mannu, A.; Blangetti, M.; Baldino, S.; Fin, A.; Prandi, C. Optimization of Nazarov Cyclization of 2, 4-Dimethyl-1, 5-diphenylpenta-1, 4-dien-3-one in Deep Eutectic Solvents by a Design of Experiments Approach. Molecules 2020, 25, 5726. [Google Scholar] [CrossRef] [PubMed]
  9. Mannu, A.; Ferro, M.; Colombo Dugoni, G.; Di Pietro, M.E.; Garroni, S.; Mele, A. From deep eutectic solvents to deep band gap systems. J. Mol. Liq. 2020, 301, 112441. [Google Scholar] [CrossRef]
  10. Sarais, G.; D’Urso, G.; Lai, C.; Pirisi, F.M.; Pizza, C.; Montoro, P. Targeted and untargeted mass spectrometric approaches in discrimination between Myrtus communis cultivars from Sardinia region. J. Mass Spectrom. 2016, 51, 704–715. [Google Scholar] [CrossRef]
  11. Boulton, R. The Copigmentation of Anthocyanins and Its Role in the Color of Red Wine: A Critical Review. Am. J. Enol. Vitic. 2001, 52, 67–87. [Google Scholar] [CrossRef]
  12. Dao, L.T.; Takeoka, G.R.; Edwards, R.H.; Berrios, J.D.J. Improved method for the stabilization of anthocyanidins. J. Agric. Food Chem. 1998, 46, 3564–3569. [Google Scholar] [CrossRef]
  13. Malien-Aubert, C.; Dangles, O.; Amiot, M.J. Color stability of commercial anthocyanin-based extracts in relation to the phenolic composition. Protective effects by intra- and intermolecular copigmentation. J. Agric. Food. Chem. 2001, 49, 170–176. [Google Scholar] [CrossRef] [PubMed]
  14. Tuberoso, C.I.G.; Melis, M.; Angioni, A.; Pala, M.; Cabras, P. Myrtle hydroalcoholic extracts obtained from different selections of Myrtus communis L. Food Chem. 2007, 101, 806–811. [Google Scholar] [CrossRef]
  15. Available online: https://eur-lex.europa.eu/legal-content/IT/TXT/PDF/?uri=CELEX:32008R0110 (accessed on 6 July 2024).
  16. Bianchin, J.N.; Nardini, G.; Merib, J.; Neves Dias, A.; Martendal, E.; Carasek, E. Screening of volatile compounds in honey using a new sampling strategy combining multiple extraction temperatures in a single assay by HS-SPME-GC-MS. Food Chem. 2014, 145, 1061–1065. [Google Scholar] [CrossRef] [PubMed]
  17. Weissman, S.A.; Anderson, N.G. Design of experiments (DoE) and process optimization. A review of recent publications. Org. Process. Res. Dev. 2015, 19, 1605–1633. [Google Scholar] [CrossRef]
  18. Peng, X.; Yang, G.; Shi, Y.; Zhou, Y.; Zhang, M.; Li, S. Box–behnken design based statistical modeling for the extraction and physicochemical properties of pectin from sunflower heads and the comparison with commercial low-methoxyl pectin. Sci. Rep. 2020, 10, 3595. [Google Scholar] [CrossRef]
  19. Ferro, M.; Mannu, A.; Panzeri, W.; Theeuwen, C.H.J.; Mele, A. An integrated approach to optimizing cellulose mercerization. Polymers 2020, 12, 1559. [Google Scholar] [CrossRef] [PubMed]
  20. Mannu, A.; Ferro, M.; Colombo Dugoni, G.; Garroni, S.; Taras, A.; Mele, A. Response surface analysis of density and flash point in recycled waste cooking oils. Chem. Data Collect. 2020, 25, 100329. [Google Scholar] [CrossRef]
  21. Alagumurthi, N.; Palaniradja, K.; Soundararajan, V. Optimization of grinding process through design of experiment (DOE)—A comparative study. Mater. Manuf. Process. 2006, 21, 19–21. [Google Scholar] [CrossRef]
  22. Dopar, M.; Kusic, H.; Koprivanac, N. Treatment of simulated industrial wastewater by photo-fenton process. Part I: The optimization of process parameters using design of experiments (DOE). Chem. Eng. J. 2011, 173, 267–279. [Google Scholar] [CrossRef]
  23. Sacchi, K.L.; Bisson, L.F.; Adams, D.O. A Review of the Effect of Winemaking Techniques on Phenolic Extraction in Red Wines. Effect of Winemaking Techniques on Phenolic Extraction. Am. J. Enol. Vitic. 2005, 56, 197. [Google Scholar] [CrossRef]
  24. Carew, A.L.; Kerslake, F.L.; Bindon, K.A.; Smith, P.A.; Close, D.C.; Dambergs, R.G. Viticultural and Controlled Phenolic Release Treatments Affect Phenolic Concentration and Tannin Composition in Pinot noir Wine. Am. J. Enol. Vitic. 2020, 71, 256–265. [Google Scholar] [CrossRef]
Figure 1. Pareto plot for the considered factors and their combinations.
Applsci 14 05973 g001
Figure 2. Main effects plot—anthocyanin content.
Applsci 14 05973 g002
Figure 3. Pareto plot for the volatiles content.
Applsci 14 05973 g003
Figure 4. Main effect plot for the volatiles content.
Applsci 14 05973 g004
Figure 5. SRA plot for temperature vs. time.
Applsci 14 05973 g005
Figure 6. SRA plot for time vs. EtOH volume/plant weight ratio.
Applsci 14 05973 g006
Figure 7. Monitoring of anthocyanins absorbance at 545 nm versus time.
Applsci 14 05973 g007
Figure 8. GC profile of the extract.
Applsci 14 05973 g008
Figure 9. Variation of the alpha-pinene profile over 30 days.
Applsci 14 05973 g009
Figure 10. Determination of phenols by the Folin–Ciocalteu method. Data are expressed as µg of gallic acid equivalent (GAE).
Applsci 14 05973 g010
Figure 11. Linear regression analysis of phenols amounts of Myrtus communis berry extracts (camp1–camp 12). Data are expressed as mean of 3 independent experiments (** p < 0.0001).
Applsci 14 05973 g011
Table 1. Factors considered and corresponding window of values.
FactorsLowHighUnitsContinuous
Time2040daysYes
v × w12l × kgYes
Temperature2040°CYes
% EtOH8096g/LYes
Table 2. List of the experiments and corresponding values of the outcomes.
RunDaysv × w
(mL × g)
T (°C)[EtOH]ABS
545 nm
Fixed ResidueVolatiles
140140962.10.246,019,156
240120963.30.255,067,420
320240801.90.314,078,820
440240964.20.269,216,100
520140961.30.206,499,873
620120803.60.205,865,395
740120800.70.263,545,460
840140800.40.261,170,427
940220804.10.285,590,749
1020140800.90.291,731,154
1120220964.70.266,447,419
1220240963.80.307,448,706
1340240800.950.322,582,121
1420120961.70.305,446,433
1520220804.70.287,392,442
1640220964.60.268,919,072
v × w 1 = 1:1 (50 v × w = 2:1 (50 mL + 25 g). ABS stands for absorbance.
Table 3. Analysis of variance for the anthocyanin content.
SourceSum of SquaresDfMean SquareF-Ratiop-Value
A: Time0.33062510.3306250.520.5015
B: v × w13.8756113.875622.000.0054
C: Temperature8.8506318.8506314.030.0133
D: % EtOH4.5156314.515637.160.0440
AB0.00562510.0056250.010.9284
AC0.18062510.1806250.290.6155
AD3.7056313.705635.880.0598
BC0.45562510.4556250.720.4341
BD0.52562510.5256250.830.4031
CD2.3256312.325633.690.1129
Table 4. Analysis of variance for the volatiles content.
SourceSum of SquaresDfMean SquareF-Ratiop-Value
A: Time4.89908 × 101114.89908 × 10110.880.3907
B: v × w1.6667 × 101311.6667 × 101330.010.0028
C: Temperature5.67396 × 101215.67396 × 101210.220.0241
D: % EtOH3.33726 × 101313.33726 × 101360.100.0006
AB1.36951 × 101211.36951 × 10122.470.1771
AC9.89477 × 101019.89477 × 10100.180.6905
AD5.71015 × 101215.71015 × 101210.280.0238
BC1.68895 × 101011.68895 × 10100.030.8684
BD1.73622 × 101111.73622 × 10110.310.6002
CD1.62712 × 101311.62712 × 101329.300.0029
Total error2.77652 × 101255.55304 × 1011
Total (corr.)8.26203 × 101315
Table 5. Desirability limits for the SRA.
DesirabilityDesirability
ResponseLowHighGoalWeight
Anthocyanin0.04.0Maximize1.0
Volatiles content1.09.0Maximize1.0
Table 6. Predicted and observed desirability values.
PredictedObserved
RowAnthocyaninVolatile ContentDesirabilityDesirability
14.29.2161 × 1061.01.0
21.94.07882 × 1060.7320780.689202
34.15.59075 × 1060.9278671.0
41.75.44643 × 1060.7147990.65192
52.16.01916 × 1060.7695370.724569
64.76.44742 × 1061.01.0
71.36.49987 × 1060.6007810.570088
83.65.86539 × 1060.8758920.948683
90.91.73115 × 1060.4857340.474342
104.77.39244 × 1061.01.0
113.87.44871 × 1060.9177080.974679
120.73.54546 × 1060.6410440.41833
130.41.17043 × 1060.00.316228
144.68.91907 × 1061.01.0
153.35.06742 × 1060.7974570.908295
160.92.58212 × 1060.5169020.474342
Disclaimer/Publisher’s Note: The statements, opinions and data contained in all publications are solely those of the individual author(s) and contributor(s) and not of MDPI and/or the editor(s). MDPI and/or the editor(s) disclaim responsibility for any injury to people or property resulting from any ideas, methods, instructions or products referred to in the content.

