

Integration of Principal Component Analysis with AHP-QFD for Improved Product Design Decision-Making


Abstract
1. Introduction
2. Literature Review
2.1. AHP and QFD Approach in Product Design Decision Making
2.2. Comparative Analysis of Key Strengths and Limitations of MCDM Methods Combined with QFD
2.3. Integration of PCA to Address QFD Limitation: The Complexity of Matrices
2.3.1. PCA and Its Role in QFD Context
2.3.2. Integration of PCA with QFD
3. Materials and Methods
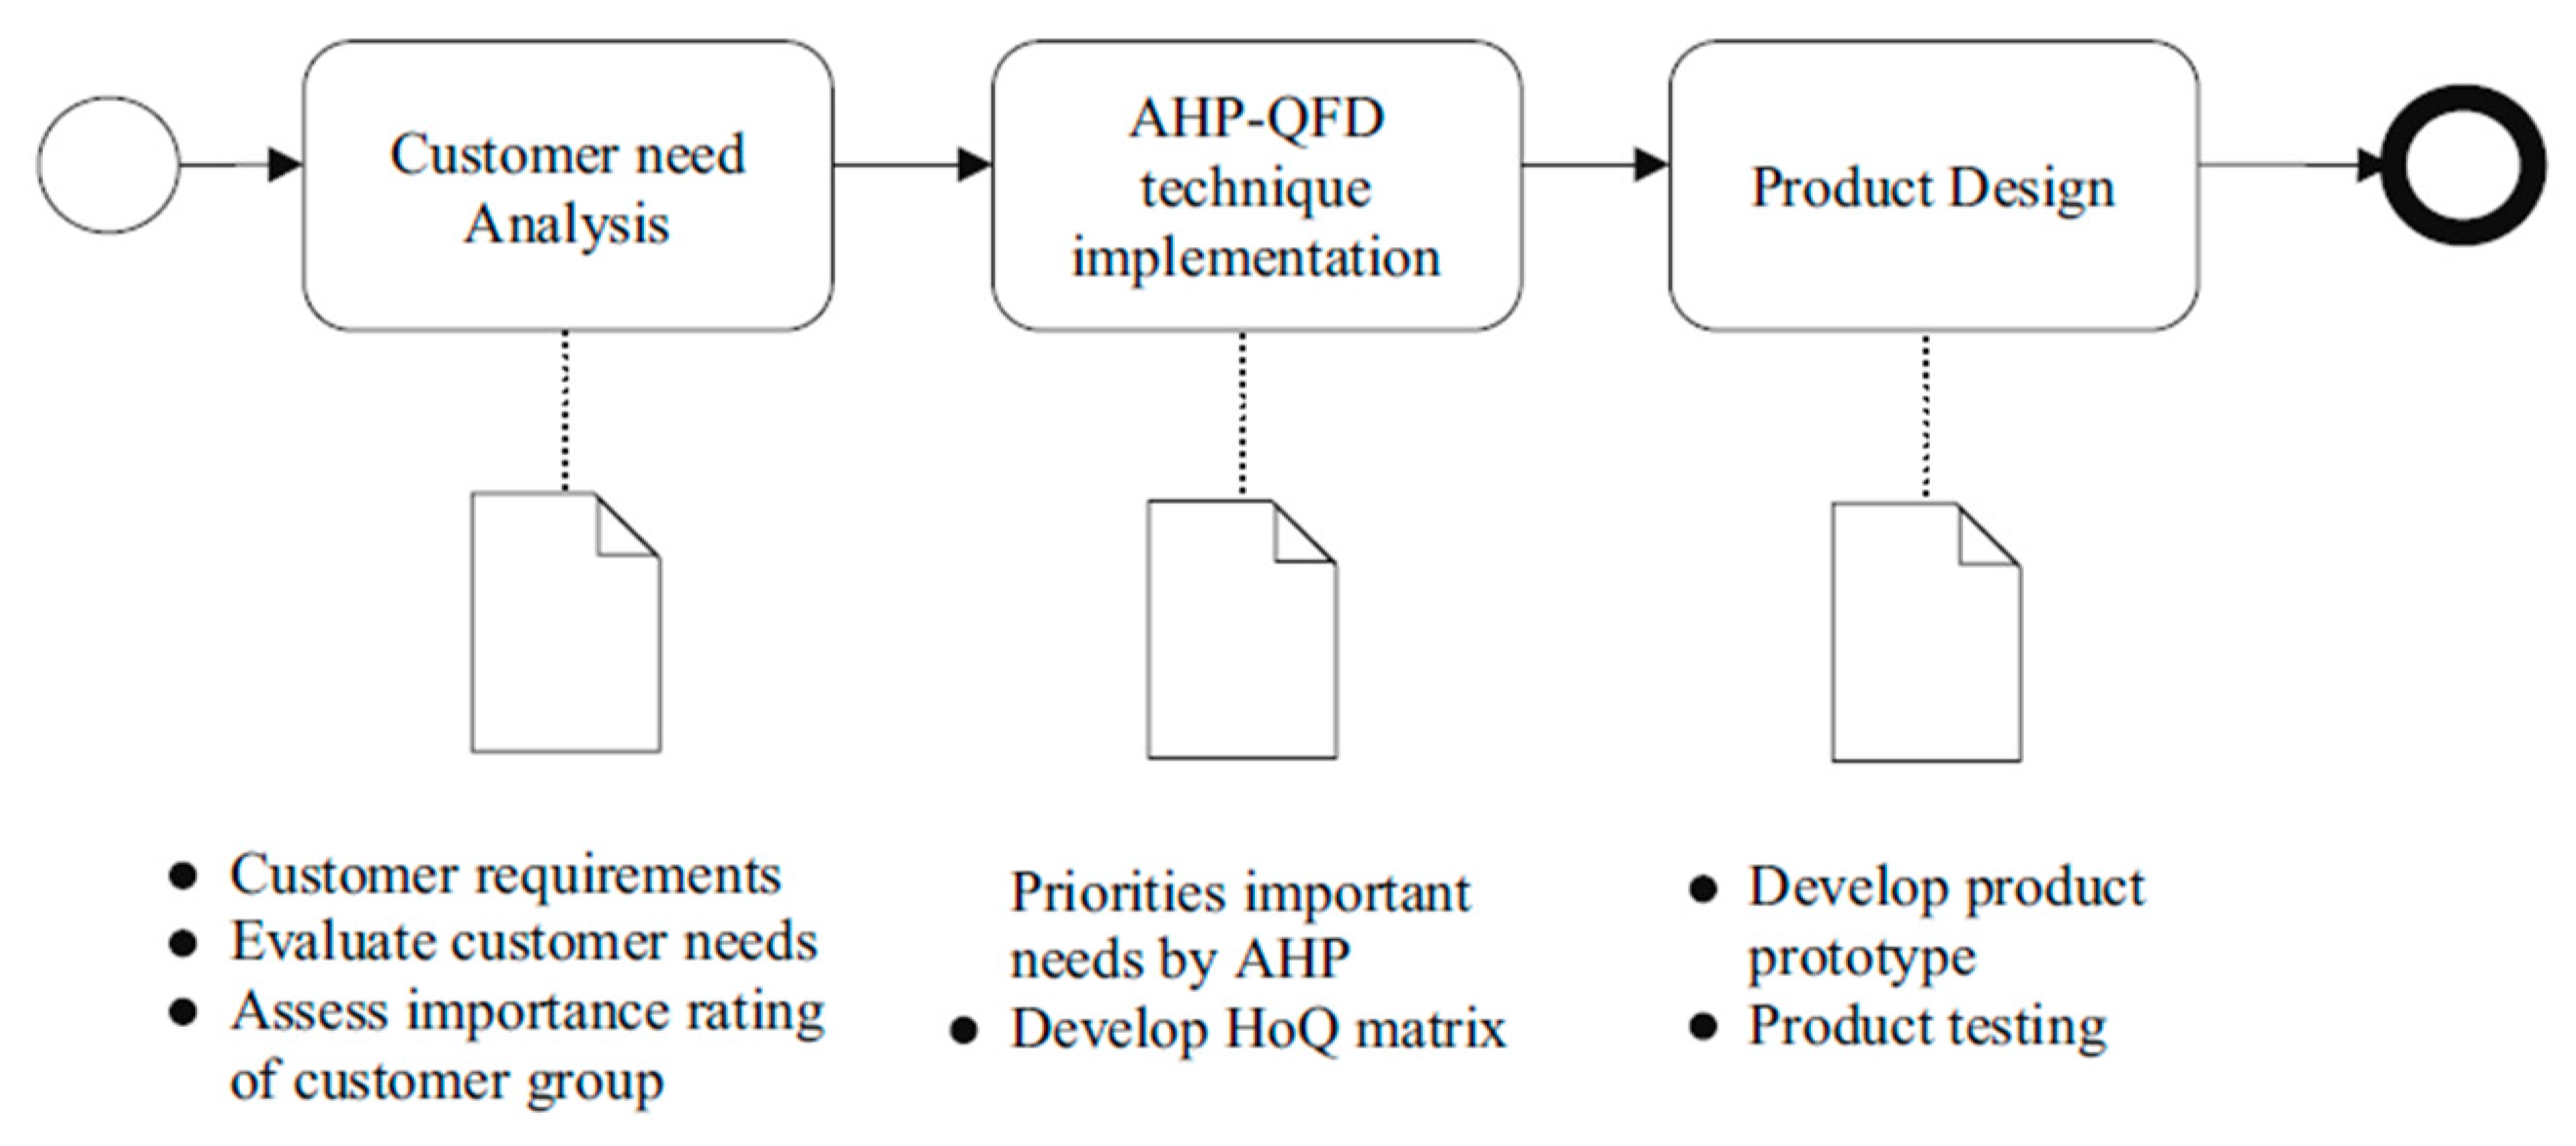
3.1. Research Framework
3.2. Initial AHP-QFD Matrices
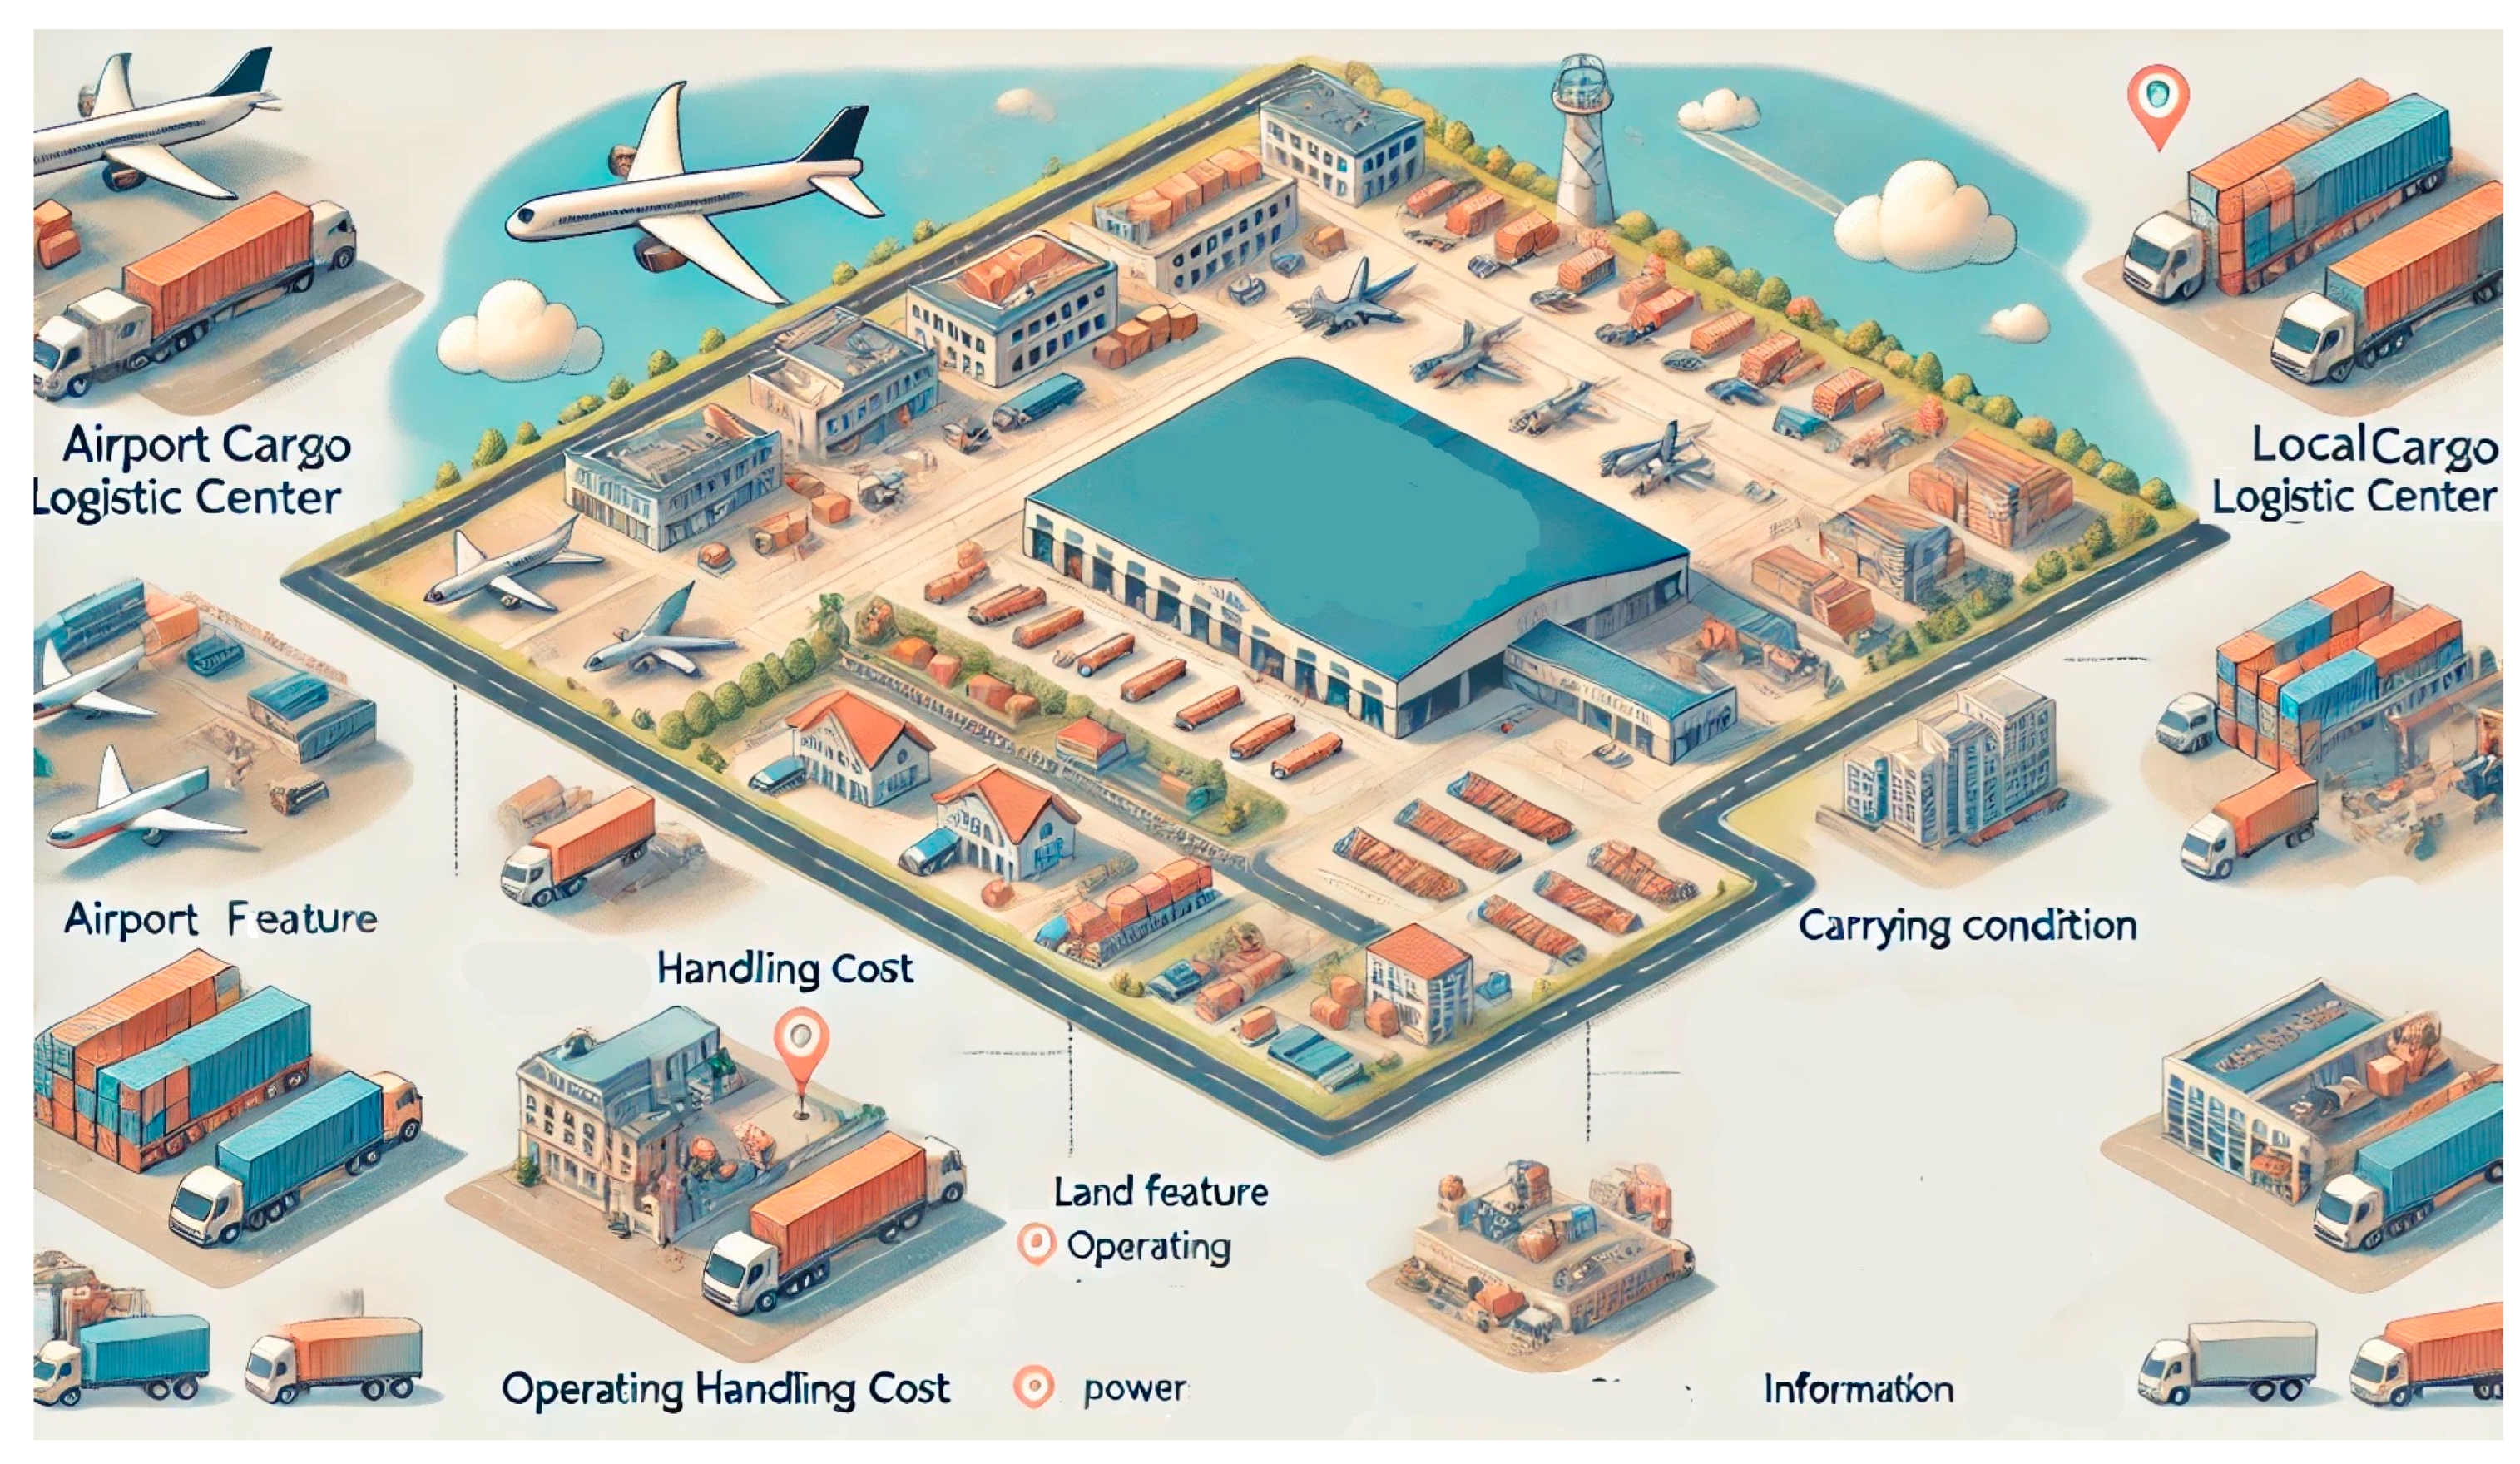
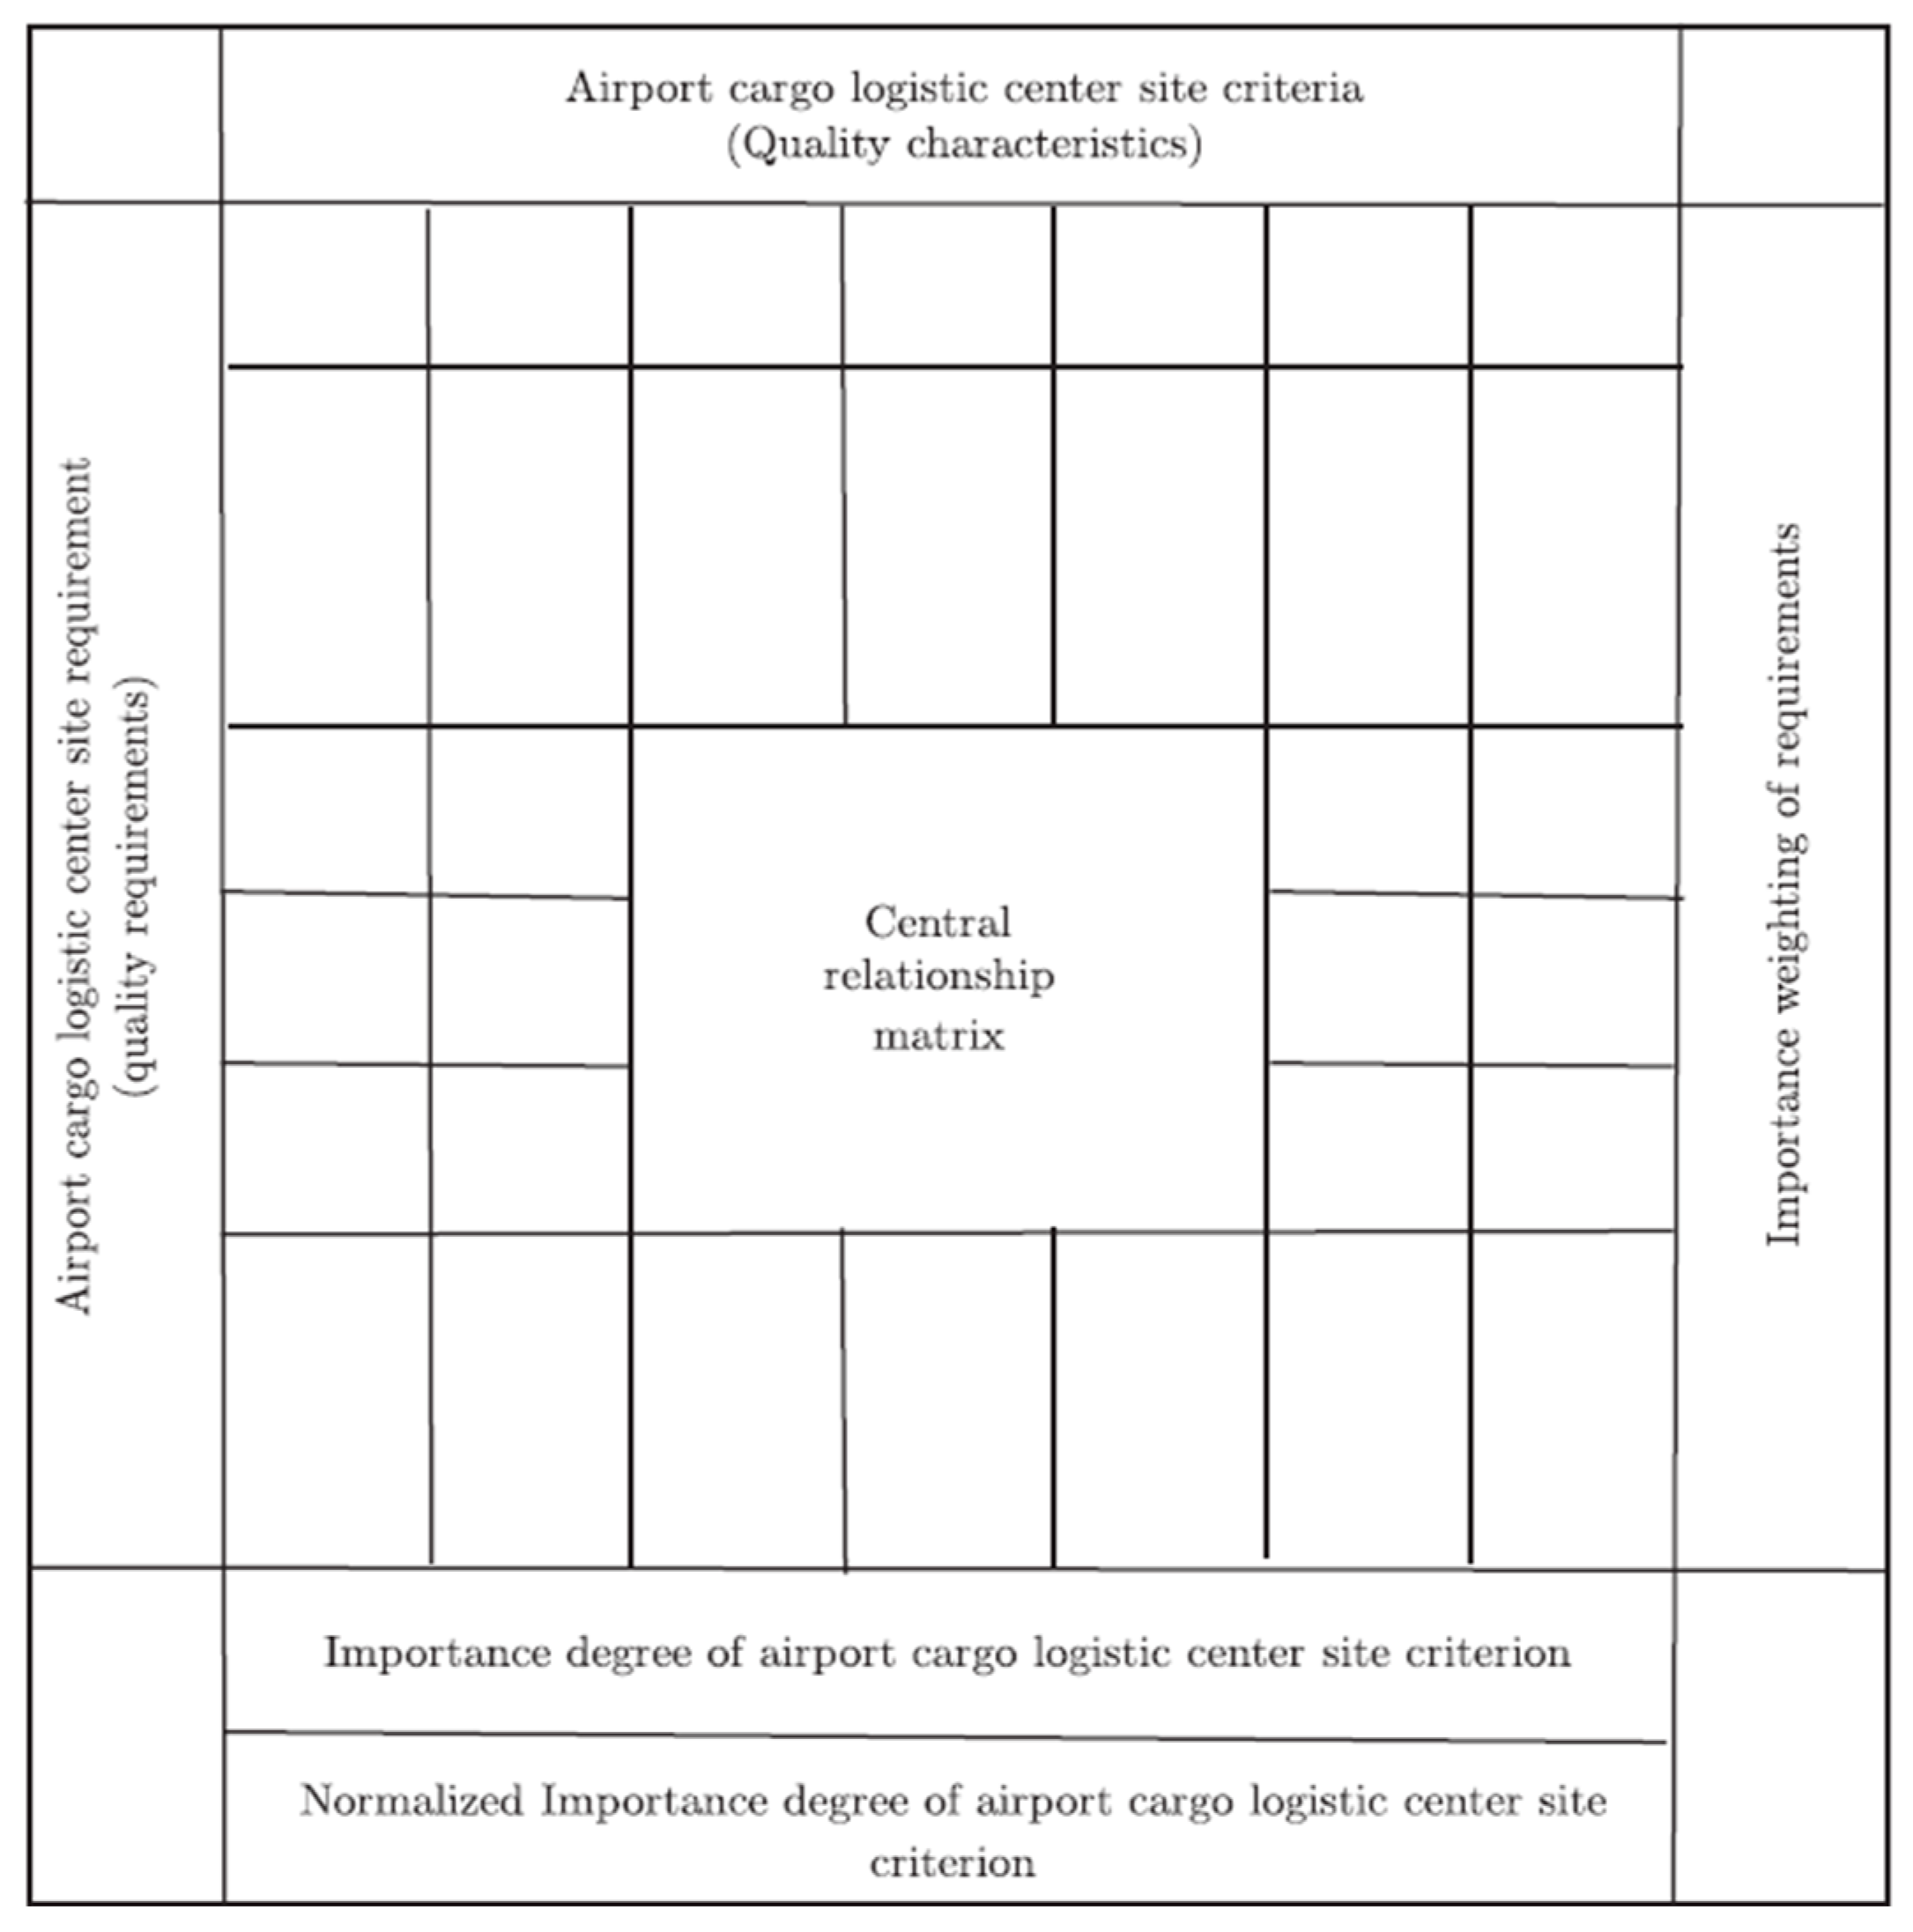
3.2.1. Logistic Service Site Design
- Airport Cargo Logistic Center Site Criteria (quality characteristics): At the top of the matrix, lists the criteria that are considered essential for selecting the optimal site for the cargo logistics center.
- Airport Cargo Logistic Center Site Requirements (quality requirements): On the left side of the matrix, this section outlines the specific requirements that the logistics center must meet. These requirements are derived from the needs of stakeholders such as logistics companies, airport authorities, and customers.
- Central Relationship Matrix: The central portion of the matrix shows the relationships between the site criteria and the site requirements. Each cell within this matrix indicates the degree of correlation or impact that a particular criterion has on fulfilling a specific requirement. The strength of these relationships is typically represented using symbols or numerical values (e.g., strong (9), moderate (3), weak (1)).
- Importance Weighting of Requirements: On the right side of the matrix, the importance weighting of each requirement is indicated. The AHP is used to measure the relative importance of the weights for each site requirement.
- Importance Degree of Airport Cargo Logistic Center Site Criterion: At the bottom of the matrix, this row displays the importance degree of each site criterion based on its ability to meet the defined requirements. This helps prioritize the criteria that are most critical for the site selection process.
- Normalized Importance Degree of Airport Cargo Logistic Center Site Criterion: The final row shows the normalized importance degree of each site criterion. Normalization adjusts the importance degrees so that they sum up to a specific value.
3.2.2. Medical Product Design
3.2.3. New Personal Electronic Product Development Design
3.3. Apply PCA with Derived AHP-QFD Matrices
3.3.1. Dataset Description
- Dataset X1: In this study, Dataset X1, as shown in Table 6, was employed, extracted from the AHP-QFD matrix presented in Table 3. Dataset X1 encompasses customer requirements, denoted as X1CRi, alongside their corresponding feature requirements, denoted as X1FRi. These elements are pivotal in evaluating the most suitable locations for cargo logistics centers.

| X1 FR1 | X1 FR2 | X1 FR3 | X1 FR4 | X1 FR5 | X1 FR6 | X1 FR7 | X1 FR8 | X1 FR9 | |
|---|---|---|---|---|---|---|---|---|---|
| X1CR1 | 0.90 | 2.70 | 2.70 | 0.90 | 2.70 | 0.00 | 2.70 | 0.90 | 2.70 |
| X1CR2 | 0.54 | 0.54 | 0.54 | 0.18 | 0.18 | 0.18 | 0.18 | 0.00 | 0.54 |
| X1CR3 | 0.78 | 0.78 | 0.00 | 0.26 | 0.78 | 0.26 | 0.00 | 0.09 | 0.00 |
| X1CR4 | 0.27 | 0.27 | 0.09 | 0.09 | 0.00 | 0.00 | 0.00 | 0.00 | 0.09 |
| X1CR5 | 0.00 | 1.14 | 0.00 | 0.38 | 0.00 | 0.00 | 0.00 | 0.00 | 0.38 |
| X1CR6 | 0.37 | 1.12 | 0.00 | 0.37 | 0.00 | 1.12 | 0.00 | 0.00 | 0.00 |
| X1CR7 | 0.00 | 0.13 | 0.00 | 0.13 | 0.00 | 0.38 | 0.38 | 0.00 | 0.00 |
| X1CR8 | 0.00 | 0.00 | 0.00 | 0.19 | 0.02 | 0.06 | 0.06 | 0.00 | 0.19 |
| X1CR9 | 0.00 | 0.00 | 0.00 | 0.00 | 0.00 | 0.15 | 0.15 | 0.15 | 0.00 |
| X1CR10 | 0.00 | 1.73 | 0.00 | 1.73 | 0.00 | 0.58 | 0.00 | 1.73 | 1.73 |
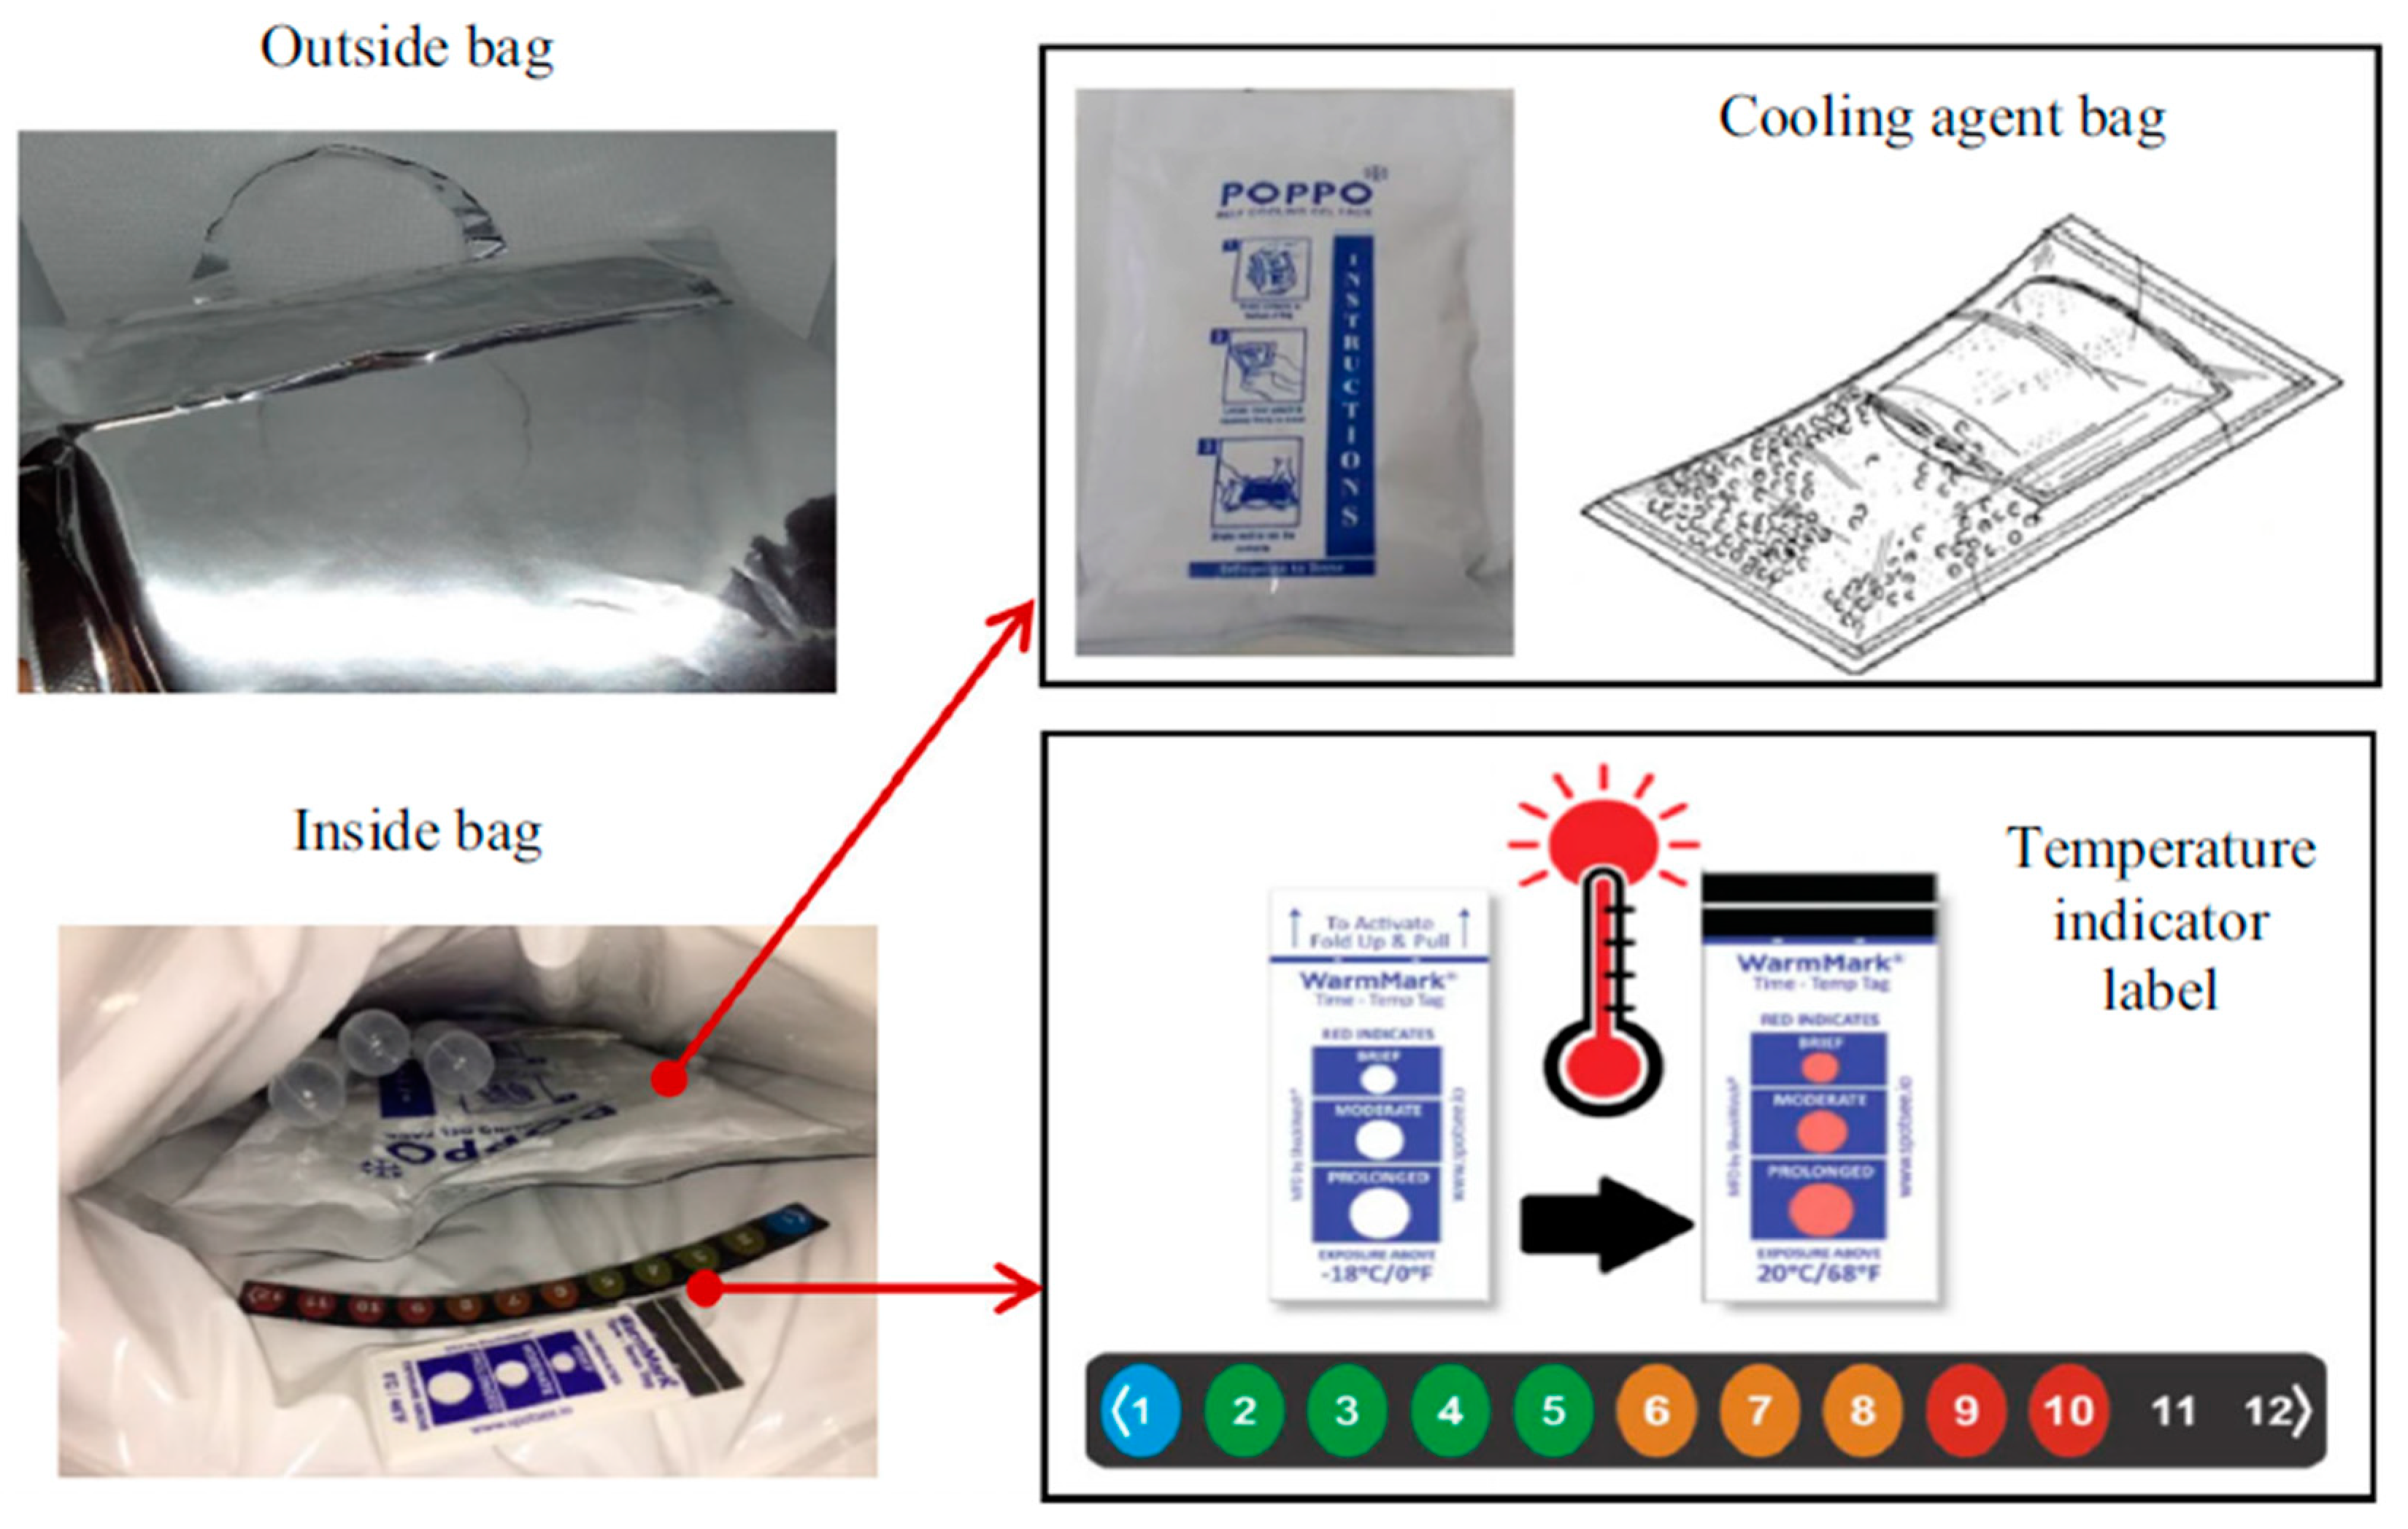
- Dataset X2: In this study, Dataset X2, as shown in Table 7 was utilized, sourced from the AHP-QFD matrix presented in Table 4. Dataset X2 consists of customer requirements, identified as X2CRi, and their corresponding feature requirements, denoted as X2FRi. The focus of Dataset X2 is on the enhancement of the current product utilized at Songklanagarind Hospital, particularly in the design of a temperature-controlled medicine bag.
| X2 FR1 | X2 FR2 | X2 FR3 | X2 FR4 | X2 FR5 | X2 FR6 | X2 FR7 | X2 FR8 | X2 FR9 | X2 FR10 | X2 FR11 | X2 FR12 | X2 FR13 | X2 FR14 | |
|---|---|---|---|---|---|---|---|---|---|---|---|---|---|---|
| X2CR1 | 44.46 | 44.46 | 0.00 | 44.46 | 4.94 | 14.82 | 0.00 | 4.94 | 0.00 | 0.00 | 0.00 | 4.94 | 0.00 | 0.00 |
| X2CR2 | 44.19 | 44.19 | 0.00 | 44.19 | 4.91 | 14.73 | 0.00 | 0.00 | 0.00 | 0.00 | 0.00 | 14.73 | 0.00 | 0.00 |
| X2CR3 | 0.00 | 0.00 | 0.00 | 0.00 | 41.94 | 0.00 | 0.00 | 0.00 | 0.00 | 0.00 | 0.00 | 0.00 | 0.00 | 0.00 |
| X2CR4 | 0.00 | 0.00 | 44.64 | 4.96 | 0.00 | 0.00 | 0.00 | 14.88 | 0.00 | 0.00 | 0.00 | 4.96 | 44.64 | 0.00 |
| X2CR5 | 14.52 | 43.56 | 0.00 | 0.00 | 0.00 | 14.52 | 0.00 | 4.84 | 0.00 | 0.00 | 0.00 | 0.00 | 4.84 | 0.00 |
| X2CR6 | 13.29 | 13.29 | 13.29 | 13.29 | 0.00 | 0.00 | 0.00 | 39.87 | 39.87 | 39.87 | 0.00 | 0.00 | 0.00 | 13.29 |
| X2CR7 | 0.00 | 0.00 | 11.13 | 0.00 | 0.00 | 33.39 | 11.13 | 33.39 | 33.39 | 33.39 | 33.39 | 0.00 | 11.13 | 11.13 |
| X2CR8 | 14.61 | 14.61 | 14.61 | 4.87 | 43.83 | 14.61 | 4.87 | 43.83 | 0.00 | 0.00 | 43.83 | 0.00 | 43.83 | 0.00 |
| X2CR9 | 3.82 | 3.82 | 3.82 | 3.82 | 0.00 | 0.00 | 0.00 | 11.46 | 34.38 | 34.38 | 11.46 | 0.00 | 0.00 | 11.46 |
| X2CR10 | 0.00 | 0.00 | 0.00 | 0.00 | 0.00 | 44.82 | 0.00 | 14.94 | 0.00 | 0.00 | 0.00 | 4.98 | 44.82 | 0.00 |
| X2CR11 | 0.00 | 0.00 | 0.00 | 0.00 | 0.00 | 0.00 | 0.00 | 14.07 | 0.00 | 42.21 | 0.00 | 0.00 | 0.00 | 0.00 |
| X2CR12 | 5.00 | 5.00 | 45.00 | 5.00 | 45.00 | 45.00 | 5.00 | 15.00 | 0.00 | 0.00 | 45.00 | 0.00 | 45.00 | 0.00 |
| X2CR13 | 0.00 | 0.00 | 0.00 | 0.00 | 0.00 | 0.00 | 31.86 | 10.62 | 10.62 | 10.62 | 0.00 | 0.00 | 0.00 | 0.00 |
| X2CR14 | 0.00 | 0.00 | 0.00 | 0.00 | 0.00 | 45.00 | 15.00 | 45.00 | 0.00 | 0.00 | 45.00 | 0.00 | 15.00 | 0.00 |
| X2CR15 | 0.00 | 0.00 | 0.00 | 0.00 | 0.00 | 0.00 | 0.00 | 14.49 | 14.49 | 14.49 | 43.47 | 4.83 | 0.00 | 43.47 |
| X2CR16 | 45.00 | 45.00 | 45.00 | 45.00 | 45.00 | 5.00 | 5.00 | 45.00 | 0.00 | 0.00 | 15.00 | 0.00 | 45.00 | 0.00 |
| X2CR17 | 10.05 | 10.05 | 10.05 | 10.05 | 10.05 | 3.35 | 3.35 | 10.05 | 0.00 | 0.00 | 0.00 | 30.15 | 0.00 | 0.00 |
- Dataset X3: In this study, Dataset X3, as shown in Table 8 was employed, derived from the AHP-QFD matrix presented in Table 5. Dataset X3 includes customer requirements, denoted as X3CRi, and their associated feature requirements, labeled as X3FRi. Notably, Dataset X3 introduces an approach to new product development and showcases its application through a case study centered on the development of new sports earphones.
| X3 FR1 | X3 FR2 | X3 FR3 | X3 FR4 | X3 FR5 | X3 FR6 | X3 FR7 | X3 FR8 | X3 FR9 | X3 FR10 | |
|---|---|---|---|---|---|---|---|---|---|---|
| X3CR1 | 0.00 | 0.00 | 0.07 | 0.00 | 0.00 | 0.00 | 0.00 | 0.00 | 0.07 | 0.00 |
| X3CR2 | 0.00 | 0.06 | 0.00 | 0.00 | 0.00 | 0.00 | 0.00 | 0.00 | 0.00 | 0.17 |
| X3CR3 | 0.00 | 0.00 | 0.00 | 0.00 | 0.00 | 0.00 | 0.00 | 0.00 | 0.00 | 0.17 |
| X3CR4 | 0.05 | 0.05 | 0.00 | 0.08 | 0.00 | 0.00 | 0.00 | 0.00 | 0.00 | 0.00 |
| X3CR5 | 0.20 | 0.30 | 0.00 | 0.00 | 0.00 | 0.00 | 0.00 | 0.10 | 0.20 | 0.00 |
| X3CR6 | 0.00 | 0.11 | 0.00 | 0.00 | 0.00 | 0.00 | 0.00 | 0.07 | 0.07 | 0.00 |
| X3CR7 | 0.00 | 0.00 | 0.00 | 0.00 | 0.23 | 0.15 | 0.00 | 0.00 | 0.00 | 0.00 |
| X3CR8 | 0.48 | 0.48 | 0.00 | 0.00 | 0.00 | 0.00 | 0.73 | 0.00 | 0.00 | 0.00 |
3.3.2. PCA Method
- Data Preprocessing: Before performing PCA, the datasets were standardized to ensure that each feature contributed equally to the analysis. Standardization involves scaling the features to have a mean of 0 and a standard deviation of 1. As the code below:
- PCA Implementation: PCA was implemented using the PCA class from the sklearn.decomposition module in Python. The absolute loadings of the first principal component were calculated to determine the contribution of each feature to the principal component. As the code below:
- from sklearn.decomposition import PCA
- pca_x1 = PCA()
- pca_x1.fit(data_x1_standardized)
- pca_x2 = PCA()
- pca_x2.fit(data_x2_standardized)
- pca_x3 = PCA()
- pca_x3.fit(data_x1_standardized)
3.4. Evaluation of Interpretability and Usability for Decision-Making by Product Designers
4. Results
4.1. Dataset X1
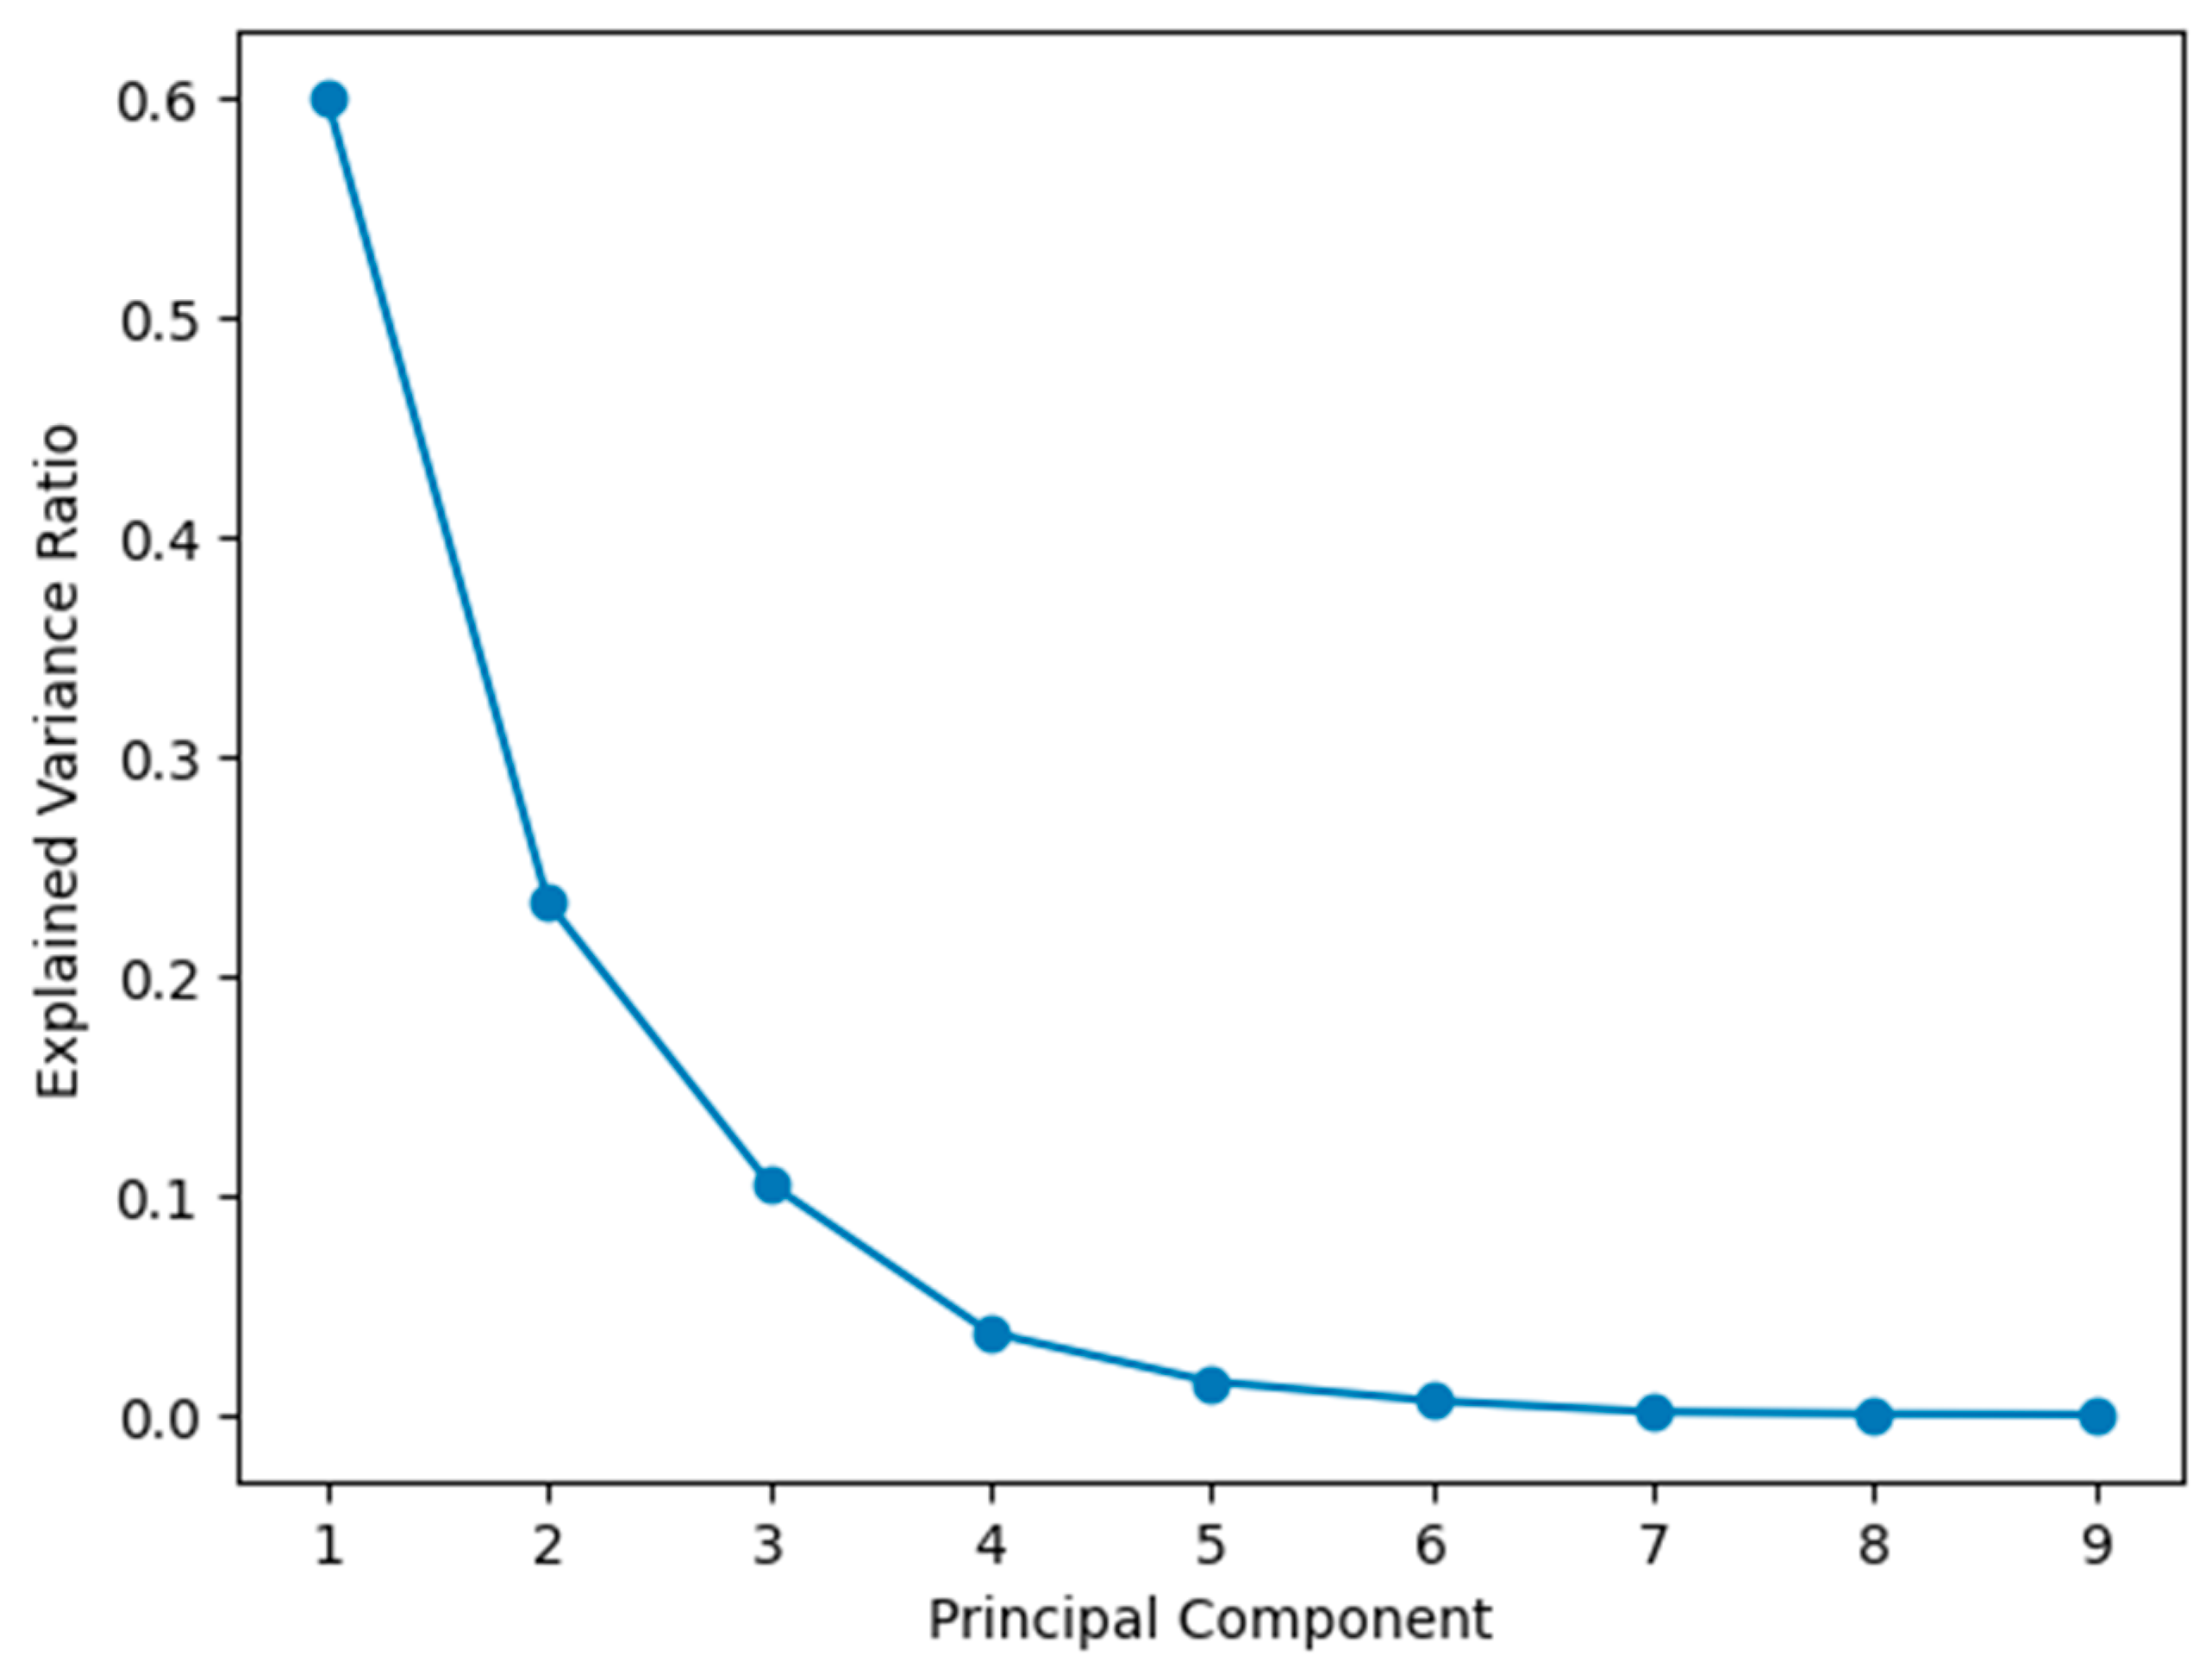
4.1.1. Scree Plot Analysis for Dataset X1
- Dominant First Component: The first principal component elucidates a significant portion of the dataset’s variance.
- Elbow Point: A distinct “elbow” in the scree plot suggests a clear cutoff point for dimensionality reduction.
- PCA Suitability: Given the substantial variance explained by the first component, PCA is deemed suitable for reducing the dimensionality of Dataset X1.
4.1.2. Cumulative Explained Variance Ratio for Dataset X1
- The first principal component accounts for 60% of the dataset’s variance.
- The first two principal components collectively explain 83.4% of the variance.
- By the fifth principal component, 99.2% of the variance is explained.
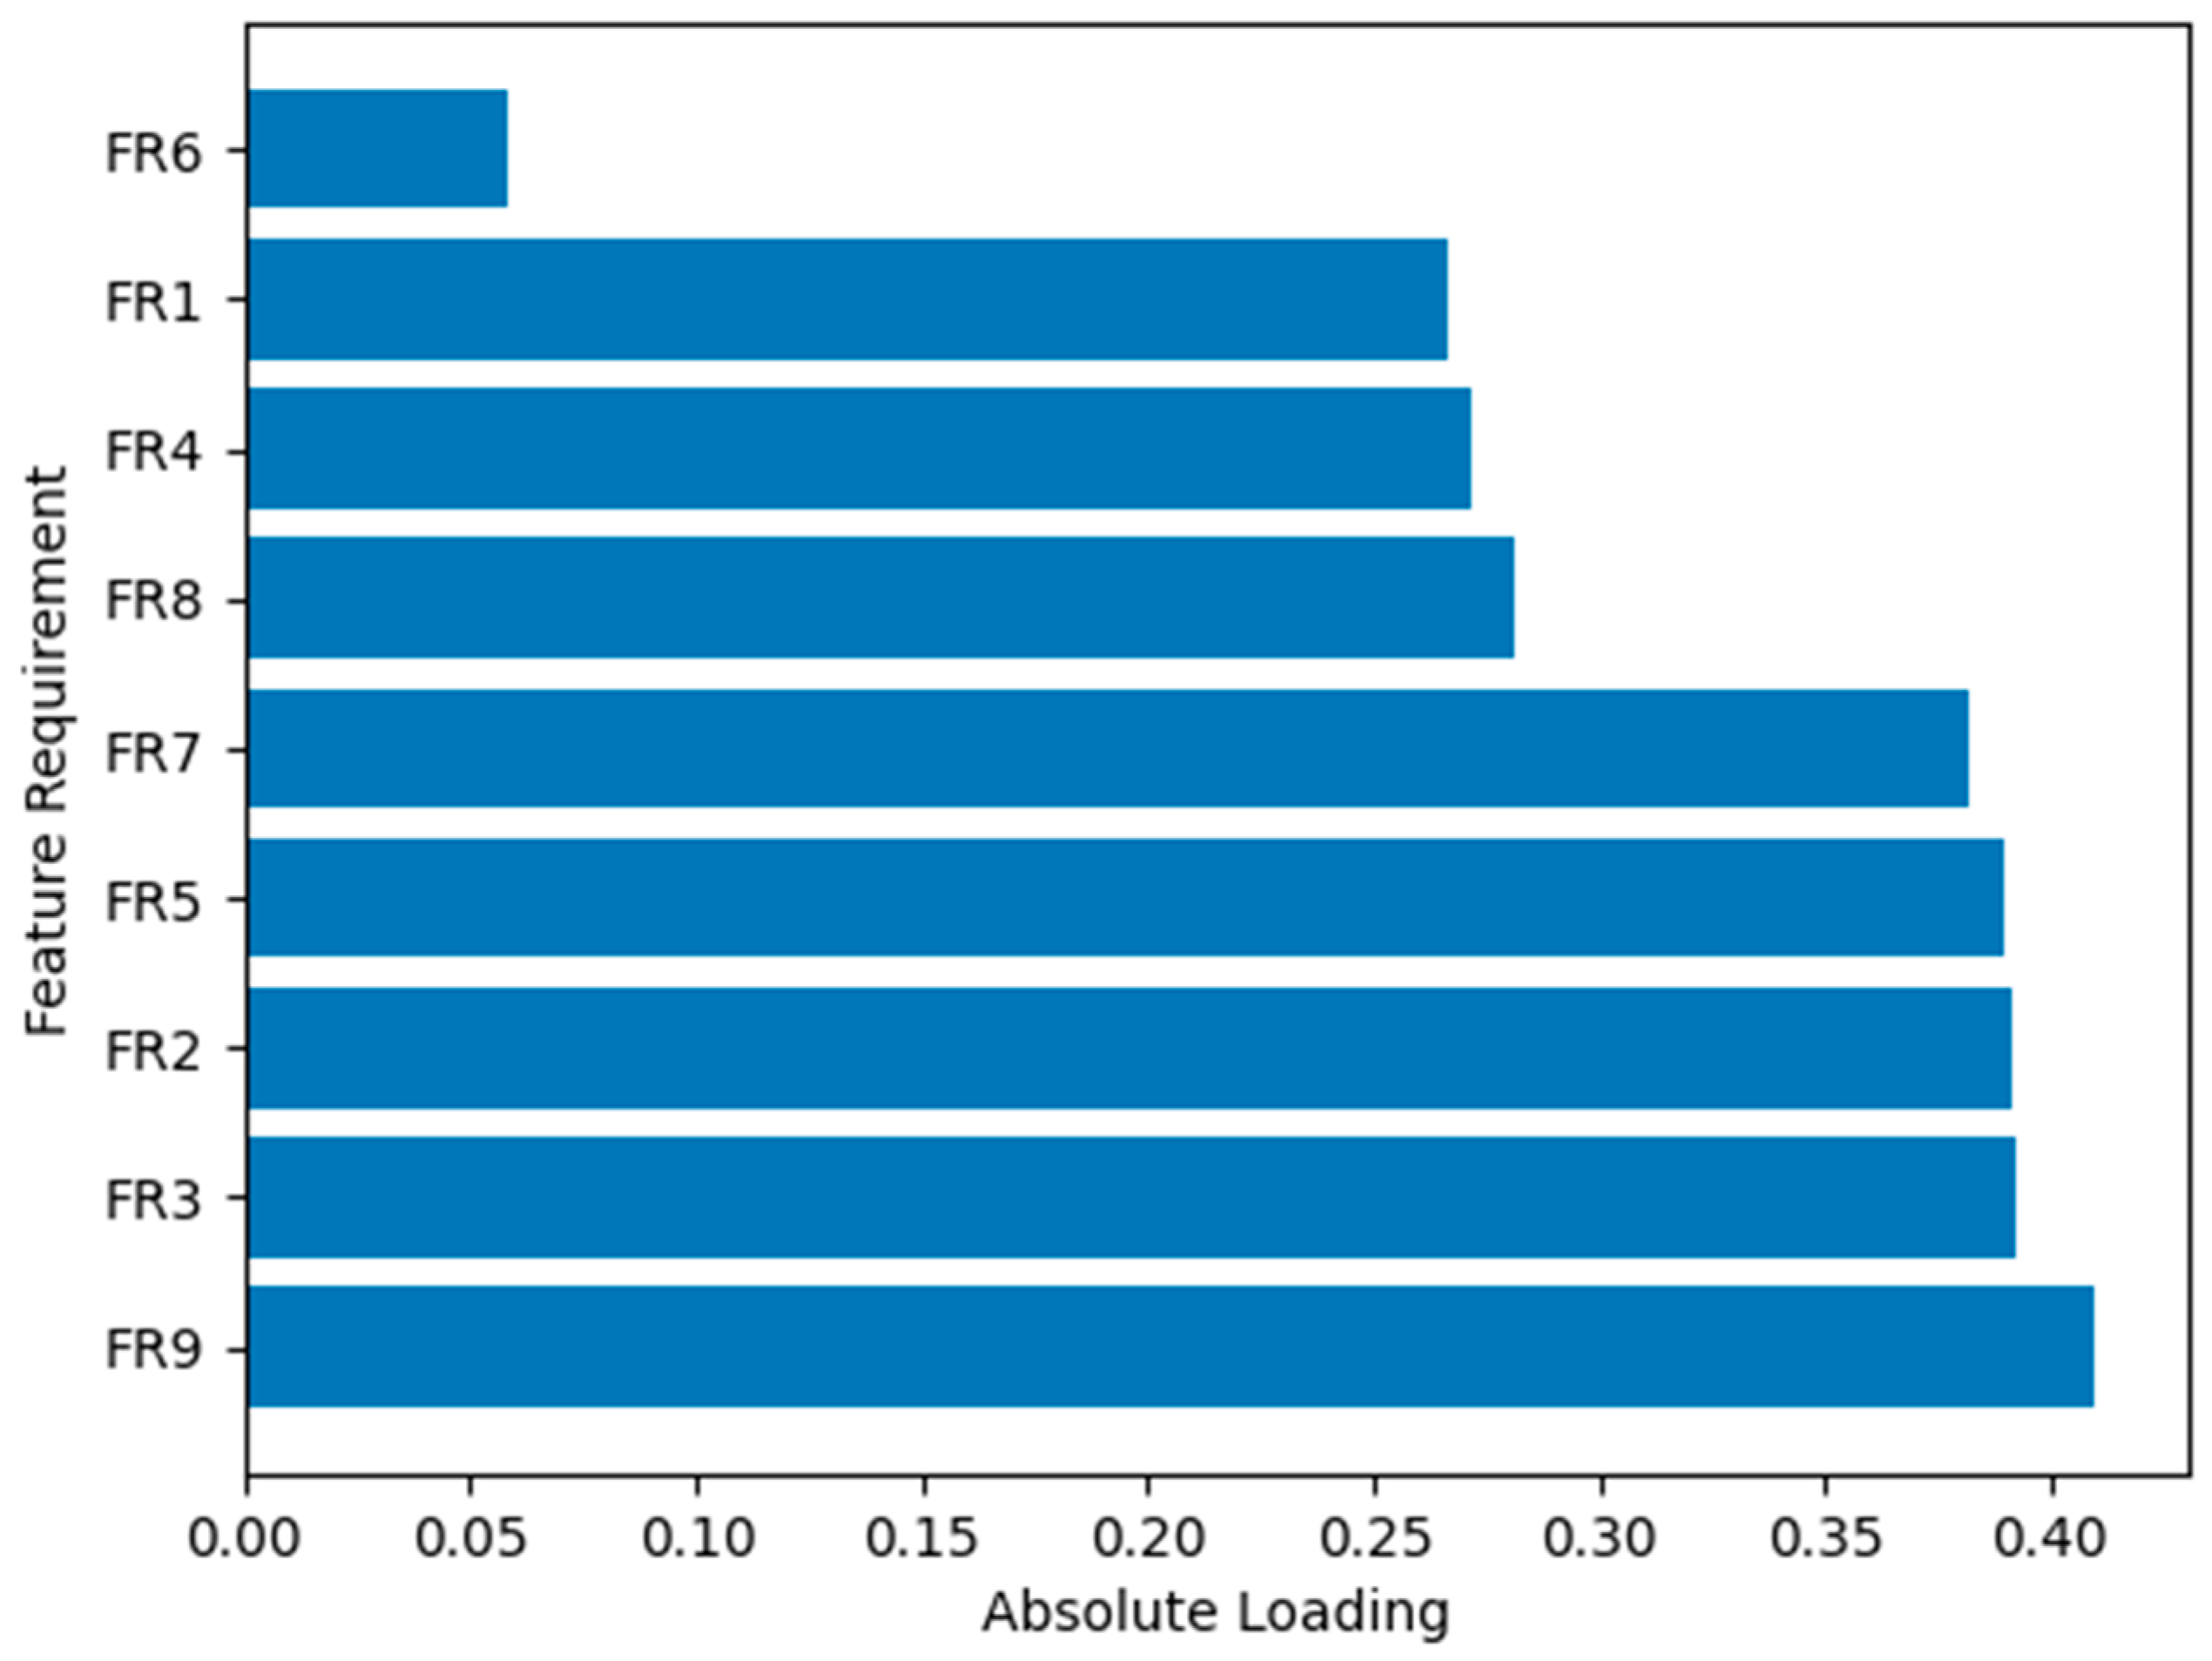
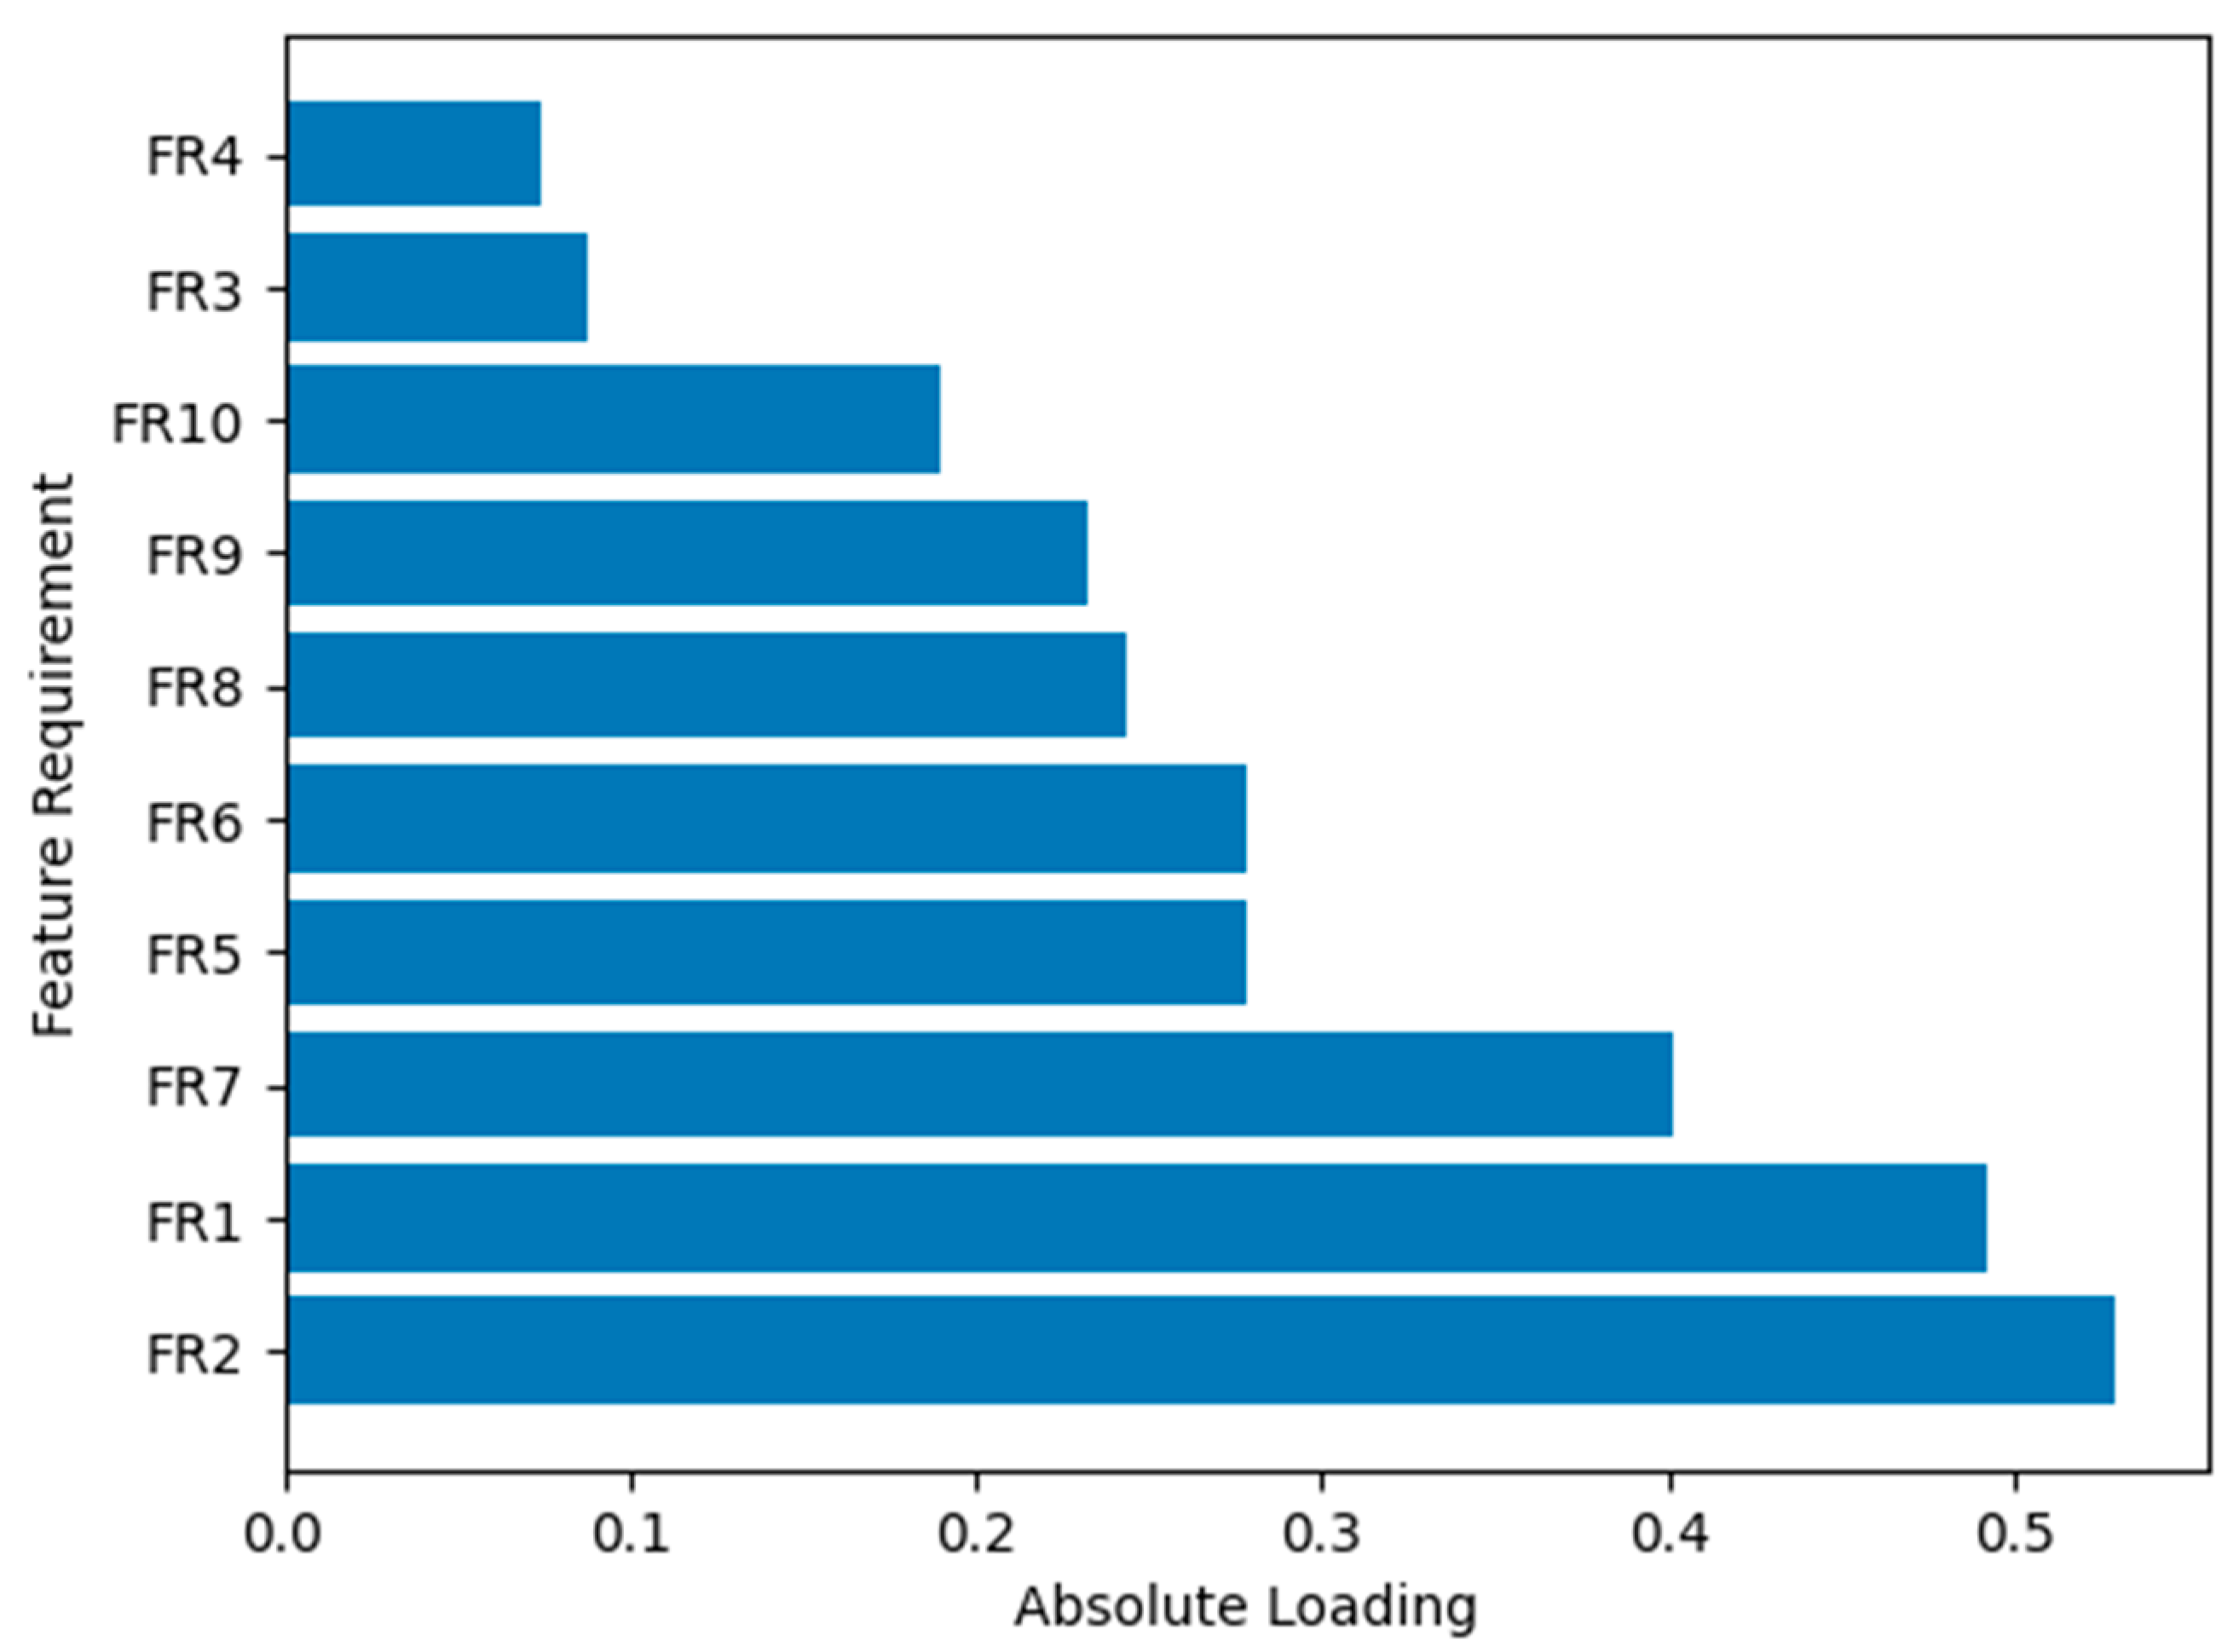
4.1.3. Feature Contribution for Dataset X1
4.2. Dataset X2
4.2.1. Scree Plot Analysis for Dataset X2
- Gradual Decline: Variance explained by principal components exhibits a gradual descent, indicating an even distribution of information.
- No Clear Elbow: Unlike Dataset X1, Dataset X2 lacks a distinct “elbow” in the scree plot, making the optimal number of components challenging.
4.2.2. Cumulative Explained Variance Ratio for Dataset X2
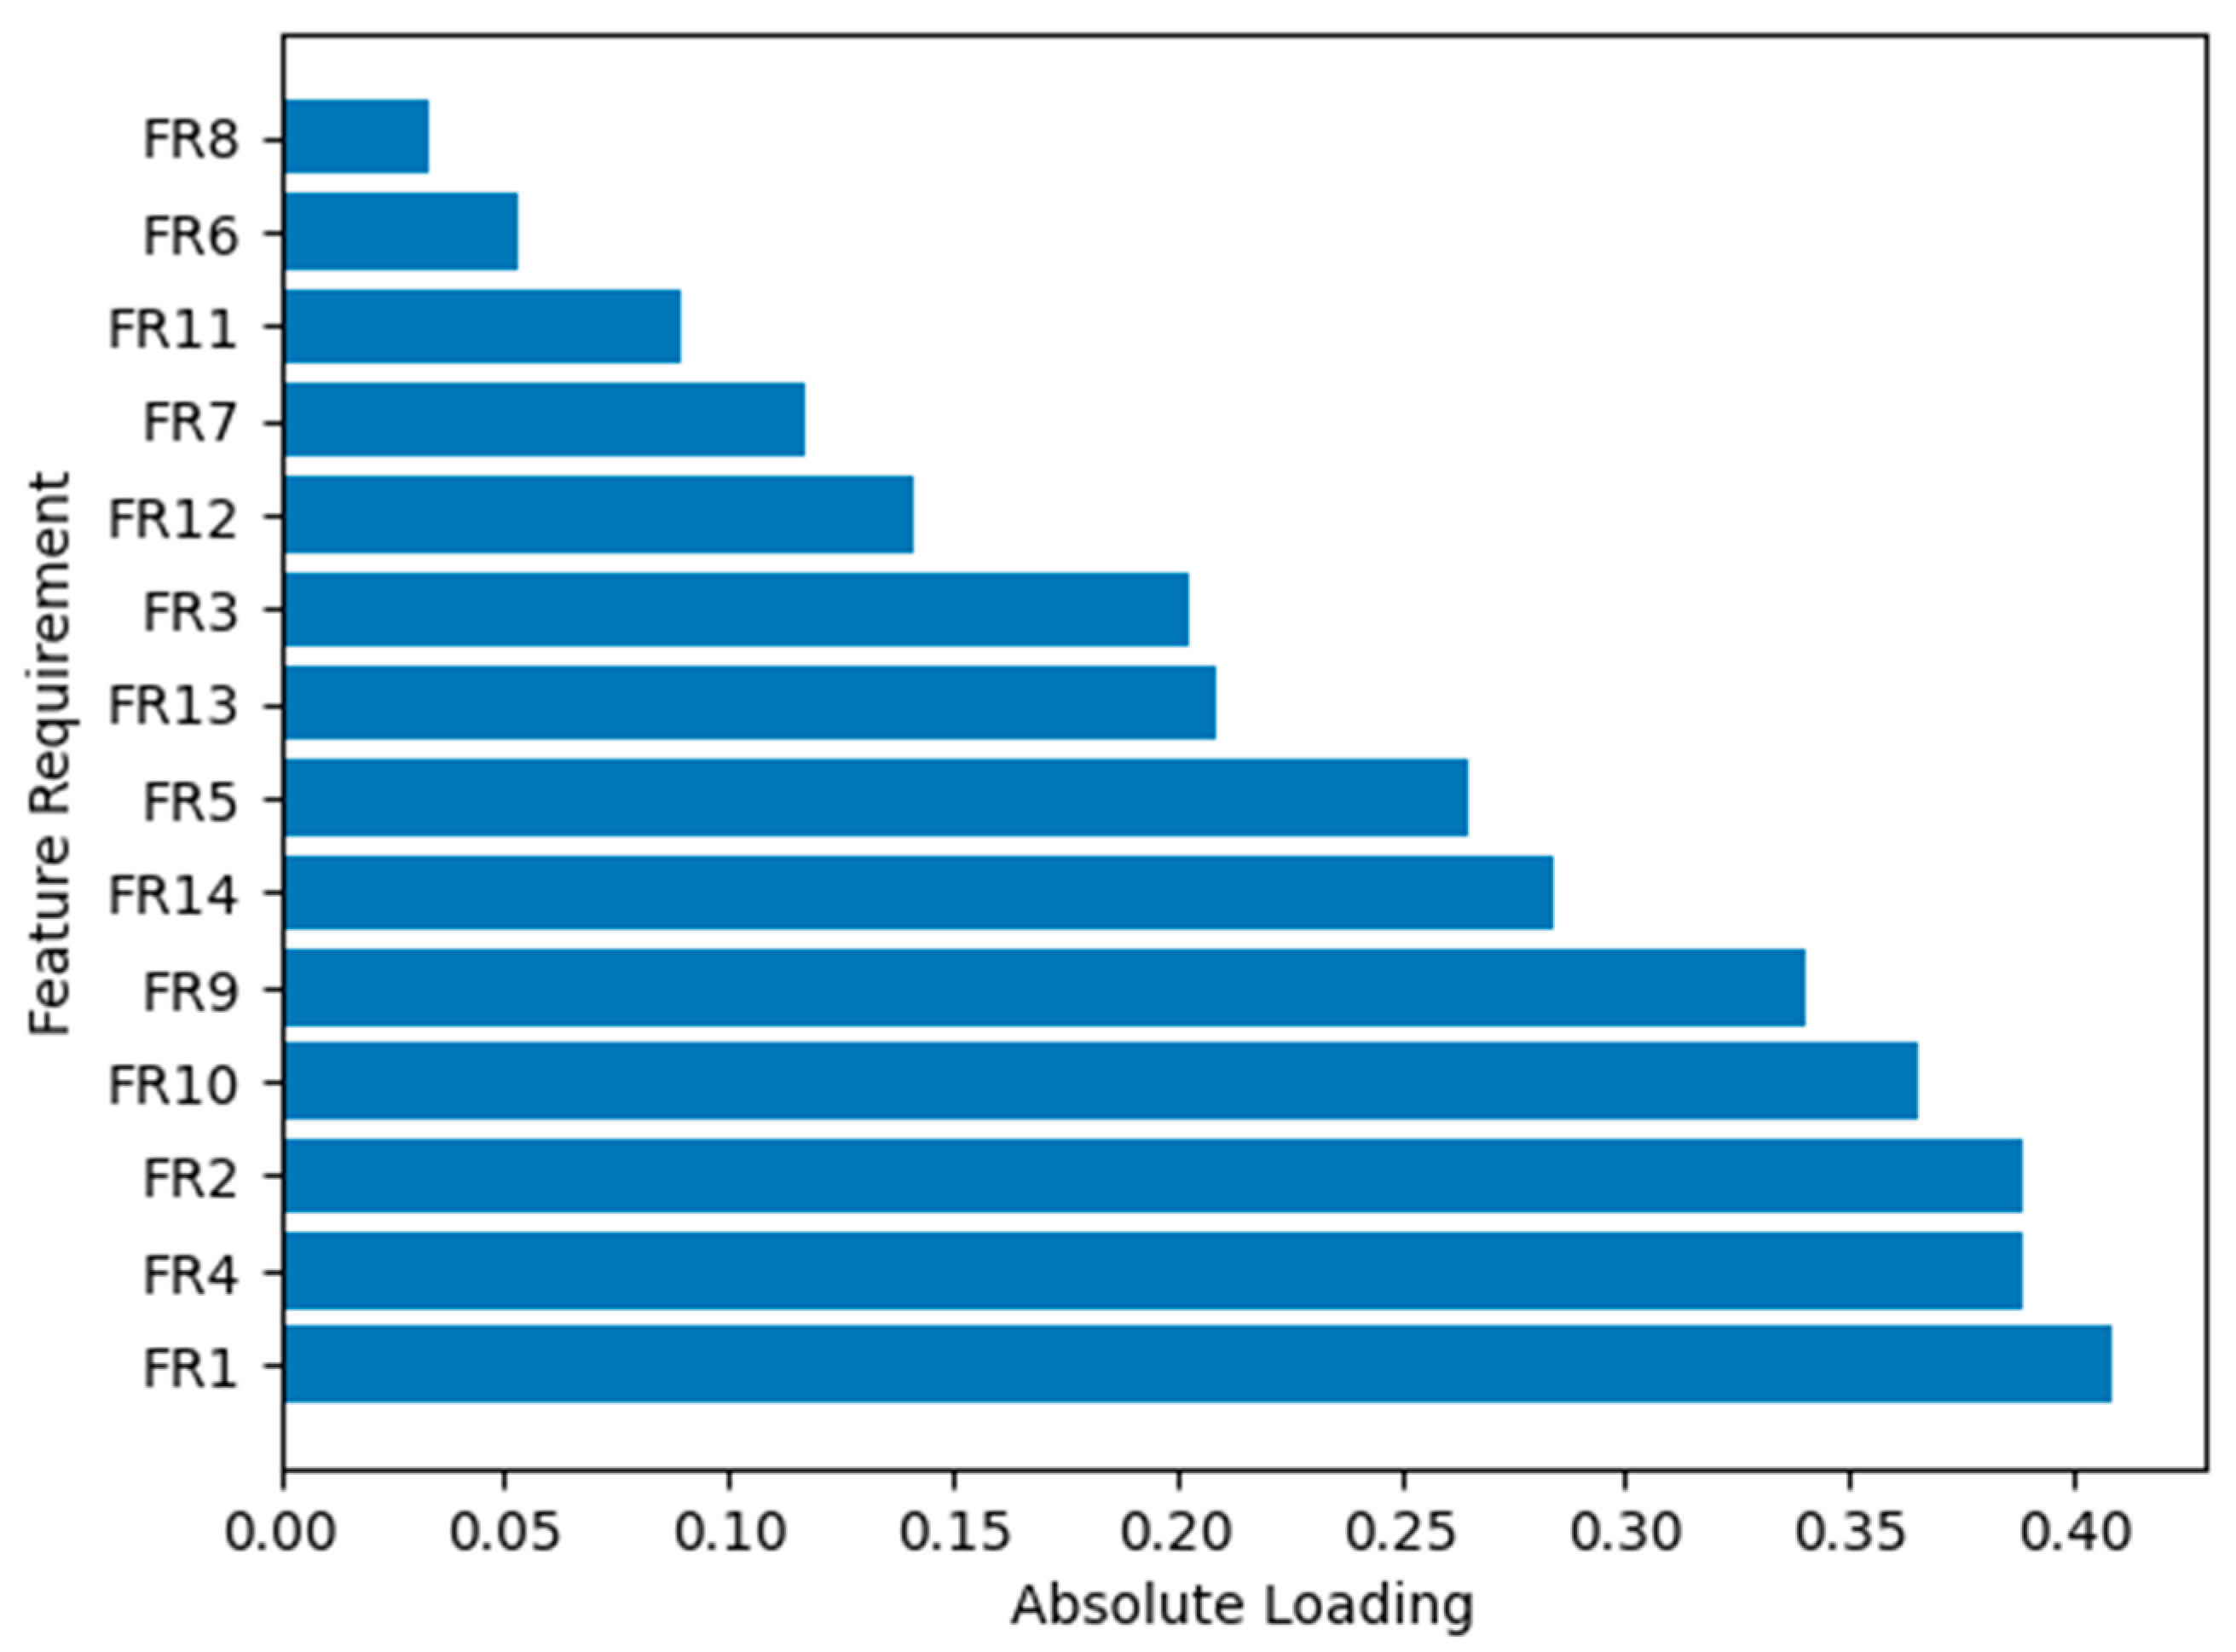
4.2.3. Feature Contribution for Dataset X2
4.3. Dataset X3
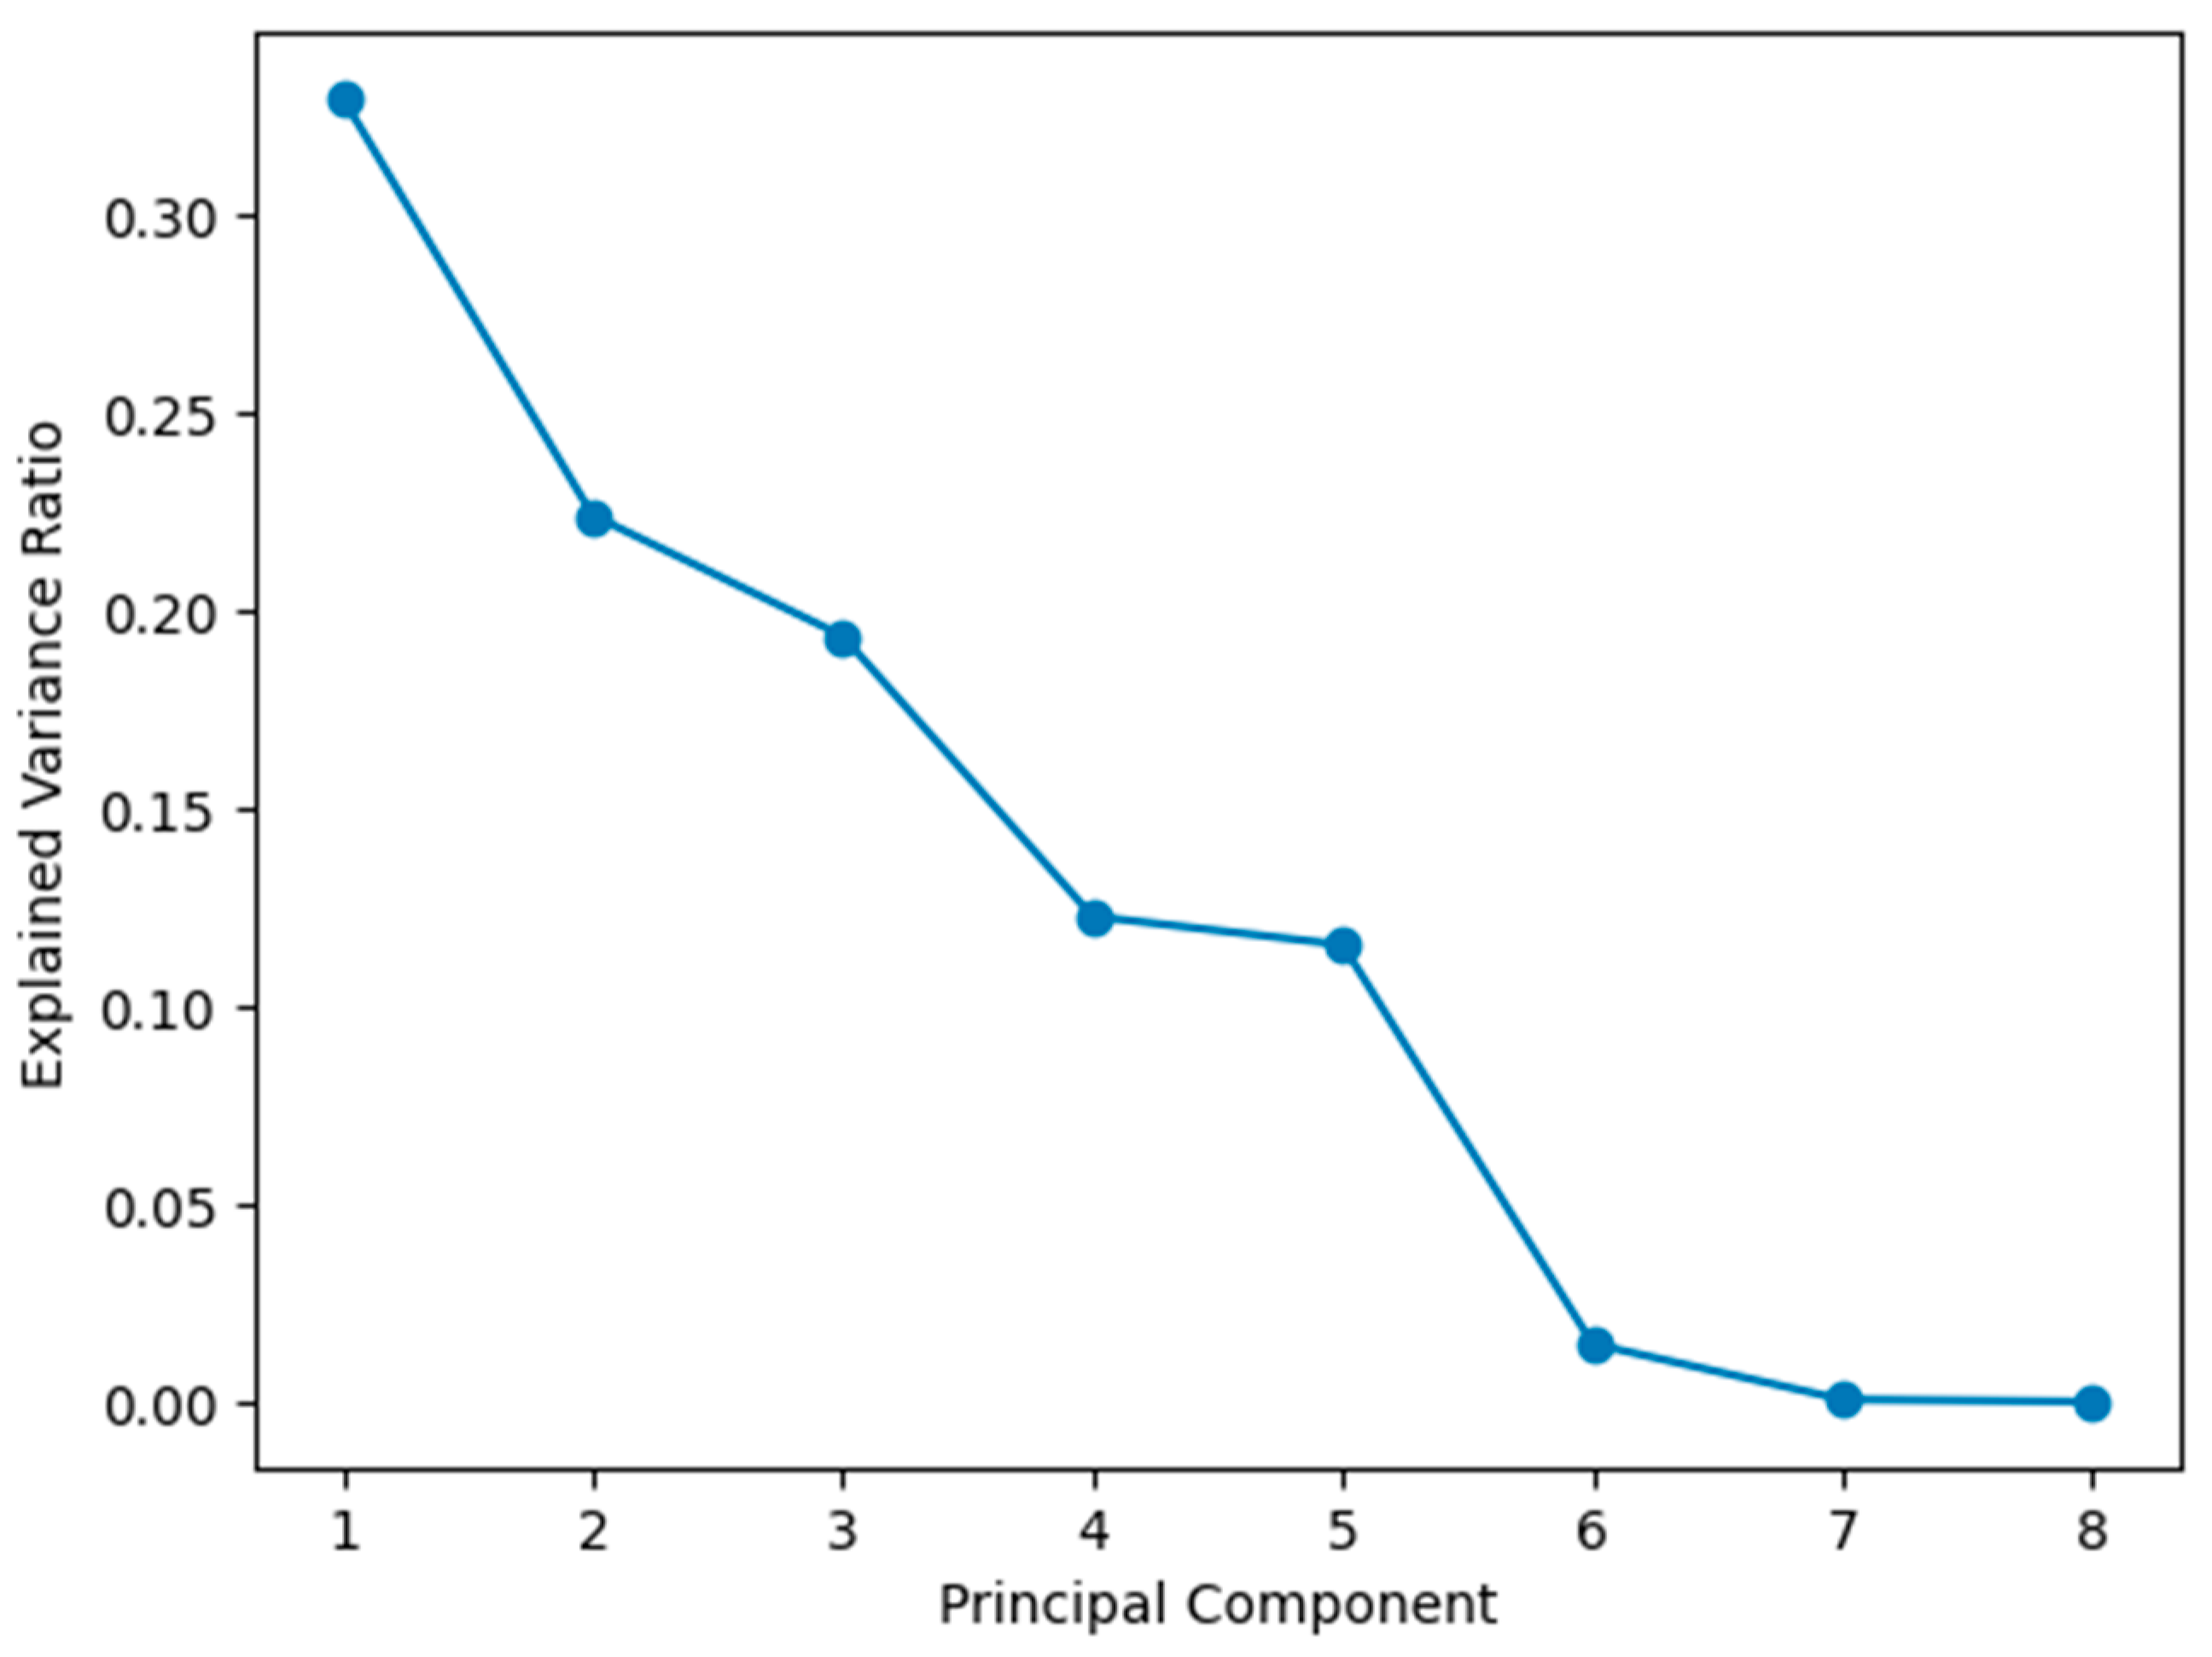
4.3.1. Scree Plot Analysis for Dataset X3
- High Initial Variance: Approximately 30% of the variance is explained by the first principal component, signifying substantial capture of dataset information.
- Noticeable Decline: A discernible decline post the first component suggests diminishing contributions from subsequent components.
- PCA Appropriateness: Given the high variance explained by the first component, PCA appears appropriate for dimensionality reduction while retaining crucial information.
4.3.2. Cumulative Explained Variance Ratio for Dataset X3
4.3.3. Feature Contribution for Dataset X3
4.4. Evaluation of Interpretability and Usability for Decision-Making Results
4.4.1. Clarity
4.4.2. Speed
4.4.3. Accuracy
4.4.4. Overall Effectiveness in Reducing Evaluation Time and Appropriateness of Methods
5. Discussion
5.1. Applicability of PCA-AHP-QFD Integration in Different Study Industries
- Logistics IndustryKey Challenges: The logistics industry involves complex, multifaceted operations requiring precise coordination and efficient resource utilization. Prioritizing features that optimize cargo handling and storage while ensuring compliance with stringent regulatory standards is a significant challenge [56]. Additionally, logistics service centers must be resilient to disruptions caused by events such as natural disasters or operational failures, which can lead to severe congestion and reduced service quality [57]. The selection of an optimal site for airport cargo logistics centers also poses a strategic challenge, requiring consideration of multiple objectives and constraints such as budget allocation, customer requirements, and operational efficiency [23]. Furthermore, the logistics companies in urban areas must adapt to regulations aimed at reducing environmental impacts, such as minimizing CO2 emissions and managing urban traffic congestion, which add another layer of complexity to operations [58].Applicability of PCA-AHP-QFD: Integrating PCA with AHP-QFD in this context allows for clearer identification and prioritization of key features by reducing the complexity of the AHP-QFD matrices. Expert feedback supports this ability, with 75% of participants preferring this method for its clarity and accuracy, and 100% for speed. The integration also enhances the system’s resilience by optimizing the configuration of logistics service centers to withstand disruptions. Additionally, this method can support sustainable logistics practices by providing a structured approach to evaluating and selecting appropriate strategies for logistics operations. This kind of approach takes into account various stakeholder needs and ensures alignment with organizational objectives [59].
- Personal/Consumer Electronics IndustryKey Challenges: The personal and consumer electronics industry faces significant challenges in designing new products, some of which have already been suggested in the literature review part. Prioritizing customer needs is crucial for developing successful products [7,24,38,60]. Effectively addressing these needs can provide a market advantage, as products aligned with customer desires are more likely to succeed [24,35,36,38]. Recent trends show increasing product requirements and rapidly evolving markets demanding precise developments in shorter cycles [8,9]. This complexity necessitates precise designs with numerous variables, making design decisions more challenging and extending development times [8,9,10,11].Applicability of PCA-AHP-QFD: The application of PCA simplifies the complexity of AHP-QFD matrices, aiding in the prioritization of critical features with the first four components explaining 86.9% of the variance in Dataset X3. This approach facilitates efficient decision-making in new product development, reduces development cycle time, and enhances alignment with customer needs, thereby improving market acceptance and competitiveness. According to the expert feedback, 75% found it clearer, 87.5% preferred the speed of evaluations with PCA, and 62.5% found it more accurate. To effectively meet the challenges previously mentioned, methodologies like PCA-AHP-QFD can systematically prioritize and integrate customer requirements into the design process [60,61].
- Healthcare/Medical IndustryKey Challenges: The healthcare/medical industry demands high precision and reliability in product design to ensure patient safety and regulatory compliance. The design and development of medical devices, such as temperature-controlled medicine bags, must account for various factors including user safety, efficacy, and compliance with healthcare regulations [30]. Additionally, there are substantial challenges in incorporating patient-centric designs that address the needs of diverse patient populations, particularly older adults and those with chronic conditions [62]. Healthcare providers face increasing complexity due to the evolving nature of diseases and the need for personalized medicine. This complexity necessitates robust design methodologies that can manage multiple variables and ensure the highest quality standards [63]. The importance of integrating feedback from patients and healthcare professionals into the design process to enhance the usability and effectiveness of medical devices is also highlighted [62]. Furthermore, the development of intelligent healthcare products, such as home blood glucose monitors, highlights the need for aging-friendly design that aligns technological advancements with user-centric principles, ensuring accessibility and usability for elderly users [64].Potential of PCA-AHP-QFD: Integrating PCA with AHP-QFD in the healthcare sector can significantly streamline the feature prioritization process by reducing the complexity of the AHP-QFD matrices. Although Dataset X2 showed a more even distribution of variance across principal components, indicating a less dominant first component, PCA still aids in dimensionality reduction. This is crucial for managing the complexity of medical device design. By simplifying the dimensionality, PCA facilitates the identification of key features that meet both patient and regulatory requirements. However, the gradual decline in explained variance suggests that PCA may need to be supplemented with additional analytical methods to fully address the specific needs of this sector.
5.2. The Fitness of PCA Model Intregrate with AHP-QFD Datasets across Study Industries
- Logistics Industry (Case Study A: Airport Cargo Logistic Center Site, Dataset X1): The scree plot for Dataset X1 revealed a dominant first component that explained a significant portion of the dataset’s variance. The first two principal components accounted for 83.4% of the variance, and the first five components collectively explained 99.2% of the variance. This indicates that PCA is highly suitable for dimensionality reduction in this dataset.
- Personal/Consumer Electronics Industry (Case Study B: New Earphone Development, Dataset X3): The scree plot for Dataset X3 showed that approximately 30% of the variance was explained by the first principal component, with a noticeable decline in variance explained by subsequent components. The first four components collectively elucidated 86.9% of the variance, making PCA appropriate for this dataset.
- Healthcare/Medical Industry (Dataset X2: Temperature-Controlled Medicine Bags): The scree plot for Dataset X2 exhibited a gradual decline in variance explained by principal components, with no clear “elbow” point. The first component explained 27.3% of the variance, and the first seven components together explained 90.6% of the variance. This even distribution of information suggests that PCA might not be as beneficial for this dataset. This observation is consistent with the findings of construction automation industry, which noted that PCA might not be suitable for datasets with less dominant principal components [48]. This underscores the importance of considering dataset characteristics when applying PCA.
5.3. Expert Opinions on PCA Integration with AHP-QFD for Product Design Decision-Manking
6. Conclusions
7. Limitations and Future Research Directions
Author Contributions
Funding
Institutional Review Board Statement
Informed Consent Statement
Data Availability Statement
Acknowledgments
Conflicts of Interest
References
- Akao, Y. Quality Function Deployment, Integrating Customer Requirements into Product Design; Productivity Press: Cambridge, MA, USA, 1990. [Google Scholar]
- Hauser, J.R.; Clausing, D. The House of Quality. Harv. Bus. Rev. 1988, 66, 63–73. [Google Scholar]
- Prasad, B. Concurrent Engineering Fundamentals: Integrated Product and Process Organization; Prentice Hall PTR: Upper Saddle River, NJ, USA, 1996; Volume 1. [Google Scholar]
- Ida, F.; Doddy, S. Business Strategies and Competitive Advantage: The Role of Performance and Innovation. J. Open Innov. Technol. Mark. Complex. 2022, 8, 163. [Google Scholar]
- Tandiono, Y.; Rau, H. An Enhanced Model Using the Kano Model, QFDE, and TRIZ with a Component-Based Approach for Sustainable and Innovative Product Design. Sustainability 2023, 15, 527. [Google Scholar] [CrossRef]
- Azemeraw, T.M.; Dieste, M.; Panizzolo, R.; Biazzo, S. Sustainable Product Design Factors: A Comprehensive Analysis. J. Clean. Prod. 2024, 463, 142260. [Google Scholar] [CrossRef]
- Shvetsova, O.A.; Park, S.C.; Lee, J.H. Application of Quality Function Deployment for Product Design Concept Selection. Appl. Sci. 2021, 11, 2681. [Google Scholar] [CrossRef]
- Wagner, R.; Schleich, B.; Haefner, B.; Kuhnle, A.; Wartzack, S.; Lanza, G. Challenges and Potentials of Digital Twins and Industry 4.0 in Product Design and Production for High Performance Products. Procedia CIRP 2019, 84, 88–93. [Google Scholar] [CrossRef]
- Johannes, B.; Mariana, A.; Tomohiko, S. End-to-end Optimized Image Compression. In Proceedings of the 5th International Conference on Learning Representations (ICLR), Toulon, France, 24–26 April 2017. [Google Scholar]
- Cantamessa, M.; Montagna, F.; Altavilla, S.; Casagrande-Seretti, A. Data-Driven Design: The New Challenges of Digitalization on Product Design and Development. Des. Sci. 2020, 6, e27. [Google Scholar] [CrossRef]
- Vezzoli, C.; Ceschin, F.; Diehl, J.C.; Kohtala, C. New Design Challenges to Widely Implement ‘Sustainable Product-Service Systems’. J. Clean. Prod. 2015, 97, 1–12. [Google Scholar] [CrossRef]
- Prarna, M.; Abhishek, T.; Neha. Software Defect Prediction Based on Selected Features Using Neural Network and Decision Tree. In Strategic System Assurance and Business Analytics; Kapur, P.K., Ompal, S., Sunil, K.K., Ajit, K.V., Eds.; Springer: Singapore, 2020; pp. 461–475. [Google Scholar]
- Quan, H.; Li, S.; Zeng, C.; Wei, H.; Hu, J. Big Data and AI-Driven Product Design: A Survey. Appl. Sci. 2023, 13, 9433. [Google Scholar] [CrossRef]
- Leskovec, J.; Rajaraman, A.; Ullman, J.D. Mining of Massive Data Sets; Cambridge University Press: Cambridge, UK, 2020. [Google Scholar] [CrossRef]
- Seidel, S.; Berente, N.; Lindberg, A.; Lyytinen, K.; Nickerson, J.V. Autonomous Tools and Design: A Triple-Loop Approach to Human-Machine Learning. Commun. ACM 2018, 62, 50–57. [Google Scholar] [CrossRef]
- McAfee, A.; Brynjolfsson, E. Big Data: The Management Revolution. Harv. Bus. Rev. 2012, 90, 60–68. [Google Scholar] [PubMed]
- Wu, L.; Hitt, L.; Lou, B. Data Analytics, Innovation, and Firm Productivity. Manag. Sci. 2019, 66, 2017–2039. [Google Scholar] [CrossRef]
- Rosenthal, P.; Niggemann, O. Problem Examination for AI Methods in Conceptual Product Design. arXiv 2022, arXiv:2201.07642v1. [Google Scholar]
- Dove, G.; Halskov, K.; Forlizzi, J.; Zimmerman, J. UX Design Innovation: Challenges for Working with Machine Learning as a Design Material. In Proceedings of the 2017 ACM SIGCHI Conference on Human Factors in Computing Systems, Denver, CO, USA, 6–11 May 2017; Mark, G., Fussell, S., Eds.; Association for Computing Machinery: New York, NY, USA, 2017; pp. 278–288. [Google Scholar] [CrossRef]
- Du, Y.; Liu, D.; Duan, H. A Textual Data-Driven Method to Identify and Prioritise User Preferences Based on Regret/Rejoicing Perception for Smart and Connected Products. Int. J. Prod. Res. 2022, 60, 4176–4196. [Google Scholar] [CrossRef]
- Leonardo, M.V.O.; Hugo, F.S.; Mariana, R.A.; Jose, A.F.C. Quality Function Deployment and Analytic Hierarchy Process: A Literature Review of Their Joint Application. Concurr. Eng. Res. Appl. 2020, 28, 239–251. [Google Scholar]
- Sivasamy, K.; Arumugam, C.; Devadasan, S.R.; Murugesh, R.; Thilak, V.M.M. Advanced Models of Quality Function Deployment: A Literature Review. Qual. Quant. 2016, 50, 1399–1414. [Google Scholar] [CrossRef]
- Tu, C.-S.; Chang, C.-T.; Chen, K.-K.; Lu, H.-A. Applying an AHP-QFD Conceptual Model and Zero-One Goal Programming to Requirement-Based Site Selection for an Airport Cargo Logistics Center. Int. J. Inf. Manag. Sci. 2010, 21, 407–430. [Google Scholar]
- Tu, N.; Zhang, T.; He, Q.; Zhang, H.; Li, Y. Applying Combined AHP-QFD Method in New Product Development: A Case Study in Developing New Sports Earphone. In Proceedings of the International Conference on Management Science and Industrial Engineering (MSIE), Harbin, China, 8–11 January 2011. [Google Scholar]
- Haber, N.; Fargnoli, M.; Sakao, T. Integrating QFD for Product-Service Systems with the Kano Model and Fuzzy AHP. Total Qual. Manag. Bus. Excell. 2020, 31, 929–954. [Google Scholar] [CrossRef]
- Kürüm Varolgüneş, F.; Canan, F.; del Río-Rama, M.d.l.C.; Oliveira, C. Design of a Thermal Hotel Based on AHP-QFD Methodology. Water 2021, 13, 2109. [Google Scholar] [CrossRef]
- Winati, F.D.; Rachmawaty, D.; Yamani, A.Z.; Mardhiana, H. Implementation of Importance-Performance Analysis on Integrated Information System at Institut Teknologi Telkom Purwokerto. J. Ilm. Tek. Ind. 2021, 20, 184–194. [Google Scholar]
- Li, P.; Li, L.; Peng, Q.; Tang, Q.; Tang, T. Renovation of Traditional Residential Buildings in Lijiang Based on AHP-QFD Methodology: A Case Study of the Wenzhi Village. Buildings 2023, 13, 2055. [Google Scholar] [CrossRef]
- Apichonbancha, P.; Lin, R.H. A Comparative Study of User Requirement Analysis in Smart Parking Systems: Integrating Stakeholder Ranking, Analytic Hierarchy Process, and Quality Function Deployment. In Proceedings of the NIC-NIDA, Bangkok, Thailand, 17–18 August 2023. [Google Scholar]
- Buakum, D.; Deasa, C.; Sinthavalai, R.; Noppasri, K. Designing Temperature-Controlled Medicine Bag Using an Integrated AHP-QFD Methodology. Int. J. Interact. Des. Manuf. (IJIDeM) 2023, 18, 659–670. [Google Scholar] [CrossRef]
- Hotelling, H. Analysis of a Complex of Statistical Variables into Principal Components. J. Educ. Psychol. 1933, 24, 417–441. [Google Scholar] [CrossRef]
- Pearson, K. On Lines and Planes of Closest Fit to Systems of Points in Space. Philos. Mag. 1901, 2, 559–572. [Google Scholar] [CrossRef]
- Chen, Z.; Zhang, X.; Lee, J. Combining PCA-AHP Combination Weighting to Prioritize Design Elements of Intelligent Wearable Masks. Sustainability 2023, 15, 1888. [Google Scholar] [CrossRef]
- Zhou, J.; Xu, M.; Zhang, J.; Chen, J. Group AHP-PCA Integrated Approach for Water Resource Sustainability Assessment in the Jinsha River Basin. Water Resour. Manag. 2018, 32, 1257–1271. [Google Scholar]
- Chen, C.-C.; Hsiao, K.-L.; Li, W.-C. Exploring the determinants of usage continuance willingness for location-based apps: A case study of bicycle-based exercise apps. J. Retail. Consum. Serv. 2020, 55, 102074. [Google Scholar] [CrossRef]
- Berisha, B.; Lobov, A. Overview and Trends for Application of AI Methods for Product Design. In Proceedings of the 2021 IEEE 19th International Conference on Industrial Informatics (INDIN), Palma de Mallorca, Spain, 21–23 July 2021. [Google Scholar]
- Jiang, H.; Kwong, C.K.; Kremer, G.E.O.; Park, W.-Y. Dynamic Modelling of Customer Preferences for Product Design using DENFIS and Opinion Mining. Adv. Eng. Inform. 2019, 42, 100969. [Google Scholar] [CrossRef]
- Zheng, Y.-J.; Yang, Y.; Zhang, N.; Jiao, Y. A Supernetwork-Based Model for Design Processes of Complex Mechanical Products. Sustainability 2016, 8, 992. [Google Scholar] [CrossRef]
- Famila, D.W.; Dina, R.; Achmad, Z.Y.; Hawwin, M. Integration of Quality Function Deployment (QFD) and Analytical Hierarchy Process (AHP) to Improve Student Information System. In Proceedings of the International Conference on Industrial, Enterprise, and System Engineering, AIP Conference Proceedings, Bandung, Indonesia, 16 December 2021. [Google Scholar]
- Jenab, K.; Pourmohammadi, H.; Sarfaraz, M. An i-AHP&QFD Warranty Model. Benchmarking Int. J. 2014, 21, 884–902. [Google Scholar]
- Saaty, T.L. The Analytic Hierarchy Process; McGraw-Hill: New York, NY, USA, 1980; ISBN 9780070543713. [Google Scholar]
- Akao, Y. Development History of Quality Function Deployment. In The Customer Driven Approach to Quality Planning and Deployment; Asian Productivity Organization: Minato, Tokyo, 1994; ISBN 92-833-1121-3. [Google Scholar]
- Armacost, R.L.; Componation, P.J.; Mullens, M.A.; Swart, W.W. An AHP Framework for Prioritizing Customer Requirements in QFD: An Industrialized Housing Application. IIE Trans. 1994, 26, 72–79. [Google Scholar] [CrossRef]
- Ho, W.; Dey, P.K.; Higson, H.E. Multiple Criteria Decision-Making Techniques in Higher Education. Int. J. Educ. Manag. 2006, 20, 319–337. [Google Scholar] [CrossRef]
- Lin, R.-H. An Integrated Model for Supplier Selection Under a Fuzzy Situation. Int. J. Prod. Econ. 2012, 138, 55–62. [Google Scholar] [CrossRef]
- Tendayi, T.G.; Fourie, C.J. The Combined AHP-QFD Approach and Its Use in Lean Maintenance. In Proceedings of the SAIIE25, Stellenbosch, South Africa, 9–11 July 2013; pp. 554–561. [Google Scholar]
- Wolniak, R. The Use of the QFD Method: Advantages and Limitations. Prod. Eng. Arch. 2018, 18, 14–17. [Google Scholar] [CrossRef]
- Edgar, C.T.; Yasir, I.K.; Mohamed, A.H.; Ahmed, J.Q. Integrating Machine Learning with QFD for Selecting Functional Requirements in Construction Automation. Int. J. Ind. Constr. 2020, 1, 76–88. [Google Scholar]
- Kambagowni, V.; Sai, K.; Suresh, C. QFD–ANP Approach for the Conceptual Design of Research Vessels: A Case Study. J. Inst. Eng. India Ser. C 2016, 97, 539–546. [Google Scholar] [CrossRef]
- Hiluf, R.; Akshay, D. Decision-Making on the Selection of Lean Tools Using Fuzzy QFD and FMEA Approach in the Manufacturing Industry. Expert Syst. Appl. 2022, 192, 116416. [Google Scholar]
- Ashish, K.R.; Swapnesh, T.; Billakurthi, S. Dimensionality Reduction Algorithms in Machine Learning: A Theoretical and Experimental Comparison. In Proceedings of the International Conference on Recent Advances on Science and Engineering, Dubai, United Arab Emirates, 4–5 October 2023. [Google Scholar]
- Chahboun, S.; Maaroufi, M. Principal Component Analysis and Machine Learning Approaches for Photovoltaic Power Prediction: A Comparative Study. Appl. Sci. 2021, 11, 7943. [Google Scholar] [CrossRef]
- You, S.D.; Hung, M.-J. Comparative Study of Dimensionality Reduction Techniques for Spectral–Temporal Data. Information 2021, 12, 1. [Google Scholar] [CrossRef]
- Zlatić, S.; Milković, M.; Boljunčić, V. Use of Principal Component Analysis for Optimization of Voice of Stakeholder in Quality Function Deployment Method. In Proceedings of the 42nd International Scientific Conference on Economic and Social Development, London, UK, 12–13 June 2019. [Google Scholar]
- Tapani, R.; Alexander, I.; Juha, K. Principal Component Analysis for Sparse High-Dimensional Data; Adaptive Informatics Research Center, Helsinki University of Technology, TKK: Espoo, Finland, 2007. [Google Scholar]
- Harrison, A.; Van Hoek, R. Logistics Management and Strategy: Competing through the Supply Chain; Pearson Education: London, UK, 2008. [Google Scholar]
- Zhang, X.; Wang, Y.; Liu, Y. Bilevel Optimization Model for Resilient Configuration of Logistics Service Centers. J. Transp. Logist. 2022, 10, 123–135. [Google Scholar] [CrossRef]
- Szymczyk, K.; Kadłubek, M. Challenges in General Cargo Distribution Strategy in Urban Logistics—Comparative Analysis of the Biggest Logistics Operators in EU. Transp. Res. Procedia 2019, 39, 525–533. [Google Scholar] [CrossRef]
- Ravichandran, M.; Vimal, K.E.K.; Jayakrishna, K.; Kulatunga, A.K. A QFD Approach for Selection of Design for Logistics Strategies. In Proceedings of ICoRD 2021, Design for Tomorrow—Volume 2; Springer: Singapore, 2021. [Google Scholar] [CrossRef]
- Akram, S.H.; Sanaz, S.; Selcuk, C.; Mohammad, M. Competitive Advantage and Its Impact on New Product Development Strategy (Case Study: Toos Nirro Technical Firm). J. Open Innov. Technol. Mark. Complex. 2018, 4, 17. [Google Scholar]
- Ali, K.; Esra, I.; Selcuk, C.; Cengiz, K. Customer-Oriented Product Design Using an Integrated Neutrosophic AHP & DEMATEL & QFD Methodology. Appl. Soft Comput. 2022, 118, 1–18. [Google Scholar]
- Timpe, C.; Stegemann, S.; Barrett, A.; Mujumdar, S. Challenges and Opportunities to Include Patient-Centric Product Design in Industrial Medicines Development to Improve Therapeutic Goals. Br. J. Clin. Pharmacol. 2020, 86, 2020–2027. [Google Scholar] [CrossRef] [PubMed]
- Aithal, P.S. Design Thinking in Healthcare: An Application of Integrated AHP-QFD for Patient-Centric Product Design. Int. J. Healthc. Manag. 2020, 13, 89–100. [Google Scholar]
- Li, X.; Li, H. Aging-Friendly Design of Intelligent Healthcare Products: An Integration of AHP, QFD, and Kansei Engineering. Heliyon 2024, 10, e27387. [Google Scholar] [CrossRef]


| Study References | Approach | Key Benefits | Industrial/Area |
| [23] | AHP-QFD combined with zero-one goal Programming (ZOGP) binary model | Effective site selection for cargo logistics centers, managed budget constraints, demonstrated managerial decision-making effectiveness | Cargo Logistics Centers |
| [24] | AHP-QFD method | Enhances prioritization of customer requirements in new product development, leading to better design alternatives. | New Product Development |
| [25] | QFD integrating Kano model and fuzzy AHP | Improves value in product–service systems (PSSs) by focusing on customer requirements and managing uncertainty. | PSS |
| [26] | QFD and AHP | Improved design quality in buildings, better selection of design criteria, increased customer satisfaction | Building Design |
| [27] | AHP-QFD | Enhanced student information system, alignment of improvements with institutional capabilities | Educational Systems |
| [28] | AHP-QFD | Balanced cultural preservation with commercial value, innovative renovation method for traditional houses | Traditional Residential Renovation |
| [29] | AHP-QFD | Comprehensive framework for smart parking system design, enhanced user satisfaction and operational efficiency | Smart Parking Systems |
| [30] | AHP-QFD | Ensures that the new design meets stakeholder requirements, improving the usability and functionality of temperature-controlled medicine bags. | Medical Equipment Design |
| Study Reference | QFD | AHP AHP-QFD | Fuzzy Logic, Fuzzy QFD, Fuzzy AHP-QFD | ANP ANP-QFD |
|---|---|---|---|---|
| Strength | ||||
| [45] | This study does not provide information about this part. | AHP is simple and easy to understand, making it accessible to decision-makers without a strong background in mathematics. It is effective for multi-criteria decision making and provides a clear hierarchical structure. | Fuzzy methods are effective in managing uncertainty and imprecision in judgments. They handle inconsistent data well and provide a flexible decision-making framework. | ANP handles interdependence among criteria and feedback effects, making it more flexible and realistic in complex decision-making scenarios, and providing a more comprehensive analysis than AHP |
| [46] | QFD is commonly used in the field of new product development to translate customer requirements into appropriate engineering characteristics. It demonstrates how quality characteristics can effectively satisfy customer requirements. | QFD-AHP enhances the effectiveness of the decision-making process and is also utilized to manage the subjective linguistic judgments that arise when expressing relationships and correlations necessary in the QFD approach. | Fuzzy logic has been adapted into QFD to minimize the vagueness frequently present in decision data. | This study does not provide information about this part. |
| [47] | A simplified form of QFD in product design offers an easy method for implementation, analysis, and documentation. It effectively connects customer needs with product features, enhances teamwork communication, and reduces product development cycle times. | These methods, discussed in terms of comprehensive or improved versions of QFD, offer opportunities to gain a competitive advantage by better meeting client needs. These versions emphasize teamwork and improve the systematic nature and prioritization of client requirements, notably reducing the subjective nature typically associated with the initial phases or simplified versions of QFD. | ||
| [25] | QFD is highly effective in capturing and translating customer needs into specific engineering characteristics. It provides a systematic process for prioritizing customer requirements and enhances communication among different departments. | AHP-QFD integrates hierarchical structuring and prioritization capabilities, allowing for quantitative comparison and improving decision-making accuracy. This combined approach results in a clearer and more structured decision-making process. | Fuzzy QFD uses fuzzy logic to manage ambiguity in customer requirements, reduces biases by converting subjective evaluations into fuzzy numbers, and improves decision-making with uncertain information. | The QFD for the PSS method with ANP to examine the relationships between the ‘whats’ and ‘hows’ of each matrix could be beneficial. It may enhance the understanding of the inter- and intra-relationships within PSS. |
| Limitations | QFD | AHP AHP-QFD | Fuzzy logic, fuzzy QFD, fuzzy AHP-QFD | ANP ANP-QFD |
| [45] | This study does not provide information about this part. | AHP assumes independence among criteria and is limited in handling interdependence and feedback. | Fuzzy logic can be computationally intensive and requires significant resources and time. Its accuracy depends heavily on the precise definition of membership functions, which can be challenging to determine. | ANP is more complex and time-consuming due to its consideration among criteria. And requires detailed pairwise comparisons. |
| [46] | QFD has limitations due to subjective linguistic judgments when expressing relationships and correlations required in the House of Quality (HOQ). Additionally, it often deals with vagueness in decision data. | The main limitations of AHP highlighted are the sensitivity to the addition of alternatives and the need for more specific pairwise comparison questions to ensure rank preservation and consistency. | This study does not provide information about this part. | This study does not provide information about this part. |
| [47] | The simplified form of QFD, its primarily qualitative and subjective nature, which can make categorizing the fuzzy nature of customer needs challenging. Additionally, it may not be suitable for all industries. | These methods in terms of comprehensive or improved versions of QFD, particularly when using more complex, multi-matrix approaches. The size of all matrices and the analysis can become very large, leading to challenges in implementing numerous conclusions derived from the analysis. It also demands extensive knowledge and skills from the team executing the method. If the team lacks sufficient understanding or skills, it can further slow down the performance of QFD analysis. | ||
| [25] | QFD process often involves subjective judgments, which can lead to biases. Additionally, maintaining and updating the QFD matrices can be challenging). | The integration process can be resource-intensive, requiring detailed data collection and extensive pairwise comparisons. It can also be complex to implement, especially for teams unfamiliar with both AHP and QFD methodologies. Ensuring consistency in pairwise comparisons can be challenging | Implementing fuzzy logic is computationally intensive and requires significant resources and time. Its accuracy depends on precise membership function definitions, which can be challenging, and there is a steep learning curve | This study does not provide information about this part. |
| [48] | QFD does not clearly minimize customer requirements and feature requirements | This study does not provide information about this part. | The use of ANP and fuzzy QFD is difficult for obtaining the correct network structure and minimizing requirements from QFD, especially when compared to unsupervised machine learning techniques. | |
| Quality Requirement | Airport Cargo Logistic Center Site Requirement | Important Weighting of Requirements | ||||||||
|---|---|---|---|---|---|---|---|---|---|---|
| FR1: Airport Land Feature | FR2: Considering Airport Operating Handling Cost | FR3: Airport Carrying Condition | FR4: Closeness to Airline Agent and Customer | FR5: Local Political Regulation and Law | FR6: Improvement District’s Working | FR7: Airport Labor Status | FR8: Airport Electrical Power/Utilities | FR9: Airport Information Technology Status | ||
| CR1 | 3 | 9 | 9 | 3 | 9 | 9 | 3 | 9 | 0.300 | |
| CR2 | 9 | 9 | 9 | 3 | 3 | 3 | 3 | 9 | 0.060 | |
| CR3 | 9 | 9 | 3 | 9 | 3 | 1 | 0.087 | |||
| CR4 | 9 | 9 | 3 | 3 | 3 | 0.030 | ||||
| CR5 | 9 | 3 | 3 | 0.127 | ||||||
| CR6 | 3 | 9 | 3 | 9 | 0.124 | |||||
| CR7 | 3 | 3 | 9 | 9 | 0.042 | |||||
| CR8 | 9 | 1 | 3 | 3 | 9 | 0.021 | ||||
| CR9 | 9 | 9 | 9 | 0.017 | ||||||
| CR10 | 9 | 9 | 3 | 9 | 9 | 0.192 | ||||
| Importance degree | 2.865 | 8.406 | 3.330 | 4.227 | 3.687 | 2.727 | 3.474 | 2.868 | 5.628 | |
| Normalize important degree | 7.7 | 22.6 | 8.9 | 11.4 | 9.9 | 7.3 | 9.3 | 7.7 | 15.1 | |
| Controlled Temperature Medicine Bag Design Features | Important Weighting of Requirements | ||||||||||||||
|---|---|---|---|---|---|---|---|---|---|---|---|---|---|---|---|
| * Customer Requirements | FR1: Insulation Ability of Inner Layer | FR2: Heat Reflection Ability | FR3: Anti-Shock Ability | FR4: Cooling Ability | FR5: Temperature Indicator | FR6: Ziploc Enclosure | FR7: Carry Handle | FR8: Bag Form | FR9: Weight | FR10: Size | FR11: Medical Disposable Item | FR12: Reusable | FR13: Safety Material | FR14: Price | |
| CR1 | 9 | 9 | 9 | 1 | 3 | 1 | 1 | 4.94 | |||||||
| CR2 | 9 | 9 | 9 | 1 | 3 | 3 | 4.91 | ||||||||
| CR3 | 9 | 4.66 | |||||||||||||
| CR4 | 9 | 1 | 3 | 1 | 9 | 4.96 | |||||||||
| CR5 | 3 | 9 | 3 | 1 | 1 | 4.84 | |||||||||
| CR6 | 3 | 3 | 3 | 3 | 9 | 9 | 9 | 3 | 4.43 | ||||||
| CR7 | 3 | 9 | 3 | 9 | 9 | 9 | 9 | 3 | 3 | 3.71 | |||||
| CR8 | 3 | 3 | 3 | 1 | 9 | 3 | 1 | 9 | 9 | 9 | 4.87 | ||||
| CR9 | 1 | 1 | 1 | 1 | 3 | 9 | 9 | 3 | 3 | 3.82 | |||||
| CR10 | 9 | 3 | 1 | 9 | 4.98 | ||||||||||
| CR11 | 3 | 9 | 4.69 | ||||||||||||
| CR12 | 1 | 1 | 9 | 1 | 9 | 9 | 1 | 3 | 9 | 9 | 5.00 | ||||
| CR13 | 9 | 3 | 3 | 3 | 3.54 | ||||||||||
| CR14 | 9 | 3 | 9 | 9 | 3 | 5.00 | |||||||||
| CR15 | 3 | 3 | 3 | 9 | 1 | 9 | 4.83 | ||||||||
| CR16 | 9 | 9 | 9 | 9 | 9 | 1 | 1 | 9 | 3 | 9 | 5.00 | ||||
| CR17 | 3 | 3 | 3 | 3 | 3 | 1 | 1 | 3 | 9 | 3.35 | |||||
| TRs weight | 194.94 | 223.98 | 187.54 | 175.64 | 195.67 | 235.24 | 76.21 | 322.38 | 132.75 | 174.96 | 237.15 | 64.30 | 254.26 | 79.35 | |
| Important (%) | 7.63 | 8.77 | 7.34 | 6.88 | 7.66 | 9.21 | 2.98 | 12.62 | 5.20 | 6.85 | 9.28 | 2.52 | 9.95 | 3.11 | |
| New Earphone Development Technical Requirements | Important Weighting of Requirements | ||||||||||
|---|---|---|---|---|---|---|---|---|---|---|---|
| * Customer Requirements | FR1: Material | FR2: Structure | FR 3: Wireless | FR4: Sealing | FR5: Battery Capacity | FR6: Power Consumption | FR7: Appearance | FR8: Weight | FR9: Connection Wire Length | FR10: Diaphragm Design | |
| CR1 | 2 | 3 | 3 | 0.239 | |||||||
| CR2 | 2 | 3 | 0.143 | ||||||||
| CR3 | 3 | 3 | 0.022 | ||||||||
| CR4 | 1 | 3 | 0.058 | ||||||||
| CR5 | 3 | 0.057 | |||||||||
| CR6 | 2 | 2 | 3 | 0.026 | |||||||
| CR7 | 2 | 3 | 1 | 2 | 0.099 | ||||||
| CR8 | 3 | 2 | 2 | 0.037 | |||||||
| CR9 | 3 | 2 | 0.077 | ||||||||
| CR10 | 2 | 2 | 3 | 0.242 | |||||||
| FRs Weight | 196 | 179 | 5.4 | 17 | 171.7 | 11.37 | 60 | 182 | 59.74 | 121.1 | |
| * CRi | X1 | X2 | X3 |
|---|---|---|---|
| CR1 | Quick/accurate logistic ability | Keep Cool | Lightweight |
| CR2 | Comfortable logistic | Cooling generator | Hold position |
| CR3 | Adequate building space | Temperature display | Wireless |
| CR4 | Proper logistics center site | Anti-shock | An open ear for health |
| CR5 | Reasonable logistics fee | External heat protector | An open ear for safety |
| CR6 | Easy to load/unload | Temperature display | Waterproof |
| CR7 | Adequate airport service supply | Bag form | Comfort |
| CR8 | Sufficient public facilities | Trustworthy | Easy to carry |
| CR9 | Stable economic utilities provide | Lightweight | Continuous usage |
| CR10 | Quick delivery service capability | Covering | Cool appearance |
| CR11 | Sufficient capacity | ||
| CR12 | Safety | ||
| CR13 | Easy to carry | ||
| CR14 | Easy to clean | ||
| CR15 | Suitable price | ||
| CR16 | Quality material | ||
| CR17 | Other utilities |
| * FRi | X1 | X2 | X3 |
|---|---|---|---|
| FR1 | Airport land feature | Insulation ability of the inner layer | Material |
| FR2 | Considering airport operating handling cost | Heat reflection ability of the outer layer | Structure |
| FR3 | Airport carrying condition | Anti-shock ability | Wireless |
| FR4 | Closeness to airline agent and customer | Cooling ability | Sealing |
| FR5 | Local political regulation and law | Temperature indicator | Battery capacity |
| FR6 | Improvement district’s working | Ziploc enclosure | Power consumption |
| FR7 | Airport labor status | Carry handle | Appearance |
| FR8 | Airport electrical power/utilities | Bag form | Weight |
| FR9 | Airport information technology status | Weight | Connection wire length |
| FR10 | Size | Diaphragm design | |
| FR11 | Medical disposable item | ||
| FR12 | Reusable | ||
| FR13 | Safety material | ||
| FR14 | Price |
| Participant Expertise | Opinion |
|---|---|
| Environmental Technical Artists in the Game Industry with Architectural Design Knowledge (6 Years’ Experience) | Method 2 is faster because it evaluates a single dimension. However, Method 1 might provide more accurate answers in specific contexts, saving time in the long run. Method 1 is more comprehensive; early-stage analysis is crucial, and although it takes more time initially, it leads to better, more accurate development. |
| Senior IT Specialist/robotic system design (15 Years’ Experience) | Method 2 can reduce evaluation time by approximately 90%. Method 2 is better for evaluation and decision-making, but Method 1 emphasizes detailed requirements. |
| IT/Front-End Developer (8 Years’ Experience) | Method 2 can reduce evaluation time by 70%. Method 2 is faster for comparative results and finding solutions at every stage. |
| Product and Innovation Design Research Center (4 Years’ Experience/2 Years’ Experience) | Method 2 is more effective because its results are less complex, making it faster to evaluate key features. Within limited time, Method 2 provides more accurate evaluations. However, with unlimited time, both methods are equally accurate, though Method 1 requires more experience and time. Method 2 remains a suitable choice because its results are quicker to interpret, reducing time. However, if the decision-maker lacks experience, Method 1 might be more accurate but requires more time. |
| Interaction Design and Innovation Master Students (3 Years’ Experience in Banking system, 2 Years’ Experience as UX/UI design student) | Method 2 is quicker for identifying key requirements due to its visual and ordered presentation. Method 2 can reduce time by 40%, though it might require an additional 20% for re-evaluation. Method 1 is better for detailed understanding. Method 1 should still be prioritized for deep understanding, even though Method 2 helps reduce time. Method 1 is suitable for ministerial-level analysis, while Method 2 is for managerial and decision-making levels. |
| Innovation Designer (10 Years’ Experience) | Method 2 can reduce the time needed for defining important features by 70%. Method 2 might take slightly more time in pre-analysis but benefits the design phase by reducing overall time. |
| Educational Designers (33 Years’ Experience) | Method 2 can reduce time by 90% due to its straightforward and clear results, which are easier and faster to interpret, making it more efficient. Method 2 is more efficient, even if it takes slightly more time in pre-analysis, as it provides 90% efficiency in aligning with CRs. |
| Traffic and Route Designers (41 Years’ Experience) | Method 2 can reduce time by 95% due to its clear and quick interpretation of results. Method 2, despite taking more time in preparation, offers clearer and more efficient results, highly favored by clients. |
Disclaimer/Publisher’s Note: The statements, opinions and data contained in all publications are solely those of the individual author(s) and contributor(s) and not of MDPI and/or the editor(s). MDPI and/or the editor(s) disclaim responsibility for any injury to people or property resulting from any ideas, methods, instructions or products referred to in the content. |
© 2024 by the authors. Licensee MDPI, Basel, Switzerland. This article is an open access article distributed under the terms and conditions of the Creative Commons Attribution (CC BY) license (https://creativecommons.org/licenses/by/4.0/).
Share and Cite
Apichonbancha, P.; Lin, R.-H.; Chuang, C.-L. Integration of Principal Component Analysis with AHP-QFD for Improved Product Design Decision-Making. Appl. Sci. 2024, 14, 5976. https://doi.org/10.3390/app14145976
Apichonbancha P, Lin R-H, Chuang C-L. Integration of Principal Component Analysis with AHP-QFD for Improved Product Design Decision-Making. Applied Sciences. 2024; 14(14):5976. https://doi.org/10.3390/app14145976
Chicago/Turabian StyleApichonbancha, Pimolphan, Rong-Ho Lin, and Chun-Ling Chuang. 2024. "Integration of Principal Component Analysis with AHP-QFD for Improved Product Design Decision-Making" Applied Sciences 14, no. 14: 5976. https://doi.org/10.3390/app14145976
APA StyleApichonbancha, P., Lin, R.-H., & Chuang, C.-L. (2024). Integration of Principal Component Analysis with AHP-QFD for Improved Product Design Decision-Making. Applied Sciences, 14(14), 5976. https://doi.org/10.3390/app14145976