Article

Reliability of Automated Intracranial Volume Measurements by Synthetic Brain MRI in Children

by
Veronika Weiss
1,†,
Nathan Vishwanathan
1,2,†,‡,
Anja Dutschke
1,*,
Nikolaus Stranger
1,
Mario Scherkl
1,
Eszter Nagy
1,
Andreea Ciornei-Hoffman
1,3 and
Sebastian Tschauner
1
1
Division of Pediatric Radiology, Department of Radiology, Medical University of Graz, 8036 Graz, Austria
2
Second Faculty of Medicine, Charles University, 116 36 Prague, Czech Republic
3
Department of Radiology and Medical Imaging, ”Iuliu Hatieganu” University of Medicine and Pharmacy, 400347 Cluj-Napoca, Romania
*
Author to whom correspondence should be addressed.
These authors contributed equally to this work.
Current address: Clinic of Radiology and Nuclear Medicine, University Hospital Basel, 4031 Basel, Switzerland.
Appl. Sci. 2024, 14(11), 4751; https://doi.org/10.3390/app14114751
Submission received: 9 April 2024 / Revised: 23 May 2024 / Accepted: 27 May 2024 / Published: 31 May 2024
(This article belongs to the Special Issue Advances in Magnetic Resonance Imaging (MRI))

Abstract

:
(1) Background: Hydrocephalus poses challenges in pediatric neuroimaging, and conventional MRI methods have limitations regarding its accurate quantification. Synthetic MRI (SyMRI) offers a promising automated solution to assess intracranial compartment volumes. However, its clinical utility in pediatric patients remains underexplored. Our study aims to assess the accuracy and reliability of automated CSF volume measurements using SyMRI in children and adolescents, comparing them with manual measurements and human expert ratings. (2) Methods: A single-center retrospective study included 124 pediatric patients undergoing cranial MRI with SyMRI. CSF, brain parenchyma, and intracranial volumes were measured using both automated SyMRI and manual methods. Human radiologists assessed hydrocephalus subjectively. (3) Results: Correlations between manual and SyMRI volume evaluations were significant. Human raters demonstrated good agreement on hydrocephalus ratings among themselves (Fleiss’ kappa = 0.66, p < 0.001) but only moderate agreement with the SyMRI method (Cohen’s kappa = 0.45, p < 0.001). SyMRI volumes were systematically tendentially higher in SyMRI (CSF p = 0.005; BPV and ICV p < 0.001). (4) Conclusions: Our findings highlight SyMRI’s reliability in assessing hydrocephalus and intracranial volumes in pediatric cases. Despite some differences from manual measurements, the strong correlation suggests its clinical viability.

1. Introduction

Hydrocephalus, a condition characterized by increased amounts of cerebrospinal fluid (CSF) within the cerebral ventricles, poses significant challenges in pediatric neuroimaging. The diagnosis is usually based on Ultrasound, Magnetic Resonance Imaging (MRI), or Computed Tomography (CT) studies and a radiologist’s subjective assessment and experience or simple width measurements [1]. Incipient cases of hydrocephalus can be relatively subtle on imaging and easily overlooked, but they can be of critical clinical relevance. This is particularly true in cases in which there is a treatable cause of hydrocephalus or when reducing brain parenchyma. Conventional MRI has been the method of choice in diagnosing and monitoring hydrocephalus in children [2]; however, limitations persist in terms of accurate its quantification and characterization. Recent advancements in imaging technology, particularly the application of automated quantitative MRI, offer a promising avenue to address these challenges in an objective and reproducible manner [3,4].
Synthetic MRI (SyMRI), a technique capable of generating multiple contrast-weighted images from a single acquisition, has demonstrated its utility in various neuroimaging applications [5,6,7,8,9]. Additionally, SyMRI has demonstrated imaging qualities comparable with conventional MRI sequences in some applications [10,11,12,13] while reducing examination duration [7,8,14]. This aspect holds particular promise in the pediatric population, where reducing examination duration and, consequently, the need for anesthesia, holds particular significance. Another aspect that should not be underestimated is the potential time saved using an automated quantitative method that can be seamlessly integrated into the radiology work environment.
There are some reports on SyMRI in childhood and adolescence in the literature which are primarily focused on the comparability of the SyMRI method and other segmentation algorithms [4,15,16,17,18]. In our everyday clinical practice at a tertiary pediatric center with a focus on neuropediatrics, SyMRI is generally used in cases of abnormal head circumference or developmental delay when the main task is to determine whether hydrocephalus or brain substance reduction is evident. Based on the preliminary studies, it seemed expedient to also compare subjective assessments performed by human experts with the quantitative methods.
The main objective of our study was to investigate the accuracy and reliability of automated measurements of CSF volumes as well as ICV and BPV using SyMRI in children and adolescents and to compare the obtained values objectively with manual reference volume measurements and subjectively with human expert ratings.

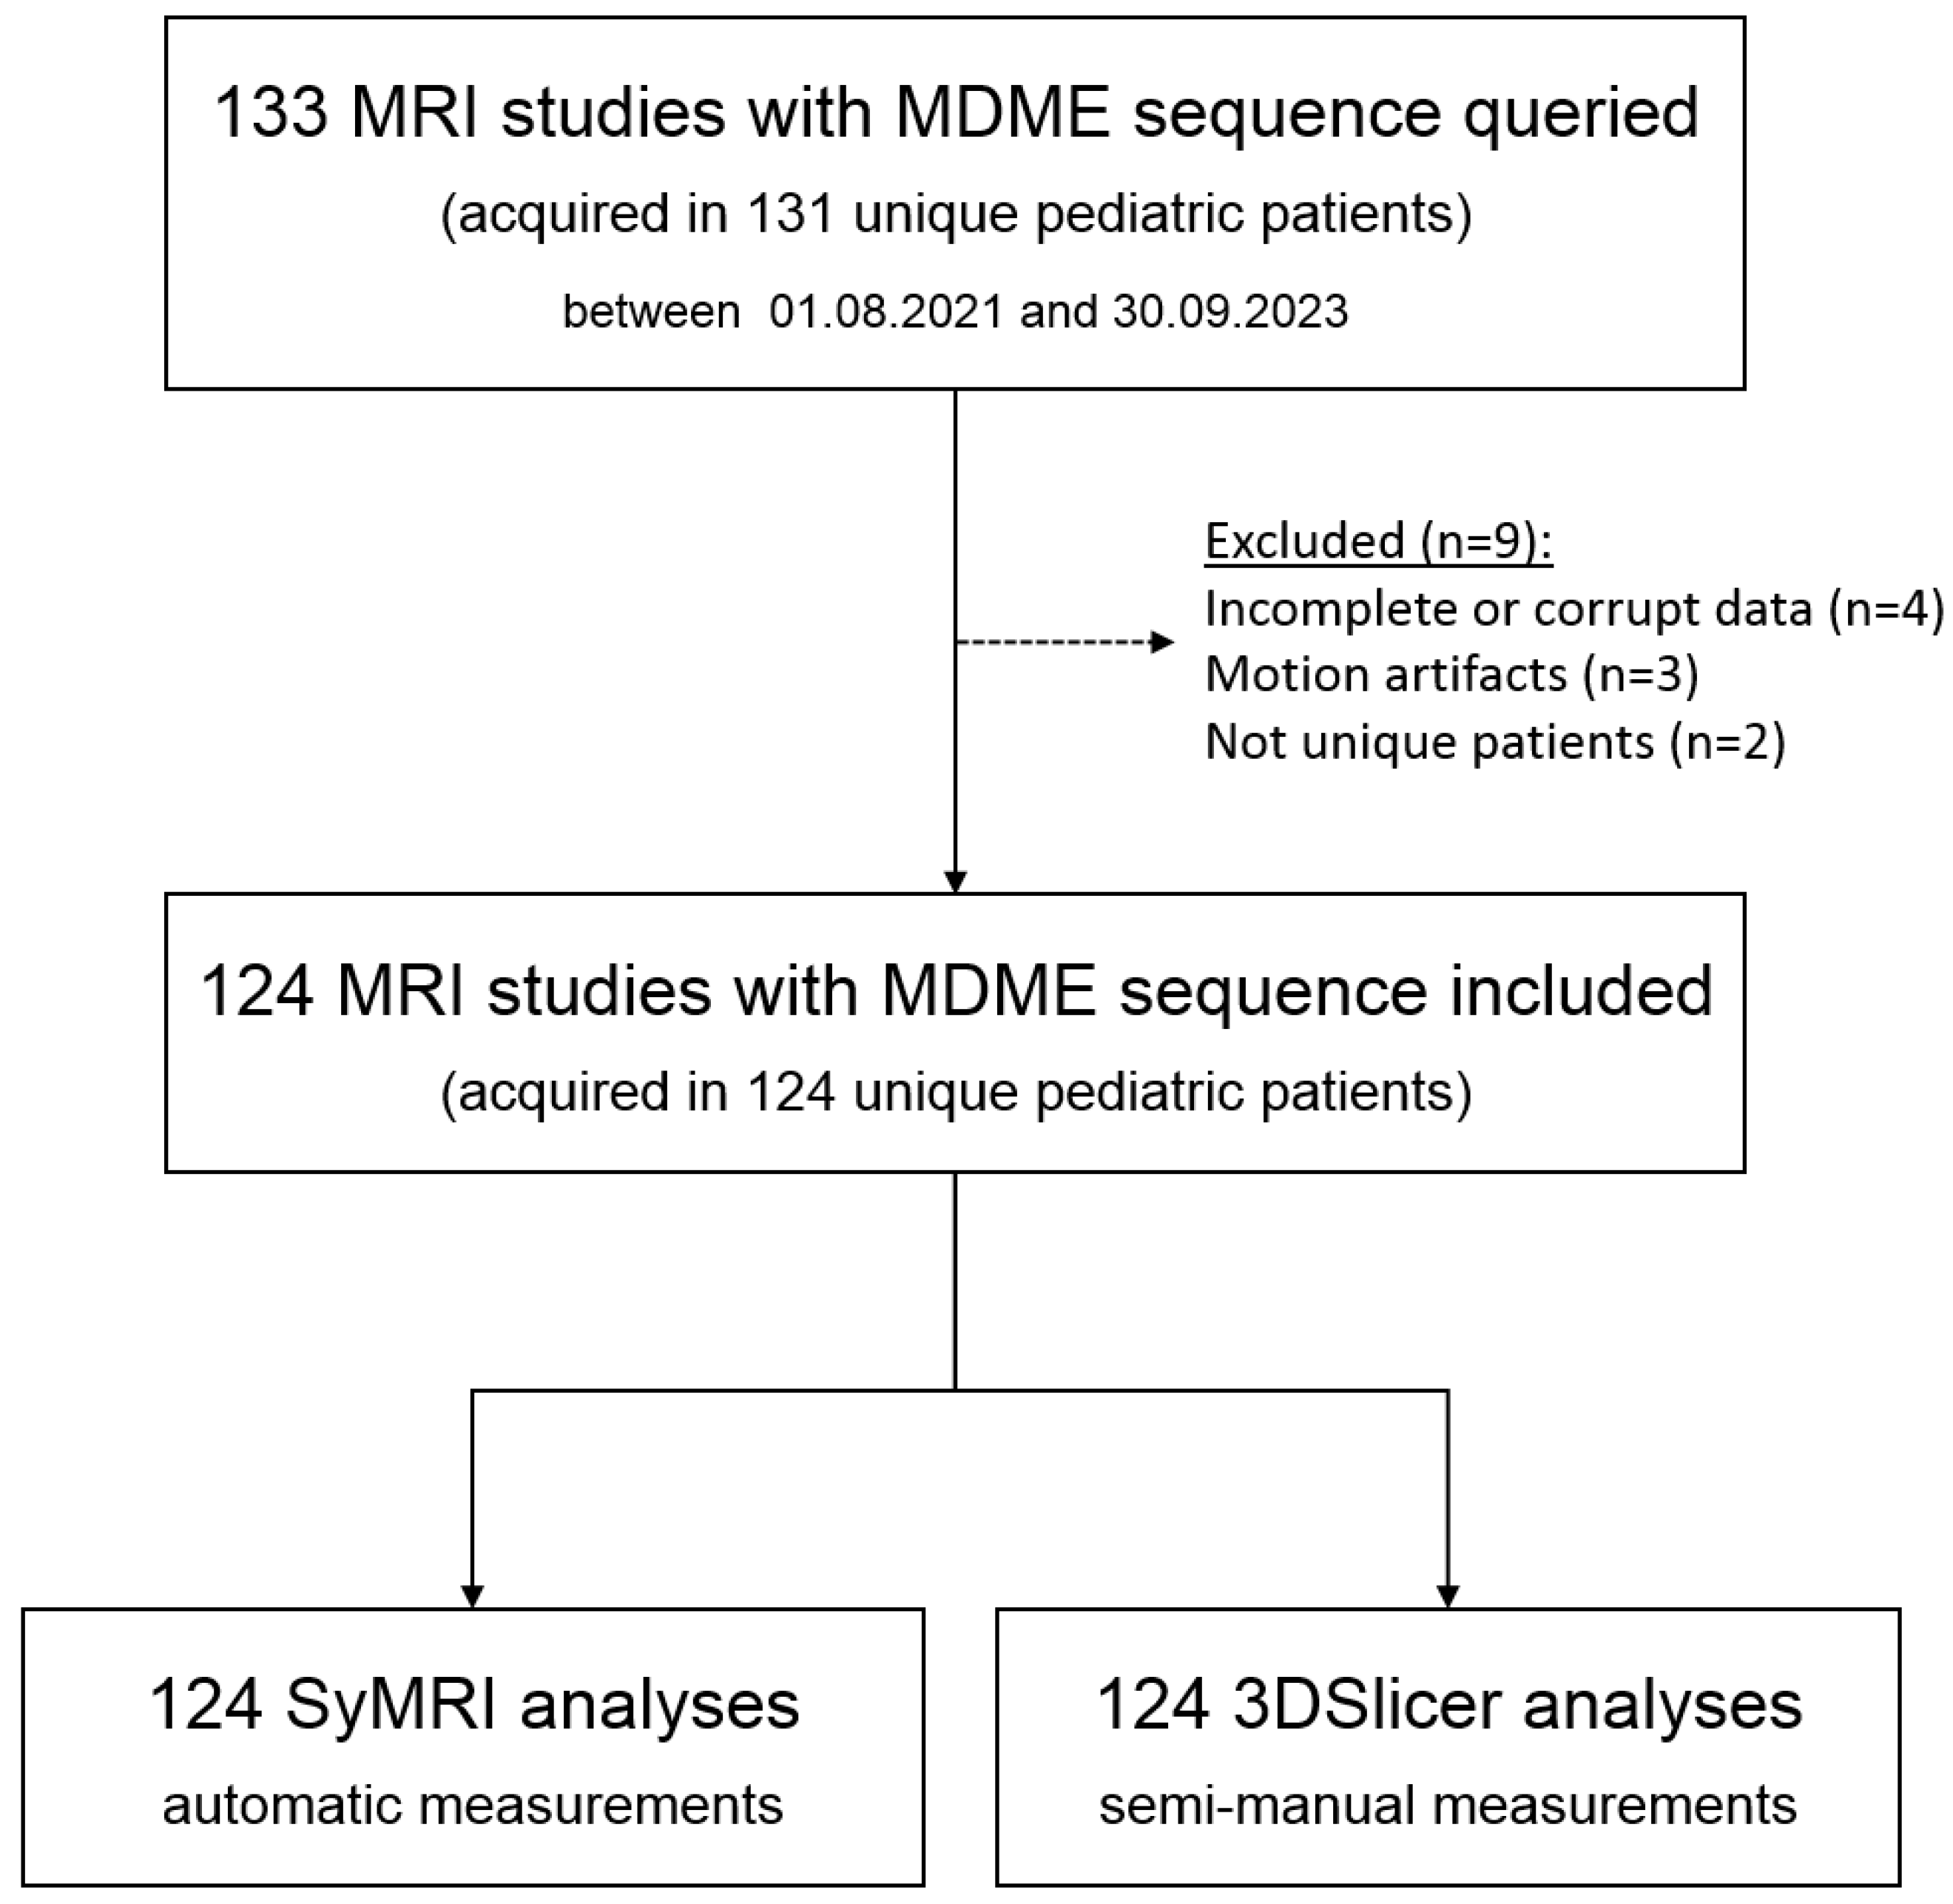
2. Materials and Methods

In this single-center retrospective study, we retrieved all examinations of the brain that contained SyMRI series from the local Picture Archiving and Communications System (PACS). Apart from a patient age greater than 19 years, no exclusion criteria were defined. The data acquisition period was set between 1 August 2021 and 30 September 2023.

2.1. MRI Acquisition

All data were acquired at the Division of Pediatric Radiology, Department of Radiology, Medical University of Graz using a MAGNETOM Sola 1.5-Tesla-field-strength MRI scanner (Siemens Healthineers, Erlangen, Germany). A dedicated pediatric head receiving coil was used consistently. All patients were scanned in a supine position. Depending on the age of the patient, any underlying illnesses, and the respective issue, examinations were also carried out under sedation or general anaesthesia or by using the so-called “feed and wrap” technique. The patients included underwent a Multi-Dynamic Multi-Echo (MDME) [12] sequence from which a series of image weightings and measured parameter maps were subsequently calculated synthetically (Figure 1). The MDME acquisition included a 4 mm slice thickness, a slice gap of 1 mm, and a matrix of 320 × 256 [3]. The acquisition time of the MDME sequence was about 6 min in our scanner.

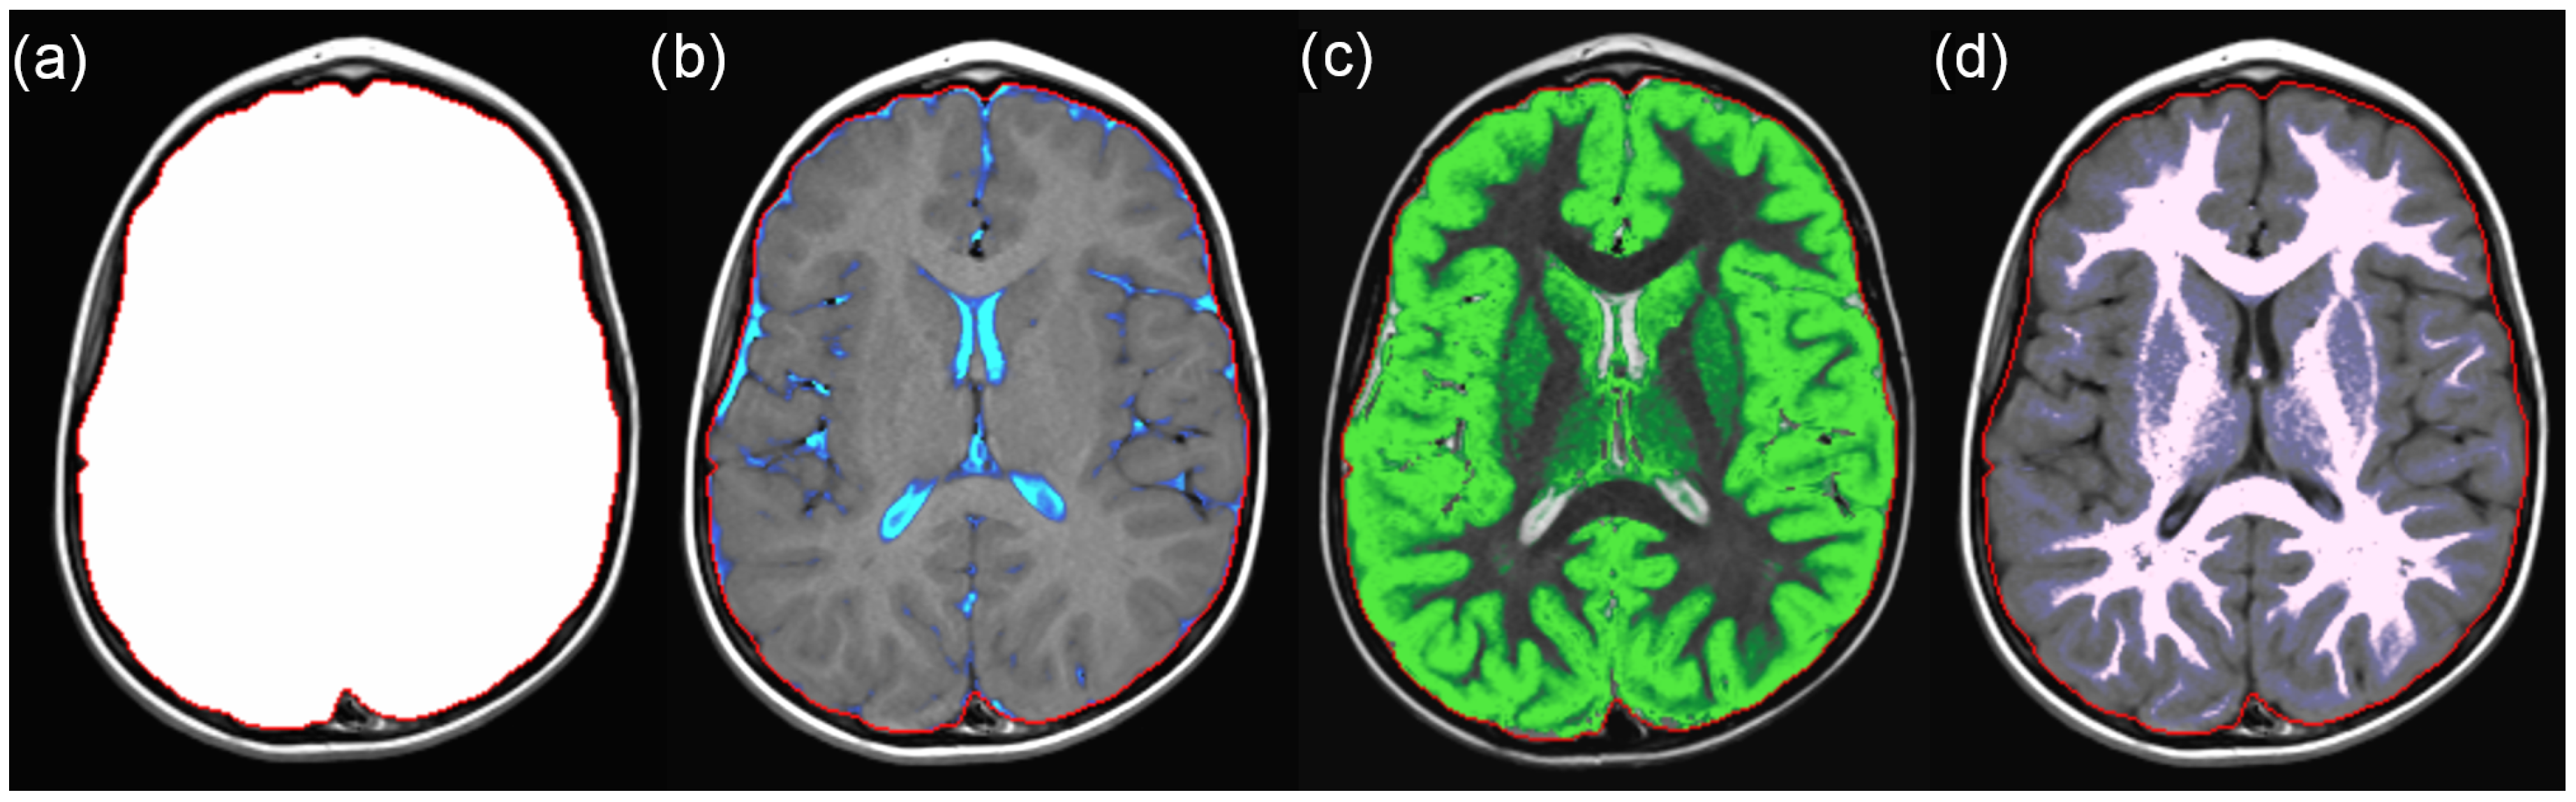
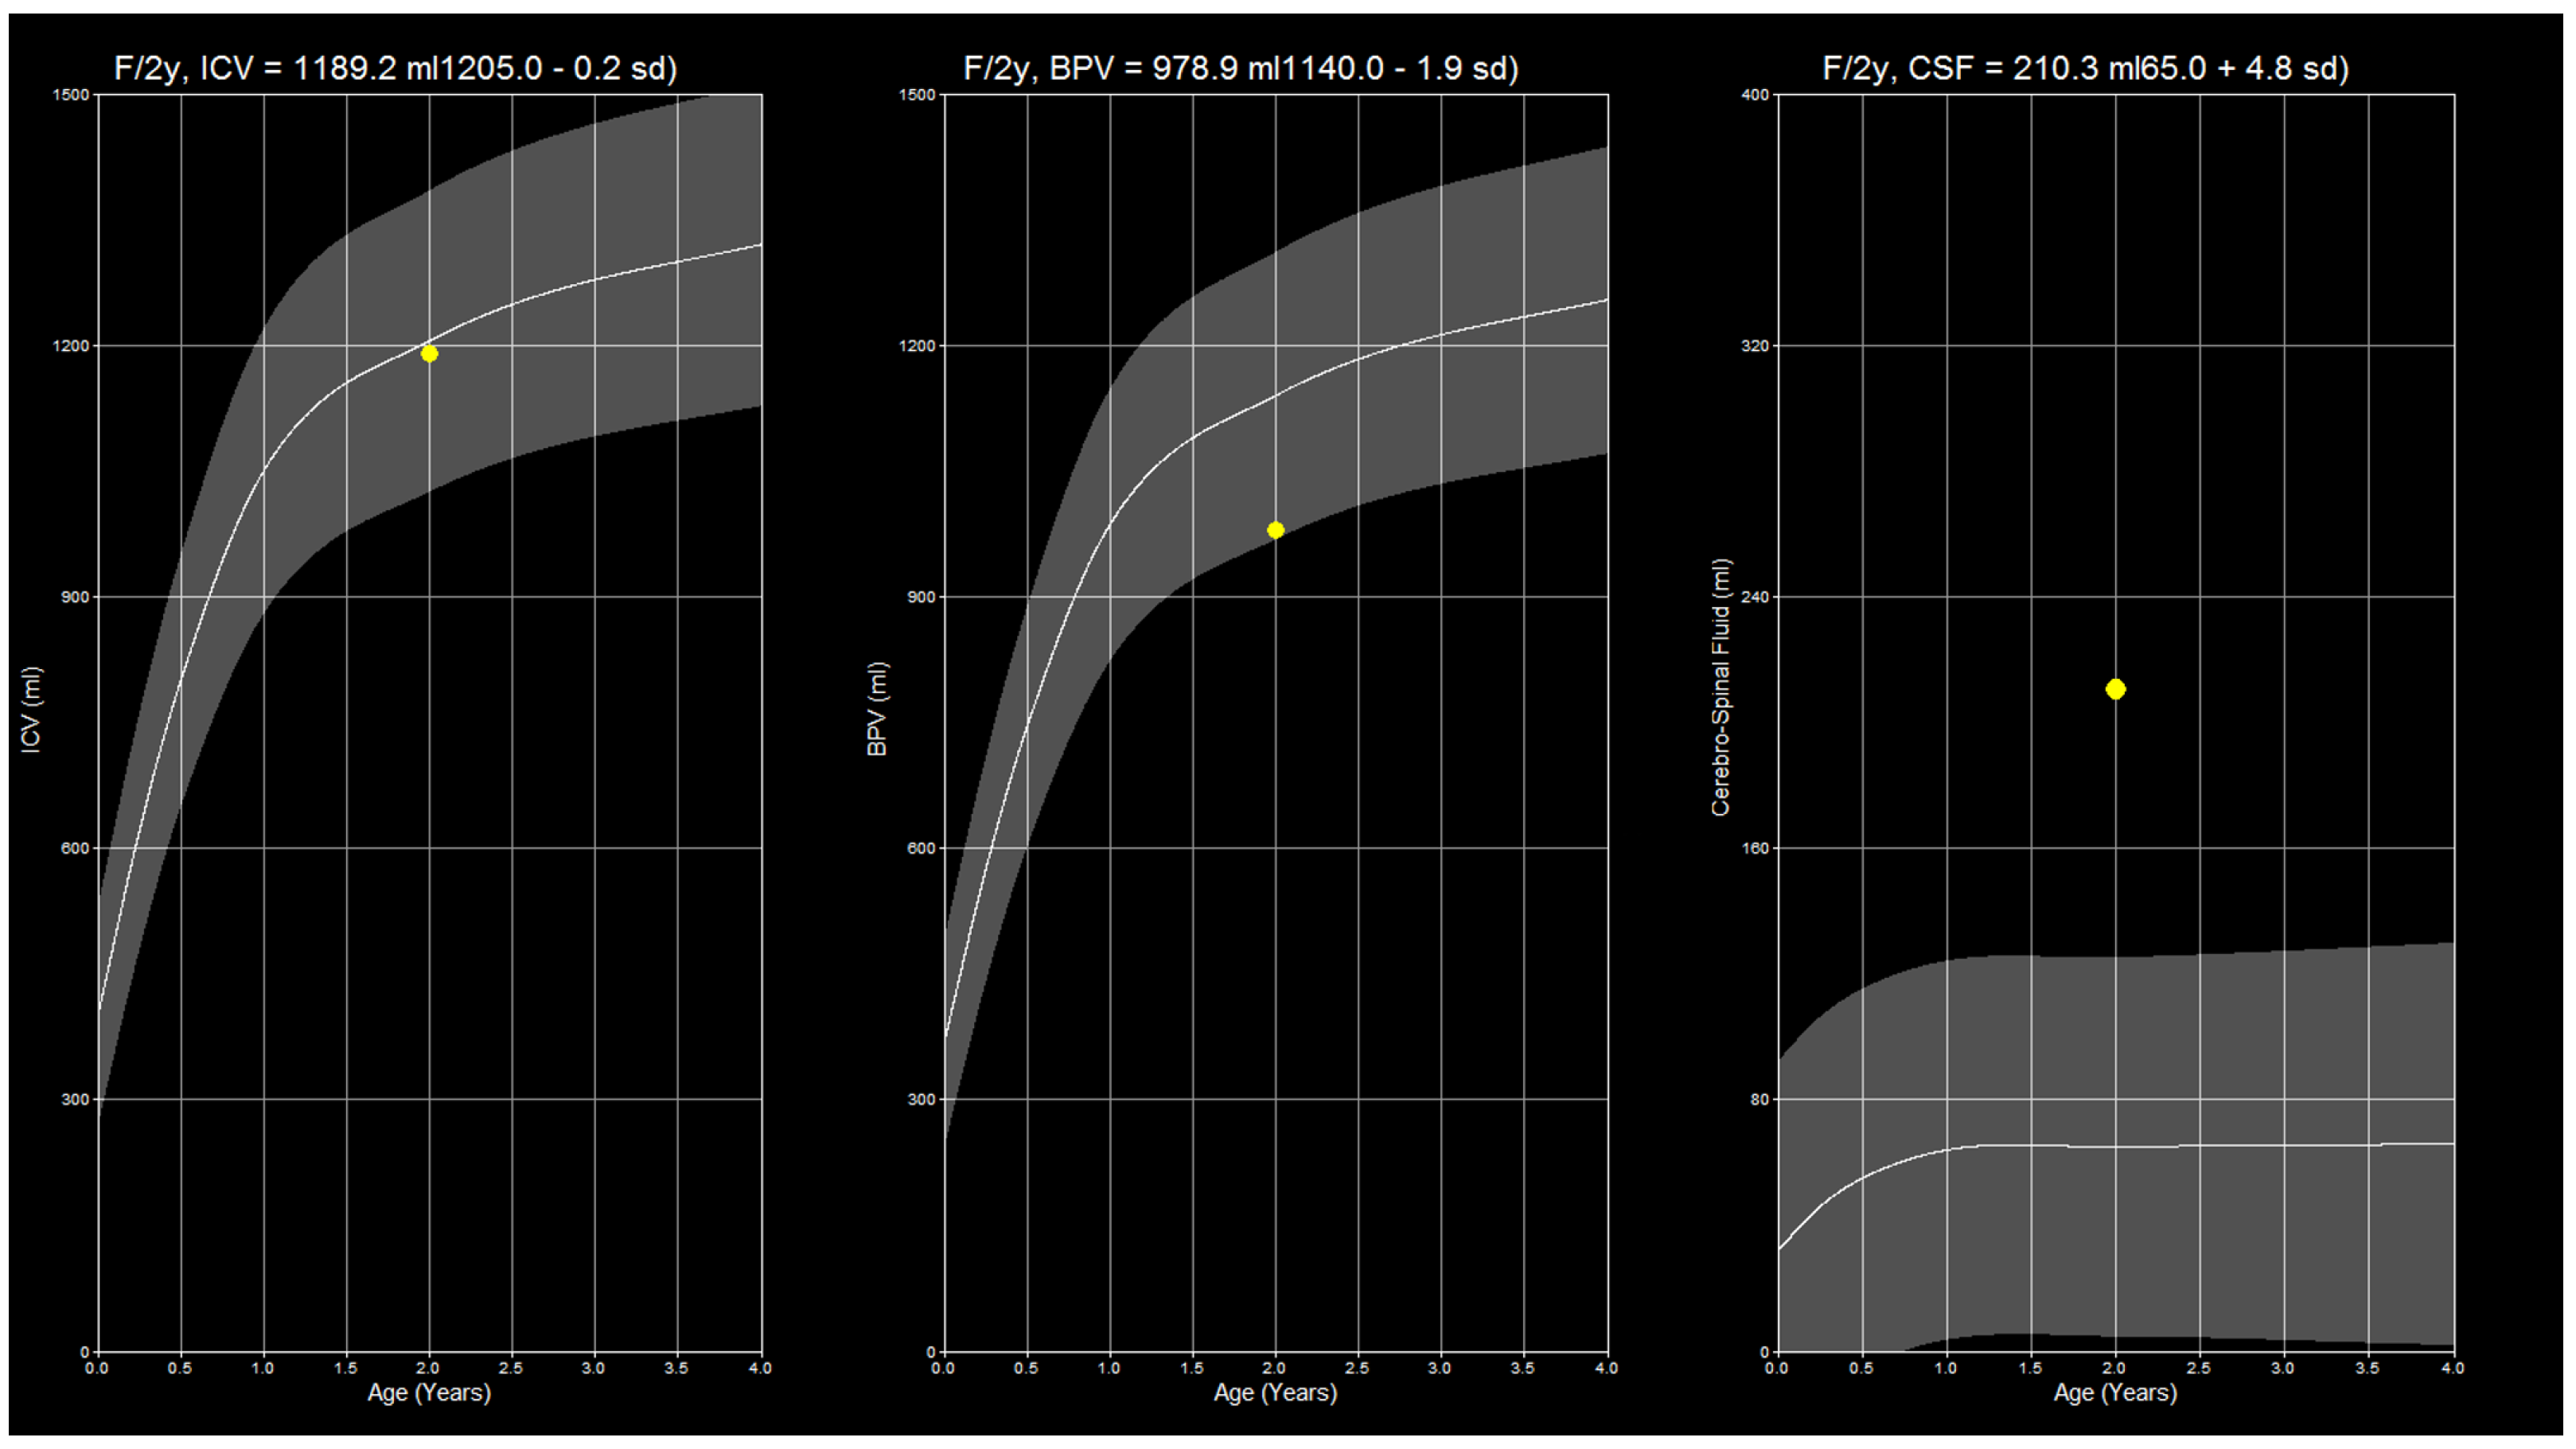
2.2. SyMRI Volume Measurements

The archived MDME sequences were sent to the hospital’s syngo.via (version VB60A_HF06) server (Siemens Healthineers, Erlangen, Germany), which was equipped with the SyMRI software package version 11.2.11 (SyntheticMR AB, Linköping, Sweden). All studies were automatically analyzed using this package. The absolute values for cerebrospinal fluid (CSF), brain parenchyma (BPV), and intracranial volume (ICV) were retrieved together with the respective data points’ standard deviations (SDs). The data were transferred to a table and saved by the examiners. Figure 2 shows reference curves calculated by the SyMRI software.

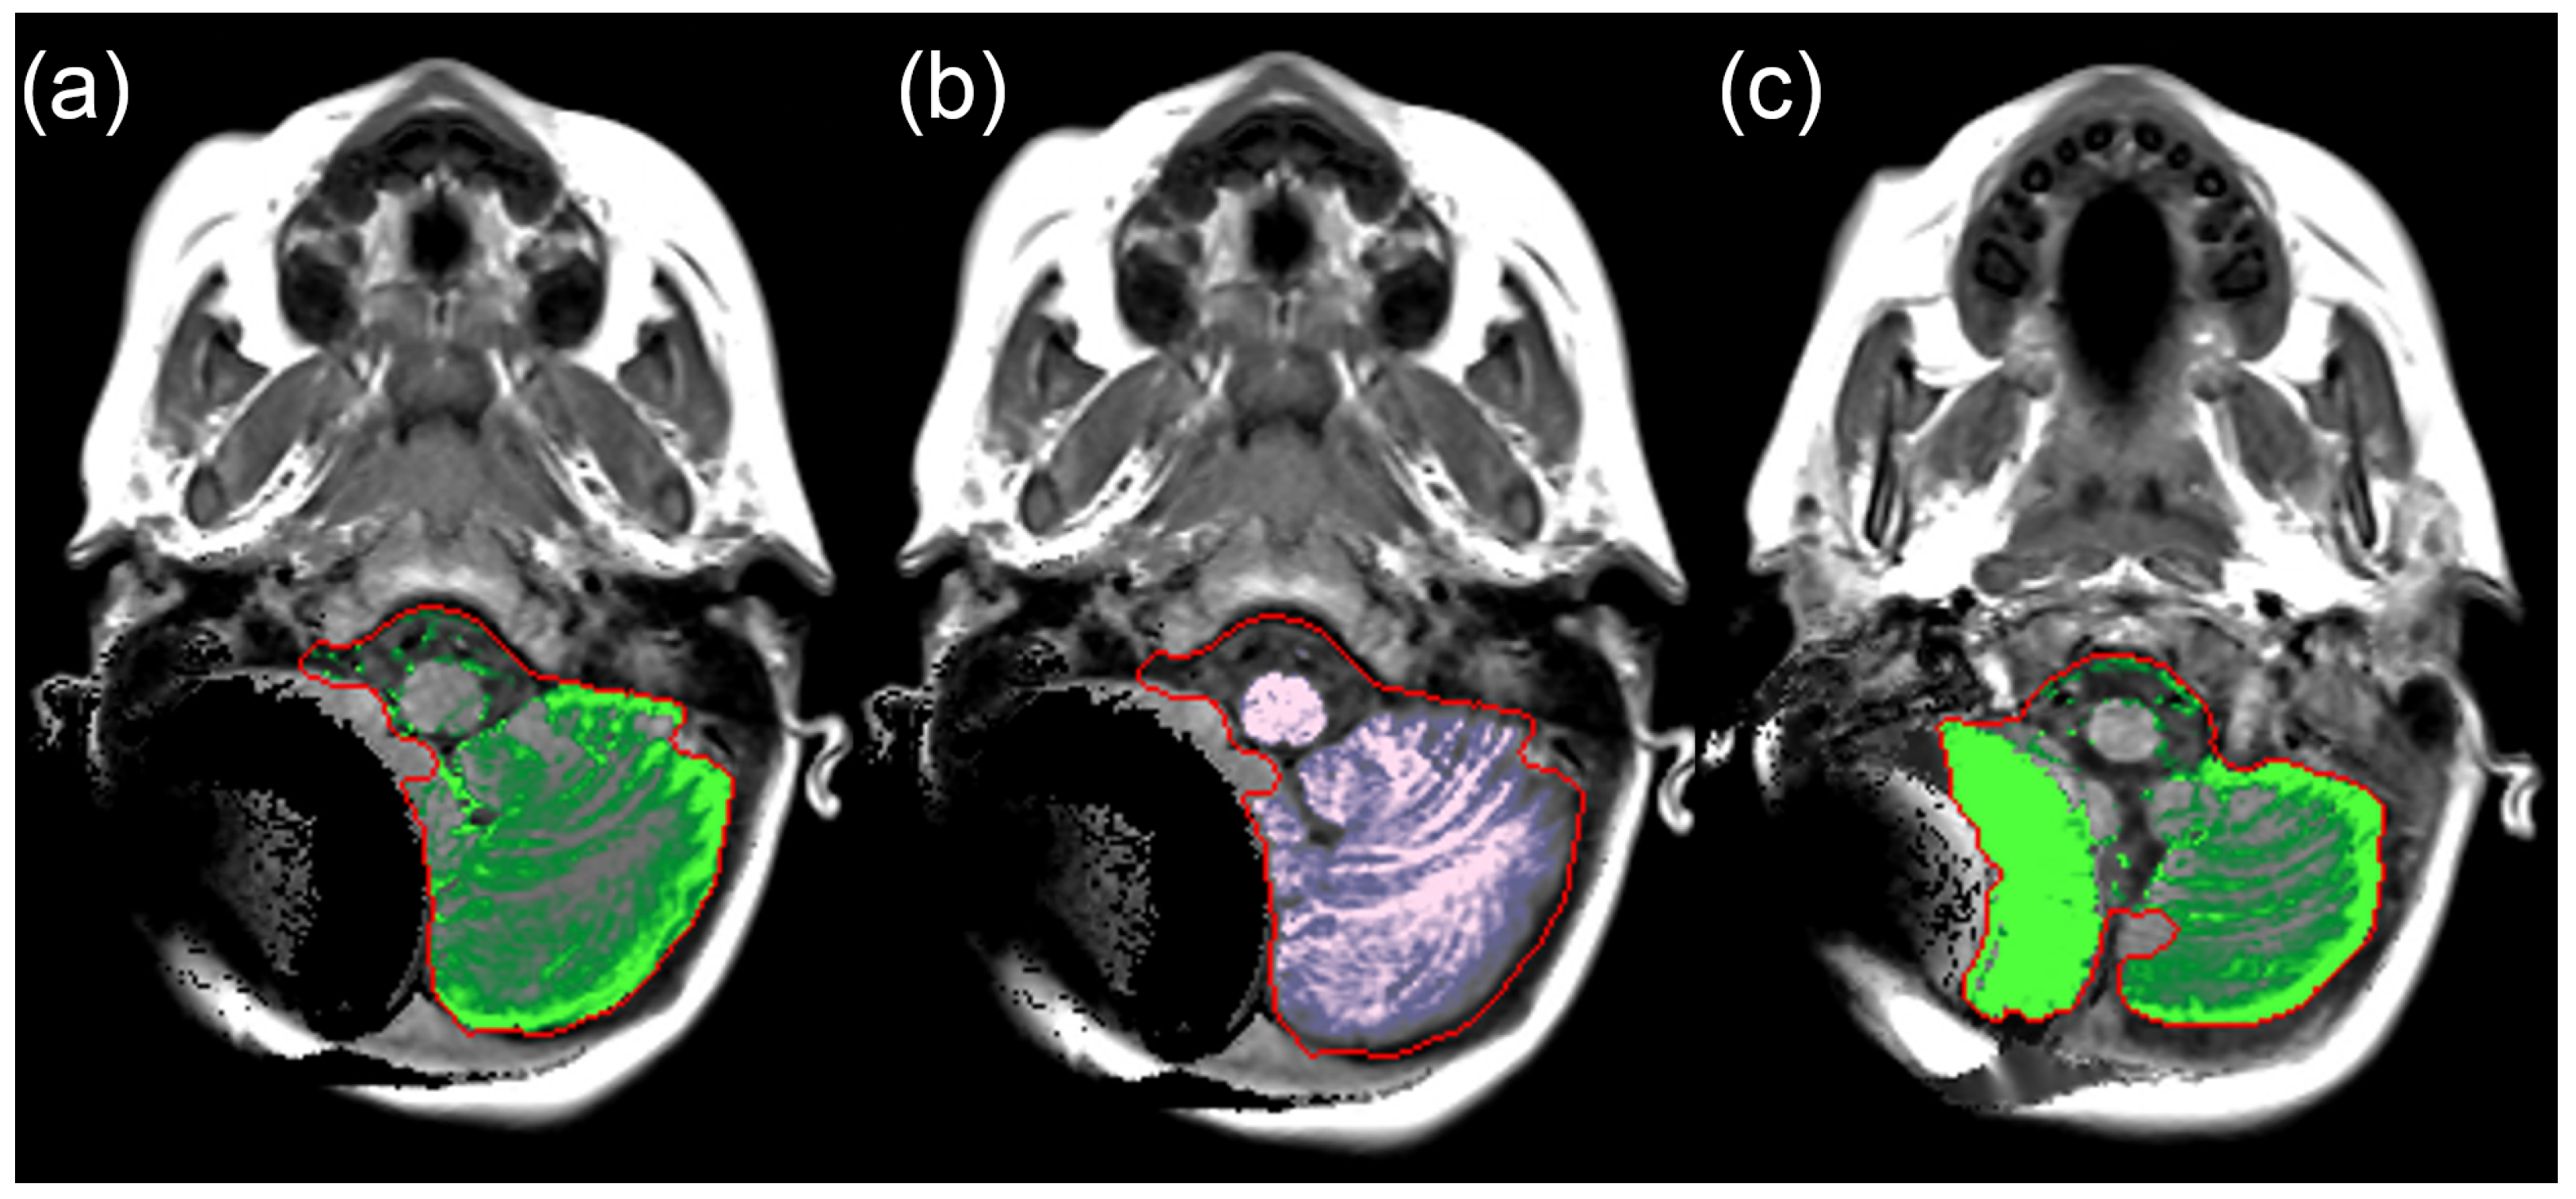
2.3. Manual Volume Measurements

In order to analyse the reliability of the SyMRI measurements, all examinations were additionally conducted manually with regard to the volume of the CSF, the BPV, and the ICV. The images were pre-processed using software to enable faster results as follows: after exporting all native T2 images in Digital Imaging and Communications in Medicine (DICOM) format from our database to a local hard drive, we utilized the Mango viewer (ver. 4.1) to convert them to the NIFTI file format [19]. This step was necessary to be able to use available freeware software tools for post-processing. The NIFTI images were then processed using the FreeSurfer [20] (in our case, ver. 7.4.1 under Windows Subsystem for Linux) integrated tool SynthStrip [21], which provides highly consistent skull stripping for all MRI sequences. Each image was then processed individually using the command lines provided by the developers. Each brain extraction was then manually compared to the original image to ensure that no areas of the brain were lost during the extraction. In the case of incomplete extraction, we used SynthStrip’s inbuilt settings to increase the extraction boundary, using the −b0 flag, where the number in mm corresponds to the adjusted extraction boundary, as specified by the developers. However, the more conservative extraction settings left some notable imperfections in the non-brain material which had to be manually filtered out in the next steps. Finally, we used 3DSlicer [22] (ver. 4.10.2) to perform a threshold-based segmentation of the CSF and parenchyma, which was then manually reviewed and corrected by a pediatric radiologist with 11 years of experience (S.T.) (compare Figure 3); this was especially important in cases of brain lesions. Despite the need for manual corrections, in the search for the appropriate threshold, we found the maximum entropy threshold algorithm for CSF segmentation and the triangle algorithm for total ICV particularly useful. The volumes of the two respective segments were then subtracted from each other to estimate the BPV.

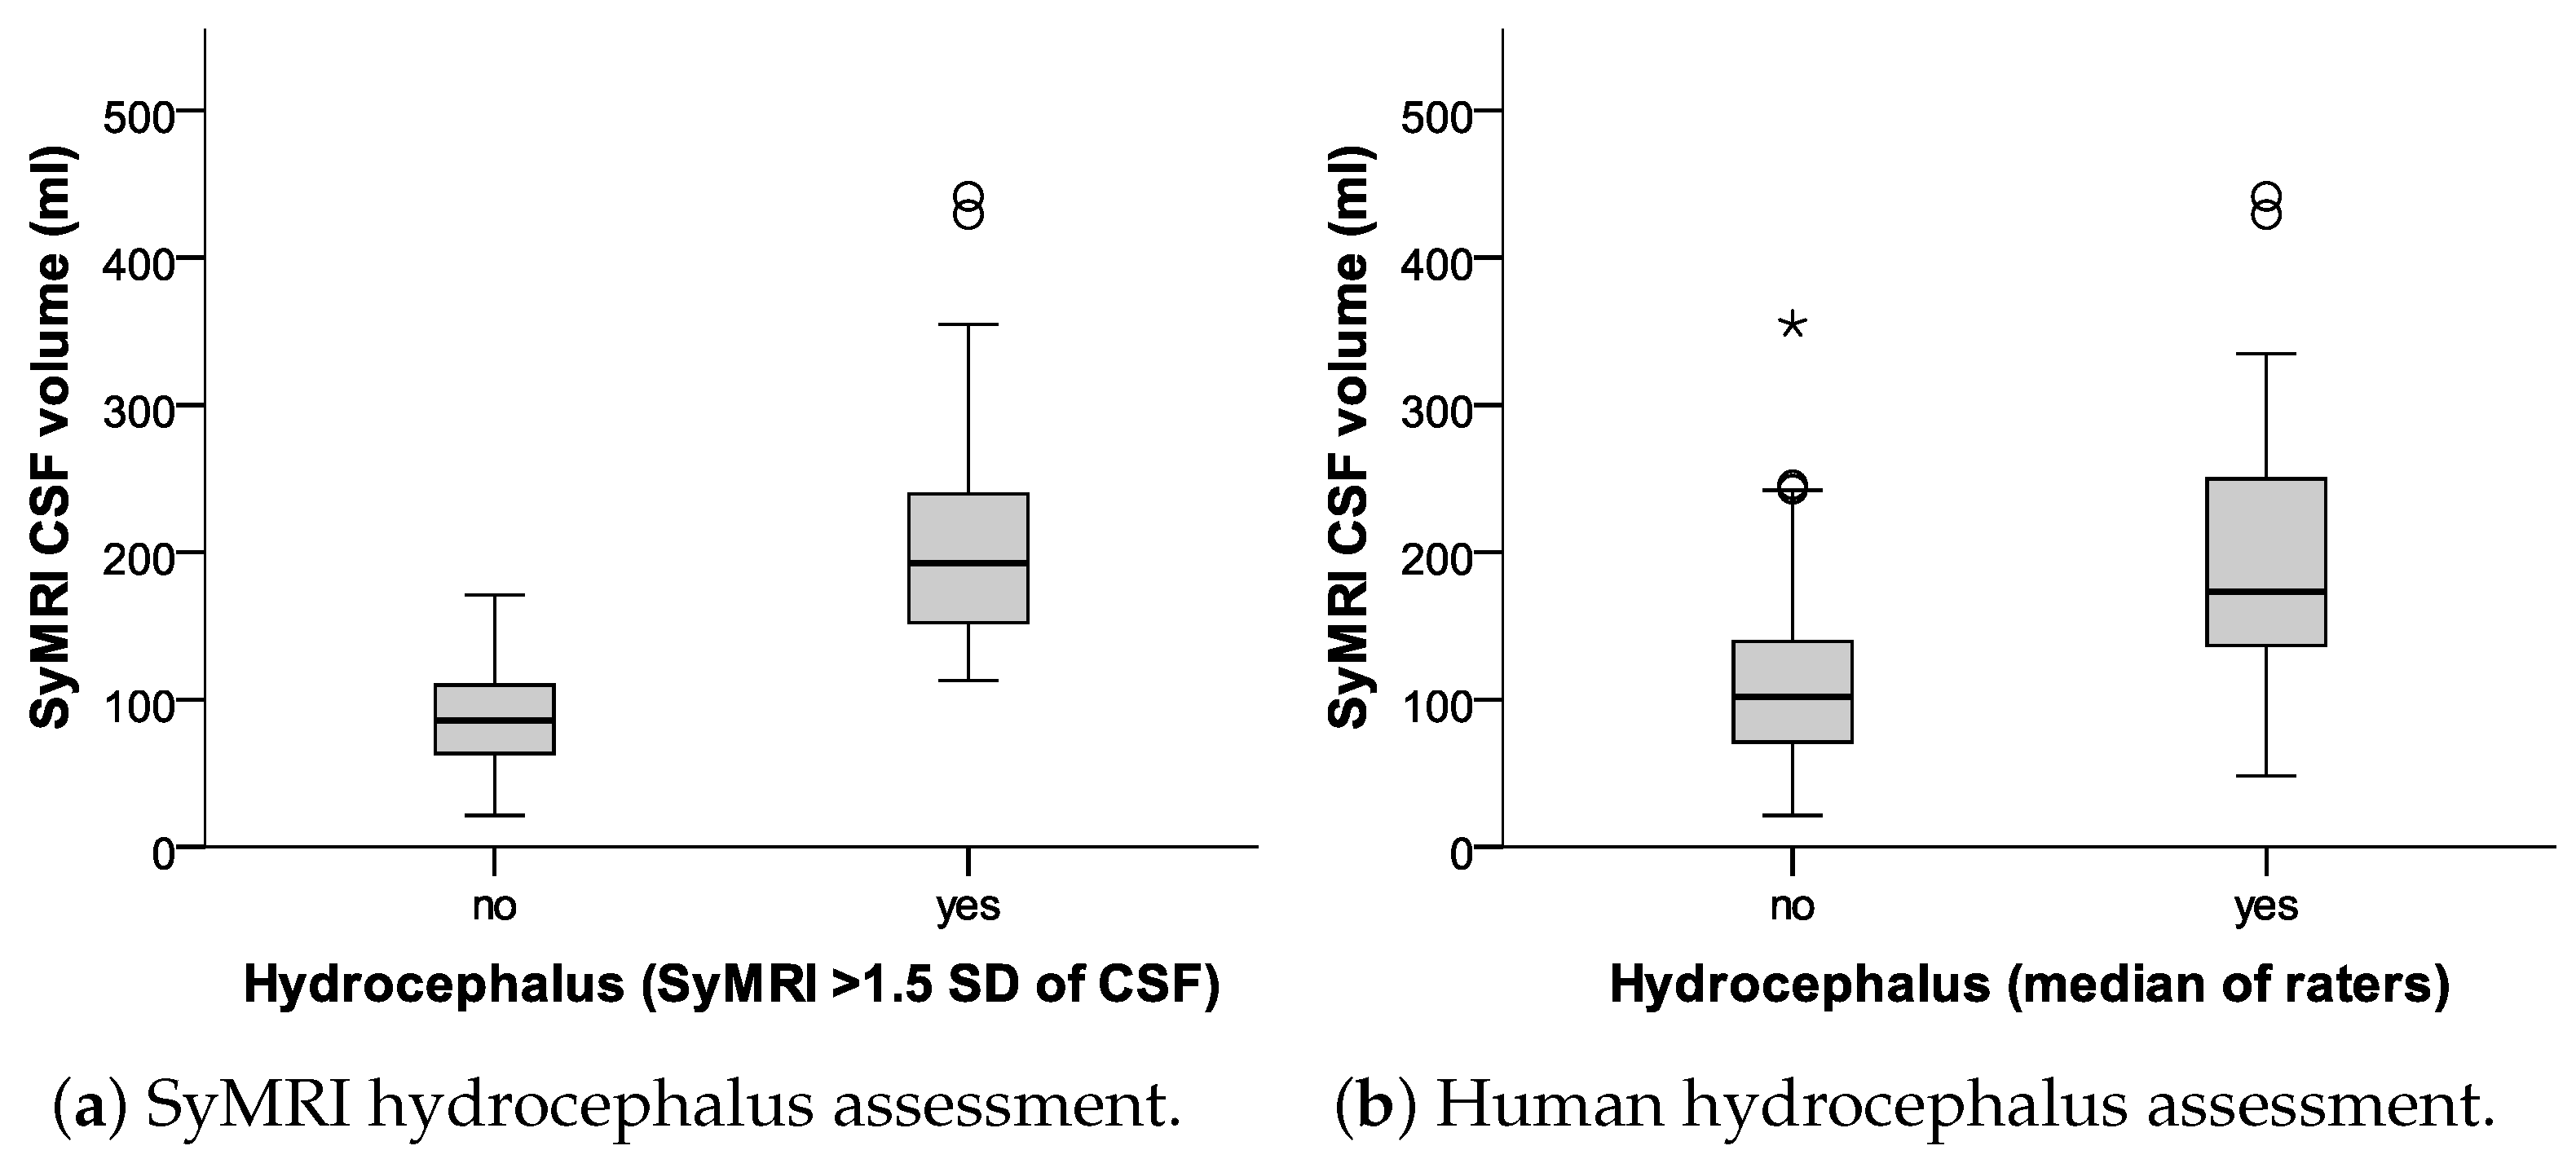
2.4. Subjective Hydrocephalus Rating

A total of 5 radiologists with 11 (S.T.), 7 (A.D.), 6 (V.W.), 4 (A.C.), and 2 (N.S.) years of experience in neuroradiology evaluated the examinations subjectively with regard to the presence or absence of hydrocephalus in a binary manner, indicating yes or no. For this purpose, the axial T2-weighted slices of the respective examinations were called up and evaluated in the local PACS environment. The evaluators were blinded to the SyMRI results and the results of the other participants. All MR images were rated in darkened reading rooms on radiology workstations running syngo.plaza (Siemens Healthineers, Erlangen, Germany) with color-calibrated RX440 or RX650 radiology monitors (Eizo, Ishikawa, Japan). The data were transferred to a table and transferred to the statistical software for further analysis. To enable a comparison of the hydrocephalus ratings with the SyMRI results, an increase in the standard deviation of the SyMRI CSF volume value of more than 1.5 times was considered definite hydrocephalus. Borderline hydrocephalus patients with SDs between 1 and 1.5 times were defined as normal, given the potential measurement inaccuracies of the volumetric methods. Cases with parenchymal defects (n = 2) or arachnoid cysts (n = 3) were not considered in this specific analysis (total = 119), because they do demonstrate increased CSF values that are not caused by hydrocephalus.
The slice positions of all examinations were subjectively evaluated in a binary manner (0 = no error; 1 = error) regarding the presence of segmentation errors in the SyMRI software. The extent of the error was not taken into account. The values obtained were normalised between 0 and 1 as the examinations could have different total numbers of slices. A lower slice position represented a more caudal slice. The 4 quartiles represented the posterior fossa from 0 to 0.25, the base of the skull from 0.25 to 0.5, the cerebrum from 0.5 to 0.75, and the cranial vault from 0.75 to 1. The 4 quartiles were statistically compared with each other.

2.5. Ethical Approval

This retrospective study was conducted following on a positive ethics committee vote. The reference number assigned by the responsible Ethics Committee of the Medical University of Graz (IRB00002556) was “35-147 ex 22/23”.

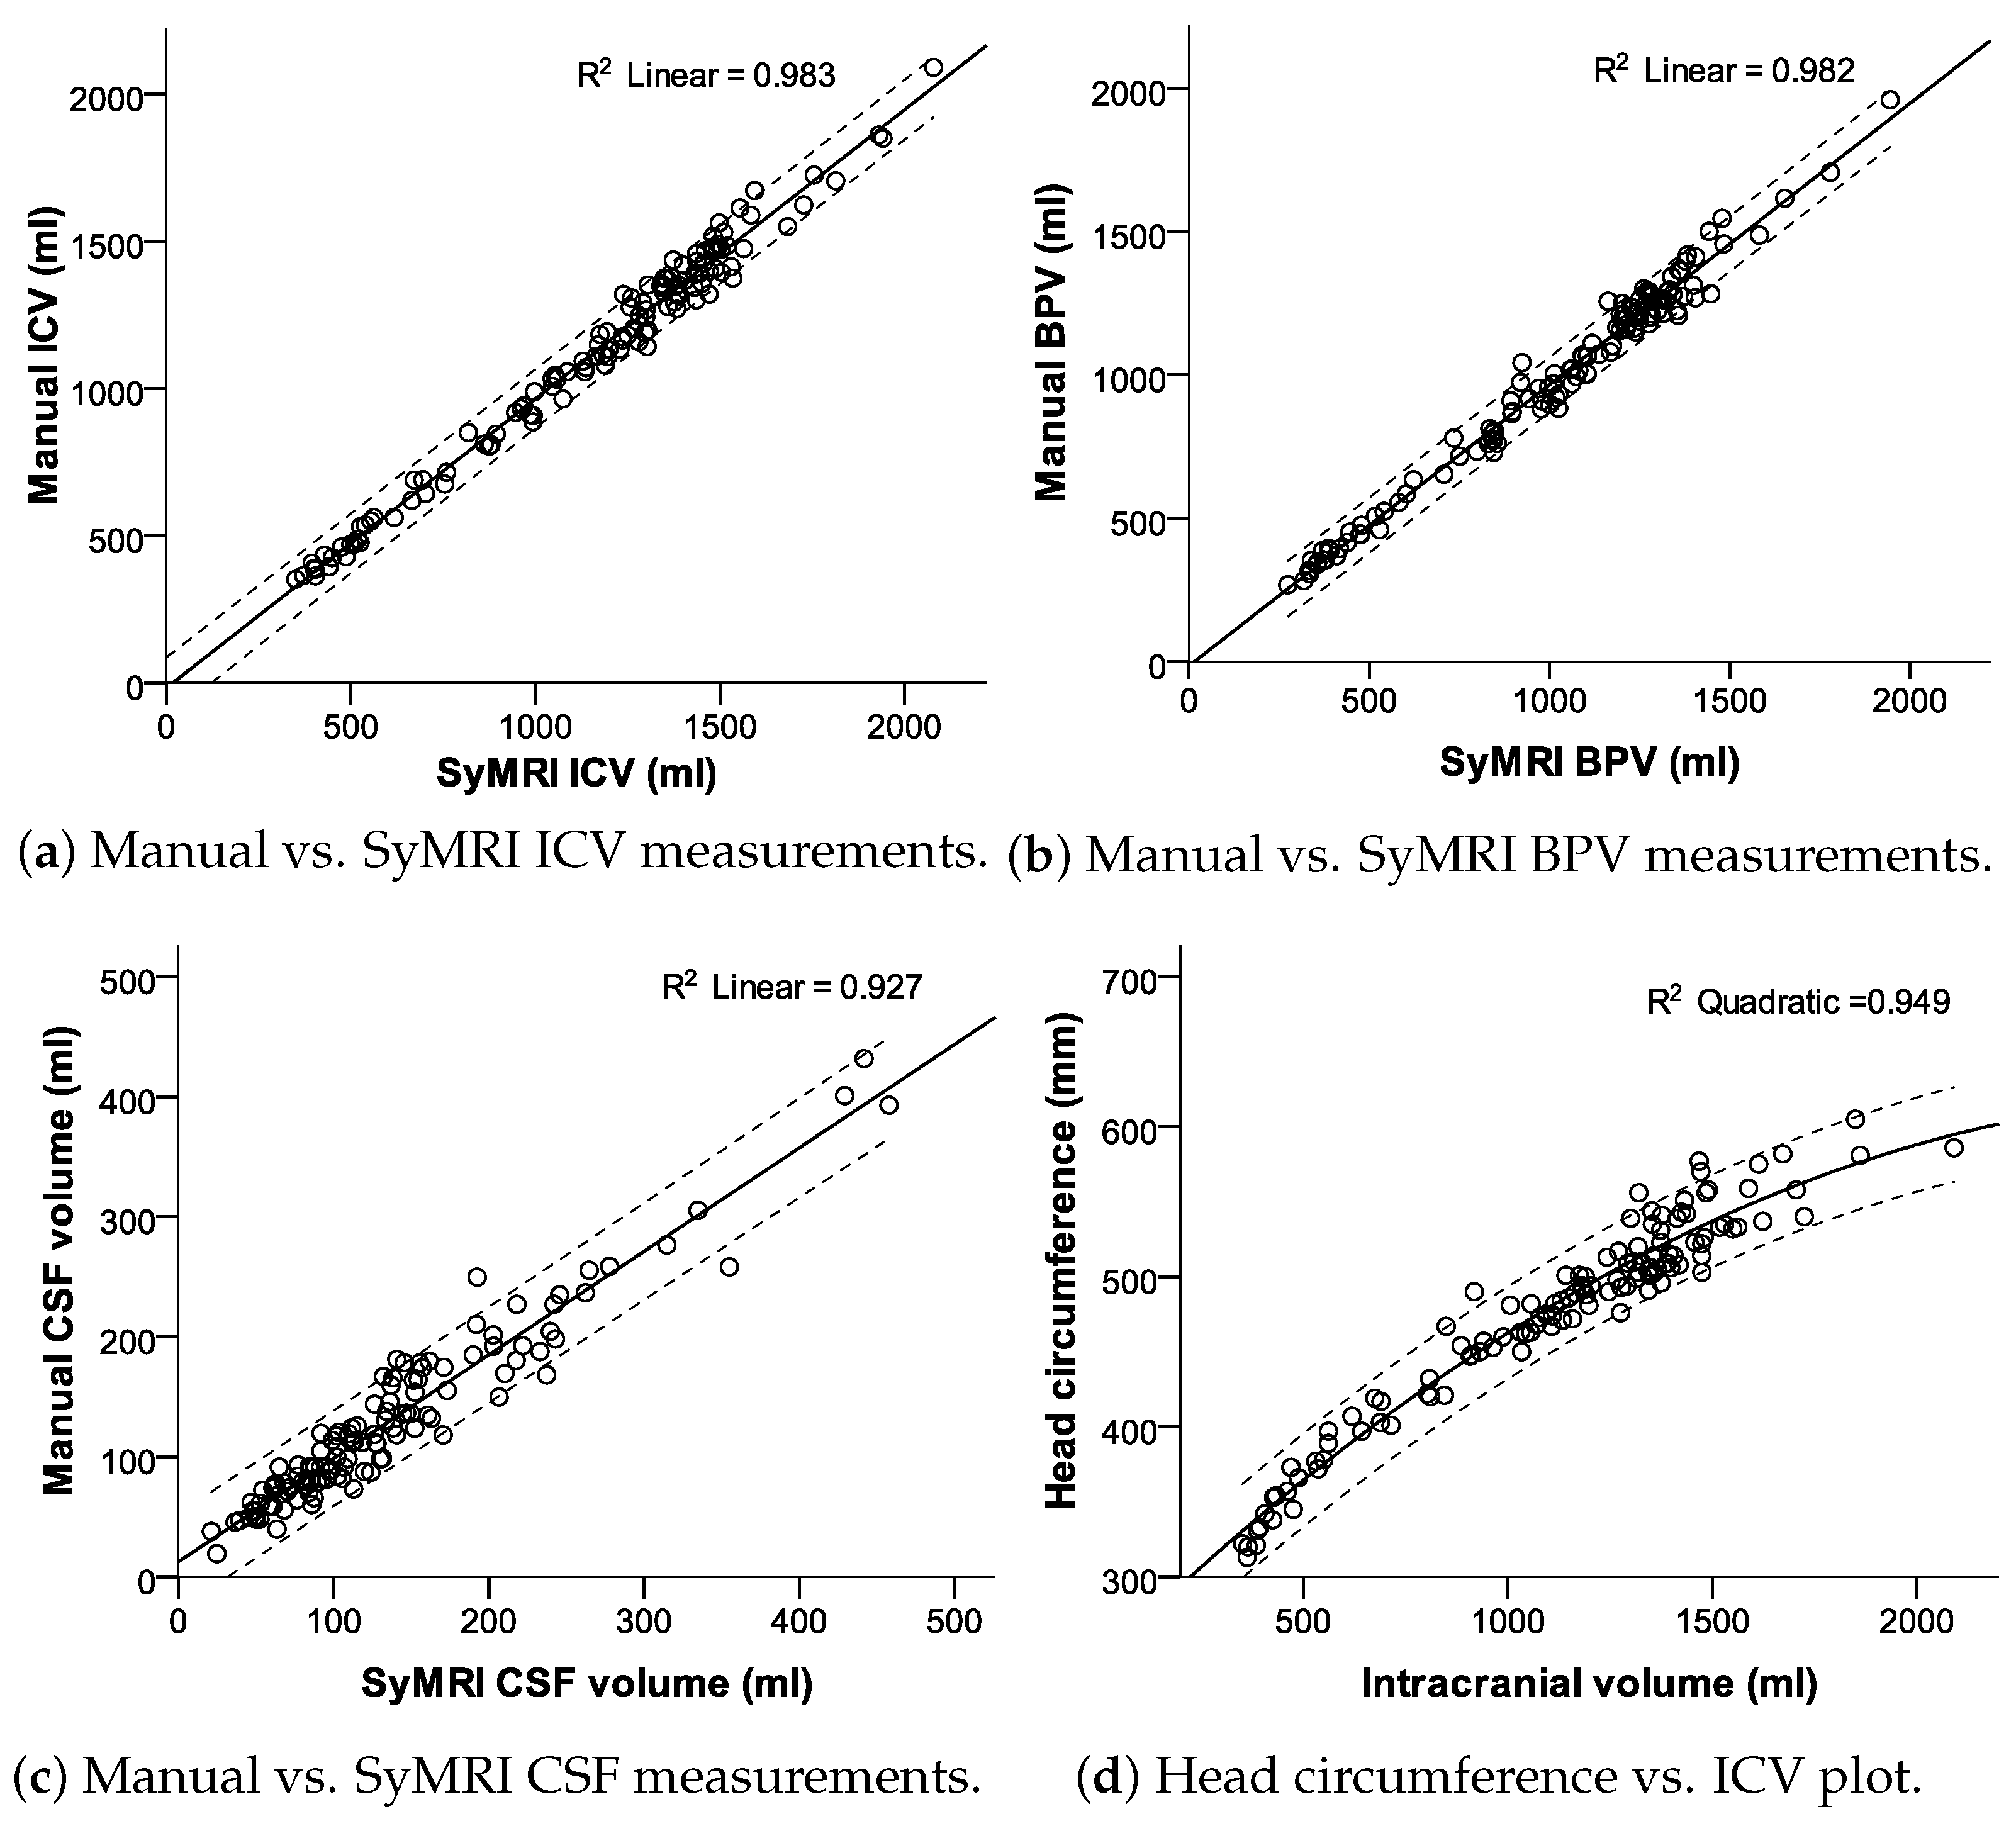
2.6. Statistical Analysis
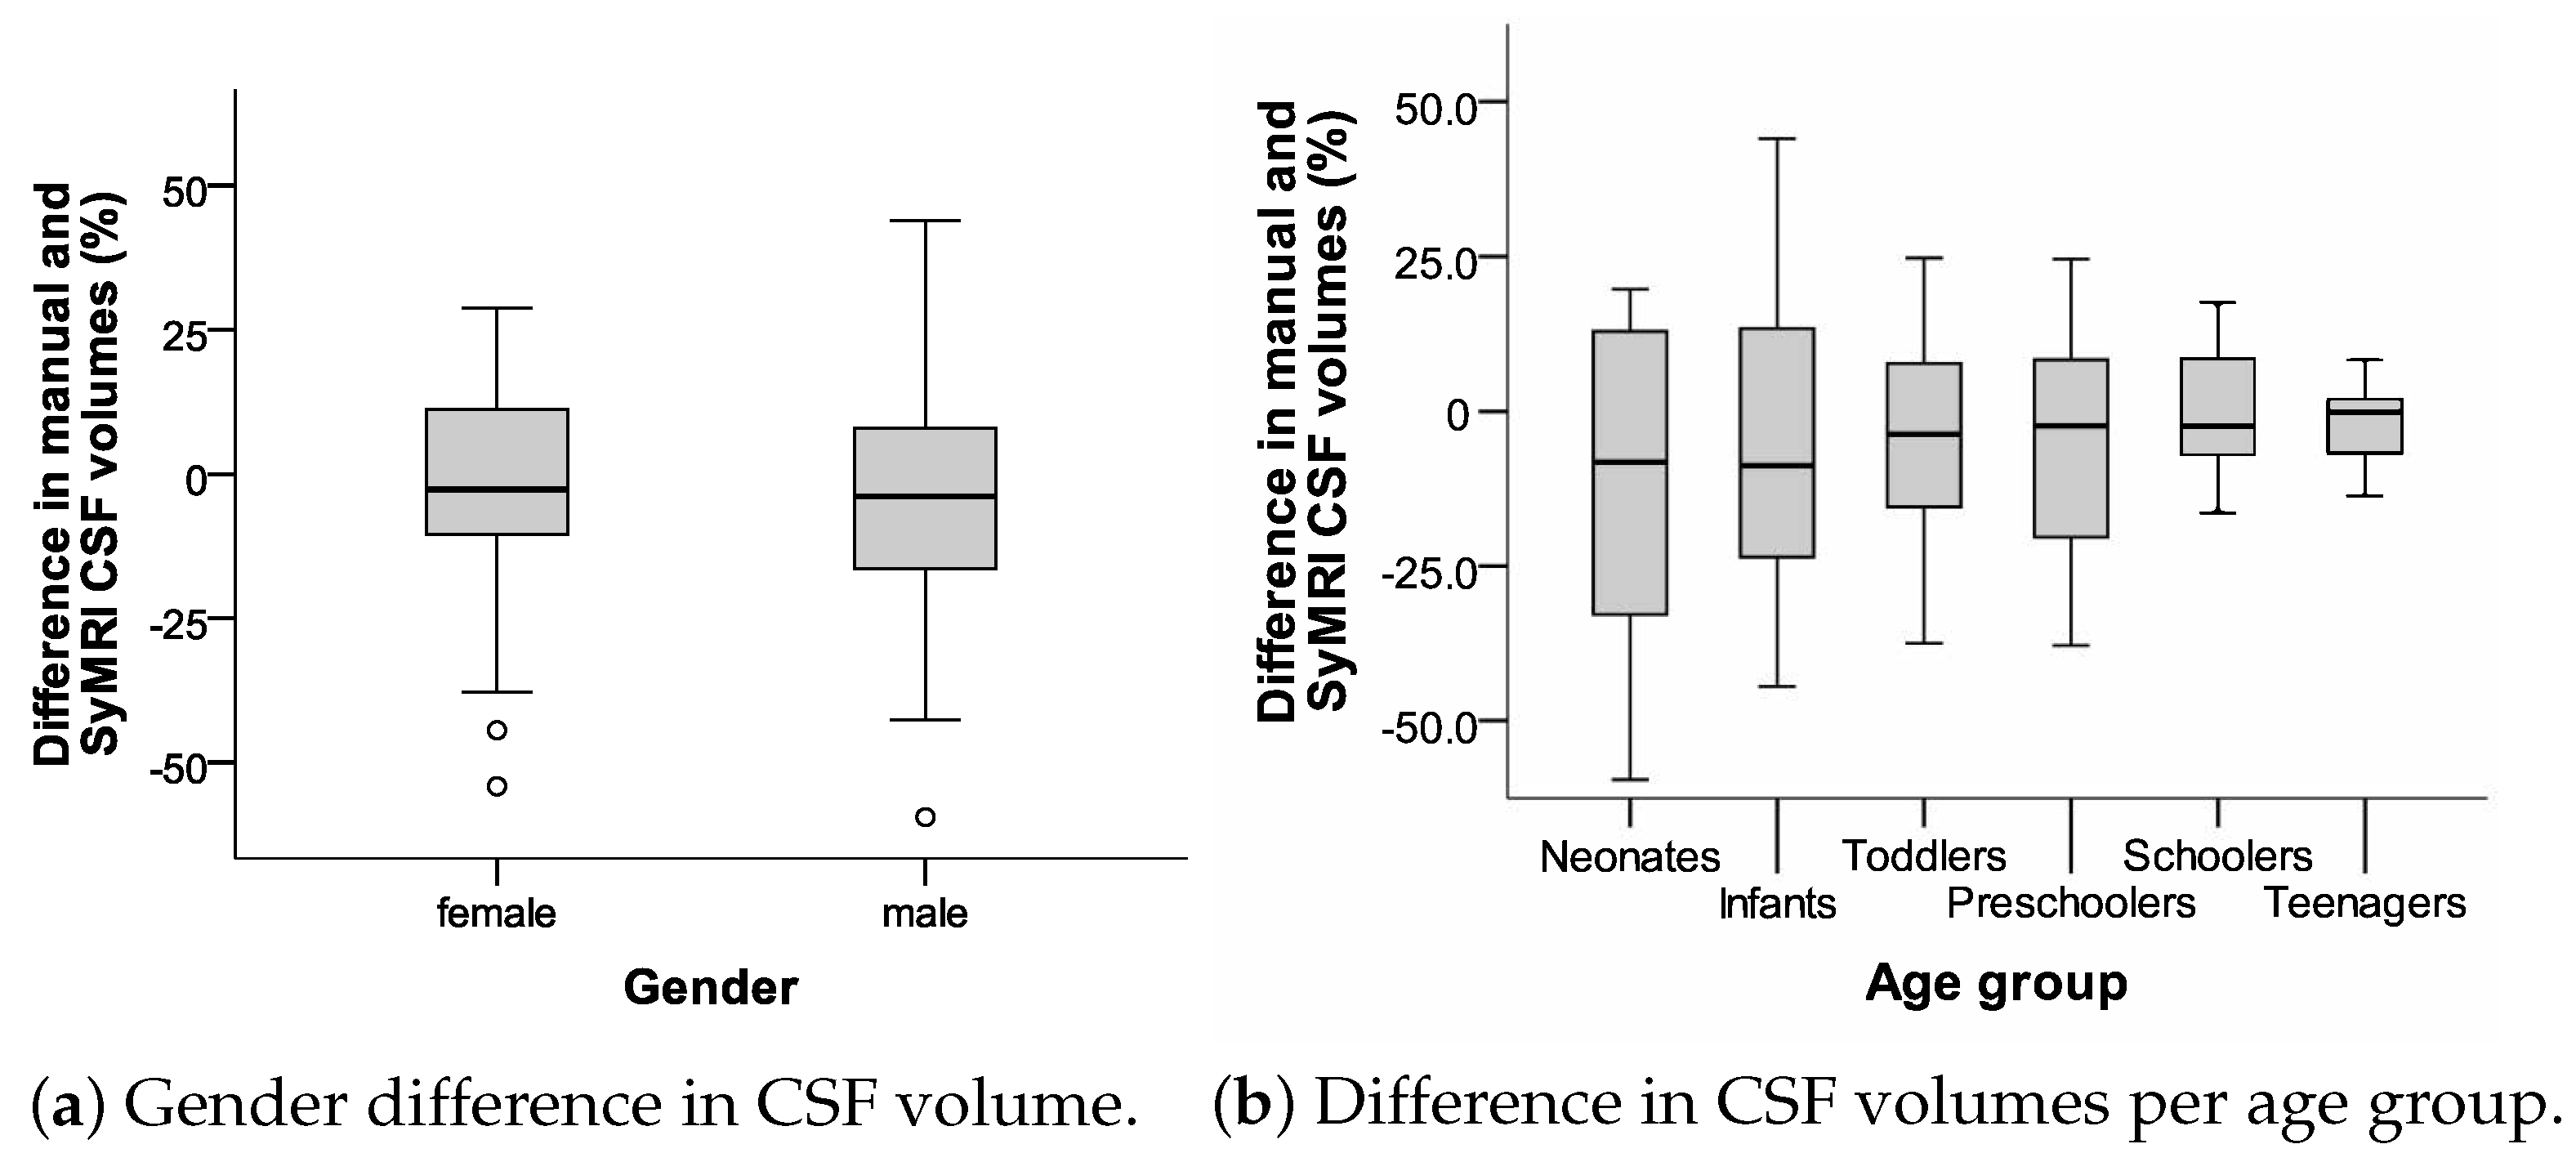
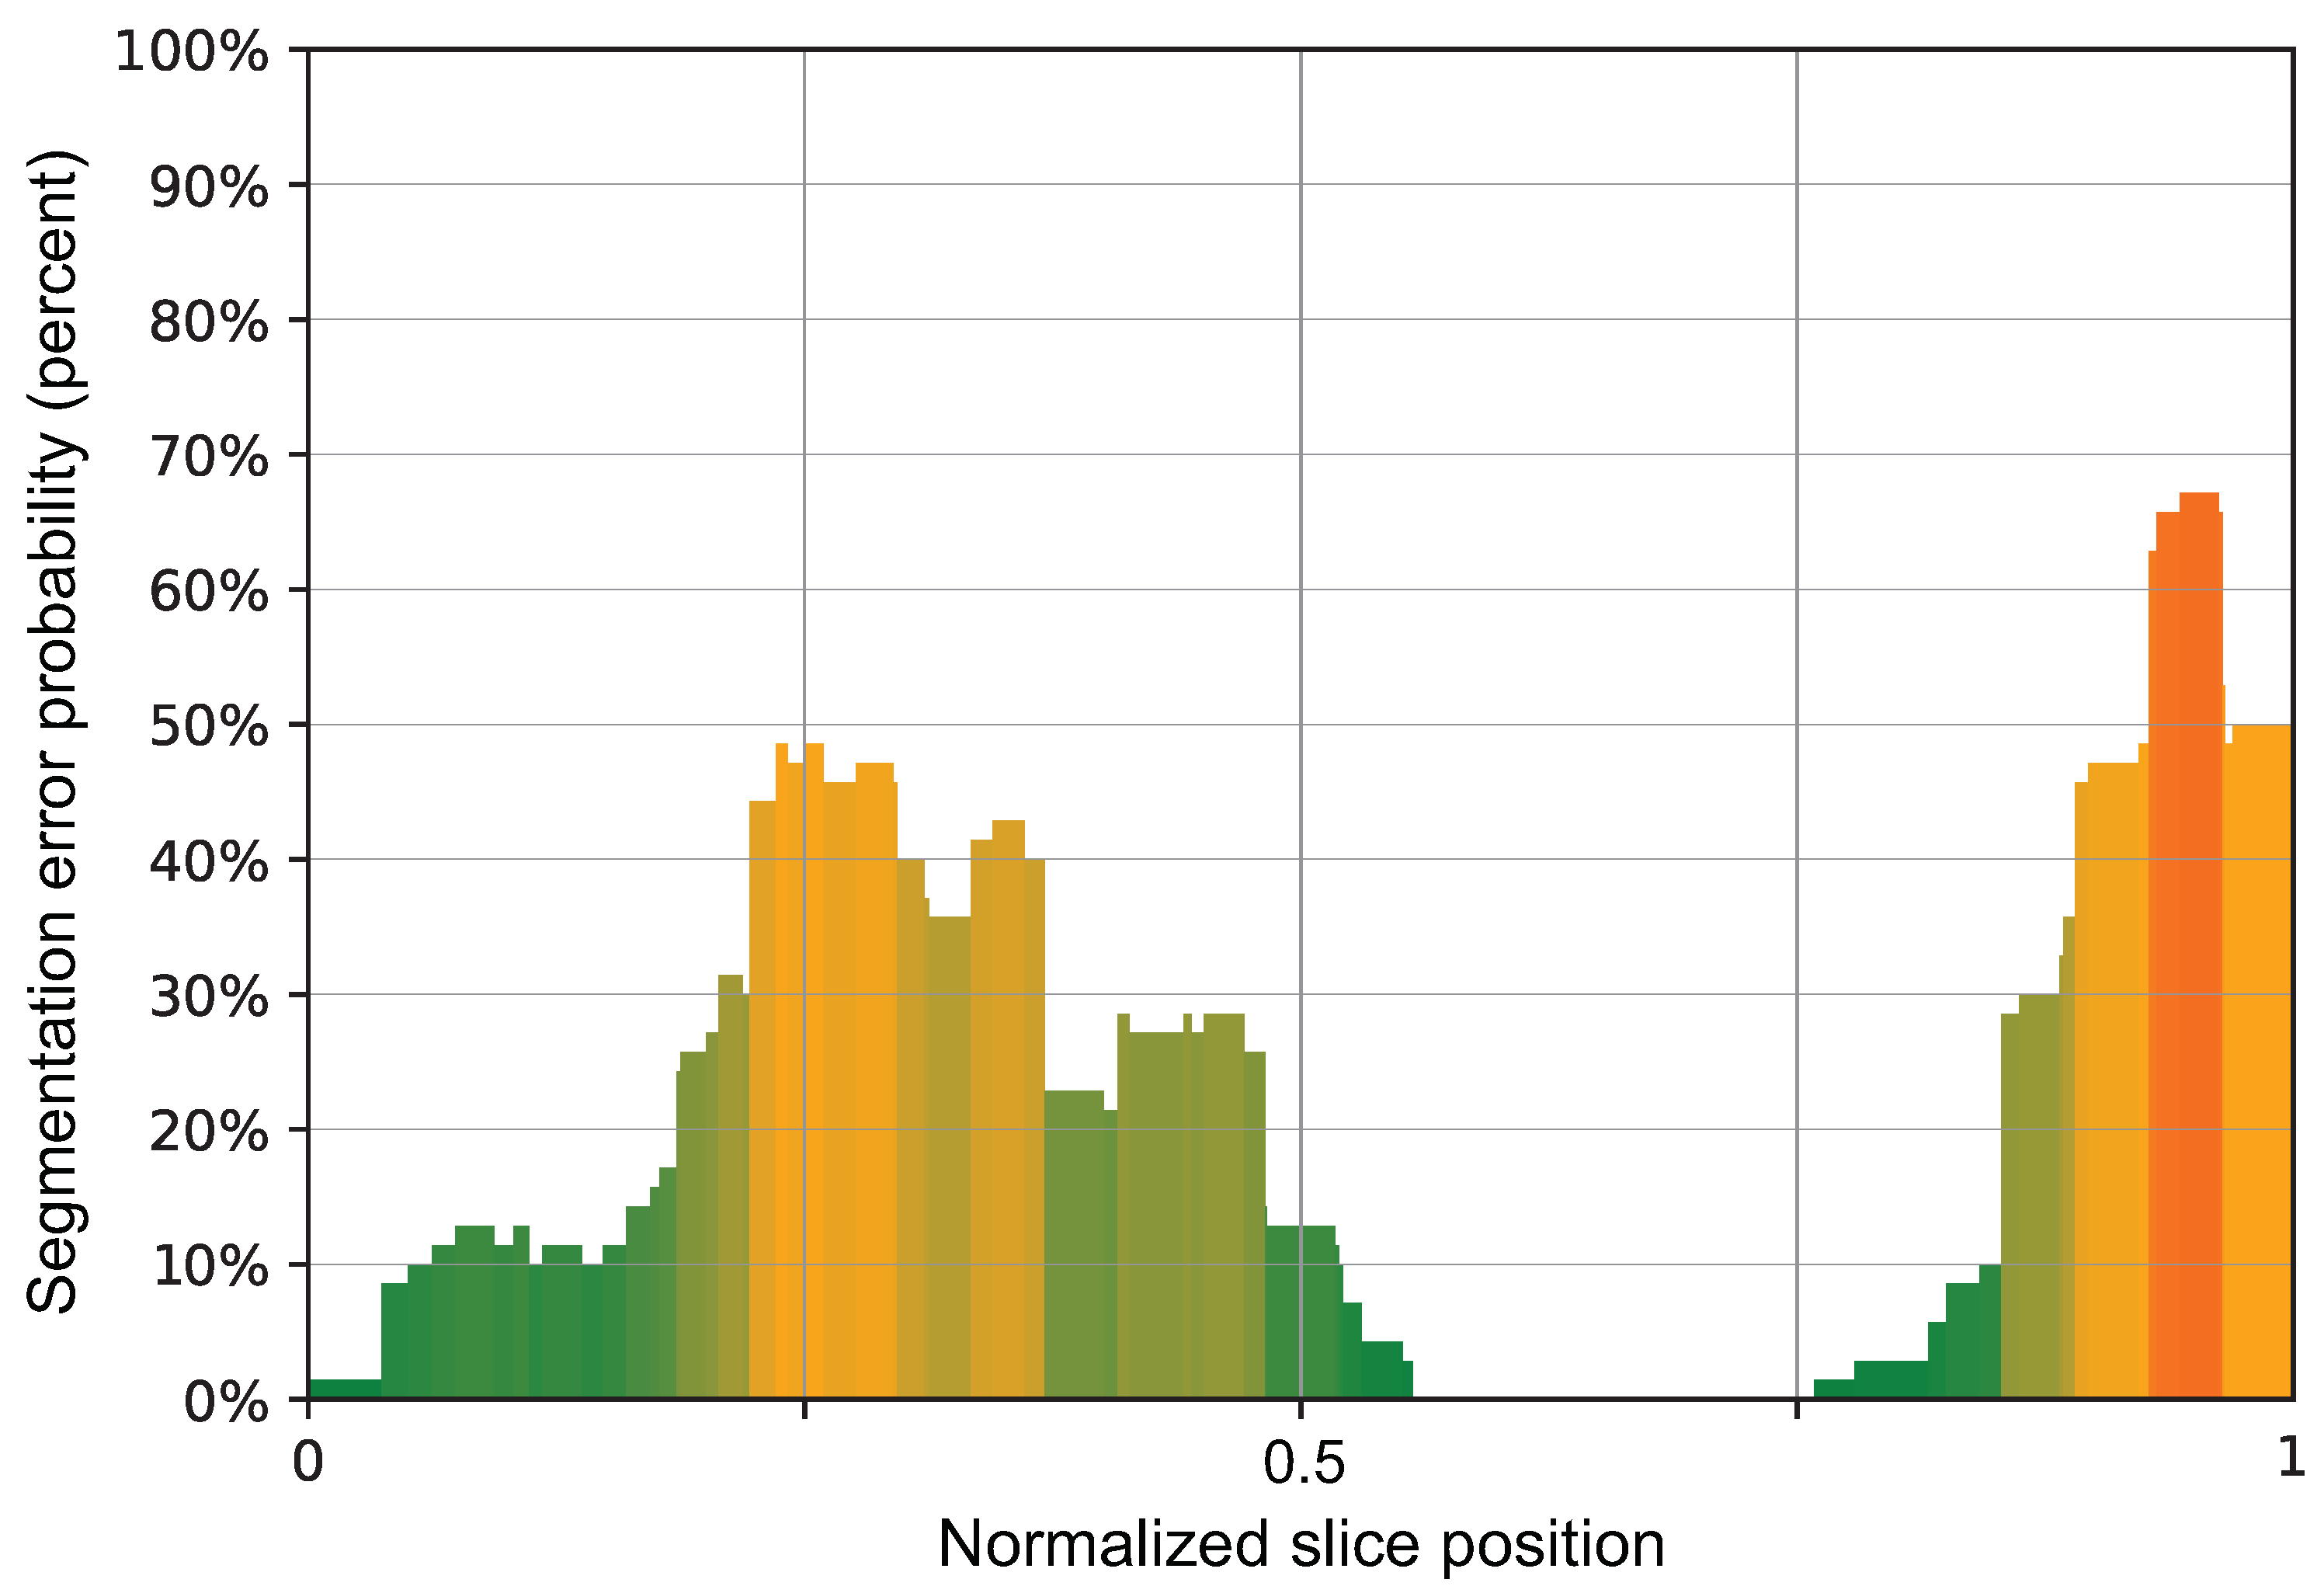
Statistical tests were performed using SPSS v21 (SPSS Inc., Chicago, IL, USA) [23]. We calculated descriptive statistics and, in the case of confirmed normal distributions, conducted t-tests. McNemar tests were used for non-parametric data in the case of two related cases, and Cochran’s Q test was used for more than two related cases. The DATAtab online platform was used to calculate Cohen’s and Fleiss’s Kappa values [24]. p-values of less 0.05 were considered statistically significant.

3. Results

We included 124 cranial MRI examinations of 124 unique pediatric patients aged 0 to 18 years (median—2.75 years, 25th quartile—0.89 years, and 75th quartile—5.36 years). In total, 59 (47.6%) patients were female, and 65 (52.4%) were male. The inclusion criteria are given in Figure 4. Basic patient characteristics are listed in Table 1.
The majority of the patients studied were scanned under anesthesia (n = 87, 70.2%; mean age: 2.98 +/− 2.29 years). Fourteen (11.3%) studies were performed using the “feed and wrap” technique (mean age: 0.12 +/− 0.09 years). Twenty-three (18.5%) studies were performed in cooperative patients (mean age: 11.80 +/− 4.71 years).
Overall, statistically significant differences were calculated for the CSF, BPV, and ICV between manual and SyMRI measurements. The CSF volume was 127.89 +/− 73.52 mL in the manual assessment and 133.84 +/− 82.11 mL for the SyMRI analysis, p = 0.005 (t-test). The BPV was also lower on average, showing 990.77 +/− 359.07 mL in the manual measurements vs. 1024.90 +/− 362.74 mL in the SyMRI measurements; p < 0.001 (t-test). The ICV was 1120.43 +/− 389.58 mL in the manual measurements vs. 1158.74 +/− 393.42 mL in the SyMRI measurements (p < 0.001, t-test).
There were significant linear correlations between both measurement methods for the CSF (R = 0.963; p < 0.001), BPV (R = 0.991; p < 0.001), and ICV (R = 0.992; p < 0.001). t-test comparisons exhibited statistically significant differences for manual CSF vs. SyMRI CSF measurements with a p-value of 0.005 and for BPV and ICV measurements with p-values lower than 0.001 (compare Figure 5 and Figure 6).
Fleiss’s kappa was 0.66 among all human raters (95% CI of 0.6 to 0.71; p < 0.001), representing good agreement [25]. The median human rating compared to the SyMRI rating was lower with only moderate agreement, as represented by a Cohen’s kappa of 0.45 (95% CI of 0.29 to 0.61; p < 0.001). Cohen’s kappa values for the human raters compared to the SyMRI rating ranged from 0.33 to 0.47. SyMRI CSF volumes in presence and absence of hydrocephalus are given in Figure 7.
We did not see significant differences in CSF volumes (p = 0.968, t-test), the BPV (p = 0.702, t-test), or the ICV (p = 0.730, t-test) between the manual and SyMRI assessments. Visually, there was a decrease in variability between the manual and SyMRI volume measurements of the CSF with increasing age, as shown in Figure 8b.
There were statistically significant differences in the ANOVA test between the four normalized slice position quartiles (p < 0.001), with the lowest count of segmentation errors in the third quartile (cerebrum) compared to the skull vault (fourth quartile, with up to 67% erroneous segmentations, p < 0.001 in a Bonferroni post-hoc test), the skull base (second quartile, p = 0.008 in a Bonferroni post-hoc test), and the posterior fossa (first quartile, p = 0.016 in a Bonferroni post-hoc test). The findings are depicted graphically in Figure 9.

4. Discussion

The assessment of the presence or absence of hydrocephalus in cerebral MRIs is a difficult and highly subjective endeavour for radiologists. SyMRI provides experts with an interesting tool to reliably and quickly assess the presence of hydrocephalus or other intracranial volume disorders [3,16]. Our retrospective data analysis focused on the reliability of SyMRI in the clinical–radiological routine of a tertiary center and demonstrated its suitability for its application in children.
In the literature, the image quality of SyMRI is repeatedly described as equivalent or at least not inferior to that of conventional MRI. While this may well be the case for some image parameters such as contrast, in our opinion the subjective image quality is generally inferior to correspondingly weighted turbo spin echo sequences. A SyMRI is therefore never performed as the only sequence in our center, but the method is primarily used as an add-on in cases in which parameters such as cerebrospinal fluid volume, intracranial volume, and brain parenchyma volume are important. This is where SyMRI demonstrates its strengths, which are also reflected in the results presented. For example, it was difficult for human experts to distinguish incipient cases of hydrocephalus from normal cases (see the Cohen’s Kappa of human ratings vs. SyMRI, k = 0.47).
Our data demonstrated a small systematic error between manual and SyMRI volume measurements which has been described in accordance with previous studies [15,17]. In our case, the SyMRI method produced higher values compared to the alternative method [18]. Our assumption is based on the marginally lower volumes in the manual volume assessments, which had been meticulously corrected for masking errors. Overall, the extent of these masking issues in the SyMRI was limited. Severe masking errors were isolated cases. Minor masking errors were more common and repeatedly observed in the boundary layers (the cranial sections and skull base, see Figure 10), while the middle layers rarely showed problems. Masking problems in the central parts of the slice were primarily due to areas of clearly pathologically altered signaling or image distortions due to metal artifacts (Figure 11).
The results of our work indicate that the SyMRI measurements show imperfections in younger children (compare Figure 8b). These are probably methodological in nature and apply in part in the same way to alternative measurement variants. For example, we observed a decrease in the fluctuation range of the measurements with increasing patient age. In particular, in the group of newborns and infants, i.e., children up to the age of one, considerable ranges of manual and SyMRI measurements were recognisable. It should also be noted that measurement inaccuracies also affected the reference measurements.
In our patient cohort, we observed a failure rate of approximately 5% (7 out of 131 studies, Figure 4) in the automated SyMRI analysis of the MDME sequence. This was attributed to inaccurately or incompletely archived MDME data (n = 4) and motion artifacts (n = 3). Due to the acquisition time of about 6 min, the MDME sequence may have been impaired by motion artefacts (Figure 12). This hardly applies to patients under anesthesia, but is regularly observed during “feed and wrap” examinations. Older children of school age and above may also be affected depending on their daily condition or compliance capability. In cases involving older children or adolescents, it might be an option to repeat the MDME sequence in cases of motion artifacts.
It should not go unmentioned that there are also freely available alternatives for the technically experienced radiological technologist or radiologist [4,15,20,22]. Some of these tools were also used as reference measurement methods in this work. A decisive disadvantage in clinical routine is the increased effort involved in such manual or semi-automated evaluations. Integration into existing PACS environments, ease of use, and the automated generation of volumetric data on the respective examined neurocranium are assumed advantages of the analysed commercial software solution [3].
A synthetic MRI is based on data acquisition relying on absolute measurements of T1, T2, PD, or their respective inverse relaxation rates (R1 and R2), while also taking into account magnetic field inhomogeneity, thus making it a robust input for tissue segmentation overall [26,27]. Initially, the lengthy duration of the data acquisition period made its implementation into the clinical workflow impractical. However, this issue was resolved with the introduction of a QRAPMASTER pulse sequence capable of simultaneously measuring the R1, R2, and PD with an exam duration under 6 min for full head coverage [3,28].
One of the significant advantages of SyMRI over conventional MRI is its wide applicability and adjustability. Quantification maps can be tailored to additionally measure tissue properties specific to particular types of lesions. Such highly specific synthetic sequences can even outperform conventional MRI in lesion detection sensitivity in some diseases [3]. A promising example is its use case of detecting plaque lesions in multiple sclerosis. Studies have shown that SyMRI performs better than conventional MRI in lesion detection, with comparable or shorter acquisition times. The time required for segmentation was also considerably lower than when using segmentation algorithms such as FSL on conventional MRI images [26,27]. Another promising example was demonstrated by Hagiwara et al., who showed better lesion detection in brain tumors using synthetic T1 inversion recovery (T1IR), surpassing conventional T1IR-weighted images and providing superior lesion-to-white matter contrast and a contrast-to-noise ratio [29].
The synthetic T1- and T2-weighted images proved to have comparable or higher contrast than conventional images but also tended to suffer from higher levels of noise. Synthetic sequences are generally believed to offer comparable to inferior quality at times, even though some authors suggest that this fact does not directly translate to being inferior in clinical practice and even suggest that the agreement with clinical presentation is higher in synthetic MRI. The quality, however, is not the same for all synthetic sequences across the board; for instance, synthetic T2-weighted FLAIR images have shown to have both lower contrast and higher signal noise, resulting in a generally inferior contrast-to-noise ratio against conventional FLAIR images [30]. Our study, however, did not directly focus on a qualitative comparison of synthetic sequences against conventional ones; therefore, we are unable to provide more detailed assessment of the usefulness of SyMRI in this regard as it was used as a supplement alongside a routine workflow to deliver volumetric assessments exclusively.
Neonatal MR imaging volumetry has demonstrated its prognostic value in different studies [31,32,33]. This highlights the substantial clinical importance of the early detection of hydrocephalus or decreased brain volume in terms of beginning brain atrophy [34,35]. Even in cases that are currently not amenable to treatment, reliable radiological methods are urgently required for initial diagnostic confirmation and possibly necessary follow-up examinations.
The strengths of our study rely on its comparison of meticulously generated manual segmentations of the intracranial compartments, CSF, and BPV, serving as a reference method described in the literature [18], and their comparison with automated SyMRI measurements. Additionally, the presence of hydrocephalus was assessed by multiple pediatric radiologists to enable the reliability of a subjective evaluation compared to the quantitative method.
The limitations of our study include the retrospective study design, which resulted in an inability to retrospectively analyze certain examinations accurately. However, the overall impact of this difference compared to a prospectively conducted study should be negligible. Another constraint is the relatively modest number of examinations, with 124 included specimens. This limitation is particularly relevant in assessing different pediatric age groups. A larger sample size would enhance the comparability of age groups. Nevertheless, the authors contend that the study’s general findings remain unaffected by these points. Lastly, general measurement inaccuracies, which are inherent to volume measurements, should be considered. These inaccuracies affect not only automated measurements but also manual reference measurements. The manual reference segmentations were all performed following the steps described above. To account for edematous brain lesions that might be included in thresholding, all segmentations were manually corrected as described. Deviations of several percentage points are not uncommon, especially with small absolute volumes. This may partially account for the increased measurement variability observed in young children. Generally, there seems to be a lot of room for further studies on this important matter.

5. Conclusions

Automated SyMRI hydrocephalus analyses could be a helpful supplement to conventional MRI of the brain in children. The SyMRI evaluations presented demonstrated sufficient accuracy and reliability, but the automated measurements should still undergo validation from human experts as artifacts could impair the results.

Author Contributions

Conceptualization, S.T. and V.W.; methodology, N.V., S.T. and V.W.; software, N.V. and S.T.; validation, A.D., N.S., E.N. and S.T.; formal analysis, A.C.-H. and E.N.; investigation, A.C.-H., M.S., N.S., N.V. and V.W.; resources, S.T.; data curation, A.C.-H., N.S., N.V., V.W. and A.D.; writing—original draft preparation, N.V.; writing—review and editing, A.C.-H. and V.W.; visualization, M.S. and S.T.; supervision, S.T.; project administration, S.T.; funding acquisition, S.T. All authors have read and agreed to the published version of the manuscript.

Funding

This research received no external funding.

Institutional Review Board Statement

The study was conducted in accordance with the Declaration of Helsinki and approved by the Institutional Review Board of the Medical University of Graz (IRB00002556) (protocol code 35-147 ex 22/23).

Informed Consent Statement

Patient consent was waived due to the retrospective study design.

Data Availability Statement

The raw data supporting the conclusions of this article will be made available by the corresponding author on reasonable request.

Conflicts of Interest

The authors declare no conflict of interest.

Abbreviations

The following abbreviations are used in this manuscript:
BPVBrain parenchyma volume
CIConfidence interval
CSFCerebrospinal fluid
DICOMDigital Imaging and Communications in Medicine
ICVIntracranial volume
MDMEMulti-Dynamic Multi-Echo
MRIMagentic Resonance Imaging
NIFTINeuroimaging Informatics Technology Initiative
PACSPicture Archiving and Communications System

References

  1. Wright, Z.; Larrew, T.W.; Eskandari, R. Pediatric Hydrocephalus: Current State of Diagnosis and Treatment. Pediatr. Rev. 2016, 37, 478–490. [Google Scholar] [CrossRef] [PubMed]
  2. Krishnan, P.; Raybaud, C.; Palasamudram, S.; Shroff, M. Neuroimaging in pediatric hydrocephalus. Indian J. Pediatr. 2019, 86, 952–960. [Google Scholar] [CrossRef]
  3. Hagiwara, A.; Warntjes, M.; Hori, M.; Andica, C.; Nakazawa, M.; Kumamaru, K.K.; Abe, O.; Aoki, S. SyMRI of the Brain: Rapid Quantification of Relaxation Rates and Proton Density, with Synthetic MRI, Automatic Brain Segmentation, and Myelin Measurement. Investig. Radiol. 2017, 52, 647–657. [Google Scholar] [CrossRef]
  4. Serai, S.D.; Dudley, J.; Leach, J.L. Comparison of whole brain segmentation and volume estimation in children and young adults using SPM and SyMRI. Clin. Imaging 2019, 57, 77–82. [Google Scholar] [CrossRef]
  5. Vanderhasselt, T.; Zolfaghari, R.; Naeyaert, M.; Dudink, J.; Buls, N.; Allemeersch, G.J.; Raeymaekers, H.; Cools, F.; de Mey, J. Synthetic MRI demonstrates prolonged regional relaxation times in the brain of preterm born neonates with severe postnatal morbidity. Neuroimage Clin. 2021, 29, 102544. [Google Scholar] [CrossRef]
  6. Ryu, K.H.; Baek, H.J.; Moon, J.I.; Choi, B.H.; Park, S.E.; Ha, J.Y.; Jeon, K.N.; Bae, K.; Choi, D.S.; Cho, S.B.; et al. Initial clinical experience of synthetic MRI as a routine neuroimaging protocol in daily practice: A single-center study. J. Neuroradiol. 2020, 47, 151–160. [Google Scholar] [CrossRef] [PubMed]
  7. Ryu, K.H.; Choi, D.S.; Baek, H.J.; Cho, S.B.; Ha, J.Y.; Kim, T.B.; Hwang, M.J. Clinical feasibility of 1-min ultrafast brain MRI compared with routine brain MRI using synthetic MRI: A single center pilot study. J. Neurol. 2019, 266, 431–439. [Google Scholar] [CrossRef]
  8. Coban, G.; Gumeler, E.; Parlak, S.; Konuskan, B.; Karakaya, J.; Yalnizoglu, D.; Anlar, B.; Oguz, K.K. Synthetic MRI in children with tuberous sclerosis complex. Insights Imaging 2022, 13, 115. [Google Scholar] [CrossRef] [PubMed]
  9. Hagiwara, A.; Andica, C.; Hori, M.; Aoki, S. Synthetic MRI showed increased myelin partial volume in the white matter of a patient with Sturge-Weber syndrome. Neuroradiology 2017, 59, 1065–1066. [Google Scholar] [CrossRef]
  10. Betts, A.M.; Leach, J.L.; Jones, B.V.; Zhang, B.; Serai, S. Brain imaging with synthetic MR in children: Clinical quality assessment. Neuroradiology 2016, 58, 1017–1026. [Google Scholar] [CrossRef]
  11. West, H.; Leach, J.L.; Jones, B.V.; Care, M.; Radhakrishnan, R.; Merrow, A.C.; Alvarado, E.; Serai, S.D. Clinical validation of synthetic brain MRI in children: Initial experience. Neuroradiology 2017, 59, 43–50. [Google Scholar] [CrossRef] [PubMed]
  12. Lee, S.M.; Choi, Y.H.; Cheon, J.E.; Kim, I.O.; Cho, S.H.; Kim, W.H.; Kim, H.J.; Cho, H.H.; You, S.K.; Park, S.H.; et al. Image quality at synthetic brain magnetic resonance imaging in children. Pediatr. Radiol. 2017, 47, 1638–1647. [Google Scholar] [CrossRef] [PubMed]
  13. Schmidbauer, V.; Geisl, G.; Cardoso Diogo, M.; Jengojan, S.; Perepelov, V.; Weber, M.; Goeral, K.; Lindenlaub, F.; Klebermass-Schrehof, K.; Berger, A.; et al. Validity of SyMRI for Assessment of the Neonatal Brain. Clin. Neuroradiol. 2020, 31, 315–323. [Google Scholar] [CrossRef] [PubMed]
  14. Kim, E.; Cho, H.H.; Cho, S.H.; Park, B.; Hong, J.; Shin, K.M.; Hwang, M.J.; You, S.K.; Lee, S.M. Accelerated Synthetic MRI with Deep Learning-Based Reconstruction for Pediatric Neuroimaging. Am. J. Neuroradiol. 2022, 43, 1653–1659. [Google Scholar] [CrossRef]
  15. Goto, M.; Hagiwara, A.; Kato, A.; Fujita, S.; Hori, M.; Kamagata, K.; Sugano, H.; Arai, H.; Aoki, S.; Abe, O.; et al. Estimation of intracranial volume: A comparative study between synthetic MRI and FSL-brain extraction tool (BET)2. J. Clin. Neurosci. 2020, 79, 178–182. [Google Scholar] [CrossRef]
  16. Chen, Y.; Su, S.; Dai, Y.; Wen, Z.; Qian, L.; Zhang, H.; Liu, M.; Fan, M.; Chu, J.; Yang, Z. Brain Volumetric Measurements in Children with Attention Deficit Hyperactivity Disorder: A Comparative Study between Synthetic and Conventional Magnetic Resonance Imaging. Front. Neurosci. 2021, 15, 711528. [Google Scholar] [CrossRef]
  17. Lee, S.M.; Kim, E.; You, S.K.; Cho, H.H.; Hwang, M.J.; Hahm, M.H.; Cho, S.H.; Kim, W.H.; Kim, H.J.; Shin, K.M.; et al. T: Comparison with modified SPM segmentation methods. Neuroradiology 2022, 64, 381–392. [Google Scholar] [CrossRef]
  18. Vanderhasselt, T.; Naeyaert, M.; Watté, N.; Allemeersch, G.J.; Raeymaeckers, S.; Dudink, J.; de Mey, J.; Raeymaekers, H. Synthetic MRI of Preterm Infants at Term-Equivalent Age: Evaluation of Diagnostic Image Quality and Automated Brain Volume Segmentation. Am. J. Neuroradiol. 2020, 41, 882–888. [Google Scholar] [CrossRef]
  19. Research Imaging Institute; UTHSCSA; Habes, M. Mango; Research Imaging Institute, UTHSCSA: San Antonio, TX, USA, 2019. [Google Scholar]
  20. Fischl, B. FreeSurfer. Neuroimage 2012, 62, 774–781. [Google Scholar] [CrossRef]
  21. Hoopes, A.; Mora, J.S.; Dalca, A.V.; Fischl, B.; Hoffmann, M. SynthStrip: Skull-stripping for any brain image. NeuroImage 2022, 260, 119474. [Google Scholar] [CrossRef]
  22. Fedorov, A.; Beichel, R.; Kalpathy-Cramer, J.; Finet, J.; Fillion-Robin, J.C.; Pujol, S.; Bauer, C.; Jennings, D.; Fennessy, F.M.; Sonka, M.; et al. 3D Slicer as an Image Computing Platform for the Quantitative Imaging Network. Magn. Reson. Imaging 2012, 30, 1323–1341. [Google Scholar] [CrossRef] [PubMed]
  23. IBM (Ed.) IBM SPSS Statistics 21 Algorithms; IBM: Armonk, NY, USA, 2012. [Google Scholar]
  24. DATAtab Team. DATAtab: Online Statistics Calculator; DATAtab e.U.: Graz, Austria, 2023. [Google Scholar]
  25. Landis, J.R.; Koch, G.G. The measurement of observer agreement for categorical data. Biometrics 1977, 33, 159–174. [Google Scholar] [CrossRef] [PubMed]
  26. Hagiwara, A.; Hori, M.; Yokoyama, K.; Takemura, M.; Andica, C.; Tabata, T.; Kamagata, K.; Suzuki, M.; Kumamaru, K.; Nakazawa, M.; et al. Synthetic MRI in the Detection of Multiple Sclerosis Plaques. Am. J. Neuroradiol. 2017, 38, 257–263. [Google Scholar] [CrossRef] [PubMed]
  27. Granberg, T.; Uppman, M.; Hashim, F.; Cananau, C.; Nordin, L.E.; Shams, S.; Berglund, J.; Forslin, Y.; Aspelin, P.; Fredrikson, S.; et al. Clinical Feasibility of Synthetic MRI in Multiple Sclerosis: A Diagnostic and Volumetric Validation Study. Am. J. Neuroradiol. 2016, 37, 1023–1029. [Google Scholar] [CrossRef] [PubMed]
  28. Warntjes, J.; Leinhard, O.D.; West, J.; Lundberg, P. Rapid magnetic resonance quantification on the brain: Optimization for clinical usage. Magn. Reson. Med. 2008, 60, 320–329. [Google Scholar] [CrossRef] [PubMed]
  29. Hagiwara, A.; Hori, M.; Suzuki, M.; Andica, C.; Nakazawa, M.; Tsuruta, K.; Takano, N.; Sato, S.; Hamasaki, N.; Yoshida, M.; et al. Contrast-enhanced synthetic MRI for the detection of brain metastases. Acta Radiol. Open 2016, 5, 2058460115626757. [Google Scholar] [CrossRef] [PubMed]
  30. Blystad, I.; Warntjes, J.; Smedby, O.; Landtblom, A.M.; Lundberg, P.; Larsson, E.M. Synthetic Mri of the Brain in a Clinical Setting. Acta Radiol. 2012, 53, 1158–1163. [Google Scholar] [CrossRef]
  31. Kidokoro, H.; Anderson, P.J.; Doyle, L.W.; Woodward, L.J.; Neil, J.J.; Inder, T.E. Brain Injury and Altered Brain Growth in Preterm Infants: Predictors and Prognosis. Pediatrics 2014, 134, e444–e453. [Google Scholar] [CrossRef] [PubMed]
  32. Keunen, K.; Išgum, I.; van Kooij, B.J.; Anbeek, P.; van Haastert, I.C.; Koopman-Esseboom, C.; Fieret-van Stam, P.C.; Nievelstein, R.A.; Viergever, M.A.; de Vries, L.S.; et al. Brain Volumes at Term-Equivalent Age in Preterm Infants: Imaging Biomarkers for Neurodevelopmental Outcome through Early School Age. J. Pediatr. 2016, 172, 88–95. [Google Scholar] [CrossRef]
  33. Gui, L.; Loukas, S.; Lazeyras, F.; Hüppi, P.; Meskaldji, D.; Borradori Tolsa, C. Longitudinal study of neonatal brain tissue volumes in preterm infants and their ability to predict neurodevelopmental outcome. NeuroImage 2019, 185, 728–741. [Google Scholar] [CrossRef]
  34. Abreu, N.J.; Selvaraj, B.; Truxal, K.V.; Moore-Clingenpeel, M.; Zumberge, N.A.; McNally, K.A.; McBride, K.L.; Ho, M.L.; Flanigan, K.M. Longitudinal MRI brain volume changes over one year in children with mucopolysaccharidosis types IIIA and IIIB. Mol. Genet. Metab. 2021, 133, 193–200. [Google Scholar] [CrossRef] [PubMed]
  35. Al Kaissi, A.; Ryabykh, S.; Chehida, F.B.; Al Kaissi, H.; Kircher, S.G.; Grill, F.; Guben, A. Meticulous and Early Understanding of Congenital Cranial Defects Can Save Lives. Children 2023, 10, 1240. [Google Scholar] [CrossRef] [PubMed]
Figure 1. Example SyMRI maps for (a) intracranial volume (ICV), (b) cerebrospinal fluid (CSF), (c) grey matter, and (d) white matter. The sum of grey and white matter represents the brain parenchyma volume (BPV).
Applsci 14 04751 g001
Figure 2. The image shows SyMRI reference curves for ICV, BPV, and CSF in a sample patient. Note that the CSF volume is increased above the normal amount while the BPV is at the lower threshold, which can be visually determined from the curve. The present constellation of findings suggests the onset of brain atrophy.
Applsci 14 04751 g002
Figure 3. Sample segmentations derived from 3D slicer depicting masks of cerebrospinal fluid and brain tissue.
Applsci 14 04751 g003
Figure 4. Flowchart showing the inclusion and exclusion of patients.
Applsci 14 04751 g004
Figure 5. Bland−Altman plots for the ICV, BPV, and CSF, visually demonstrating the difference in measurements between the manual and SyMRI methods in relation to the mean values of both measurement methods.
Applsci 14 04751 g005
Figure 6. Scatter plots with fit lines and 95% confidence interval borders.
Applsci 14 04751 g006
Figure 7. Box plots comparing the agreements between SyMRI-derived CSF volumes with (a) manual measurements, and (b) human raters. The asterisk marks an outlier, which lies significantly outside the range of the rest of the data (more than 1.5 times the IQR from the median value).
Applsci 14 04751 g007
Figure 8. Box plots displaying relative differences in CSF volume measurements (manual vs. SyMRI) for gender and age.
Applsci 14 04751 g008
Figure 9. A bar chart showing the normalized slice position in the x-axis, meaning 0 is the most caudal slice and 1 is the most cranial slice in comparison to the probability of the presence of segmentation errors by SyMRI.
Applsci 14 04751 g009
Figure 10. Errors in automatic masking (marked by white arrows) were commonly observed in the most cranial parts of the head and were mostly insignificant to the final result.
Applsci 14 04751 g010
Figure 11. (ac) SyMRI maps depicting the erroneous segmentation of the intracranial compartments in the posterior fossa on the right side. The cause of the distortions is the magnetic valve of a ventriculo-peritoneal shunt.
Applsci 14 04751 g011
Figure 12. Sample slices of an MDME sequence degraded by motion artifacts in a patient that underwent a “feed and wrap” MRI of the brain. Due to image quality constraints, the SyMRI software could not perform a sufficient automatic evaluation. (a) MDME images; (b) corresponding field maps.
Applsci 14 04751 g012
Table 1. Summary of patient characteristics.
ParameterAge (Years)Weight (kg)Body Size (m)BMI
Cases (n)124124124124
Minimum0.01.80.48.6
Maximum18.179.01.729.7
25th percentile0.897.450.6914.26
Median2.7514.000.9316.00
75th percentile5.3622.381.1918.52
Disclaimer/Publisher’s Note: The statements, opinions and data contained in all publications are solely those of the individual author(s) and contributor(s) and not of MDPI and/or the editor(s). MDPI and/or the editor(s) disclaim responsibility for any injury to people or property resulting from any ideas, methods, instructions or products referred to in the content.

