Article

The Influence of Late Gadolinium Enhancement Cardiac Magnetic Resonance Image Analysis Imprecision on Myocardial Damage Quantification in Patients with Myocarditis: A Pilot Study

1
Institute of Physiology, Faculty of Medicine, University of Ljubljana, 1000 Ljubljana, Slovenia
2
University Medical Centre Ljubljana, 1000 Ljubljana, Slovenia
3
Department of Cardiology, Izola General Hospital, 6310 Izola, Slovenia
*
Author to whom correspondence should be addressed.
Appl. Sci. 2024, 14(1), 117; https://doi.org/10.3390/app14010117
Submission received: 20 November 2023 / Revised: 18 December 2023 / Accepted: 19 December 2023 / Published: 22 December 2023
(This article belongs to the Special Issue Advances in Magnetic Resonance Imaging (MRI))

Abstract

:

Featured Application

In this pilot study, we quantify the contribution of the late gadolinium enhancement (LGE) cardiac magnetic resonance (CMR) image analysis steps to the overall variability of the image analysis process in patients with myocarditis. Within the study protocol, we took an original approach and developed solutions to address this important but underexplored issue. We trust that our research represents a first step toward reducing the overall variability of the LGE-CMR image analysis process, which is important to improve the diagnosis and prognosis of myocarditis patients.

Abstract

Background: Myocardial damage in myocarditis is assessed through late gadolinium enhancement (LGE) cardiac magnetic resonance (CMR). Variability in quantifying myocarditis extent results from imprecise image segmentation and inconclusive data on quantification method selection. To improve analysis precision, segmentation steps are systematically ranked based on their inherent risks of error. Additionally, data on two distinct quantification methods are presented. Methods: Using newly developed software, four experts analyzed five LGE-CMR left ventricular (LV) short-axis (SAx) images of myocarditis patients in three sessions. Regions of interest (ROIs) (myocardial (ROImyoc), reference (ROIref), and exclusion region (ROIexcl)) were identified and used to calculate LGE extent with 3σ (intensity above three standard deviations (σ) in reference) and the full width at half maximum (FWHM) method (intensity above 50% of maximum signal in reference). The reference LGE extent was calculated and the influence of the ROIs on LGE extent variability was determined. Interobserver and intraobserver variability were evaluated as 1-intraclass correlation coefficient (ICC). Results: LGE extent variability was 6.2 ± 0.6% for 3σ and 4.0 ± 0.6% for FWHM. The contributions of ROImyoc, ROIref, and ROIexcl were 1.5 ± 0.2%, 2.7 ± 0.4%, and 2 ± 0.3%, respectively, for 3σ, and 1.1 ± 0.1%, 1.6 ± 0.4%, and 1.3 ± 0.3%, respectively, for FWHM. LGE extent was lower in FWHM. Interobserver variability was 0.56 for 3σ and 0.43 for FWHM. The intraobserver variability was higher for the 3σ method in all four observers. Conclusion: ROIref selection contributed most to LGE extent variability. FWHM yielded lower LGE extent and lower inter- and intraobserver variability. Due to low statistical significance, the findings are only partially confirmed.

1. Introduction

Myocarditis is the inflammation of myocardial tissue [1]. Myocarditis can affect the heart diffusely or focally, affecting different segments of the left ventricle (LV). Its clinical signs and symptoms are diverse, which makes diagnosis challenging [2]. Myocarditis is underdiagnosed due to the low sensitivity of cardiac biomarkers, ECG, and imaging modalities [3]. Myocarditis can only be confirmed by endomyocardial biopsy, which is seldom performed due to its invasive nature [4]. Echocardiography is non-specific for myocarditis and can show decreased LV function, thickened walls due to edema, segmental wall motion abnormalities, thrombus, and associated pericardial effusion. The golden non-invasive imaging standard for establishing a myocarditis diagnosis is cardiovascular magnetic resonance (CMR). This allows tissue characterization and the detection of focal myocardial involvement [5]. Meanwhile, late gadolinium enhancement (LGE) is an important parameter of myocardial injury, detecting expanded extracellular space due to myocyte necrosis, fibrosis, or edema [6]. Tracking LGE over time also helps guide treatment decisions [7].
Because myocarditis primarily affects the subepicardial or mid-LV areas [8], clinical experts determine the extent and regional distribution of myocardial damage by analyzing short-axis (SAx) LGE-CMR images (slices) of the LV (Figure 1), which cover the heart from base to apex.
They use clinical experience and LGE image characteristics associated with myocarditis to identify bright regions that correspond to increased LGE accumulation [9], thus reflecting myocardial damage. During the image analysis, they segment the heart by identifying various regions of interest (ROIs) that depict pathological and normal myocardium. Then, by using the ROIs, they calculate the location and the extent of LGE by using mathematical quantification methods that distinguish between normal and pathological myocardium based on signal intensity (SI) differences between pixels belonging to each of them [6,10].
The segmentation requires high levels of attention during ROI definition and this work is highly repetitive, repeated for up to 10 slices per ventricle, which altogether may increase errors. Furthermore, it is known that there is intraobserver and interobserver variation in the results of image analysis [6,10,11]. The variability originates in the subjective delineation of the ROIs. Because different ROIs may make different contributions to overall variability, it is of use to the specialist to know which delineation of ROIs creates the most error in the results. Thus, this study ranks all ROI delineation steps in terms of their contribution to overall LGE extent variability.
In addition, inconclusive data on the preferred mathematical quantification method prevent standardization of the procedure. Clinical experts mostly use thresholding-based methods or the full width at half maximum (FWHM) method [6,10,11]. While thresholding methods use an SI threshold defined by standard deviations (σ) above a reference region selected in normal or dark myocardium [6], the FWHM method uses a threshold of above 50% of maximal SI within the reference region defined in pathological (bright) myocardium [10]. Existing evidence indicates that the FWHM method may be most appropriate for evaluating myocardial scarring in myocarditis patients, given its high prognostic value and low inter- and intraobserver variability [6,10,11,12]. However, as thresholding methods are frequently used in practice, we decided to enhance our study by performing analysis using both the FWHM and the 3σ method. The latter has previously shown good reproducibility in quantifying myocardial scars of different etiologies [10] and is significantly associated with major adverse cardiovascular events (MACEs) in myocarditis patients [6]. We believe that comparing these two methods in terms of their impact on LGE extent and their inter- and intraobserver variability adds depth to our analysis and helps in clarifying the preferred method.

2. Materials and Methods

We analyzed five selected LGE-CMR LV SAx images of different patients with diagnosed myocarditis (Table 1). A cardiologist reviewed the clinical data, cardiac biomarkers, and ECGs at baseline to confirm the clinical diagnosis of myocarditis. This study was conducted following ethics commission requirements for the retrospective analysis of anonymized clinical images.
Four different clinical specialists analyzed each of our images in three repetitions carried out at 10-day intervals. The team of specialists was composed of two cardiologists and two radiologists with an average of 10 years of experience. They were not made aware of other specialists’ measurements or the clinical data in totality.
Different cardiac disorders are characterized by different LGE patterns visible on LGE-CMR images. In myocarditis, gadolinium (Gd) typically distributes in the subepicardial or mid-myocardial region, forming a characteristic patchy pattern [8]. Thus, our first criterion for selecting the five images that were analyzed was that the LGE pattern was indicative of myocarditis. Furthermore, we only analyzed images belonging to mid-ventricular regions because they are least affected by partial volume effects [8].

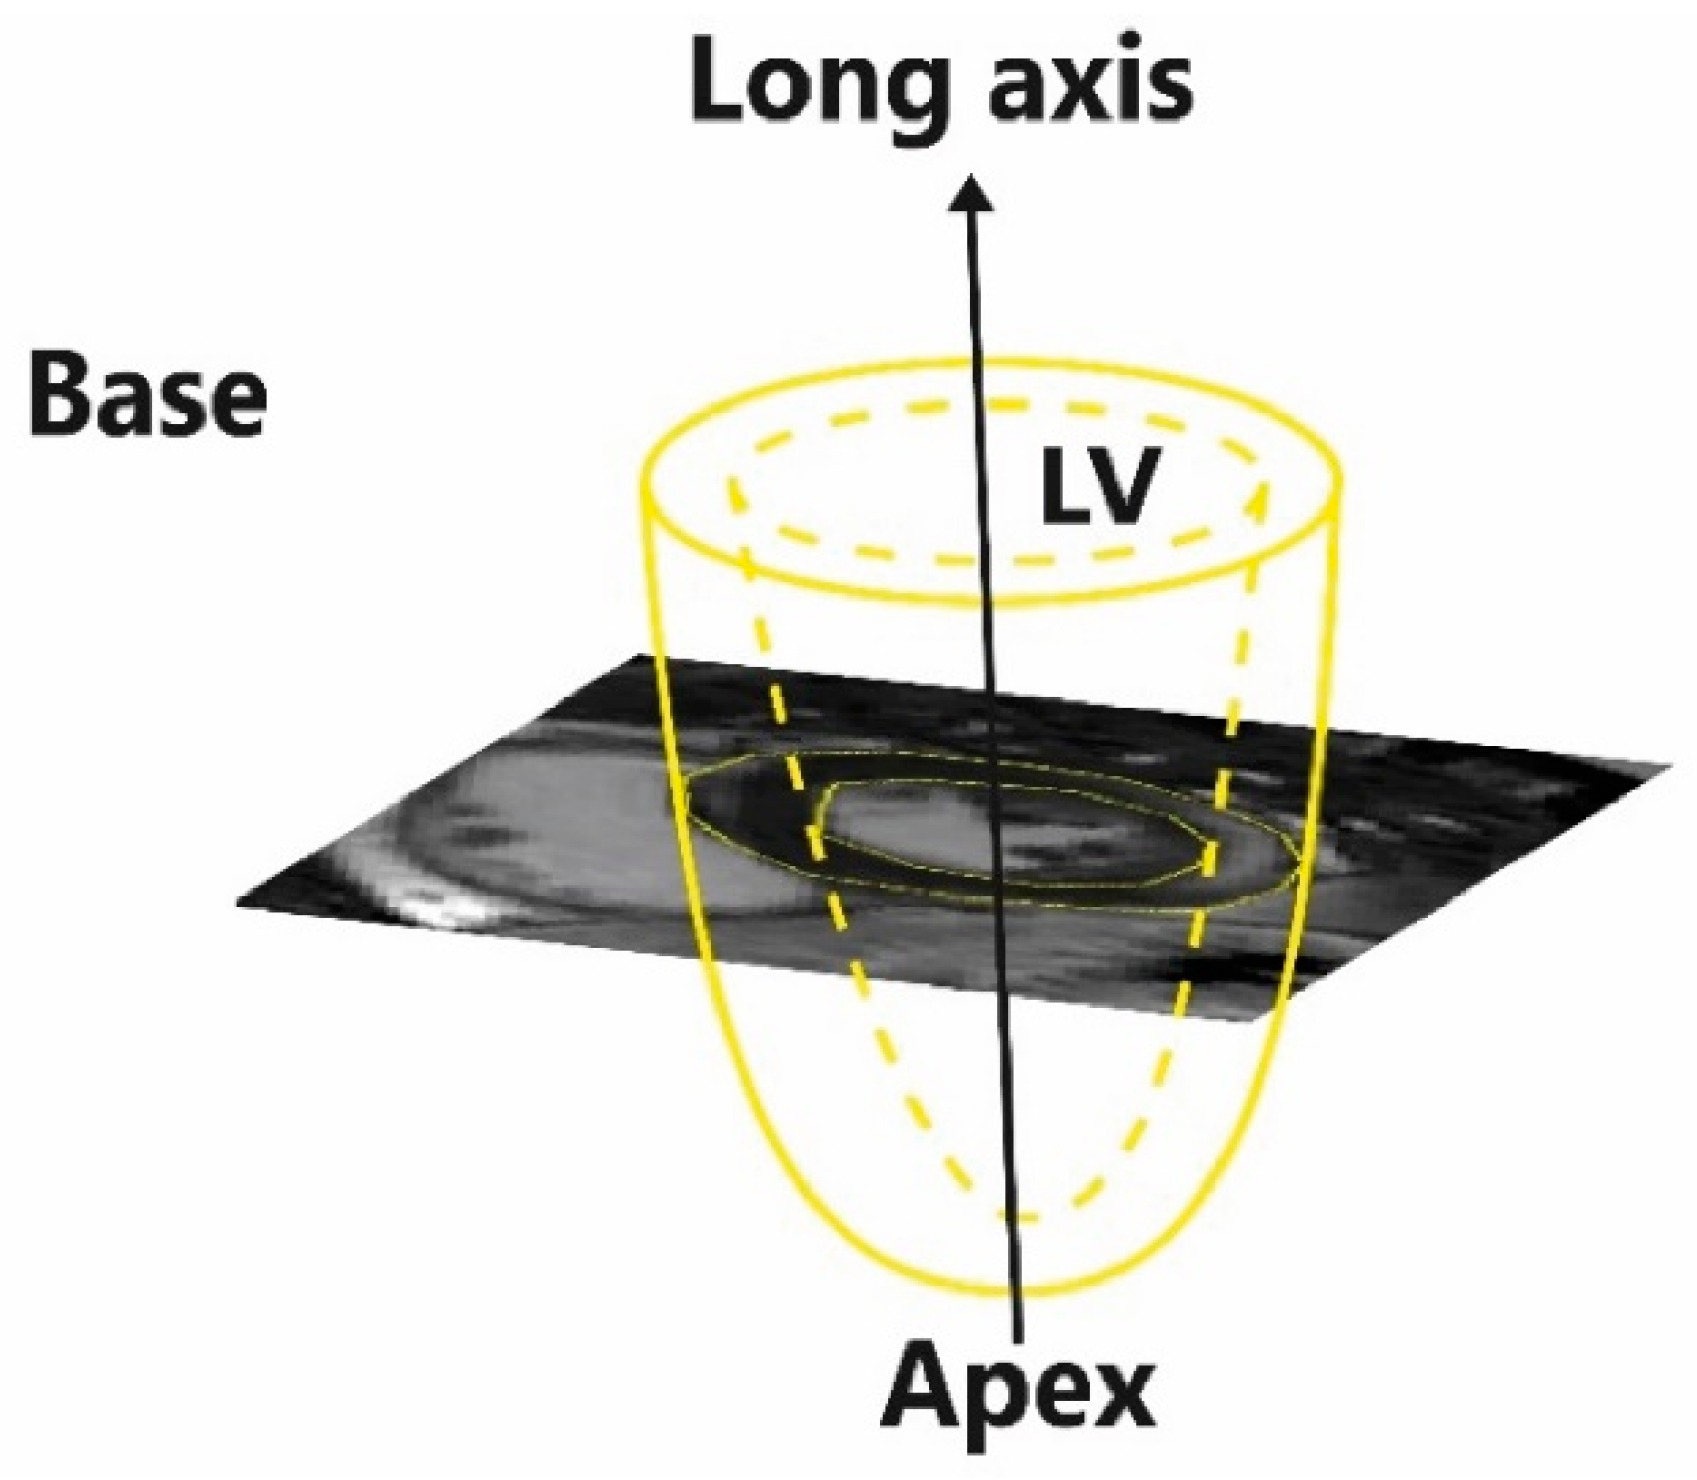
2.1. Imaging Protocol

CMR was performed at the Ljubljana University Medical Center using a 3 Tesla (T) scanner (Siemens TrioTim scanner, Siemens Healthineers, Forcheim, Germany). Before imaging, 0.1 mmol/kg of Gadovist, a gadolinium-based contrast agent, was administered intravenously to patients. Phase-sensitive inversion recovery imaging (PSIR) [9,13] was used to provide good contrast between normal myocardial tissue and myocarditis-affected tissue while also providing fast imaging. Images were T1-weighted (T1w), with typical imaging parameters of repetition time (TR) 700–800 ms, echo time (TE) 1.5–1.6 ms, delay time (TD) 500–650 ms, matrix size 256 × 256, flip angle (FA) 20°, and in-plane resolution 1.4 × 1.4 mm2. The inversion time (TI) was optimized to null the normal myocardium signal, with its typical 250 to 350 ms values. For each patient, images were acquired on 10 to 12 SAx planes so that the LV was covered by slices from the base to apex. The typical slice thickness was 8 mm, with a spacing of 8 to 10 mm between slices.

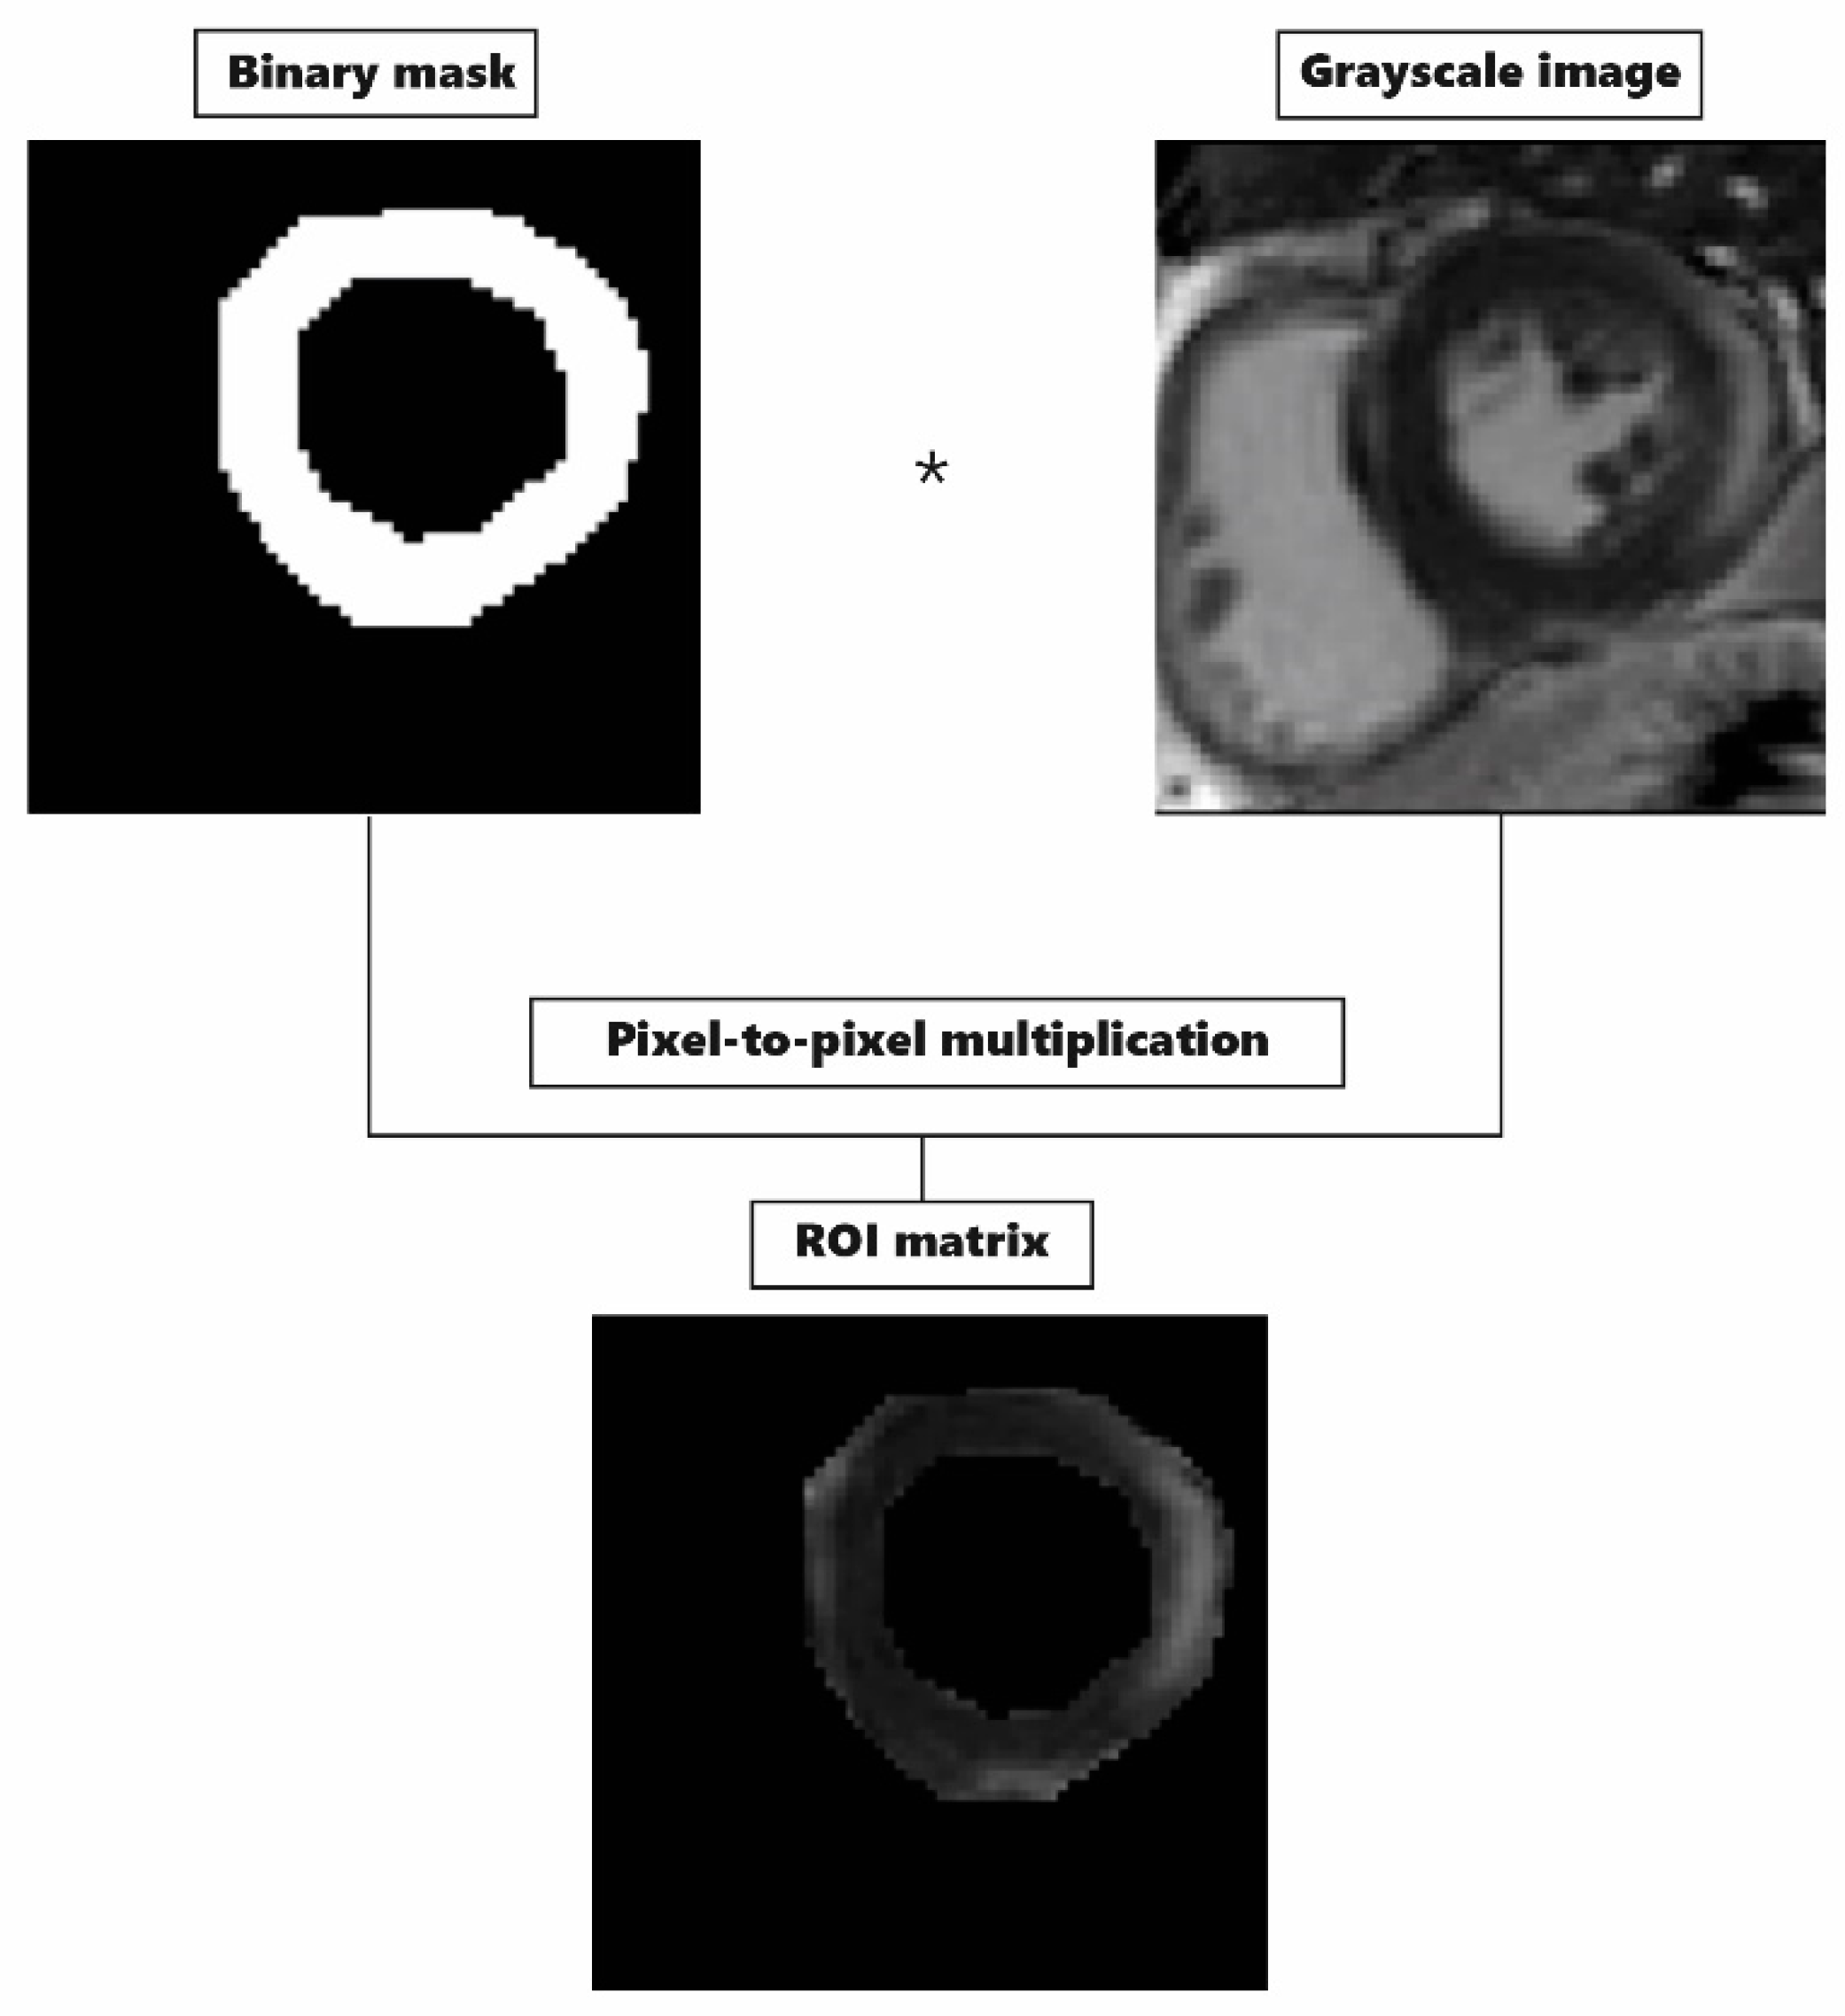
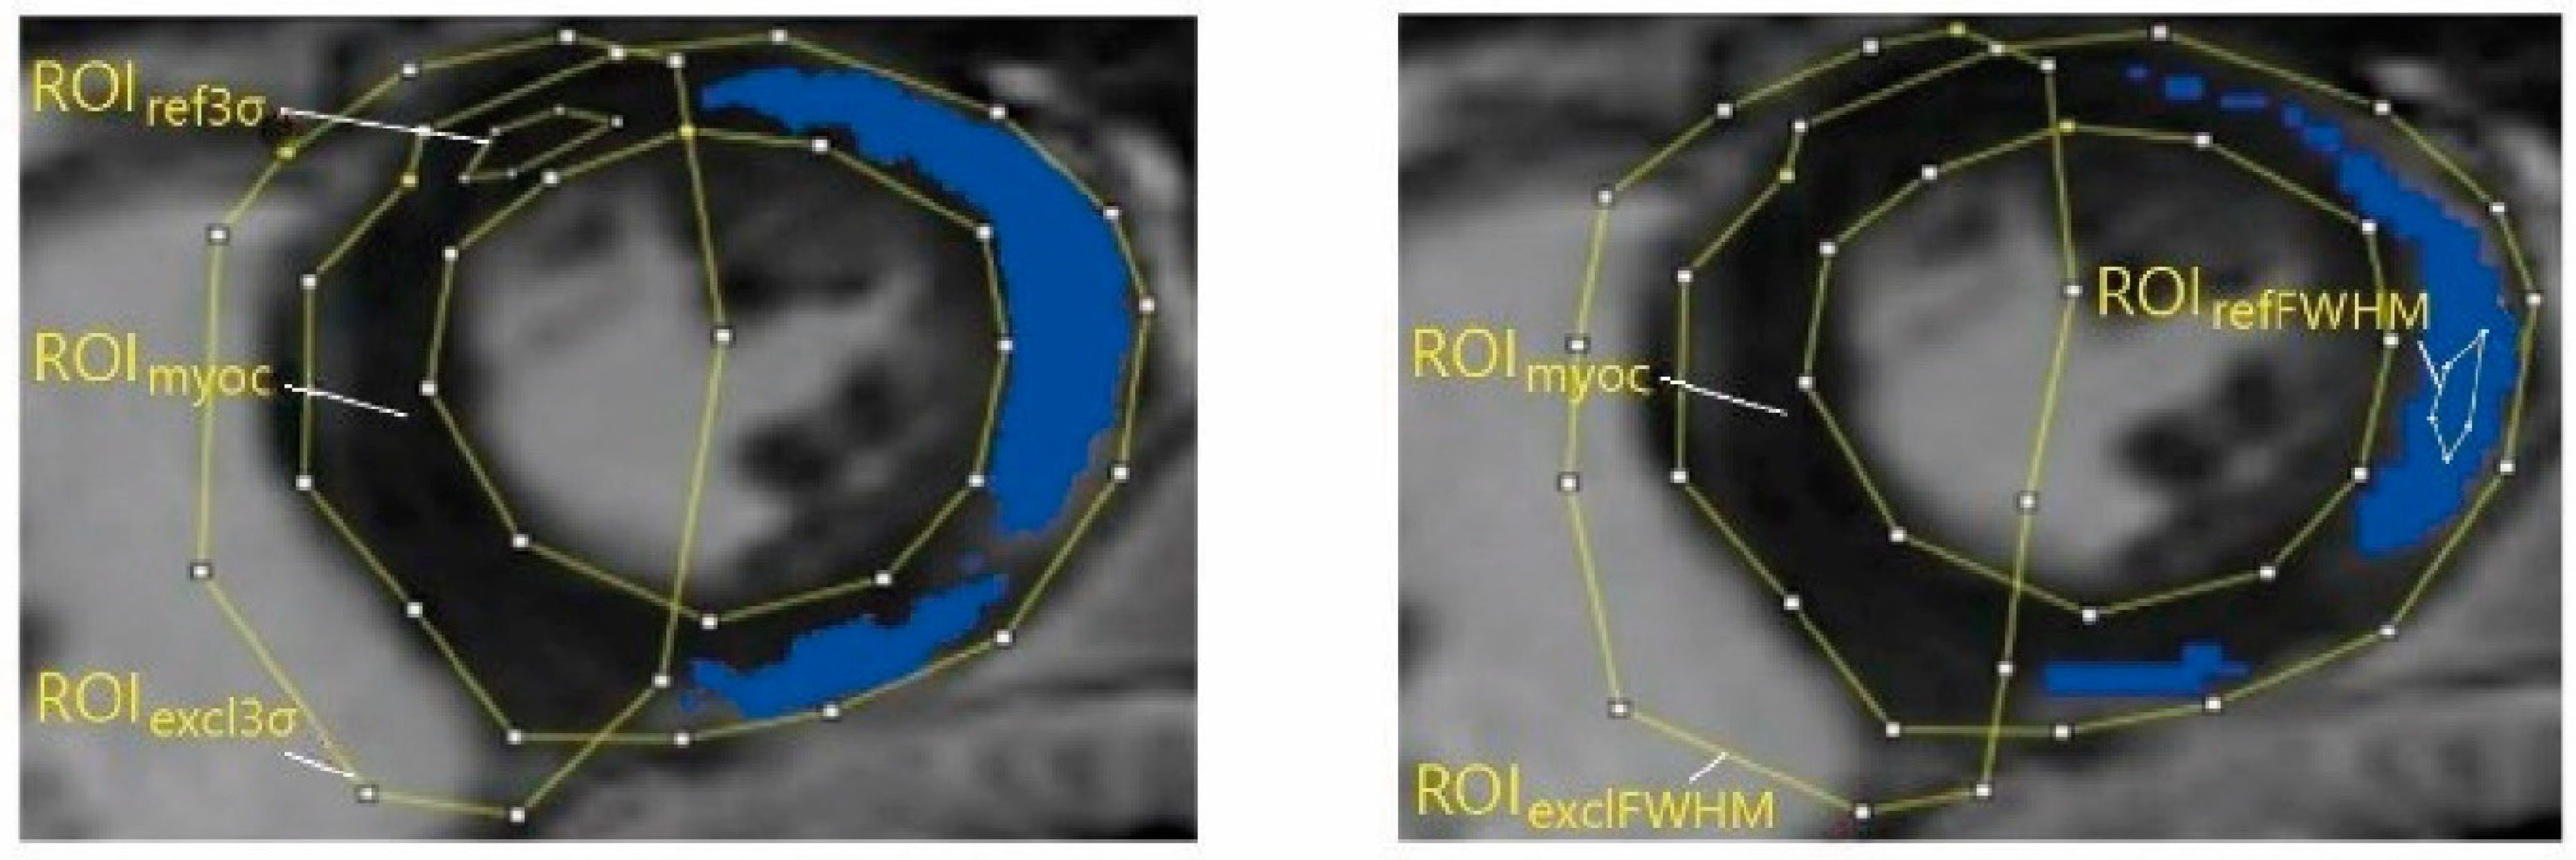
2.2. Image Segmentation Steps

In each image, three ROIs were delineated manually by using the open-source image analysis tool 3D Slicer (RRID: SCR_005619), version 4.11.20210226 [14]. We applied the same segmentation order as used in the clinical procedure. First, the myocardium region (ROImyoc) was delineated, then reference regions (ROIref) were found, and finally, the exclusion regions (ROIexcl) were determined. ROImyoc is defined by the epicardial and endocardial borders of the LV and thus forms a myocardial ring. Because the selection of ROImyoc is independent of the mathematical quantification method used, it was delineated only once per analysis and used for both mathematical quantification methods; that is, ROImyoc3σ = ROImyocFWHM = ROImyoc. Next, as the selection of ROIref depends on the mathematical quantification method used [6,10,11], two different ROIrefs were selected: ROIref3σ, representing an area of healthy or dark myocardium; and ROIrefFWHM, representing an area of pathological or bright myocardium (Figure 2).
After delineating ROImyoc and ROIref, the specialists used a preliminary calculation of pathological regions in the image to delineate ROIexcl, which eliminates potential artifacts such as blood pools from further LGE extent calculations. Because the result of quantification differs when using different mathematical quantification methods (Figure 2), they delineated two ROIexcl regions: ROIexcl3σ and ROIexclFWHM. In the calculations of LGE extent, the ROIexcl regions were treated as healthy regions.

2.3. LGE Quantification

After ROI delineation was concluded, the image and the corresponding ROIs were exported to MATLAB (RRID:SCR_001622), version R2021a, as an 8-bit grayscale image and binary mask, respectively. Through pixel-to-pixel multiplication, we obtained ROI matrices in which the elements differed from zero only within the ROIs (Figure 3).
We calculated the LGE extent for the 3σ and FWHM methods separately using the ROI matrices. In both methods, we found pixels associated with myocarditis pathology according to a corresponding mathematical condition, and then we calculated the LGE extent as their percent share of the total ROImyoc area, for which the area was quantified with an exact number of pixels included. In the 3σ method, we found pixels brighter than three σ above the mean value of pixel brightness within ROIref3σ. In the FWHM method, we found pathological pixels brighter than 50% of maximal pixel brightness within ROIrefFWHM.
We performed all calculations with our custom-made program in MATLAB (RRID: SCR_001622). Together with the open-source program 3D Slicer (RRID: SCR_005619), it forms a functional unit as an alternative to commercial LGE-CMR image analysis software. To calibrate this, we compared MATLAB (RRID: SCR_001622)-provided results of LGE extent with the results provided by the trial version of the commercially available software Circle cvi42, version 5.10, Circle Cardiovascular Imaging Inc. (Calgary, AB, Canada). During the segmentation process, we ensured that the ROIs were delineated similarly when using different tools. The results differed by less than 1%.

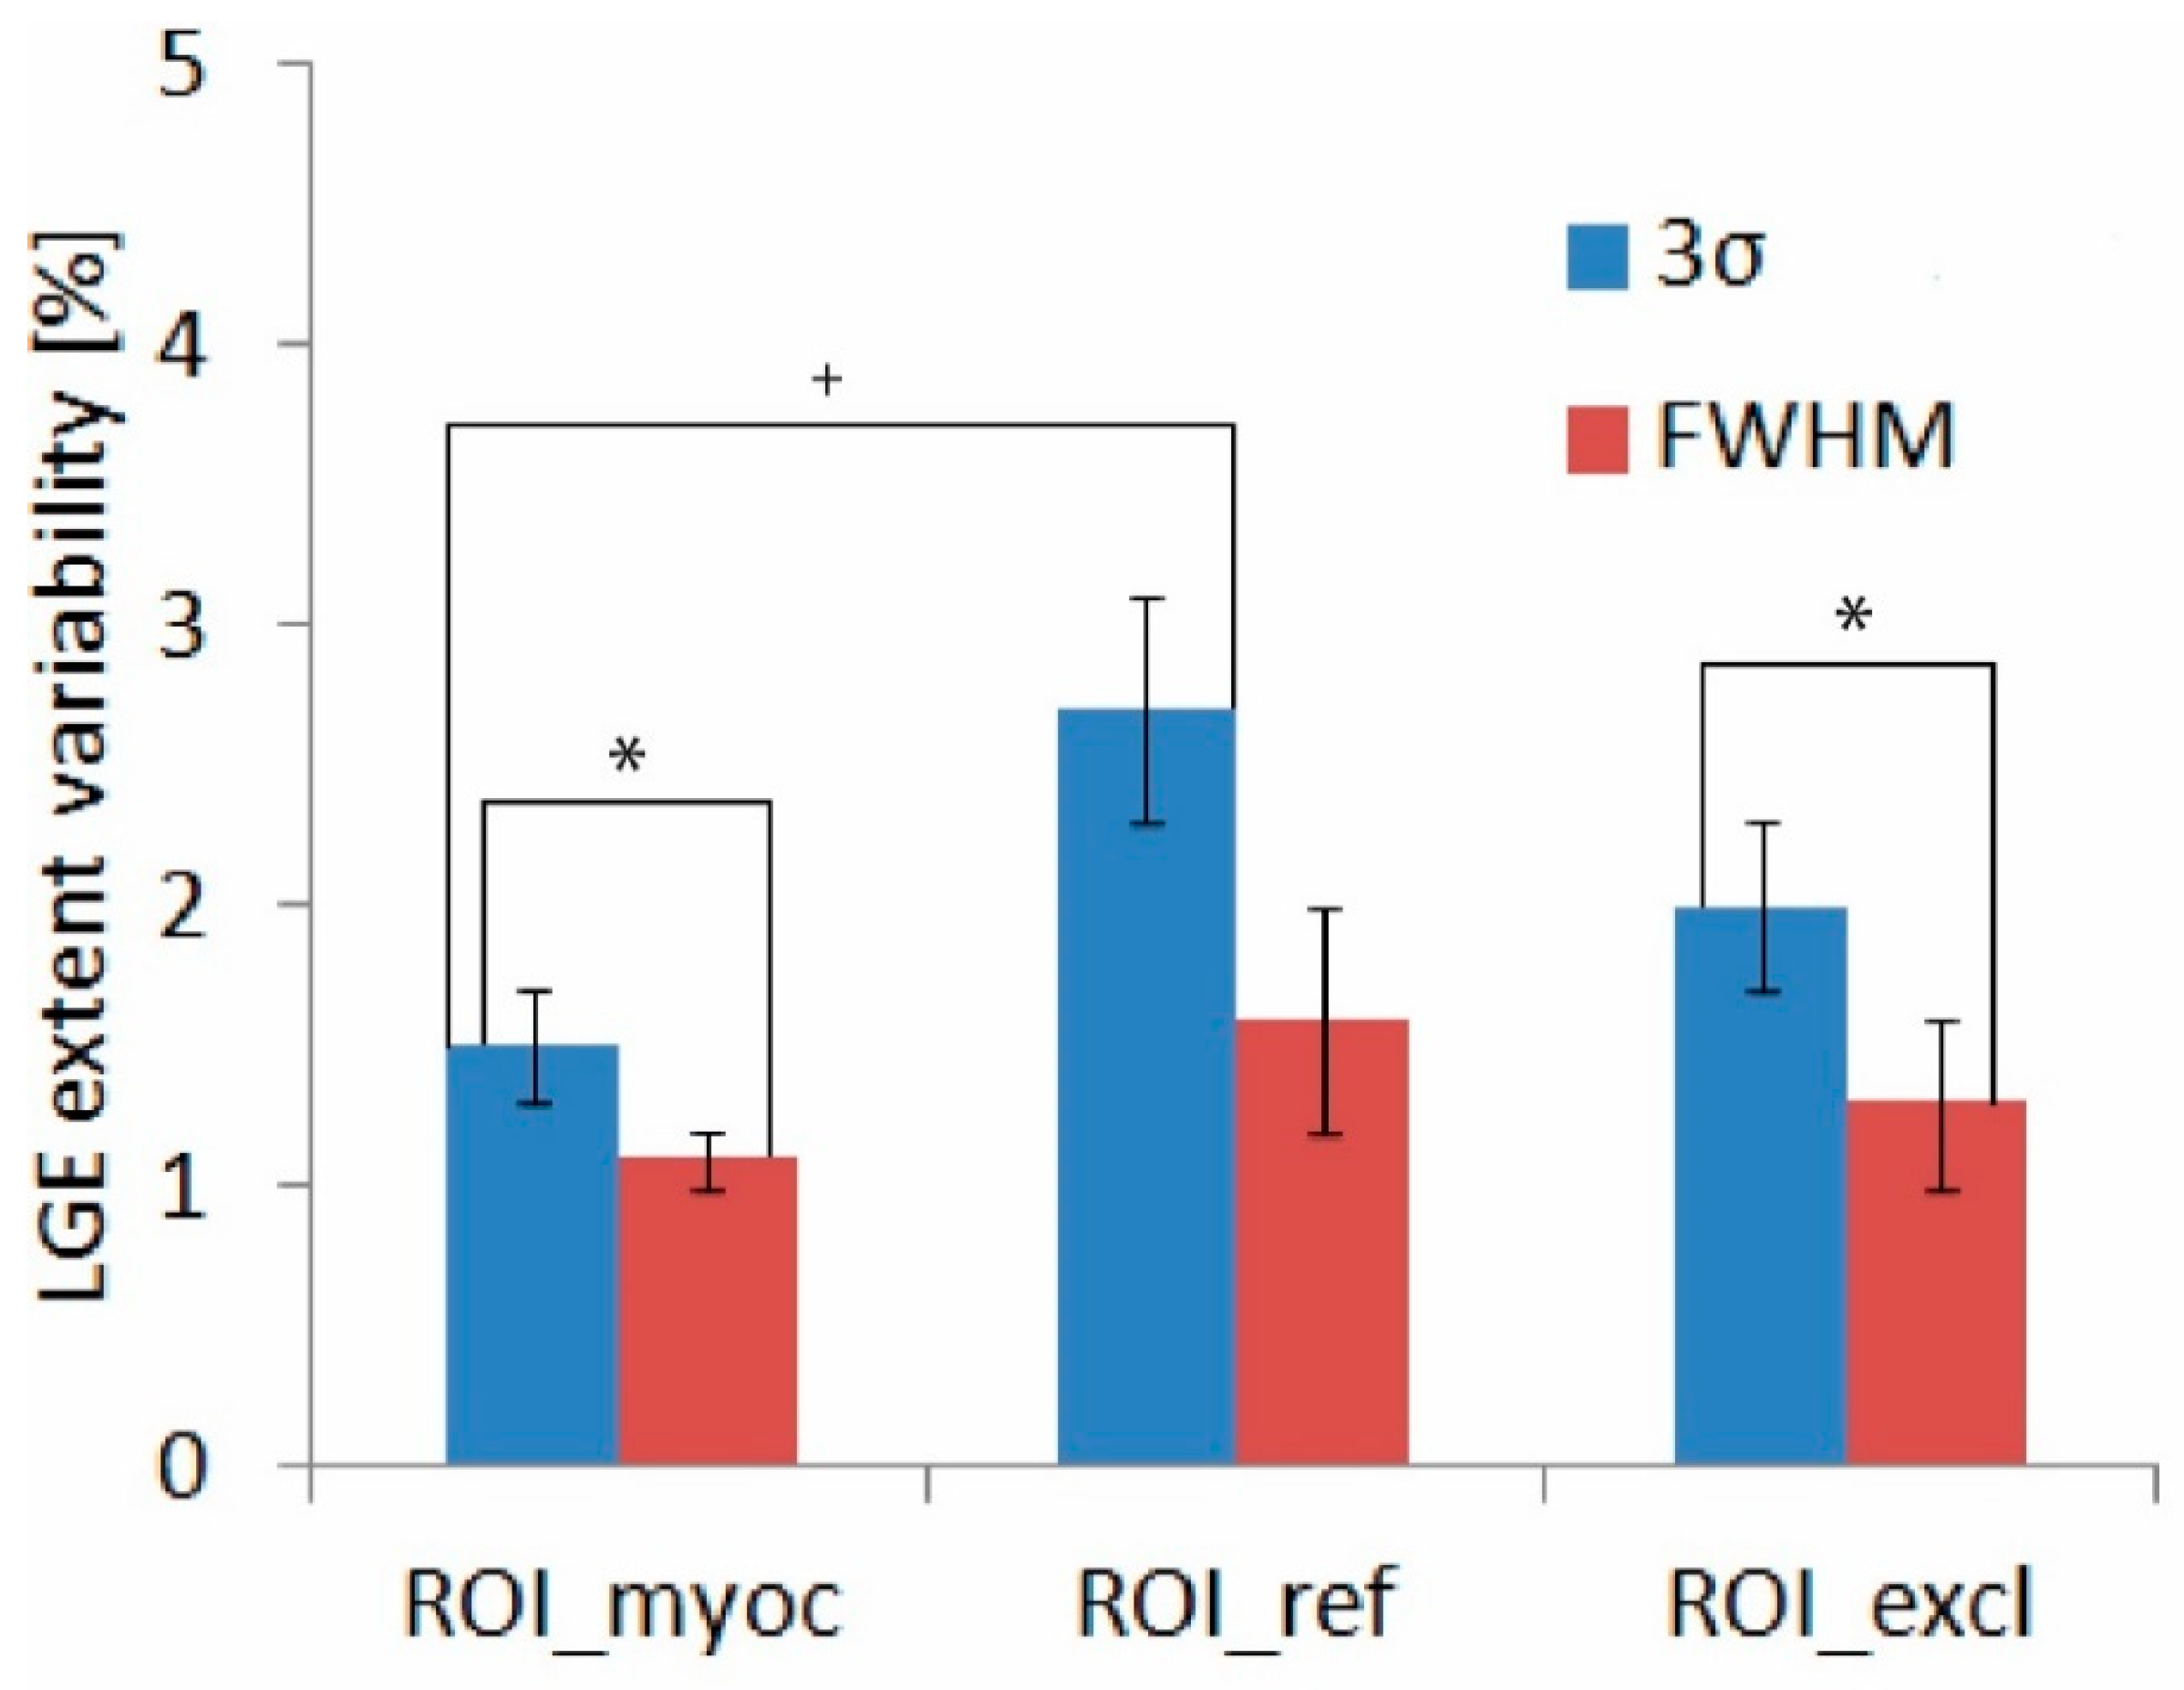
2.4. LGE Extent Reference and Variability

LGE extents (LGE3σ,k,i,e and LGEFWHM,k,i,e) were calculated for each slice (k), repetition (i), and specialist (e), separately for both mathematical quantification methods. LGE3σ,k,i,e was calculated by using ROImyoc,k,i,e, ROIref3σ,k,i,e, and ROIexcl3σ,k,i,e, and LGEFWHM,k,i,e was calculated by using ROImyoc,k,i,e, ROIrefFWHM,k,i,e, and ROIexclFWHM,k,i,e.
One of the goals of the study was to evaluate the contribution of a single ROI delineation imprecision to the LGE extent, which required keeping the other two ROIs unchanged. To achieve this, we determined a reference LGE extent value as the average of all possible combinations and then compared it with the LGE extent influenced by individual ROIs.
To construct the reference LGE extent, we combined the results of three repetitions of the same specialists (e) for the same slice (k). For example, ROImyoc of the first repetition (ROImyoc,k,1,e) was combined with all three repetitions of ROIref3σ,k,1–3,e and all three repetitions of ROIexcl3σ,k,1–3,e, which gave us 9 LGE3σ,k,1,e values, and 27 altogether for all three repetitions of ROImyoc3σ,k,1–3,e itself. The same was reiterated for the remaining two ROIs, giving us 81 LGE extent values per specialist per slice and separately for the 3σ and FWHM methods.
The reference LGE extent was calculated as the average of 81 values obtained per specialist, per slice, and per quantification method. Then, a variable LGE extent for a given ROI, repetition, slice, and specialist was calculated as the average of the nine values obtained previously; for example, nine LGE extents assigned to ROImyoc3σ,k,1,e were averaged to obtain LGEmyoc3σ,k,1,e.
The LGE extent variability for ROImyoc3σ, ROIref3σ, and ROIexcl3σ was calculated as the mean absolute deviation between LGEmyoc3σ,k,1–3,e, LGEref3σ,k,1–3,e, and LGEexcl3σ,k,1–3,e and the corresponding reference values. Finally, we calculated the total LGE extent variability for each ROI by averaging the variability results across all observers and slices. We calculated the corresponding standard errors by using the general formula for the propagation of uncertainties [15].

2.5. Inter- and Intraobserver Variability

The statistical degree of agreement between observers, or interobserver variability, and within the same observer, or intraobserver variability, was evaluated as a 1-intraclass correlation coefficient (ICC) [10]. ICC evaluates the degree of agreement between the measurements from the same group, in our case LGE extents. Its values range from 0 to 1, with 1 implying complete agreement between measurements [16].
We used two different ICC models for calculations. The two-way random-effect single-score ICC model was used to calculate interobserver variability, and a two-way mixed-effect single-score model [16,17,18,19], which removes variations between observers from the calculation, was used to calculate intraobserver variability. We calculated the ICC values following the procedure described by Koo and Li [16] and reported them with their corresponding 95% confidence intervals (CIs), the lower and upper boundaries of which we calculated using the relations described by Bonett [16]. All ICC calculations were performed in Microsoft Excel.

2.6. Statistical Analysis
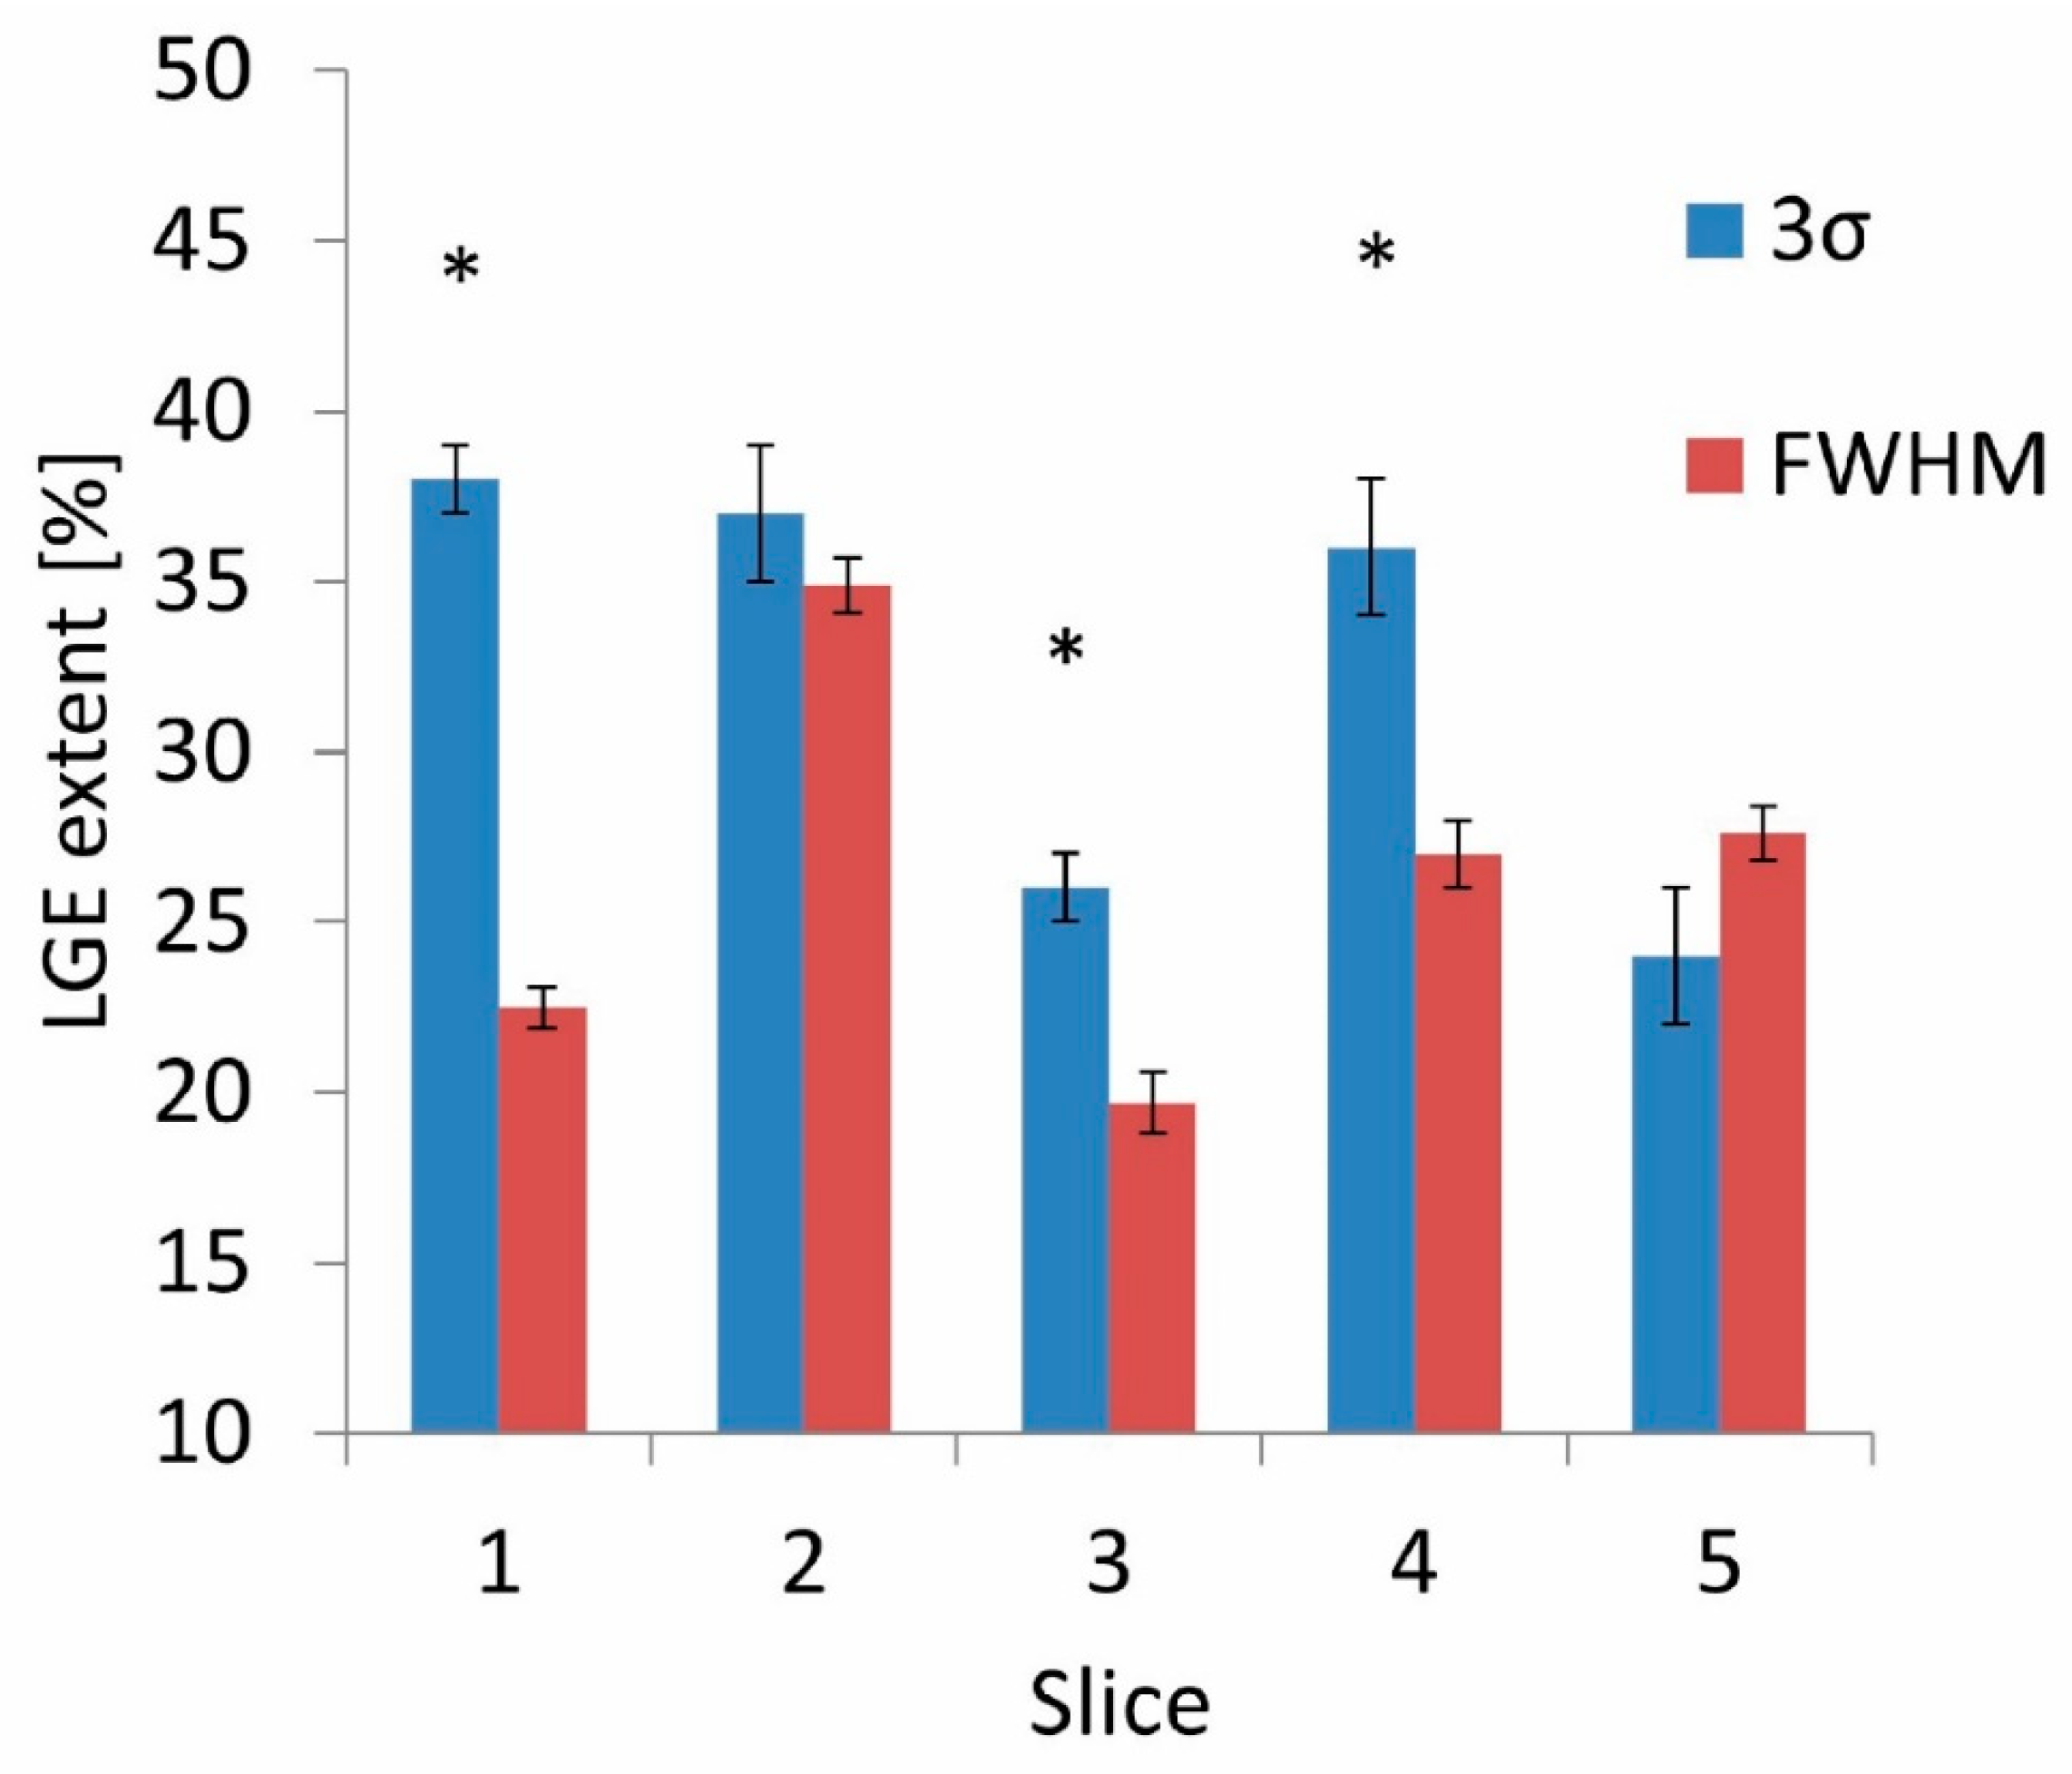
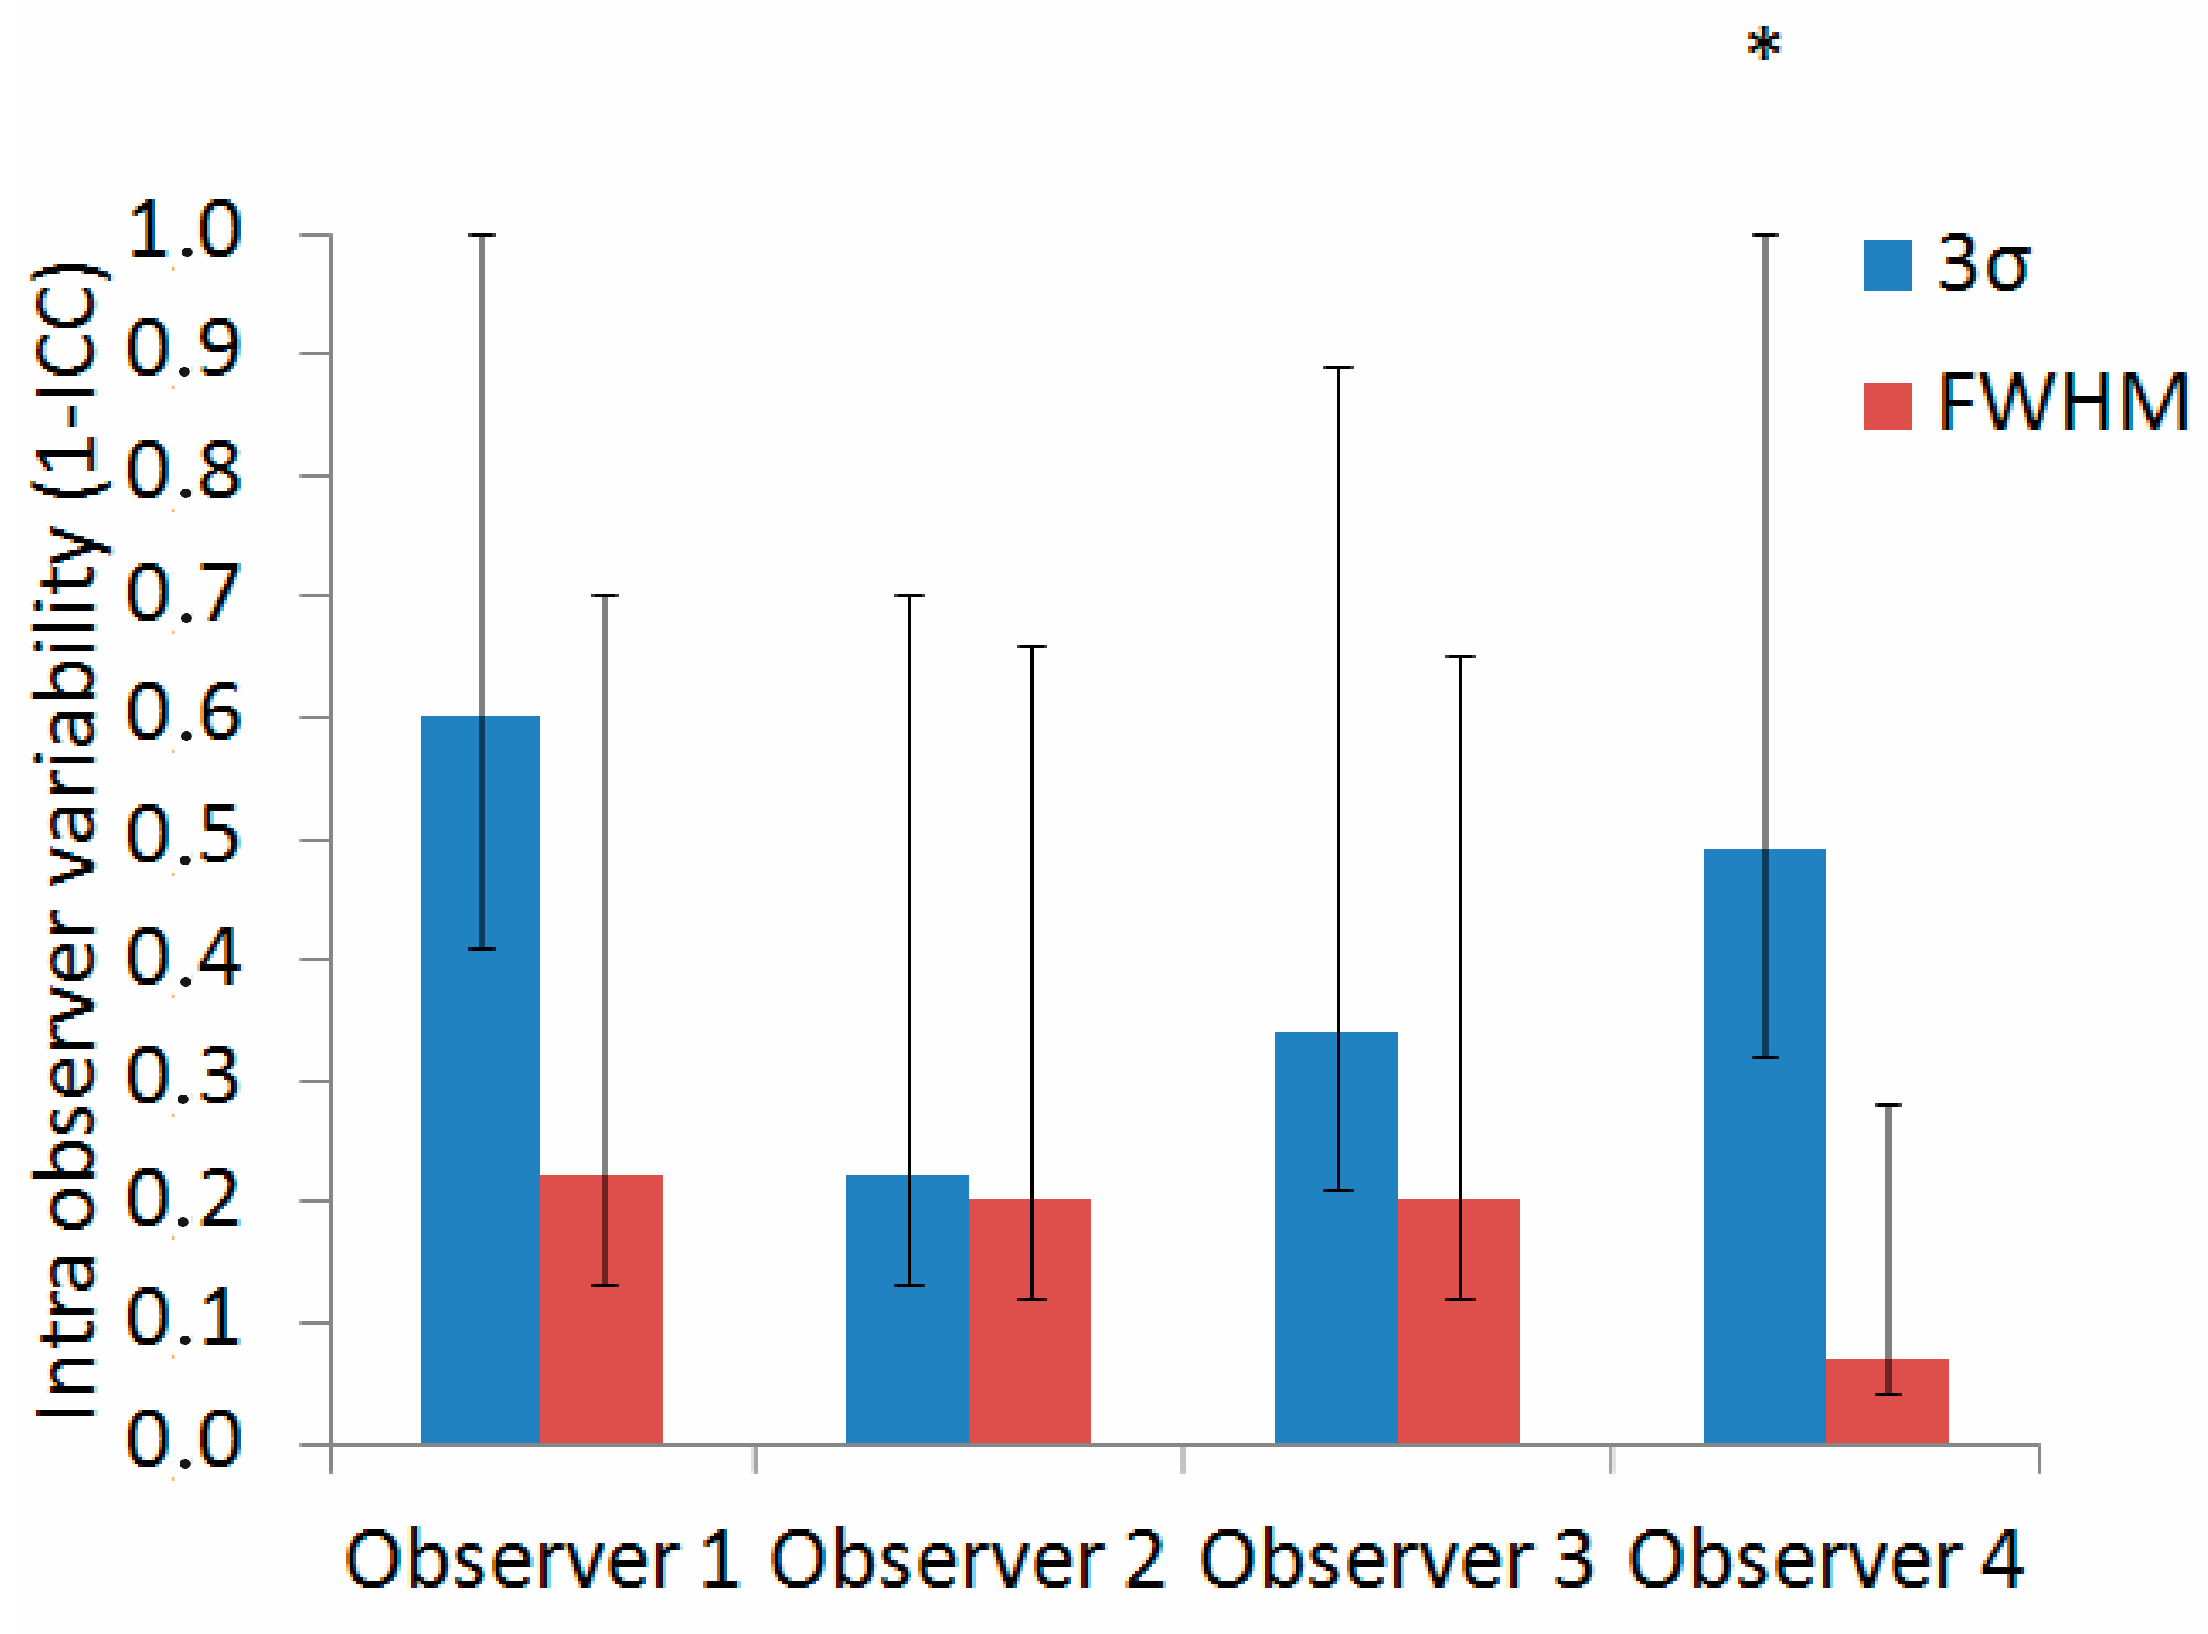
Data normality was evaluated using the Shapiro–Wilk test [20]. When comparing variability, LGE extents, and ICC coefficients, the statistical significance of observed differences was evaluated using a paired t-test [21], with the significance level set at 0.05.

3. Results

The contributions of ROImyoc, ROIref, and ROIexcl were 1.5 ± 0.2%, 2.7 ± 0.4%, and 2 ± 0.3%, respectively, for 3σ, and 1.1 ± 0.1%, 1.6 ± 0.4%, and 1.3 ± 0.3%, respectively, for FWHM (Figure 4). We found that the selection of ROIref was the largest source of variability in both quantification methods because it presented the highest average LGE extent variability, as shown in Figure 4. However, only the difference between ROIref3σ and ROImyoc3σ was statistically significant. Furthermore, the average LGE extent variability was smaller when using the FWHM method compared to the 3σ method; however, statistical significance was found only in ROImyoc and ROIexcl but not in ROIref (Figure 4).
The summation of the variabilities of the three ROIs studied resulted in a total variability equal to 6.2 ± 0.6% in the case of the 3σ quantification method and 4.0 ± 0.6% in the case of the FWHM method. We obtained similar values (6 ± 2% and 3.6 ± 0.8% for the 3σ and FWHM methods, respectively) when variability was evaluated directly from the measurements. The FWHM quantification method generally yielded lower LGE extent values. In three out of five slices, we found that the LGE extent quantified with FWHM was significantly lower than when quantified with the 3σ method (Figure 5).
The interobserver variability was higher in the 3σ method, 0.56 (0.15–0.86), compared to the FWHM method, 0.43 (0.13–0.75). The intraobserver variability was higher in the 3σ method for all four observers (Observer 1: 0.60 (0.41–1) for 3σ and 0.22 (0.13–0.70) for FWHM; Observer 2: 0.22 (0.13–0.70) for 3σ and 0.20 (0.12–0.66) for FWHM; Observer 3: 0.34 (0.21–0.89) for 3σ and 0.20 (0.12–0.65) for FWHM; Observer 4: 0.49 (0.32–1) for 3σ and 0.07 (0.04–0.28) for FWHM, see Figure 6). However, the 95% CIs for the 3σ and FWHM methods overlapped for all but the fourth observer, and so the statistical significance of the difference was not confirmed.

4. Discussion

Our results suggest that the selection of ROIref contributes most to the LGE extent variability when using both the 3σ and FWHM quantification methods, but we cannot conclusively confirm this because of low statistical significance.
We furthermore compared the results provided by each of these two methods and found that FWHM yielded lower LGE extent values, which we also confirmed based on lower average LGE extent variability; however, again due to low statistical significance it is difficult to conclusively confirm the observation.
Specifically, our results demonstrate that the selection of ROIref3σ presents a significantly greater source of variability than the selection of ROImyoc3σ (Figure 4). This finding may be explained by the fact that the ROIref3σ regions are selected based on the observer’s interpretation, with the only formal requirement being that they be located somewhere within the normal myocardium, which appears dark in the image. The ROImyoc, on the other hand, is defined by the anatomy and thus is less influenced by the observer’s interpretation. Therefore, clinical experts should be especially careful when selecting a reference region when using the 3σ method.
The clinical interpretation of the influence of variability magnitude on diagnostics and treatment is not straightforward. The results of studies examining the relationship between the quantitative value of the LGE extent and adverse events are unclear [2]. However, a study conducted by Ngo et al. [22] reported that a 10% increase in FWHM-evaluated LGE extent corresponds to a 79% increased risk of MACE. In this context, our findings show that the variability of both methods is within a clinically acceptable range. The general expectation in radiology is that variability should not exceed the 10% limit, and ideally, it should be lower than 5%. Considering this interpretation, our results show that the mean value of the 3σ method’s variability exceeds the 5% limit, whereas the mean value of the FWHM method’s variability falls within the predicted limit.
Our observation of the lower LGE extent generated by the FWHM method is consistent with previously published studies conducted on myocarditis patients [6], as well as those conducted on patients with cardiomyopathy (CMP) [10] and myocardial infarction (MI) [10,12]. In addition, one study [6] showed that the lower LGE extent calculated with the FWHM method offers a better prognostic association with lower MACE in myocarditis patients, suggesting that FWHM values may correlate better with realistic myocardial damage, which is crucial for making informed decisions on patient treatment plans and interventions.
Furthermore, our finding that the FWHM method in myocarditis patients yields lower inter- and intraobserver variability is again consistent with the results published in a previous study [6]. However, in our case, the 95% CIs of the 1-ICC value for the 3σ and FWHM methods mostly overlapped. As a result, the statistical significance of the differences observed remains to be elucidated.
We used the reference LGE extent method to determine LGE extent variability, which is an alternative to finding the graphical average of each of the ROIs delineated. A problem arose with the graphical average approach when we tried to determine the graphical average of ROIref and ROIexcl. Because these two ROIs can be delineated anywhere within the LV boundaries, their interpretation is highly dependent on the observer. As a result, we found the determination of their graphical average to be a complicated, if not impossible, task. Therefore, we opted for the approach with varying ROIs across all possible combinations. Good agreement between the summation of LGE extent variability components and the variability obtained directly from experimental results again ensures the relevance of our method using reference LGE.
Commercial software for LGE-CMR image analysis is expensive and often unavailable in clinical practice. Due to the prognostic and diagnostic value of the LGE of LGE-CMR images, widely available open-source tools may be useful not only in research but also in clinical work. In this study, we developed a new quantitative tool for LGE-CMR image analysis. The tool developed allowed our team of specialists to conduct LGE-CMR image analysis without relying on commercial software. It also allowed us to determine the variability of each ROI separately by applying a procedure described in the Methods section, which we believe would not be possible with commercial software.
We are aware that manual delineation of ROIs is a time-consuming process (up to 15 min per slice), which limits the clinical applicability of quantitative CMR. Previously, automated contour detection algorithms that significantly reduce analysis time were developed [8,22,23,24]. While these may help to overcome the subjective variations associated with manual image processing in the future, so far the differences between automatic and manual ROI detection can still be relatively large [23], especially for low-quality images or images affected by significant artifacts [24]. Therefore, artificial intelligence (AI)-based segmentation approaches are still under development and need to be further improved and tested before they can be widely used in clinical practice. In our opinion, this highlights the importance of improving routinely used manual contouring.
Although our results may be robust, we believe that they represent an important step toward improving the efficiency of quantitative CMR analyses and will lead to potentially more accurate clinical assessments of myocarditis. Taking into account that ROIref contributes most to the LGE extent variability when using both the 3σ and FWHM quantification methods, its use may reduce specialists’ time and effort required for the manual delineation of ROI areas, which may result in a more efficient and standardized manual contouring process in the future. In addition, the alignment of FWHM-related lower LGE extent and lower inter- and intraobserver variability with existing research highlights the consistency and potential clinical relevance of this method in the assessment of myocarditis.

5. Limitations and Future Perspectives

Due to the fact that data analysis with our experimental tool takes a considerable amount of time, and because of the volume of daily clinical work, it is difficult to convince a specialist to devote additional time and effort to performing image analysis for research purposes. While we were happy that we managed to obtain annotations from four experienced clinicians, we had to limit the number of images analyzed and perform the LGE quantification on a single preselected SAx slice for each patient, in contrast to larger studies [6,10,11]. The consequences are the low statistical significance of the statistical tests arising from the low number of images analyzed and a lack of insight into the pathology distribution at the whole-heart level.
Unfortunately, the follow-up data for our patients were not available. Therefore, we could not evaluate which quantification method would have provided the best information on the clinical outcome. Further research should determine the precise relationship between LGE extent and adverse events. Doing so would likely improve risk stratification and clinical decision-making.
Our images were all acquired by using the same field strength of 3T, the same imaging sequence, and the same amount of contrast agent per patient (0.1 mmol/kg). Because all these factors can affect the signal-to-noise (SNR) ratio and contrast of the images [9,10,25], future research should be conducted using different field strengths or imaging sequences (e.g., balanced steady-state free precession (bSSFP) [26]).

6. Conclusions

To the best of our knowledge, this is the first study to quantify the contribution of the LGE-CMR image analysis steps to overall variability in patients with myocarditis. LGE is an important indicator of the extent of myocarditis lesions, which can regress over time.
According to the findings of our pilot study, specialists should expect a larger influence of ROIref selection on the variability of LGE extent quantification and an overall lower LGE extent when using the FWHM method. However, further large-scale studies are needed to confirm our findings and reduce the overall variability of the image analysis process. Doing so would likely increase the efficiency of quantitative CMR analyses and lead to a more accurate clinical assessment of myocarditis.

Author Contributions

B.K., A.C.C. and A.G.N. acquired the data; L.K., B.K., A.C.C. and A.G.N. analyzed and interpreted the data; L.K. wrote the programming codes, prepared the first draft and figures, and tabulated the literature information; B.K. supervised the project. All authors have read and agreed to the published version of the manuscript.

Funding

This study was part of a project funded by the Slovenian Research Agency, funding no. P3-0019.

Institutional Review Board Statement

This study was conducted according to the guidelines of the Declaration of Helsinki and approved by the Commission of the Republic of Slovenia for Medical Ethics (No.: 0120-37/2017/4, issued on 27 November 2017).

Informed Consent Statement

Informed consent was obtained from all individual participants included in this study.

Data Availability Statement

The data presented in this study are available on request from the corresponding author. The data are not publicly available due to ongoing research and patent considerations.

Acknowledgments

The authors thank Robert Jeraj for his physical advice on method development. We express gratitude to Ajda Dolinšek and Maša Gergar from University Medical Centre Ljubljana for their contribution to the LGE-CMR image analysis. We also thank Roberta Kralj for her help with figure editing.

Conflicts of Interest

The authors declare no conflict of interest.

References

  1. Caforio, A.L.P.; Pankuweit, S.; Arbustini, E.; Basso, C.; Gimeno-Blanes, J.; Felix, S.B.; Fu, M.; Heliö, T.; Heymans, S.; Jahns, R.; et al. Current State of Knowledge on Aetiology, Diagnosis, Management, and Therapy of Myocarditis: A Position Statement of the European Society of Cardiology Working Group on Myocardial and Pericardial Diseases. Eur. Heart J. 2013, 34, 2636–2648. [Google Scholar] [CrossRef] [PubMed]
  2. Mahrholdt, H.; Greulich, S. Prognosis in Myocarditis: Better Late Than (N)Ever! J. Am. Coll. Cardiol. 2017, 70, 1988–1990. [Google Scholar] [CrossRef] [PubMed]
  3. Imbriaco, M.; Nappi, C.; Puglia, M.; de Giorgi, M.; Dell’Aversana, S.; Cuocolo, R.; Ponsiglione, A.; de Giorgi, I.; Polito, M.V.; Klain, M.; et al. Assessment of Acute Myocarditis by Cardiac Magnetic Resonance Imaging: Comparison of Qualitative and Quantitative Analysis Methods. J. Nucl. Cardiol. 2019, 26, 857–865. [Google Scholar] [CrossRef] [PubMed]
  4. Ammirati, E.; Buono, A.; Moroni, F.; Gigli, L.; Power, J.R.; Ciabatti, M.; Garascia, A.; Adler, E.D.; Pieroni, M. State-of-the-Art of Endomyocardial Biopsy on Acute Myocarditis and Chronic Inflammatory Cardiomyopathy. Curr. Cardiol. Rep. 2022, 24, 597–609. [Google Scholar] [CrossRef]
  5. Urzua Fresno, C.; Sanchez Tijmes, F.; Shaw, K.E.; Huang, F.; Thavendiranathan, P.; Khullar, S.; Seidman, M.A.; Hanneman, K. Cardiac Imaging in Myocarditis: Current Evidence and Future Directions. Can. Assoc. Radiol. J. 2023, 74, 147–159. [Google Scholar] [CrossRef]
  6. Gräni, C.; Eichhorn, C.; Bière, L.; Kaneko, K.; Murthy, V.L.; Agarwal, V.; Aghayev, A.; Steigner, M.; Blankstein, R.; Jerosch-Herold, M.; et al. Comparison of Myocardial Fibrosis Quantification Methods by Cardiovascular Magnetic Resonance Imaging for Risk Stratification of Patients with Suspected Myocarditis. J. Cardiovasc. Magn. Reson. 2019, 21, 14. [Google Scholar] [CrossRef]
  7. Haaf, P.; Garg, P.; Messroghli, D.R.; Broadbent, D.A.; Greenwood, J.P.; Plein, S. Cardiac T1 Mapping and Extracellular Volume (ECV) in Clinical Practice: A Comprehensive Review. J. Cardiovasc. Magn. Reson. 2016, 18, 89. [Google Scholar] [CrossRef]
  8. Van Der Geest, R.J.; Reiber, J.H.C. Quantification in Cardiac MRI. J. Magn. Reson. Imaging 1999, 10, 602–608. [Google Scholar] [CrossRef]
  9. Kellman, P.; Arai, A.E. Cardiac Imaging Techniques for Physicians: Late Enhancement. J. Magn. Reson. Imaging 2012, 36, 529–542. [Google Scholar] [CrossRef]
  10. Flett, A.S.; Hasleton, J.; Cook, C.; Hausenloy, D.; Quarta, G.; Ariti, C.; Muthurangu, V.; Moon, J.C. Evaluation of Techniques for the Quantification of Myocardial Scar of Differing Etiology Using Cardiac Magnetic Resonance. JACC Cardiovasc. Imaging 2011, 4, 150–156. [Google Scholar] [CrossRef]
  11. McAlindon, E.; Pufulete, M.; Lawton, C.; Angelini, G.D.; Bucciarelli-Ducci, C. Quantification of Infarct Size and Myocardium at Risk: Evaluation of Different Techniques and Its Implications. Eur. Heart J. Cardiovasc. Imaging 2015, 16, 738–746. [Google Scholar] [CrossRef] [PubMed]
  12. Flett, A.S.; Hasleton, J.M.; Quarta, G.; Hausenloy, D.; Muthurangu, V.; Moon, J.C. The Full Width Half Maximum Technique Is Superior for LGE Quantification Regardless of Its Aetiology. J. Cardiovasc. Magn. Reson. 2010, 12, O41. [Google Scholar] [CrossRef]
  13. Kellman, P.; Arai, A.E.; McVeigh, E.R.; Aletras, A.H. Phase-Sensitive Inversion Recovery for Detecting Myocardial Infarction Using Gadolinium-Delayed Hyperenhancement. Magn. Reson. Med. 2002, 47, 372–383. [Google Scholar] [CrossRef] [PubMed]
  14. Fedorov, A.; Beichel, R.; Kalpathy-Cramer, J.; Finet, J.; Fillion-Robin, J.C.; Pujol, S.; Bauer, C.; Jennings, D.; Fennessy, F.; Sonka, M.; et al. 3D Slicer as an Image Computing Platform for the Quantitative Imaging Network. Magn. Reson. Imaging 2012, 30, 1323–1341. [Google Scholar] [CrossRef] [PubMed]
  15. Ku, H.H. Notes on the Use of Propagation of Error Formulas. J. Res. Natl. Bur. Stand. Sect. C Eng. Instrum. 1966, 70, 263. [Google Scholar] [CrossRef]
  16. Koo, T.K.; Li, M.Y. A Guideline of Selecting and Reporting Intraclass Correlation Coefficients for Reliability Research. J. Chiropr. Med. 2016, 15, 155–163. [Google Scholar] [CrossRef] [PubMed]
  17. Liljequist, D.; Elfving, B.; Roaldsen, K.S. Intraclass Correlation—A Discussion and Demonstration of Basic Features. PLoS ONE 2019, 14, e0219854. [Google Scholar] [CrossRef]
  18. Giuseppe Via San Lorenzo, P. StaTips Part IV: Selection, Interpretation and Reporting of the Intraclass Correlation Coefficient. South Eur. J. Orthod. Dentofac. Res. 2018, 5, 3–5. [Google Scholar] [CrossRef]
  19. Bonett, D.G. Sample Size Requirements for Estimating Intraclass Correlations with Desired Precision. Stat. Med. 2002, 21, 1331–1335. [Google Scholar] [CrossRef]
  20. Ghasemi, A.; Zahediasl, S. Normality Tests for Statistical Analysis: A Guide for Non-Statisticians. Int. J. Endocrinol. Metab. 2012, 10, 486–489. [Google Scholar] [CrossRef]
  21. Xu, M.; Fralick, D.; Zheng, J.Z.; Wang, B.; Tu, X.M.; Feng, C. The Differences and Similarities between Two-Sample t-Test and Paired t-Test. Shanghai Arch. Psychiatry 2017, 29, 184–188. [Google Scholar] [CrossRef] [PubMed]
  22. Ngo, T.A.; Lu, Z.; Carneiro, G. Combining Deep Learning and Level Set for the Automated Segmentation of the Left Ventricle of the Heart from Cardiac Cine Magnetic Resonance. Med. Image Anal. 2017, 35, 159–171. [Google Scholar] [CrossRef] [PubMed]
  23. Alabed, S.; Alandejani, F.; Dwivedi, K.; Karunasaagarar, K.; Sharkey, M.; Garg, P.; de Koning, P.J.H.; Tóth, A.; Shahin, Y.; Johns, C.; et al. Validation of Artificial Intelligence Cardiac MRI Measurements: Relationship to Heart Catheterization and Mortality Prediction. Radiology 2022, 305, 68–79. [Google Scholar] [CrossRef] [PubMed]
  24. Chen, C.; Qin, C.; Qiu, H.; Tarroni, G.; Duan, J.; Bai, W.; Rueckert, D. Deep Learning for Cardiac Image Segmentation: A Review. Front. Cardiovasc. Med. 2020, 7, 25. [Google Scholar] [CrossRef]
  25. Gossuin, Y.; Aline, H.; Gillis, P.; Vuong Quoc, L.; Yves, G.; Pierre, G.; Quoc Lam, V. Physics of Magnetic Resonance Imaging: From Spin to Pixel Physics of Magnetic Resonance Imaging: From Spin to Pixel Physics of Magnetic Resonance Imaging: From Spin to Pixel. J. Phys. D Appl. Phys. 2010, 43, 213001. [Google Scholar] [CrossRef]
  26. Ridgway, J.P. Cardiovascular Magnetic Resonance Physics for Clinicians: Part I. J. Cardiovasc. Magn. Reson. 2010, 12, 71. [Google Scholar] [CrossRef]
Figure 1. The left ventricle (LV) model and the orientation of short-axis late gadolinium enhancement (LGE) cardiac magnetic resonance (CMR) images (slices).
Applsci 14 00117 g001
Figure 2. Clinical specialists manually segmented the LGE-CMR images into regions of interest (ROIs): myocardial region, or ROImyoc; reference region, or ROIref; and pathology-free region, or ROIexcl. ROIs were then used in the pathology extent calculation with the 3σ method (left) (pathology threshold set to three standard deviations (σ) in reference), and with the full width at half maximum (FWHM) method (right) (pathology threshold set to 50% of maximum signal in reference). The selection of ROImyoc is independent of the mathematical quantification method used; that is, ROImyoc3σ = ROImyocFWHM = ROImyoc.
Applsci 14 00117 g002
Figure 3. Workflow diagram illustrating the image processing procedure where the ROI matrices used for the pathology calculations were obtained by multiplying the binary mask by the original grayscale image. An illustrative example of ROImyoc is provided. Abbreviations as in Figure 1 and Figure 2.
Applsci 14 00117 g003
Figure 4. LGE extent variability of each ROI with corresponding standard errors for the 3σ (blue) and FWHM (red) quantification methods. We evaluated the statistical significance of the differences between the 3σ and FWHM methods (marked with an asterisk), and the statistical significance of the differences within the same method (marked with a cross). Abbreviations as in Figure 1 and Figure 2.
Applsci 14 00117 g004
Figure 5. LGE extents with corresponding standard errors as obtained with the 3σ (blue) and FWHM (red) quantification methods. Statistically significant differences are marked with an asterisk. Abbreviations as in Figure 1 and Figure 2.
Applsci 14 00117 g005
Figure 6. Intraobserver variability (calculated as a 1-intraclass correlation coefficient (ICC)), with corresponding 95% confidence intervals, for the 3σ (blue) and FWHM (red) quantification methods. Statistically significant differences are marked with an asterisk. Abbreviations as in Figure 1 and Figure 2.
Applsci 14 00117 g006
Table 1. Characteristics of the study population.
Sample (n = 5)
Male/female5/0
Age (mean ± standard error) (y)30 ± 5
BMI (mean ± standard error) (kg/m2)29 ± 2
Mean LGE extent (mean ± standard error) (%)24 ± 5
Maximum troponin (mean ± standard error) (ng/L)18,564 ± 5000
Disclaimer/Publisher’s Note: The statements, opinions and data contained in all publications are solely those of the individual author(s) and contributor(s) and not of MDPI and/or the editor(s). MDPI and/or the editor(s) disclaim responsibility for any injury to people or property resulting from any ideas, methods, instructions or products referred to in the content.

