Review

Design and Application of Bionic Camouflage Materials Simulating Spectral Reflection Characteristics of Plants: A Review

by
Yanping Lin
1,2,*,
Luquan Ren
1,
Xiaodong Yang
2 and
Hengyi Yuan
2
1
Key Laboratory of Bionic Engineering, Ministry of Education, Jilin University, Changchun 130022, China
2
Institute for Interdisciplinary Biomass Functional Materials Studies, Jilin Engineering Normal University, Changchun 130052, China
*
Author to whom correspondence should be addressed.
Appl. Sci. 2024, 14(11), 4404; https://doi.org/10.3390/app14114404
Submission received: 15 April 2024 / Revised: 11 May 2024 / Accepted: 20 May 2024 / Published: 22 May 2024
(This article belongs to the Section Materials Science and Engineering)

Abstract

:
Hyperspectral remote sensing (RS) has rapidly developed in recent years and has been widely used in the military field. This technology not only brings huge opportunities for military reconnaissance but also poses unprecedented challenges to military camouflage, severely complicating the development of plant hyperspectral camouflage materials and technology. In this review, the spectral reflectance characteristics of plants and the application of hyperspectral RS in plant RS and military operations are reviewed. The development status of bionic camouflage materials that simulate the spectral reflection characteristics of plants is analyzed. With the existing hyperspectral camouflage materials and technology, bionic camouflage technology is limited by the inability of bionic materials to accurately imitate the characteristic absorption peaks of green vegetation, low stability and durability, and the large overall material thickness, which complicate actual large-scale application. On this basis, a future development direction and a trend of plant hyperspectral bionic camouflage materials and technology are proposed.

1. Introduction

The acquisition and counter-acquisition of military information have become the focus of modern warfare. Stealth camouflage technology can effectively improve the penetration and survivability of soldiers, weapons, and equipment and is one important support in wars nowadays. This technology has high military value and is a high-tech technique studied by military powers worldwide.
Camouflage refers to the use of various measures and techniques to conceal oneself and confuse the enemy in order to improve the battlefield survivability of military targets and to maximize their combat effectiveness. Its rationale is to reduce the difference in scattering or radiation characteristics between the target and the background in visible light, infrared, microwave, and other bands, thereby reducing the probability of being detected by enemy detection systems [1]. Currently, the main measures of camouflage technology include camouflage painting technology, natural camouflage technology, smoke camouflage technology, artificial barrier camouflage technology, and false target camouflage technology.
The detection principles and methods in military reconnaissance and detection technology vary depending on the spectrum involved in the threat and include radar reconnaissance, laser reconnaissance, infrared reconnaissance, optical reconnaissance, and acoustic reconnaissance. Of them, optical reconnaissance is a detection method that poses a greater threat to ground military targets. In particular, hyperspectral remote sensing (RS) technology can extract camouflaged stealth targets from complex backgrounds [2]. Then it analyzes the spectral differences between the camouflage stealth materials and the background (natural vegetation), clarifies the spectral performance and generation mechanism of such difference, and monitors these characteristic bands purposefully [3,4,5,6]. Thereby, it distinguishes the real camouflaged target in the green vegetation background after camouflage and stealth and detects and identifies the current camouflage stealth target, which poses a serious threat to ground military targets [7,8,9]. The process of obtaining hyperspectral data images of vegetation targets is shown in Figure 1. While imaging vegetation targets, the hyperspectral sensor records data from hundreds of spectral bands to obtain a hyperspectral data cube containing two-dimensional spatial information and one-dimensional spectral information. The data cube is composed of images from different spectral bands stacked in wavelength order. Extracting spectral information for each pixel in the data cube and comparing it with typical vegetation spectra in the spectral database can confirm the vegetation target type.
Natural vegetation composed of plants is one of the typical ground background environments for camouflaged targets and has become the focus of hyperspectral detection. The tissue structure and material composition of plants are inevitably related to their spectral reflection characteristics. The design and preparation of plant-imitating camouflage materials cannot copy the material composition and structure of plants. Structural design and material preparation must be carried out with reference to the main factors that affect the reflection spectra of leaves. Therefore, to achieve hyperspectral camouflage in the context of plants, researchers must develop bionic camouflage materials that can imitate the spectral reflection characteristics of plants, so as to resist hyperspectral detection in the context of plants [10,11].
At present, some scholars have been studying camouflage materials that imitate the spectral reflection characteristics of plants and applying them in military applications. These technologies are actually the intersection and combination of bionic technology with science and technology, such as chemistry and materials [11,12,13,14,15,16,17]. In this review, the spectral reflection characteristics of plants and the application of hyperspectral RS in plant RS and military operations are summarized, and the development status of bionic camouflage materials that simulate the spectral reflection characteristics of plants is analyzed. Moreover, the problems and future development prospects of bionic camouflage materials that imitate the hyperspectral reflection characteristics of plants are discussed. The progress and direction of research identified in this issue address the following areas:
  • The main factors affecting the spectral reflectance characteristics of plant leaves include pigment-visible light, structure-near infrared, and moisture-mid infrared, as well as leaf age, fertilizer (nutrient) depletion, and diseases. The PROSPECT model is a classic model that describes the radiation process of plant leaves in the solar spectral band and is widely used in the field of RS detection;
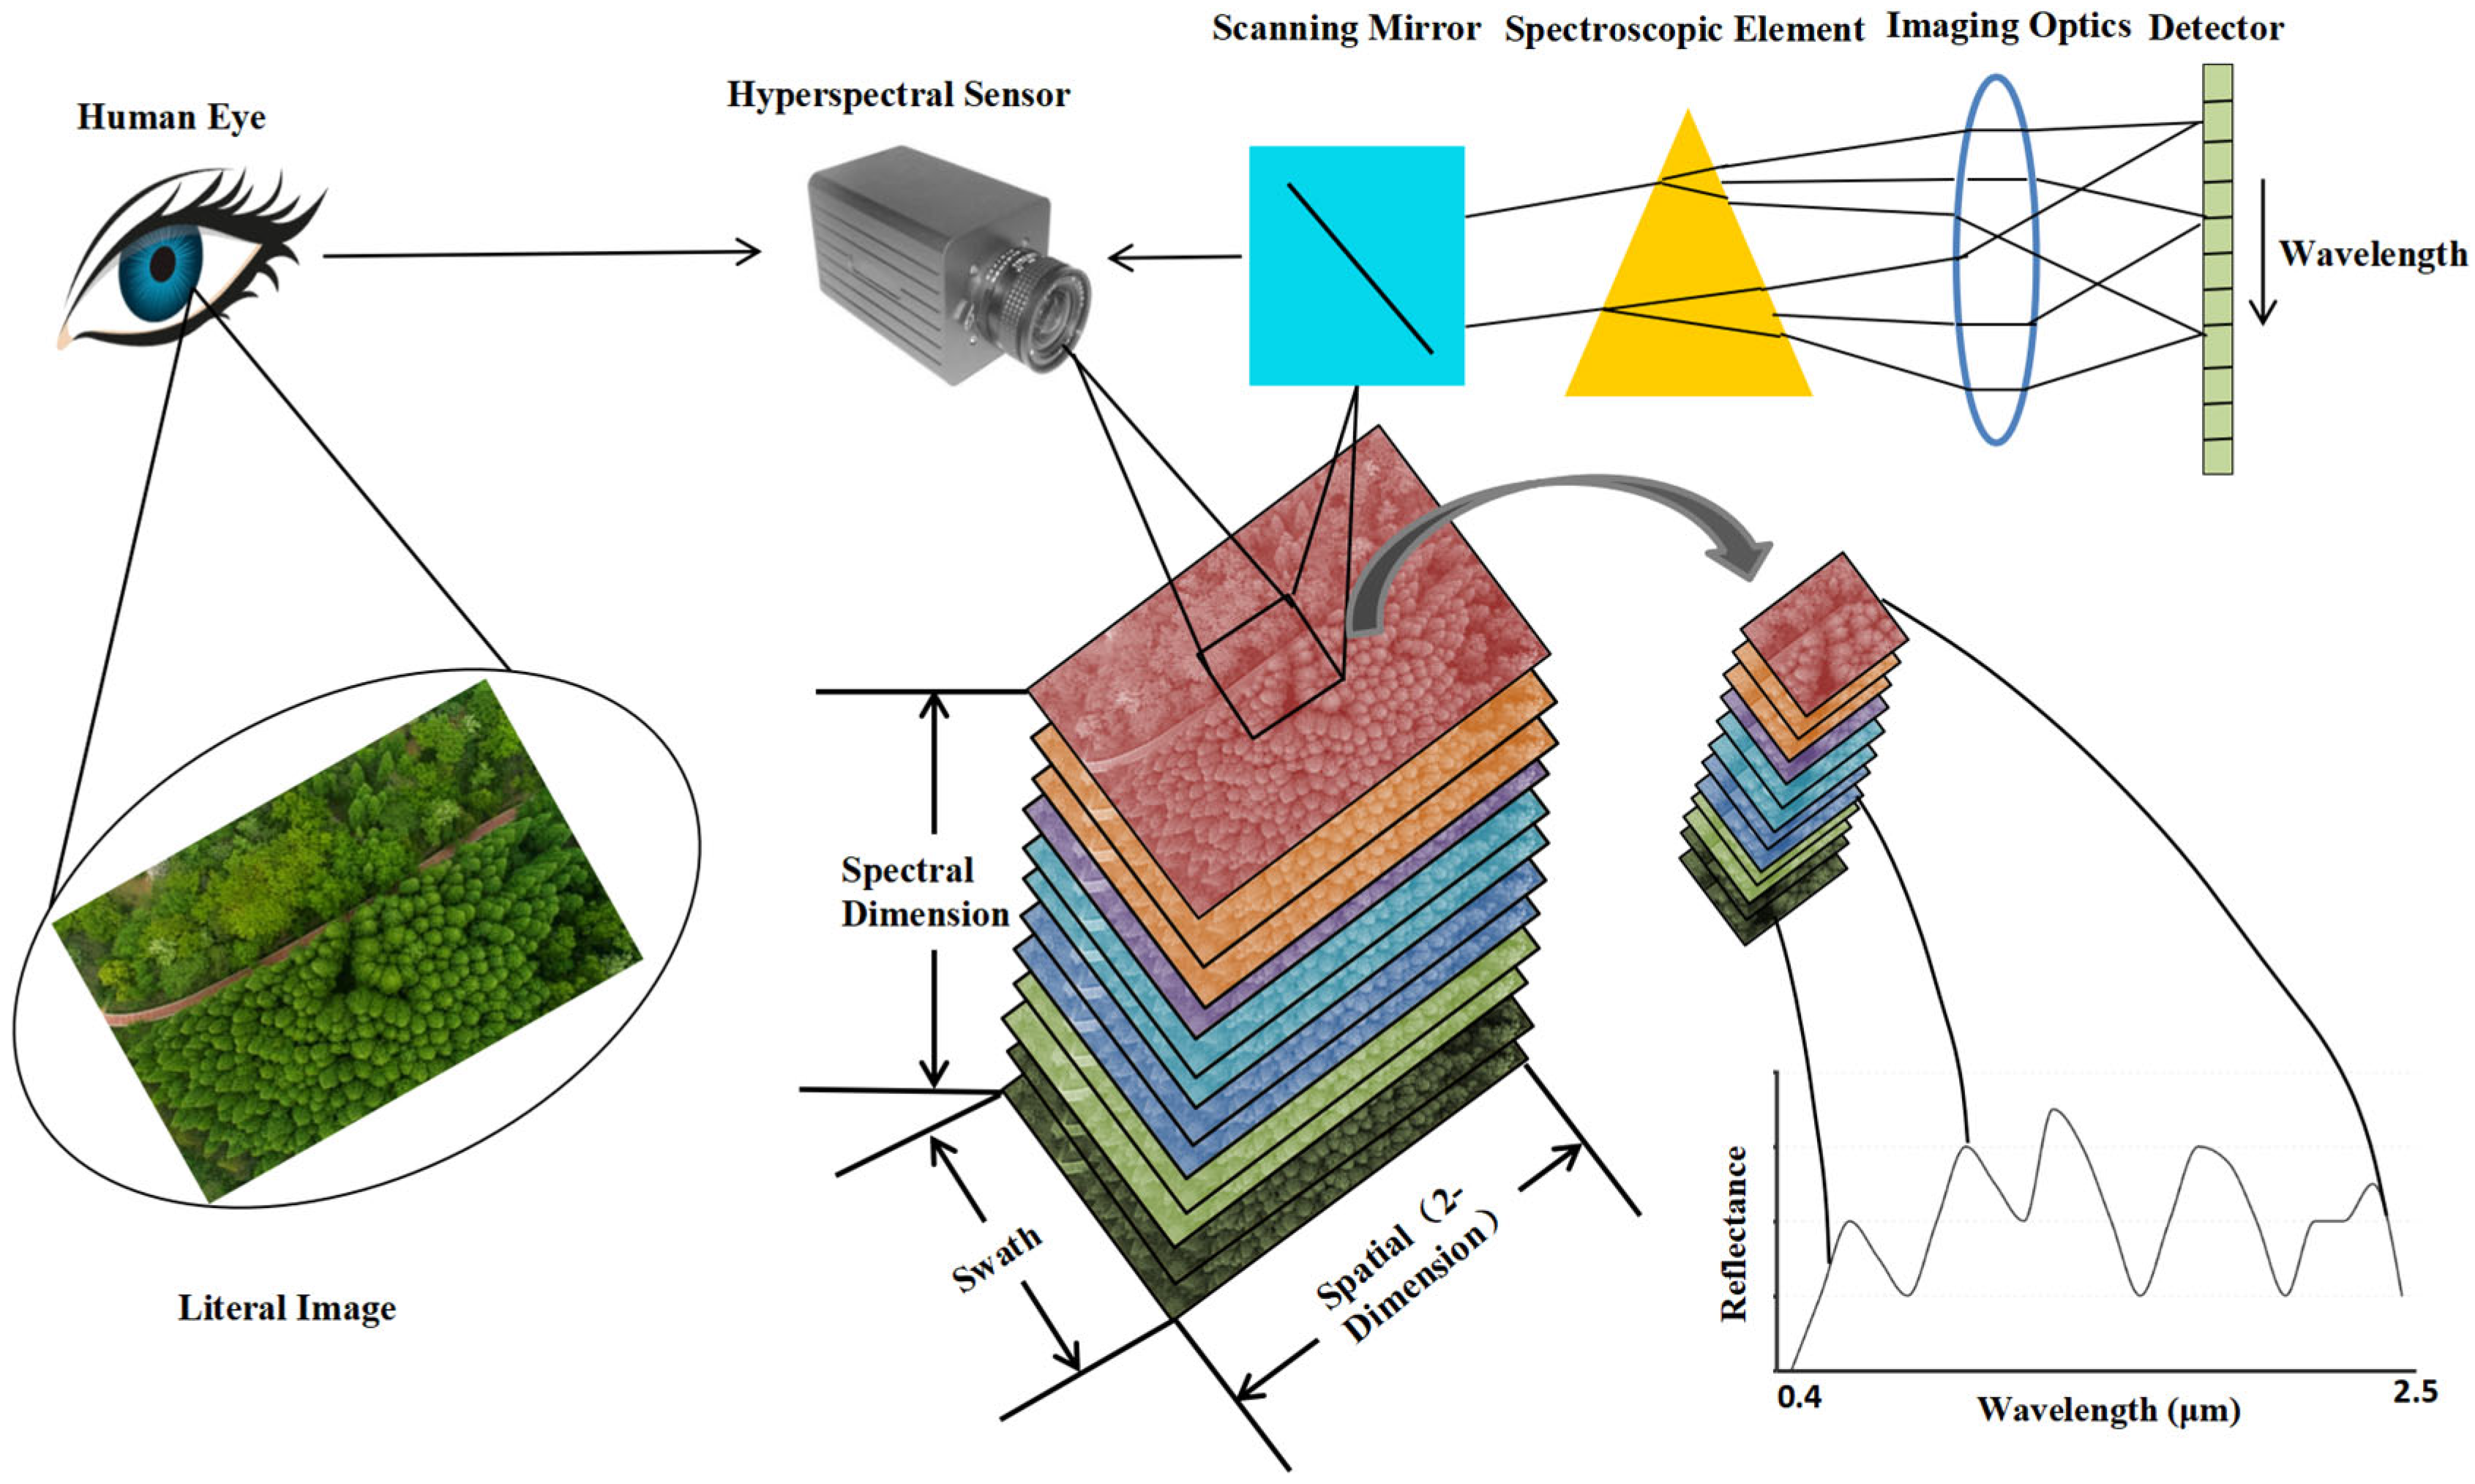
  • Hyperspectral RS technology is widely used in fields such as vegetation monitoring [18], plant functional trait mapping [19], biodiversity estimation [20,21], and pest and disease control. Meanwhile, due to the strong ability of hyperspectral RS images to identify camouflage, they can distinguish real targets from decoy targets against the background of green vegetation and quickly detect small tactical targets against a desert background. The current military applications of hyperspectral RS mainly cover three aspects: detailed battlefield reconnaissance, identification of camouflaged targets, and detection and calculation of the target’s true temperature and emissivity;
  • Plant-mimicking camouflage materials mainly include bionic camouflage materials that can only imitate the color of vegetation and cannot resist hyperspectral RS detection, bionic camouflage materials based on inorganic pigments that can achieve “same color” but do not have the ability to completely achieve “same spectrum” with green vegetation; bionic materials with hyperspectral similarity containing chlorophyl; bionic materials with hyperspectral similarity of leaves at different growth stages, seasons, and species; and bionic materials with solar spectrum reflection characteristics and low infrared emissivity similar to natural leaves.

2. Main Factors Affecting Spectral Reflection Characteristics of Leaves

Plant leaves are the places where visible light is absorbed and photosynthesis occurs. When radiation is projected onto the blade surface, a part of it is diffusely reflected by the interface, while the remaining part enters the blade. The interior of leaves is a cell stack structure, and radiation entering leaves will be reflected and refracted within this structure [22]. The optical properties of plants mainly depend on the pigments, dry matter, and water in leaves, which will absorb incident radiation [23]. When radiation is transmitted to the abaxial surface, a part of it will be transmitted out of the blade, and the remaining part will be reflected into the blade again, where refraction and absorption occur. According to the law of energy conservation, the sum of reflected, absorbed, and transmitted energy is equal to the incident radiation energy. A spectrophotometer can be used to test the solar spectral reflectance and transmittance of leaves. Figure 2 shows the solar reflectance and transmittance of leaves [24]. Clearly, the transmittance and reflection curves of leaves both are characteristic of green peaks (550 nm), red edges (680–720 nm), near-infrared plateaus (800–1300 nm), and water absorption valleys (1450–1940 nm). The green reflection near 550 nm is associated with chlorophyll. Chlorophyll can be divided into chlorophyll a, which mainly absorbs red-orange light, and chlorophyll b, which mainly absorbs blue-violet light. Chlorophyll absorbs less green light, so the solar spectrum reflection curve of leaves is characteristic of a green reflection peak [25]. The red edge is located near 700 nm. In this band, the absorption of incident radiation by chlorophyll gradually weakens, while the scattering characteristics of the cell stack structure slowly increase, so the reflectivity of leaves rises significantly [26]. The near-infrared plateau is also associated with the stacking structure of cells in leaves. The collimated incident radiation changes into almost isotropically uniform diffuse light through scattering in leaves, forming a highly reflective area. The water absorption valley located near 1450 and 1940 nm is related to the characteristic absorption of incident radiation by water in leaves [27]. The reflection peak of the green band near 550 nm, the red edge between 680 and 750 nm, the near-infrared plateau between 800 and 1300 nm, and the moisture absorption band after 1300 nm are common on the reflection spectra of all healthy green vegetation. As the reflectance spectral curves of different angiosperm leaves exhibit consistent shapes, peak positions, and key turning points, the vegetation reflectance spectra formed by combining the reflectance spectra of various plants are also very similar. However, because the spectral reflectance values of various plant leaves vary, there are differences in spectral reflectance among different environments, regions, seasons, and types of vegetation. Though the growth and development of vegetation, type of vegetation, irrigation, fertilization, climate, soil, topography, and other factors affect the spectral characteristics of vegetation, they are also expressed through the influence of three internal factors: pigments, structure, and moisture.

2.1. Pigments—Visible Light

In the visible band (400–700 nm), the reflectance (measuring less than 15%) and transmittance of leaves are both very low. The main part of the solar radiation on leaves is absorbed by pigments (e.g., chlorophyll, cyanophyll, carotenoid, erythrophyll, and lutein), which have reflection peaks at different wavelengths. The pigments in healthy green leaves are mainly the chlorophyll in chloroplasts [28]. Chlorophyll has an extremely high absorption rate for ultraviolet and purple light, and it strongly absorbs blue and red light. It partially absorbs and reflects green light. Therefore, the reflection spectral curves of various green plants in the visible light band are at very low levels, and all show a weak characteristic peak around 550 nm (green light), with relative intensity of only 5% to 10%.

2.2. Structure—Near-Infrared

In the near-infrared spectrum (700–1300 nm), the epidermis of leaves generally does not contain any pigments. The epidermis and cell wall cellulose are transparent, so the leaf absorption is less than 10%. The radiation incident on the leaves is either reflected or transmitted [29]. When natural light shines on leaves, it is reflected, absorbed, and transmitted successively in the upper epidermal tissues, mesophyll tissues, and lower epidermal tissues. The cell structural differences among different tissues lead to their different responses to incident light. The reflectance reaches about 50% of the infrared region, which is mainly determined by the profile of the leaf structure. For bifacial leaves, 5% to 20% of the volume of tightly arranged palisade tissues and 50% to 90% of the volume of loosely arranged spongy tissues are occupied by air, and the numbers of wall–air interfaces also differ between these two types of tissues. The light incident on mesophyll tissues will be strongly scattered under the action of multiple air–wall interfaces, and this effect of sponge tissues is stronger than that of palisade tissues. In this way, the light will be scattered more times before reaching the lower epidermis of the leaf, which helps plants absorb light. Thus, under the action of multiple scattering mechanisms, the near-infrared plateau characteristics on the reflection spectra of bifacial leaves and isofacial leaves of angiosperms with different mesophyll structural characteristics are quite different. Due to the aforementioned reasons, the mesophyll tissues of leaves strongly reflect near-infrared light at 800–1300 nm, and they thus form a relatively gentle plateau on the spectrum curve, with reflectance of 40–60% and an absorption rate less than 15%. The interface formed by the air between cells and the wet cell wall is the main reason why the reflection spectrum of leaves shows the above characteristics [30].

2.3. Moisture—Mid-Infrared

The characteristic absorption bands of water molecules all appear in the infrared spectrum. The vibration bands of water are located at a base frequency of 2.66, 2.73, and 6.27 μm (strong absorption); doubling frequency of 1.4 and 1.9 μm (sharp band and strong absorption); and combined frequency of 0.96 and 1.1 μm (weak absorption) [31]. Since leaves contain water, five absorption bands of water appear on the plant reflection spectrum at 970, 1190, 1440, 1920, and 2660 nm in the near-infrared region. Among these bands, the reflectivity of leaves is the lowest. The absorption of water in leaves plays an important role in the optical properties of leaves. The increase or decrease in water content directly affects the enhancement or weakening of water absorption intensity. The reflectance of leaves changes with the water content of leaves.

2.4. Other Influencing Factors

Leaf age influences reflectance. Changes in the optical properties of leaves happen primarily during the young and mature senescence stages of plants. Annual plants or deciduous leaves maintain constant optical properties most of the time, which is a temporal function of chloroplast content [32]. In the near-infrared band, the reflectance changes only when the leaves wilt and the internal structure changes. In the mid-infrared band, leaf reflectivity increases as the leaves die. Notably, when the leaves are yellow, the reduction in water content is relatively delayed.
Fertilizer (nutrient) depletion affects reflectance. Lack of nutrients mainly affects the chlorophyll content and the cross-sectional structure of leaves, so reflectance is obviously related to the nutrients of crops. Chlorosis and nitrogen deficiency are common. Chlorosis mainly affects leaf reflectance in the visible spectrum, and nitrogen deficiency changes the entire reflectance spectrum. The visible light reflectance increases (due to the reduced chlorophyll content), and the near-mid-infrared reflectance decreases (due to the decreased number of cell layers) [33].
Diseases affect the reflectance of leaves. When leaves are infected with plant diseases, their structures or biochemical compositions change, which will cause corresponding variations in the spectral characteristics of leaves [34]. Generally, four situations will occur. First, the pigment contents (yellow pigment) of leaves will change, which only affect the optical properties of leaves in the visible spectrum. Second, leaf necrosis will occur, and the reflectance of the necrotic part is comparable to that of aging leaves. Third, the leaves will produce additional pigments, which will increase or decrease the reflectivity of leaves in different parts of the spectrum. Fourth, because the transpiration rate of leaves only changes the radiation temperature of leaves, rather than the optical properties of leaves, diseases of leaves can be detected in the infrared band.
Based on the influencing factors of the spectral reflection characteristics of leaves and the law of refraction, Knipling pointed out that the significant symmetry of the solar spectrum transmission and the reflection curve of leaves are caused by the scattering of incident radiation by the cell stacking structure [29]. Merzlyak et al. conducted experimental studies on the transmission and reflection characteristics of leaves and analyzed the impact of scattering on visible light absorption [35]. It was found the scattering in leaves increased the optical path of light in leaves and accelerated visible light absorption. Notably, Huang et al. pointed out the rough structure of the leaf surface can turn parallel light into diffuse light, promoting light absorption within the leaf [36]. Thus, when studying the transflective characteristics of leaves, it is necessary to consider the effects of surface roughness and internal scattering on the transflective characteristics at the same time. To study the relationship between leaf structure or components and visible light absorption, researchers built leaf transmission and reflection models to quantitatively analyze the reflection, absorption, and transmission of solar light in leaves. The classic PROSPECT model describes solar radiation in leaves and is widely used in the field of remote sensing (RS) [37,38,39,40]. The core idea of this model is comparing the cell stack structure to a flat plate structure in form. The absorption in flat plates simulates the absorption in leaves, and the reflection between flat plates simulates the scattering of incident radiation by the cell stack structure. The important input parameters of the PROSPECT model include the absorption coefficient and content of each substance, structural parameters, and surface incident angle. The structural parameter is the number of flat plate structure layers and is used to describe the scattering intensity within the blade. A larger structural parameter indicates a stronger scattering process within the blade. When parallel light is projected on the rough surface of leaves, it will become diffuse light. The surface incident angle measures the roughness of leaf surface. Based on the knowledge about the mechanism of solar light transmission and reflection in leaves, researchers have prepared various bionic materials to simulate the solar reflection characteristics of leaves and to resist hyperspectral detection in the plant background, which will be introduced separately later.

3. Application of Hyperspectral RS into Plant RS and Military Actions

With the advancements of optics, microelectronics, and image processing technology in the past two decades, hyperspectral imaging technology has been significantly improved and can provide details about the Earth’s vegetation and battlefield space. In theory, hyperspectral reconnaissance can identify all artificial camouflage. This is because artificial camouflage materials cannot completely match with the spectral characteristics of the environmental background (e.g., vegetation) in all the hundreds of detectable subtle wavelengths [41]. Hyperspectral imaging is one of the major technological breakthroughs made by humans in the field of earth observation in the last two decades of the twentieth century. It is also the frontier technology of RS today and will be so in the next few decades [42].

3.1. Research Advances of Plant Hyperspectral RS Technology

Due to the influence of electromagnetic waves, molecules, atoms, and electrons undergo diverse and complex transformations (e.g., oscillation, rotation, and transition) to varying degrees. Consequently, spectral reflection information forms absorption and reflection characteristics in specific wavelength bands that map to the morphological and structural characteristics and material components of plants [43]. The main influencing factors of vegetation spectral characteristics are pigment composition and content, cell structure, and water content. Hyperspectral RS can detect and extract plant functional traits (e.g., leaf biochemical characteristics and canopy structure characteristics) at large spatial scales and can even be used to identify different tree species and estimate some gene-level characteristics. At present, hyperspectral RS is widely used in fields such as vegetation monitoring, plant functional trait mapping, biodiversity estimation, and pest and disease control.
In the 1960s and 1970s, researchers from the United States Department of Agriculture collected and analyzed spectral data from various leaves and their crushed materials, obtaining a total of 42 spectral characteristic bands corresponding to their physiological, physical, and chemical parameters in the entire wavelength range. Such research lays the foundation for identifying, monitoring, and estimating plant physiological and chemical parameters based on RS. Pinter et al. found the band at 700 nm is characteristic for plant chlorophyll identification [44]. Curran and Steven analyzed the feasibility and necessity of estimating chemical components of leaves based on hyperspectral RS [45]. Since then, research on using hyperspectral reflectance information to estimate plant physiological and physical parameters has been favored by researchers from various countries. Everitt et al. found the wavelengths at 550 and 675 nm can accurately estimate the nitrogen content of pimiento leaves [46]. Curran et al. found, compared with the original spectrum, using the derivative transformation (first-order and second-order derivatives) of the spectral reflectance of leaves can significantly improve the estimation accuracy of plant physiological and physiochemical parameters, and the transformation of spectral derivatives can effectively eliminate environmental effects, such as background and noise [47]. Jago et al. reported that the trilateral parameters extracted based on the first derivative transformation of the spectrum can more accurately estimate plant chlorophyll concentration, and, of note, the use of the red-edge position to estimate chlorophyll concentration was the most accurate [48]. Mcfeeters further proposed the calculation concept of the normalized difference water index (NDWI) on the basis of plant moisture content [49]. Casanova et al. used two-band vegetation indices (PVI, RVI, WDVI, and NDVI) to invert and estimate rice biomass, and the inversion accuracy reached 0.97 [50]. Mistele and Schmidhalter showed that nitrogen accumulation in corn plants can be accurately estimated by calculating the spectral reflectance ratio R780/R740 [51]. Tang et al. compared the performances of a soybean chlorophyll content inversion model based on the partial least squares algorithm and the back-propagation (BP) neural network algorithm and found that the BP neural network algorithm can more accurately estimate the soybean chlorophyll content [52].
Recently, the use of hyperspectral data for identifying and classifying tree species has become a research hotspot. Dalponte et al. used hyperspectral data to classify northern forest tree species and used three classifiers (e.g., support vector machine, random forest, and maximum likelihood method) to classify tree species, proving that hyperspectral data are very effective in classifying the forest types of northern forest tree species [53]. Kozoderov and Dmitriev used different classifiers to identify tree species in hyperspectral images and found nonlinear classifiers were more suitable for hyperspectral data classification [54]. Schull et al. used AVIRIS (Airborne Visible InfraRed Imaging Spectrometer) RS images to identify tree species using characteristic factors related to spectral information and crown structure and found these factors can improve the accuracy of tree species classification [55]. Ballanti et al. used comparative classification methods based on hyperspectral images to study support vector machine and random forest classifiers in complex heterogeneous forests in Muir Woods National Monument and Saklikent Canyon in Marin County, California and showed the overall accuracy of all classifications was above 90% [56]. Vangi et al. used new hyperspectral satellite images for identifying forest tree species and found hyperspectral sensors can better distinguish all forest types and improve performance when the complexity of the naming system also increased [57]. Modzelewska et al. studied the performance of multi-temporal hyperspectral datasets for classifying some forest tree species and found the classification results in early summer had the highest accuracy. Compared with a single collection of images, the implementation of multi-temporal hyperspectral data can improve the classification results [58].
Currently, hyperspectral RS has been widely used in multi-level plant diversity research, such as large-scale habitat mapping, plant function, and phylogenetic diversity inversion [59]. According to different diversity measurement requirements, hyperspectral RS-based diversity inversion methods can be divided into direct estimation based on spectral characteristics and indirect estimation based on quantitative inversion. The former mainly achieves diversity estimation by establishing a direct relationship between spectral heterogeneity and biological diversity and has been applied to diversity estimation of species, functional traits, and phylogeny [60]. The latter mainly quantitatively extracts plant traits or vegetation parameters through fine spectral features of hyperspectral data and further correlates them with biodiversity indicators. For example, quantitative inversion of specific canopy traits combined with corresponding diversity indicators can be used to estimate functional diversity [61], and species distribution patterns can be indirectly expressed through habitat mapping [62].
The continuous and rich spectral information of hyperspectral images not only more accurately reflects the subtle differences in the reflection properties of surface materials, but it also exhibits a strong correlation between bands and contains abundant redundant information, which can characterize the plants that are sensitive to disease and insect pest stress. Jiang et al. used hyperspectral imaging data and found that modeling combining the sequential projection algorithm (SPA) and random forest (RF) can improve the accuracy in estimating the severity of mangrove pests and diseases [63]. Zhang et al. proposed a pine caterpillar pest classification framework based on the spectral space of UAV hyperspectral images, which can effectively assess the losses caused by pine caterpillar pests [64]. Ma et al. studied Yunnan pine forests infected with insect pests; extracted the vegetation index and continuous wavelet characteristics; and combined discriminant analysis, support vector machine, and backpropagation neural network modeling to monitor the pests in the Yunnan pine forests [65]. Zhang et al. implemented automatic detection of winter wheat yellow rust in hyperspectral images based on high spatial resolution UAV hyperspectral images [66]. Xi et al. used hyperspectral data to monitor stress on deciduous coniferous forests and effectively detected larch looper insect damage in the early stages of coniferous forests [67]. Liu et al. obtained the spectral bands and first spectral derivatives of beetle-infected pine trees from hyperspectral images and completed a quantitative discriminant analysis of pine beetle damage [68]. Gao et al. extracted three features (e.g., original spectrum, reflectance derivative, and vegetation index) of insect-infected pine trees in drone hyperspectral images and used a convolutional neural network to construct a recognition system that can distinguish healthy, infected, or dead pine trees [69].

3.2. Military Application of Hyperspectral RS

Because of unique advantages, hyperspectral RS target detection has received extensive attention and research in the military field [1,70,71,72,73]. The U.S. Naval Research Laboratory (NRL) hosted the development of the Hyperspectral Digital Image Collection Experimental Instrument (HYDICE) in 1991. This airborne push-type hyperspectral instrument with a spectral coverage range of 0.4–2.5 μm can collect data from 210 bands at the spectral resolution of 10 nm. In 2005, with the support of the U.S. Department of Defense, HYDICE was used in the Forest Radiance I experiment and Desert Radiance II experiment. Late-stage data analysis showed hyperspectral RS images with strong ability to identify camouflage can distinguish real targets from decoy targets against the background of green vegetation and quickly detect small tactical targets against the desert background. The current military applications of hyperspectral RS mainly cover three aspects: detailed battlefield reconnaissance, identification of camouflaged targets, and detection and calculation of the target’s true temperature and emissivity:
  • Detailed battlefield reconnaissance
Hyperspectral RS instruments can detect targets simultaneously in continuous working bands and can directly reflect the fine spectral characteristics of the measured object. They can distinguish the composition and state of the target surface. The precise correspondence between space detection information and actual targets on the ground can be obtained. Israeli scientists used a CASI hyperspectral imaging spectrometer to study Tel Aviv, selecting typical features from CASI images as end-member data, and achieved good results on rivers, sand, road surfaces, vegetation, and other features [74]. The hyperspectral imager designed by the U.S. Navy can provide spectral data in 210 bands at 0.4–2.5 μm and can obtain the dynamic characteristics of offshore environmental targets (e.g., seawater transparency, ocean depth, ocean currents, seafloor features, underwater dangerous objects, and oil leaks) to provide reference for naval offshore operations. The United States has proposed digital earth research, aiming to establish a database of the global surface at the square meter level, and they involved various parameters, including target and background characteristic spectra. After the database is established, military targets anywhere in the world will be monitored and susceptible to attack;
  • Identifying camouflage target
In terms of military target reconnaissance and camouflage identification, hyperspectral RS can detect military equipment according to the different spectral characteristics of the background and camouflage targets. Through the spectral characteristic curve, the composition of the target can be inverted to reveal the target and its camouflage that are different from the background environment. An important method for detecting green camouflage materials is to use the red-edge effect of vegetation, as the reflectivity of vegetation increases sharply at 680–720 nm. The type and status of vegetation can be identified by detecting the characteristics of its position and slope [75]. The spectral curve of the existing green camouflage materials can generally match with the vegetation and can meet the camouflage requirements under multi-spectral reconnaissance conditions. However, the camouflaged target cannot be hidden under the fine resolution of hyperspectra;
  • Detecting and calculating the target’s true temperature and emissivity
In the current thermal infrared detection, Planck’s law is used to combine the two unknown parameters of emissivity and temperature into one parameter [76], which is called hypothetical temperature or radiation temperature in radiation thermometry. It is assumed that temperature is the coupling between the real temperature and spectral emissivity and does not reflect the real temperature of the measured target. Thermal infrared camouflage of military targets mainly uses low-emissivity barriers to reduce the target’s radiation energy. If the coupling temperature between the target and the background is close to that of the target, the thermal infrared detector may not be able to detect or identify it. However, if hyperspectral detection is used and linear assumptions are used to construct equations in the thermal infrared band, the true temperature and emissivity of the target surface can be calculated. Hyperspectra break through the limitations of hypothetical temperature measurement and make the measuring solution closer to the real temperature of the object surface. This enables more effective identification of camouflaged targets and backgrounds.

4. Research Advances of Plant-Mimicking Camouflage Materials

Green plants are one of the typical ground backgrounds. To achieve hyperspectral camouflage in the plant background, it is necessary to develop bionic materials that can simulate the solar spectrum reflection characteristics of leaves. Conventional camouflage materials (e.g., camouflage coatings and camouflage nets developed based on the color characteristics of vegetation) can only achieve the same color as the vegetation, but they cannot achieve the same spectrum and are easily recognized by hyperspectral imaging. While hyperspectral imaging technology is developing rapidly, there is a need for advancements in the development of camouflage materials specifically designed for vegetation backgrounds. The following will introduce the research status of bionic materials based on leaves.

4.1. Bionic Camouflage

Bionic camouflage refers to the camouflage patterns and patches designed based on the color characteristics of natural scenery for the purpose of deceiving the enemy’s brain and visual system, especially before high-tech detection methods became widely used. Optical camouflage is the most basic and widely used camouflage and a typical example of bionic camouflage. Humans have a long history of using camouflage in military operations. According to historical records, hussars in ancient Rome were issued with uniforms made of animal fur to confuse their enemy. The modern camouflage uniform was developed by Germans in the 1930s. In fact, Americans made a similar attempt as early as 1918 when female nurses on the battlefield were issued with hooded smocks printed with patterns such as stones and tree trunks. These experimental smocks can be considered the earliest camouflage uniforms based on deformed camouflage. After World War I, many countries tried to develop practical camouflage uniforms but never succeeded. During World War II, Soviet entomologist Schwanvich, based on people’s lack of understanding of camouflage at that time, realized that the colors of butterflies were undetectable among flowers and covered military facilities with butterfly-pattern camouflage. Based on bionic technology, a number of classic camouflage patterns have been developed for actual combat, such as the tiger-stripe camouflage of the US military (Figure 3A), the leaf camouflage of Germany and former Soviet Union (Figure 3B), and the frog-shaped camouflage of the US military (Figure 3C). After the 1990s, digital camouflage technology began to be used. Compared with traditional camouflage, digital camouflage can blend more easily into the background and has better camouflage performance. However, bionic camouflage can only imitate the color of vegetation and cannot resist hyperspectral detection, and it also cannot effectively resist hyperspectral detection without achieving the same color and spectrum as leaves.

4.2. Bionic Materials Simulating Solar Reflection Characteristics of Leaves

Achieving hyperspectral consistency with leaves is a crucial requirement for modern camouflage materials to combat hyperspectral reconnaissance [3,77]. In nature, rod-like insects can spectrally simulate leaves [78,79] by taking in carotenoids and chlorophyll from their plant-based diet and sequestering these pigments in their exoskeleton, forming a pattern consistent with leaves [80]. They complete camouflage by adapting their colors and spectra to match the leaves of tree species at their growth stage, season, and habitats. Therefore, many scholars have considered that pigments are the key influencing factors of the solar reflection characteristics of plant leaves and have developed dyed fabrics using dyes with similar spectral characteristics as green leaves [12,81,82,83,84,85]. Two types of commercial inorganic green pigments, viz. Cr2O3 and CoCr2O4, are widely used in camouflage applications, but their spectra still differ from those of leaf surfaces. Ye et al. used polyvinyl alcohol (PVA, a hydrophilic polymer) as the film-forming main body and green pigment Cr2O3 and strong hygroscopic agent LiCl as additives, and they prepared biomimetic materials using a solution casting method (Figure 4) [11,15,86]. Yuan et al. used a hydrothermal method to successfully insert organic pigment anions acid green (AG) and acid yellow (AY) into the layers of magnesium and aluminum layered double hydroxides (LDHs) and thereby prepared optical materials with the visible light and near-infrared characteristics of natural green plants, a color closely related to the spectral reflectance in visible light wavebands, and colors that change with the peak position and reflectance of the visible light spectrum (Figure 5) [14], and the materials were combined with film-forming resin to prepare a bionic coating, and the colored pigment Cr2O3 was also used. The reflectivity of Cr2O3 shows a peak at 540 nm and an additional peak around 400 nm, although this can be compensated for by doping [87]. However, the slope of reflectance increase in the red-edge region is much smaller, which limits its spectral similarity with leaves. The slope of CoCr2O4 in this region is close to the red edge, but its blue shading and strong absorption of tetrahedrally coordinated cobalt in the near-infrared region are undesirable [88]. In addition, several commercial vat dyes and disperse dyes were applied to match with leaf reflectance [12,89]. However, the spectral differences between these dyes and in vivo pigments may be amplified by the environmental influence of the dye molecules, making it difficult to simultaneously achieve high spectral similarity, precise red-edge reflectance, and controllable color difference. Moreover, fabricating these dyes is challenging. Although bionic camouflage based on inorganic dyes can achieve the same color, the key dyes used cannot completely have the same spectrum as green vegetation.
To accurately simulate the spectral characteristics of green vegetation, one of the simplest and most effective ways is to directly use chlorophyll, which is the exact same coloring dye as that found in green leaves. Therefore, researchers have proposed another technical approach to bionic camouflage materials, which is to simulate the color of green vegetation by extracting chlorophyll from green leaves [13,90,91]. The multi-layer bionic camouflage material designed by Yang et al. encapsulates chlorophyll in PVA films (Figure 6), and the encapsulated chlorophyll is also prone to degradation, causing changes in the reflection curve of the bionic leaves [92]. Qin et al. developed urea formaldehyde polymer microcapsules coated with chlorophyll and water through encapsulation, which simulated the spectral characteristics of leaves (Figure 7) [13]. The chlorophyll encapsulated in the microcapsule was also prone to degradation, making it impossible to achieve precise simulation. After chlorophyll leaves the leaf, it will decompose within 1 day under light and has poor stability, which limit its application in the field of camouflage. Liu et al. proposed a biomimetic material by using trans-polyurethane foam, super absorbent resin particles, and oil-soluble chlorophyll to simulate the mesophyll, water, and chloroplasts of green leaves, respectively (Figure 8) [90]. Hu et al. developed a polyurethane-based biomimetic material-bionic porous spectrum simulation material (BPSSM) embedded with water and vat dyes (or organic pigments) (Figure 9) [93]. However, the development of these materials and technologies lags far behind the developing speed of hyperspectral reconnaissance and detection technology, and the gap is increasingly wider.
In modern high-tech warfare, troop operations often feature large combat areas, rapid maneuvers, seasonal changes, and large background changes. Facing battlefield environments with diverse and differentiated environmental backgrounds, the existing bionic camouflage materials that only simulate green vegetation backgrounds do not have adaptive camouflage capability. The traditional stealth technology is easily ineffective and difficult to maneuver. How to make camouflaged targets better adapt to complex background environments has become the focus of research in recent years. Bionic materials in previous studies only presented static colors [16,17,94]. In nature, however, leaves are not always green, and their colors change in time and space (Figure 10) [95,96,97]. For example, the colors of leaves in autumn change in a latitude-dependent way, showing obvious changes from high to low latitudes [98]. Xie et al. developed a microencapsulated colorant with a chloroplast-like structure and chlorophyll-like absorptivity and designed a universal double-layer coating to provide changing high spectral similarity with leaves at different growth stages and seasons, as well as leaves of different species [99]. Moreover, this colorant was superior to the state-of-the-art spectral modeling materials. Huang et al. studied tree-leaf discoloration and developed a color-changing bionic material (CCBM) [100]. CCBM is very similar to the ultraviolet-visible-near-infrared and thermal infrared characteristics of both green and yellow leaves (Figure 11), and it can be used as a camouflage net in bionic camouflage.
By reviewing the research, development, and technical improvement of hyperspectral camouflage materials that simulate vegetation backgrounds, we find no major innovations, as the traditional ideas of bionic camouflage have continued being researched. Therefore, it is urgent to use new bionic camouflage technology to fill in the gaps in hyperspectral imaging detection technology.
Hyperspectral and thermal infrared detectors are often combined in modern battlefields, but multi-band camouflage using both the solar spectrum and the infrared spectrum is challenging. To address this challenge, Xu et al. developed a bionic metamaterial inspired from natural leaves [101]. This metamaterial exhibits a similar solar reflectance properties and low infrared emissivity as natural tree leaves, and it is capable of hyperspectral and infrared detection against a vegetation background. The material consists of a three-layer structure (Figure 12). Of note, the middle layer is a hyperspectral camouflage layer that mainly contains polyvinyl alcohol (PVA), Cr2O3 nanoparticles, and LiCl. The bottom layer is the base of a porous array designed with inspiration from the stomata distribution characteristics of natural leaves. The top layer is an infrared camouflage layer, which requires high transmittance in the solar spectrum and low emissivity in the infrared region.

5. Discussion and Prospects

Recently, significant progress has been made regarding hyperspectral camouflage materials and technologies. Through vigorous research, a theoretical system of hyperspectral camouflage has been gradually formed, which has greatly improved the effectiveness of military camouflage. The future development trends of vegetation-imitating hyperspectral camouflage materials and technologies are shown below:
  • Improving the bionic camouflage technology
The inorganic or organic pigments used in traditional camouflage materials are completely different from the biological pigments in green vegetation, and they can be easily identified by hyperspectral detection. Thus, to improve the camouflage performance of the target, we must solve the shortcomings of the existing traditional bionic camouflage technology. For example, pigments can be compounded, doped, or added with chlorophyll-like spectral fillers (e.g., phthalocyanine compounds) to accurately simulate important spectral features, such as green reflection peaks and red edges. In addition, the reflection characteristics of green vegetation are closely related to their water content. However, the existing camouflage materials contain little to no water, making it difficult to accurately simulate the moisture characteristic absorption peak of the vegetation background. Therefore, the design and preparation of bionic camouflage materials must be focused on studying their moisture absorption and water-retention mechanism. In this way, these materials can have a water-retention effect similar to plants, and they can show spectral characteristics that are basically consistent with the vegetation background, achieving effective resistance against hyperspectral detection;
  • Improving the performances of leaf-simulating camouflage materials
At the technical level of hyperspectral camouflage, the biggest challenge is how to design a suitable material system that can achieve the camouflage function of hyperspectral camouflage materials. First, to achieve the hyperspectral camouflage effect, the primary problem is to design and prepare a bionic material that can be preserved for a long time. Second, achieving the hyperspectral camouflage performance of materials is another key issue. At the application level of hyperspectral camouflage, leaf bionic camouflage materials must not only meet the performance requirements of hyperspectral camouflage but also account for the comprehensive performance under service conditions and meet certain use performance indicators. At the current stage, the above issue is mainly reflected in how to improve the usability and reliability of materials in actual service environments and develop a material system with excellent hyperspectral camouflage performance and comprehensive capabilities.

Author Contributions

Y.L. organized and compiled this article. L.R., X.Y. and H.Y. provided the ideas and references. All authors contributed to the article and approved the submitted version. All authors have read and agreed to the published version of the manuscript.

Funding

This work was financially supported by the National Natural Science Foundation of China (51875249), the Jilin Engineering Normal University PhD startup foundation (BSKJ201902), the Education Department of Jilin Province (JJKH20230223KJ), and the Science and Technology Development Plan Project of Jilin Province (YDZJ202201ZYTS317).

Institutional Review Board Statement

Not applicable.

Informed Consent Statement

Not applicable.

Data Availability Statement

Not applicable.

Conflicts of Interest

The authors declare no conflict of interest.

References

  1. Murchie, S.; Arvidson, R.; Bedini, P.; Beisser, K.; Bibring, J.P.; Bishop, J. Compact reconnaissance imaging spectrometer for mars (CRISM) on mars reconnaissance orbiter (MRO). J. Geophys. Res. Atmos. 2007, 112, 431–433. [Google Scholar] [CrossRef]
  2. Jia, J.; Wang, Y.; Chen, J.; Guo, R.; Shu, R.; Wang, J. Status and application of advanced airborne hyperspectral imaging technology: A review. Infrared Phys. Technol. 2020, 104, 103115. [Google Scholar] [CrossRef]
  3. Wang, H.; Yan, C.; Yuan, J.; Lu, Q. Hyperspectral band selections for enhancing the discrimination of difficult targets using local band index and particle swarm optimization. Appl. Sci. 2022, 12, 3899. [Google Scholar] [CrossRef]
  4. Luo, J.; Cai, F.; Yao, X.; Li, J.; Huang, Q.; He, S. Experimental demonstration of an anti-shake hyperspectral imager of high spatial resolution and low cost. IEEE Sens. J. 2020, 20, 8082–8090. [Google Scholar] [CrossRef]
  5. Shen, F.; Deng, H.; Yu, L.; Cai, F. Open-source mobile multispectral imaging system and its applications in biological sample sensing. Spectrochim. Acta Part A 2022, 280, 121504. [Google Scholar] [CrossRef] [PubMed]
  6. Dian, R.; Li, S.; Sun, B.; Guo, A. Recent advances and new guidelines on hyperspectral and multispectral image fusion. Inform. Fusion 2021, 69, 40–51. [Google Scholar] [CrossRef]
  7. Shaw, G.; Manolakis, D. Signal processing for hyperspectral image exploitation. IEEE Signal Proc. Mag. 2002, 19, 12–16. [Google Scholar] [CrossRef]
  8. Tiwari, K.C.; Arora, M.K.; Singh, D. An assessment of independent component analysis for detection of military targets from hyperspectral images. Int. J. Appl. Earth Obs. 2011, 13, 730–740. [Google Scholar] [CrossRef]
  9. Makki, I.; Rafic, Y.; Clovis, F.; Tiziano, B.; Massimo, Z. A survey of landmine detection using hyperspectral imaging. ISPRS J. Photogramm. Remote Sens. 2017, 124, 40–53. [Google Scholar] [CrossRef]
  10. Lee, J.; Sul, H.; Jung, Y.; Kim, H.; Han, S.; Choi, J.H. Thermally controlled, active imperceptible artificial skin in visible-to-infrared range. Adv. Funct. Mater. 2020, 30, 2003328. [Google Scholar] [CrossRef]
  11. Xu, K.; Ye, H. Preparation and optimization of biomimetic materials simulating solar spectrum reflection characteristics of natural leaves. J. Mater. Sci. 2020, 55, 12848–12863. [Google Scholar] [CrossRef]
  12. Zhang, H.; Zhang, J.C. Near-infrared green camouflage of cotton fabrics using vat dyes. J. Text. Inst. 2008, 99, 83–88. [Google Scholar] [CrossRef]
  13. Qin, R.; Xu, G.; Guo, L.; Jiang, Y.; Ding, R. Preparation and characterization of a novel poly(urea-formaldehyde) microcapsules with similar reflectance spectrum to leaves in the UV-Vis-NIR region of 300–2500 nm. Mater. Chem. Phys. 2012, 136, 737–743. [Google Scholar] [CrossRef]
  14. Yuan, L.; Wang, C.; Qing, X.; Bi, M.; Huang, G.; Weng, X. Synthesis and fine spectroscopy tuning of the hyperspectral simulation material based on organic anions intercalated mg-al layered double hydroxide. Infrared Phys. Technol. 2020, 107, 103328. [Google Scholar] [CrossRef]
  15. Ye, H.; Gao, Y.; Li, S.; Guo, L. Bionic leaves imitating the transpiration and solar spectrum reflection characteristics of natural leaves. J. Bionic Eng. 2015, 12, 109–116. [Google Scholar] [CrossRef]
  16. Xu, K.; Lin, Y.; Wei, X.; Ye, H. Biomimetic material simulating solar spectrum reflection characteristics of yellow leaf. J. Bionic Eng. 2018, 15, 741–750. [Google Scholar] [CrossRef]
  17. Gao, Y.; Tang, B.; Ji, G.; Chen, K.; Wang, Z.; Ye, H. A camouflage coating with similar solar spectrum reflectance to leaves based on polymeric inorganic composite. Mater. Res. Express 2021, 8, 66404. [Google Scholar] [CrossRef]
  18. Thenkabail, P.S.; Smith, R.B.; De Pauw, E. Hyperspectral vegetation indices and their relationships with agricultural crop characteristics. Rem. Sens. Environ. 2000, 71, 158–182. [Google Scholar] [CrossRef]
  19. Roth, K.L.; Casas, A.; Huesca, M.; Ustin, S.L.; Alsina, M.M.; Mathews, S.A.; Whiting, M.L. Leaf spectral clusters as potential optical leaf functional types within California ecosystems. Remote Sens. Environ. 2016, 184, 229–246. [Google Scholar] [CrossRef]
  20. Pauli, D.; Chapman, S.C.; Bart, R.; Topp, C.N.; Lawrence-Dill, C.J.; Poland, J.; Gore, M.A. The quest for understanding phenotypic variation via integrated approaches in the field environment. Plant Physiol. 2016, 172, 622–634. [Google Scholar] [CrossRef]
  21. Kolmann, M.A.; Kalacska, M.; Lucanus, O.; Sousa, L.; Wainwright, D.; Arroyo-Mora, J.P.; Andrade, M.C. Hyperspectral data as a biodiversity screening tool can differentiate among diverse Neotropical fishes. Sci. Rep. 2021, 11, 16157. [Google Scholar] [CrossRef] [PubMed]
  22. Vogelmann, T.C. Leaf: Light Capture in the Photosynthetic Organ; Hohmann-Marriott, M.F., Ed.; Springer: Berlin/Heidelberg, Germany, 2014. [Google Scholar]
  23. Gerber, F.; Marion, R.; Olioso, A.; Jacquemoud, S.; Ribeiro da Luz, B.; Fabre, S. Modeling directional–hemispherical reflectance and transmittance of fresh and dry leaves from 0.4 μm to 5.7 μm with the PROSPECT-VISIR model. Remote Sens. Environ. 2011, 115, 404–414. [Google Scholar] [CrossRef]
  24. Vilfan, N.; van der Tol, C.; Muller, O.; Rascher, U.; Verhoef, W. Fluspect-B: A model for leaf fluorescence, reflectance and transmittance spectra. Remote Sens. Environ. 2016, 186, 596–615. [Google Scholar] [CrossRef]
  25. Terashima, I.; Fujita, T.; Inoue, T.; Chow, W.S.; Oguchi, R. Green light drives leaf photosynthesis more efficiently than red light in strong white light: Revisiting the enigmatic question of why leaves are green. Plant Cell Physiol. 2009, 50, 684–697. [Google Scholar] [CrossRef] [PubMed]
  26. Gates, D.M.; Keegan, H.J.; Schleter, J.C.; Weidner, V.R. Spectrak properties of plants. Appl. Opt. 1965, 4, 11–20. [Google Scholar] [CrossRef]
  27. Peñuelas, J.; Inoue, Y. Reflectance indices indicative of changes in water and pigment contents of peanut and wheat leaves. Photosynthetica 1999, 36, 355–360. [Google Scholar] [CrossRef]
  28. Sims, D.A.; Gamon, J.A. Relationships between leaf pigment content and spectral reflectance across a wide range of species, leaf structures and developmental stages. Remote Sens. Environ. 2002, 81, 337–354. [Google Scholar] [CrossRef]
  29. Knipling, E.B. Physical and physiological basis for the reflectance of visible and near-infrared radiation from vegetation. Remote Sens. Environ. 1970, 1, 155–159. [Google Scholar] [CrossRef]
  30. Hettinger, J.W.; Matthew de la Peña Mattozzi Myers, W.R.; Williams, M.E.; Reeves, A.; Parsons, R.L.; Haskell, R.C.; Petersen, D.C.; Wang, R.; Medford, J.I. Optical coherence microscopy. A technology for rapid, in vivo, non-destructive visualization of plants and plant cells. Plant Physiol. 2000, 123, 3–15. [Google Scholar] [CrossRef]
  31. Woolley, J.T. Reflectance and transmittance of light by leaves. Plant Physiol. 1971, 47, 656–662. [Google Scholar] [CrossRef]
  32. Broge, N.H.; Mortensen, J.V. Deriving green crop area index and canopy chlorophyll density of winter wheat from spectral reflectance data. Remote Sens. Environ. 2002, 81, 45–57. [Google Scholar] [CrossRef]
  33. Hikosaka, K. Optimality of nitrogen distribution among leaves in plant canopies. J. Plant Res. 2016, 129, 299–311. [Google Scholar] [CrossRef]
  34. Muller, C.; Riederer, M. Plant surface properties in chemical ecology. J. Chem. Ecol. 2005, 31, 2621–2651. [Google Scholar] [CrossRef]
  35. Merzlyak, M.N.; Chivkunova, O.B.; Zhigalova, T.V.; Naqvi, K.R. Light absorption by isolated chloroplasts and leaves: Effects of scattering and packing. Photosynth. Res. 2009, 102, 31–41. [Google Scholar] [CrossRef]
  36. Huang, Z.; Shi, T.; Zhang, H.; Zhang, M.; Huttula, M.; Cao, W. A computational study of antireflection structures bio-mimicked from leaf surface morphologies. Sol. Energy 2016, 131, 131–137. [Google Scholar] [CrossRef]
  37. Jacquemoud, S.; Baret, F. PROSPECT: A model of leaf optical properties spectra. Remote Sens. Environ. 1990, 34, 75–91. [Google Scholar] [CrossRef]
  38. Renzullo, L.J.; Blanchfield, A.L.; Guillermin, R.; Powell, K.S.; Held, A.A. Comparison of PROSPECT and HPLC estimates of leaf chlorophyll contents in a grapevine stress study. Int. J. Remote Sens. 2006, 27, 817–823. [Google Scholar] [CrossRef]
  39. Barry, K.M.; Newnham, G.J.; Stone, C. Estimation of chlorophyll content in eucalyptus globulus foliage with the leaf reflectance model PROSPECT. Agric. For. Meteorol. 2009, 149, 1209–1213. [Google Scholar] [CrossRef]
  40. Romero, A.; Aguado, I.; Yebra, M. Estimation of dry matter content in leaves using normalized indexes and prospect model inversion. Int. J. Remote Sens. 2012, 33, 396–414. [Google Scholar] [CrossRef]
  41. Yarbrough, S.; Caudill, T.; Kouba, E.; Osweiler, V.; Arnold, J. Mightysat ii.1 hyperspectral imager: Summary of on-orbit performance. In Proceedings of the SPIE-the International Society for Optical Engineering, Świnoujście, Poland, 23–27 September 2002; pp. 186–197. [Google Scholar]
  42. Goetz, A.F.H.; Vane, G.; Solomon, J.E.; Rock, B.N. Imaging spectrometry for earth remote sensing. Science 1985, 228, 1147–1153. [Google Scholar] [CrossRef]
  43. Goetz, A.F.H.; Wellman, J.B.; Barnes, W.L. Optical remote sensing of the earth. Proc. IEEE 1985, 73, 950–969. [Google Scholar] [CrossRef]
  44. Pinter, P.J.; Jackson, R.D.; Idso, S.B.; Reginato, R.J. Diurnal patterns of wheat spectral reflectances. IEEE Trans. Geosci. Remote Sens. 1983, GE-21, 156–163. [Google Scholar] [CrossRef]
  45. Curran, P.J.; Steven, M.D. Multispectral remote sensing for the estimation of green leaf area index [and discussion]. Philosophical Transactions of the Royal Society of London. Ser. A Math. Phys. Sci. 1983, 309, 257–270. [Google Scholar]
  46. Everitt, J.H.; Pettit, R.D.; Alaniz, M.A. Remote sensing of broom snakeweed (Gutierrezia sarothrae) and spiny aster (Aster spinosus). Weed Sci. 1987, 35, 295–302. [Google Scholar] [CrossRef]
  47. Curran, P.J.; Dungan, J.L.; Peterson, D.L. Estimating the foliar biochemical concentration of leaves with reflectance spectrometry: Testing the kokaly and clark methodologies. Remote Sens. Environ. 2001, 76, 349–359. [Google Scholar] [CrossRef]
  48. Jago, R.A.; Cutler, M.E.J.; Curran, P.J. Estimating canopy chlorophyll concentration from field and airborne spectra. Remote Sens. Environ. 1999, 68, 217–224. [Google Scholar] [CrossRef]
  49. Mcfeeters, S.K. The use of the normalized difference water index (NDWI) in the delineation of open water features. Int. J. Remote Sens. 1996, 17, 1425–1432. [Google Scholar] [CrossRef]
  50. Casanova, D.; Epema, G.F.; Goudriaan, J. Monitoring rice reflectance at field level for estimating biomass and LAI. Field Crops Res. 1998, 55, 83–92. [Google Scholar] [CrossRef]
  51. Mistele, B.; Schmidhalter, U. Spectral measurements of the total aerial N and biomass dry weight in maize using a quadrilateral-view optic. Field Crops Res. 2008, 106, 94–103. [Google Scholar] [CrossRef]
  52. Tang, X.G.; Song, K.S.; Liu, D.W.; Wang, Z.M.; Zhang, B.; Du, J.; Zeng, L.H.; Jiang, G.J.; Wang, Y.D. Comparison of methods for estimating soybean chlorophyll content based on visual/near infrared reflection spectra. Spectrosc. Spect. Anal. 2011, 31, 371–374. [Google Scholar]
  53. Dalponte, M.; Bruzzone, L.; Gianelle, D. Tree species classification in the southern alps based on the fusion of very high geometrical resolution multispectral/hyperspectral images and LiDAR data. Remote Sens. Environ. 2012, 123, 258–270. [Google Scholar] [CrossRef]
  54. Kozoderov, V.V.; Dmitriev, E.V. Testing different classification methods in airborne hyperspectral imagery processing. Opt. Express 2016, 24, A956–A965. [Google Scholar] [CrossRef] [PubMed]
  55. Schull, M.A.; Knyazikhin, Y.; Xu, L.; Samanta, A.; Carmona, P.L.; Lepine, L.; Jenkins, J.P.; Ganguly, S.; Myneni, R.B. Canopy spectral invariants, part 2: Application to classification of forest types from hyperspectral data. J. Quant. Spectrosc. Radiat. Transf. 2011, 112, 736–750. [Google Scholar] [CrossRef]
  56. Ballanti, L.; Blesius, L.; Hines, E.; Kruse, B. Tree species classification using hyperspectral imagery: A comparison of two classifiers. Remote Sens. 2016, 8, 445. [Google Scholar] [CrossRef]
  57. Vangi, E.; D’amico, G.; Francini, S.; Giannetti, F.; Lasserre, B.; Marchetti, M.; Chirici, G. The new hyperspectral satellite prisma: Imagery for forest types discrimination. Sensors 2021, 21, 1182. [Google Scholar] [CrossRef] [PubMed]
  58. Modzelewska, A.; Kamińska, A.; Fassnacht, F.E.; Stereńczak, K. Multitemporal hyperspectral tree species classification in the białowieża forest world heritage site. Forestry 2021, 94, 464–476. [Google Scholar] [CrossRef]
  59. Wang, R.; Gamon, J.A. Remote sensing of terrestrial plant biodiversity. Remote Sens. Environ. 2019, 231, 111218. [Google Scholar] [CrossRef]
  60. Thenkabail, P.S.; Lyon, J.G.; Huete, A. Fundamentals, Sensor Systems, Spectral Libraries, and Data Mining for Vegetation, 2nd ed.; CRC Press: Boca Raton, FL, USA, 2018. [Google Scholar]
  61. Durán, S.M.; Martin, R.E.; Díaz, S.; Maitner, B.S.; Malhi, Y.; Salinas, N.; Shenkin, A.; Silman, M.R.; Wieczynski, D.J.; Asner, G.P.; et al. Informing trait-based ecology by assessing remotely sensed functional diversity across a broad tropical temperature gradient. Sci. Adv. 2019, 5, eaaw8114. [Google Scholar] [CrossRef] [PubMed]
  62. Turner, W.; Spector, S.; Gardiner, N.; Fladeland, M.; Sterling, E.; Steininger, M. Remote sensing for biodiversity science and conservation. Trends Ecol. Evol. 2003, 18, 306–314. [Google Scholar] [CrossRef]
  63. Jiang, X.; Zhen, J.; Miao, J.; Zhao, D.; Wang, J.; Jia, S. Assessing mangrove leaf traits under different pest and disease severity with hyperspectral imaging spectroscopy. Ecol. Indic. 2021, 129, 107901. [Google Scholar] [CrossRef]
  64. Zhang, N.; Zhang, X.; Yang, G.; Zhu, C.; Huo, L.; Feng, H. Assessment of defoliation during the dendrolimus tabulaeformis tsai et liu disaster outbreak using UAV-based hyperspectral images. Remote Sens. Environ. 2018, 217, 323–339. [Google Scholar] [CrossRef]
  65. Ma, Y.; Lu, J.; Huang, X. Damage diagnosis of pinus yunnanensis canopies attacked by tomicus using UAV hyperspectral images. Forests 2023, 14, 61. [Google Scholar] [CrossRef]
  66. Zhang, X.; Han, L.; Dong, Y.; Shi, Y.; Huang, W.; Han, L.; González-Moreno, P.; Ma, H.; Ye, H.; Sobeih, T. A deep learning-based approach for automated yellow rust disease detection from high-resolution hyperspectral UAV images. Remote Sens. 2019, 11, 1554. [Google Scholar] [CrossRef]
  67. Xi, G.; Huang, X.; Xie, Y.; Gang, B.; Bao, Y.; Dashzebeg, G.; Nanzad, T.; Dorjsuren, A.; Enkhnasan, D.; Ariunaa, M. Detection of larch forest stress from jas’s larch inchworm (erannis jacobsoni djak) attack using hyperspectral remote sensing. Remote Sens. 2022, 14, 124. [Google Scholar] [CrossRef]
  68. Liu, M.; Zhang, Z.; Liu, X.; Yao, J.; Du, T.; Ma, Y.; Shi, L. Discriminant analysis of the damage degree caused by pine shoot beetle to yunnan pine using UAV-based hyperspectral images. Forests 2020, 11, 1258. [Google Scholar] [CrossRef]
  69. Gao, B.; Yu, L.; Ren, L.; Zhan, Z.; Luo, Y. Early detection of dendroctonus valens infestation at tree level with a hyperspectral UAV image. Remote Sens. 2023, 15, 407. [Google Scholar] [CrossRef]
  70. Bergman, S.M. The Utility of Hyperspectral Data to Detect and Discriminate Actual and Decoy Target Vehicles; Directorate for Information Operations and Reports: Washington, DC, USA, 1996. [Google Scholar]
  71. Li, X.P.; Chen, J.P.; Wang, X. Inversion of lunar nearside FeO and Al2O3 based on Chang’E-1 reflectance data. China Min. Mag. 2018, 27, 150–156. [Google Scholar]
  72. Bárta, V.; Racek, F.; Krejcí, J. NATO hyperspectral measurement of natural background. Int. Soc. Opt. Eng. 2018, 10794, 1–16. [Google Scholar]
  73. Stellman, C.M.; Hazel, G.G.; Schuler, J.M. Spectral Calibration, Spatial Mapping and Flat Fielding Studies of the Dark Horse 1(DH1) March Data Collection; Naval Research Laboratory: Washington, DC, USA, 1999. [Google Scholar]
  74. Zagolski, F.; Pinel, V.; Romier, J.; Alcayde, D.; Fontanari, J.; Gastellu-etchegorry, J.P.; Giordano, G.; Marty, G.; Mougin, E.; Joffre, R. Forest canopy chemistry with high spectral resolution remote sensing. Int. J. Remote Sens. 1996, 17, 1107–1128. [Google Scholar] [CrossRef]
  75. Junttila, M.L. Stationary fourier-transform spectrometer. Appl. Opt. 1992, 31, 4106–4112. [Google Scholar] [CrossRef]
  76. Incropera, F.P.; DeWitt, D.P. Fundamentals of Heat Transfer; Wiley: Hoboken, NJ, USA, 1981. [Google Scholar]
  77. Lichtenthaler, H.K.; Gitelson, A.; Lang, M. Non-destructive determination of chlorophyll content of leaves of a green and an aurea mutant of tobacco by reflectance measurements. J. Plant Physiol. 1996, 148, 483–493. [Google Scholar] [CrossRef]
  78. Bank, S.; Cumming, R.T.; Li, Y.; Henze, K.; Le Tirant, S.; Bradleret, S. A tree of leaves: Phylogeny and historical biogeography of the leaf insects (Phasmatodea: Phylliidae). Commun. Biol. 2021, 4, 932. [Google Scholar] [CrossRef]
  79. Villoutreix, R.; de Carvalho, C.F.; Feder, J.L.; Gompert, Z.; Nosil, P. Disruptive selection and the evolution of discrete color morphs in timema stick insects. Sci. Adv. 2023, 9, eabm8157. [Google Scholar] [CrossRef] [PubMed]
  80. Cumming, R.T.; Zhu, K.; Petracca, J.; Wurtzel, E.T. Analysis of plant-derived carotenoids in camouflaging stick and leaf insects (phasmatodea). Method Enzymol. 2022, 670, 499–524. [Google Scholar]
  81. Hui, Z.; Jianchun, Z. Near-infrared green camouflage of PET fabrics using disperse dyes. Sen’i Gakkaishi 2007, 63, 223–229. [Google Scholar] [CrossRef]
  82. Zhou, L.; Shao, J.Z.; Chai, L.Q. Study on the uv-protective properties and near infrared camouflage of lithospermum. J. Fiber Bioeng. Inform. 2009, 2, 177–181. [Google Scholar]
  83. Khajeh Mehrizi, M.; Mortazavi, S.M.; Mallakpour, S.; Bidoki, S.M.; Vik, M.; Vikova, M. Effect of carbon black nanoparticles on reflective behavior of printed cotton/nylon fabrics in visible/near infrared regions. Fibers Polym. 2012, 13, 501–506. [Google Scholar] [CrossRef]
  84. Winkelmann, M. Analysis of exploitable spectral features of target and background materials. In Proceedings of the SPIE Defence and Security Toulouse, Toulouse, France, 21–23 September 2015; p. 9653. [Google Scholar]
  85. Lv, C.; Zu, M.; Xie, D.; Cheng, H. Emulating solar spectral reflectance of natural leaf with bionic leaf prepared from 4a zeolite-derived ultramarine green pigment. Materials 2021, 14, 1406. [Google Scholar] [CrossRef] [PubMed]
  86. Gao, Y.; Ye, H. Bionic membrane simulating solar spectrum reflection characteristics of natural leaf. Int. J. Heat Mass Transf. 2017, 114, 115–124. [Google Scholar] [CrossRef]
  87. Ai, S.; Zheng, H.; Yu, J. Preparation and reflectance spectrum modulation of Cr2O3 green pigment by solution combustion synthesis. Materials 2020, 13, 1540. [Google Scholar] [CrossRef]
  88. Xie, D.; Lü, C.; Zu, M.; Cheng, H. Research progress of bionic materials simulating vegetation visible-near infrared reflectance spectra. Spectrosc. Spect. Anal. 2021, 41, 1032–1038. [Google Scholar]
  89. Lu, Q.; Li, M.; Tian, A.; Fu, S. Green plant leaf-inspired smart camouflage fabrics for visible light and near-infrared stealth. J. Bionic Eng. 2022, 19, 788–798. [Google Scholar] [CrossRef]
  90. Liu, Z.; Wu, W.; Hu, B. Design of biomimetic camouflage materials based on angiosperm leaf organs. Sci. China Ser. E 2008, 51, 1902–1910. [Google Scholar] [CrossRef]
  91. Yang, Y.; Liu, Z.; Hu, B.; Wu, W. Design of plant leaf bionic camouflage materials based on spectral analysis. Spectrosc. Spect. Anal. 2011, 31, 1668–1672. [Google Scholar]
  92. Yang, Y.; Liu, Z.; Hu, B.; Man, Y.; Wu, W. Bionic composite material simulating the optical spectra of plant leaves. J. Bionic Eng. 2010, 7 (Suppl. 4), S43–S49. [Google Scholar] [CrossRef]
  93. Hu, A.; Li, M.; Zhang, L.; Wang, C.; Fu, S. Polyurethane-based bionic material simulating the vis-NIR spectrum and thermal infrared properties of vegetation. RSC Adv. 2019, 9, 41438–41446. [Google Scholar] [CrossRef] [PubMed]
  94. Xu, K.; Wang, S.; Wang, L.; Ye, H. Bionic coating imitating reflection characteristics of plant leaf in solar spectrum waveband for hyperspectral camouflage. Infrared Phys. Technol. 2022, 127, 104477. [Google Scholar] [CrossRef]
  95. Zhang, X.; Goldberg, M.D. Monitoring fall foliage coloration dynamics using time-series satellite data. Remote Sens. Environ. 2011, 115, 382–391. [Google Scholar] [CrossRef]
  96. Rozenstein, O.; Adamowski, J. Linking spaceborne and ground observations of autumn foliage senescence in southern québec, Canada. Remote Sens. 2017, 9, 630. [Google Scholar] [CrossRef]
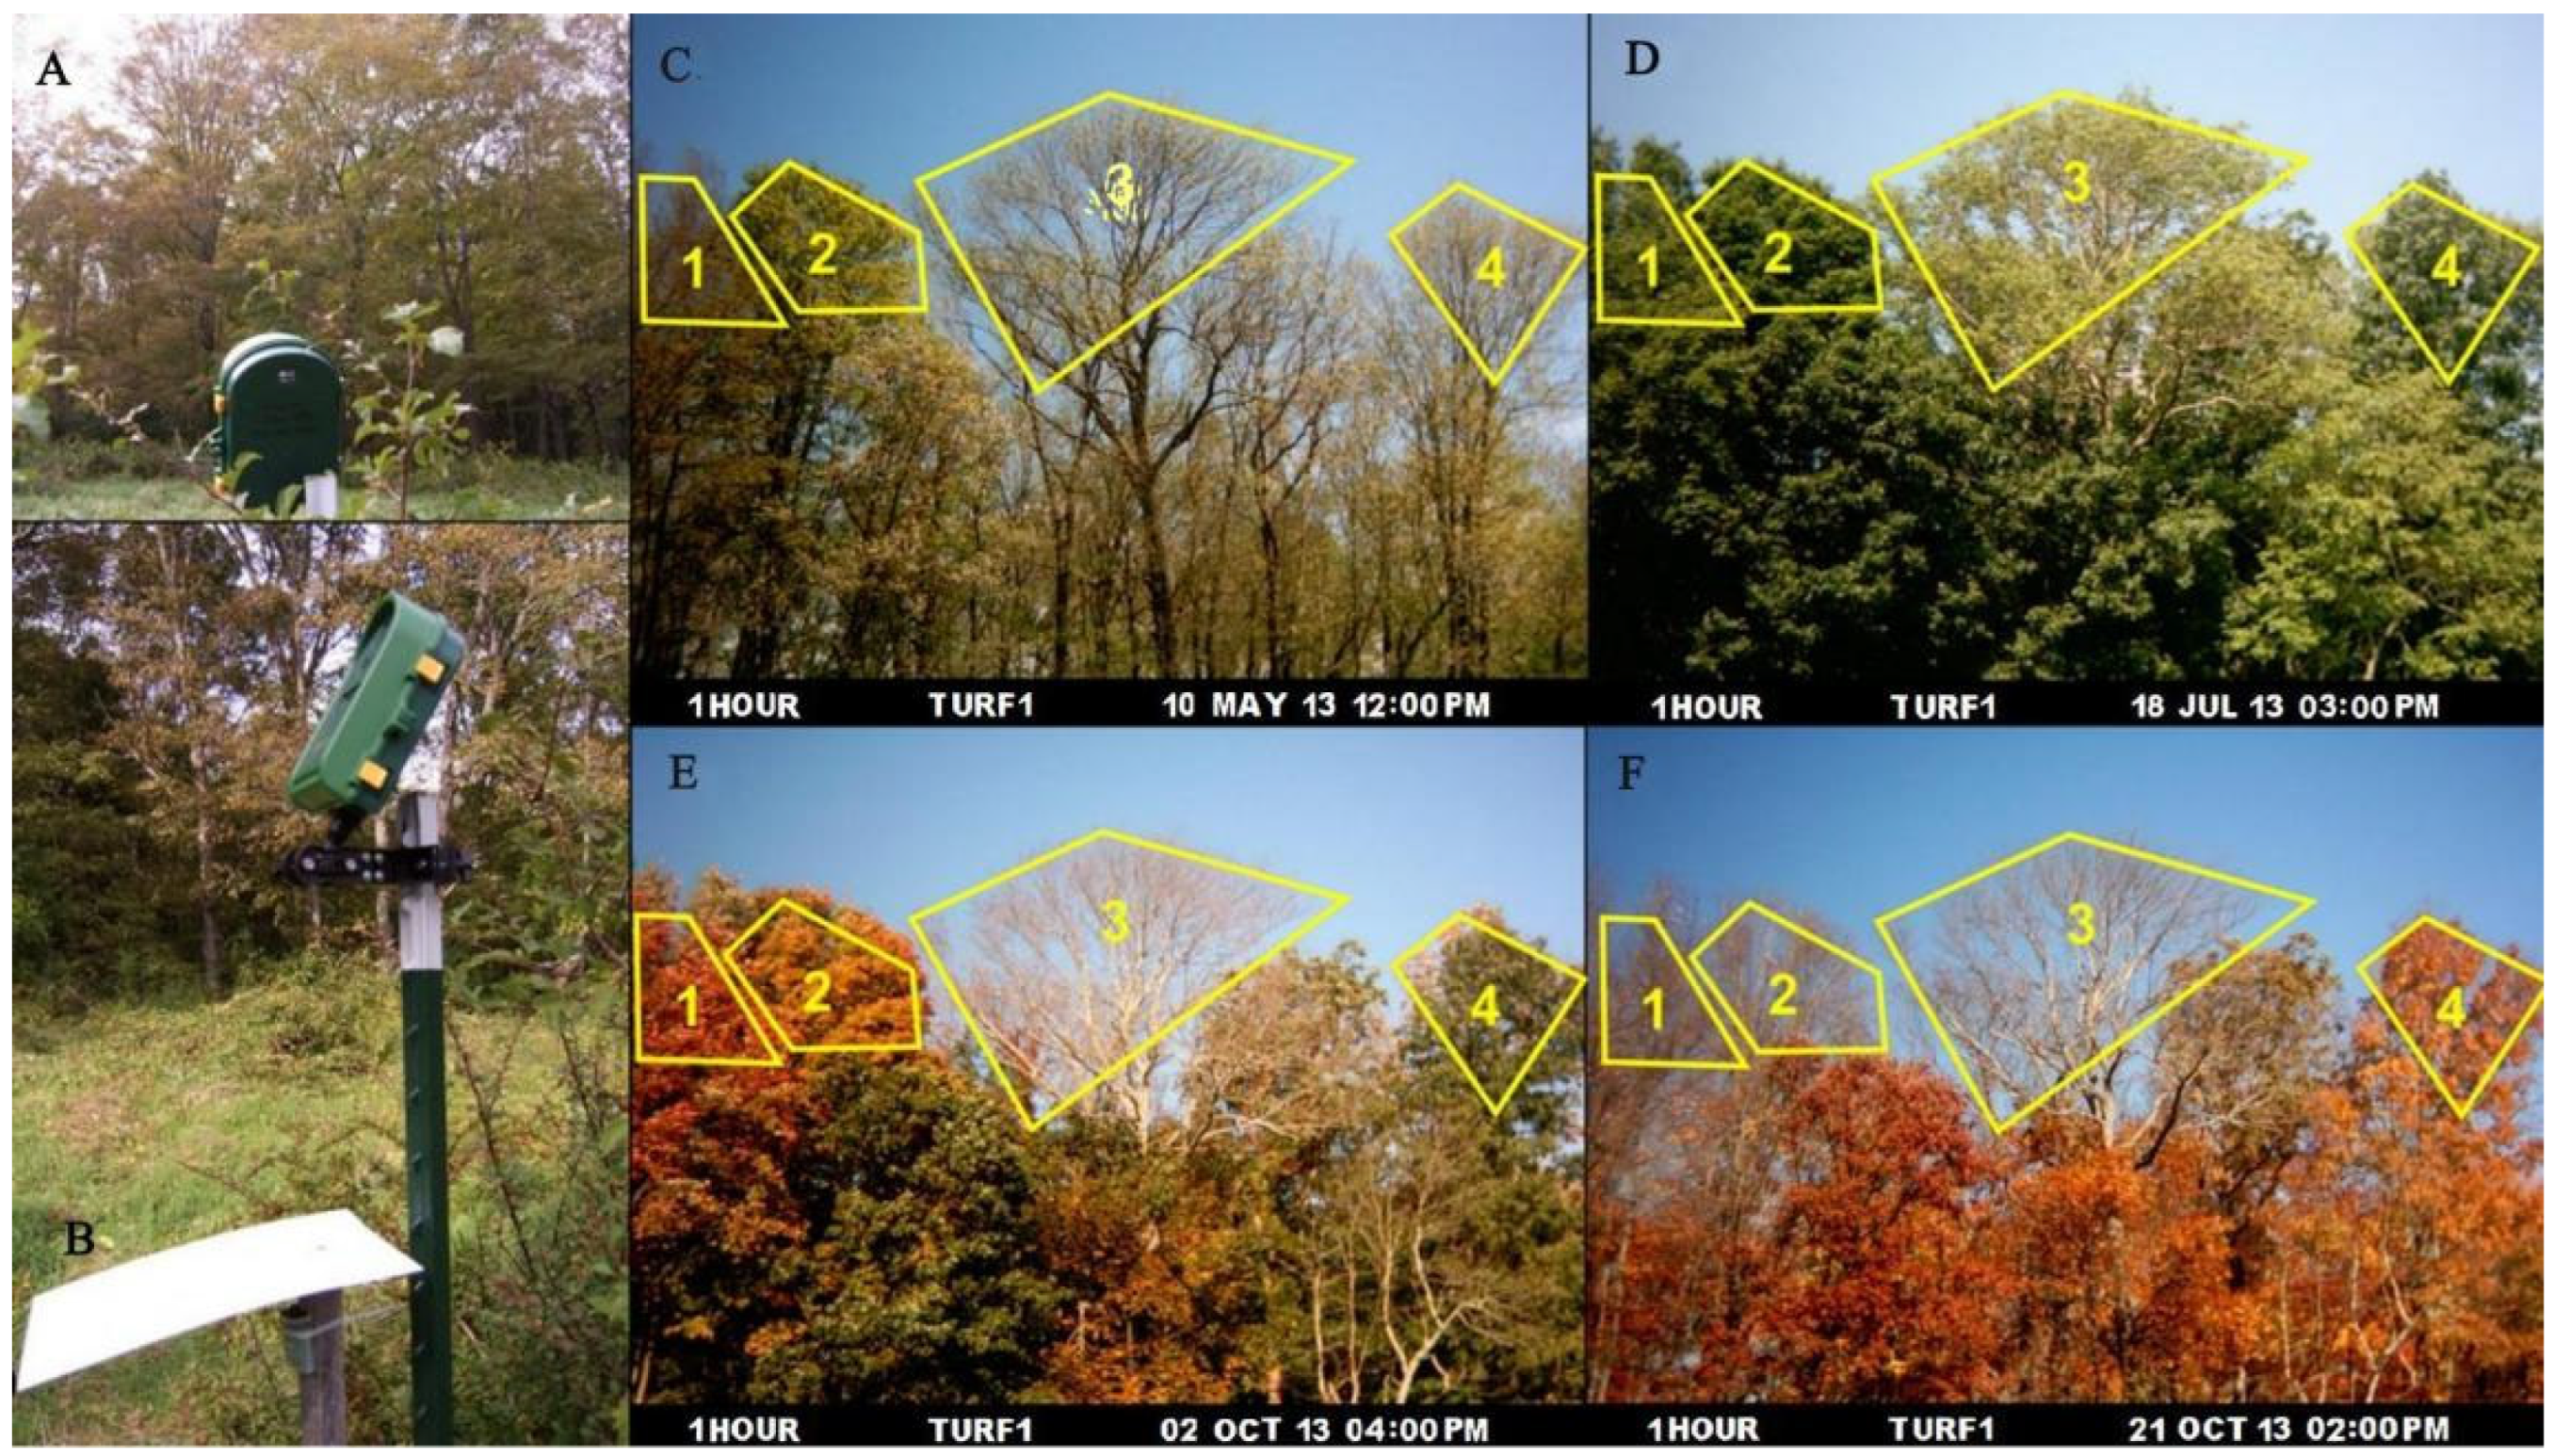
  97. Xie, Y.; Civco, D.L.; Silander, J.A. Species-specific spring and autumn leaf phenology captured by time-lapse digital cameras. Ecosphere 2018, 9, e02089. [Google Scholar] [CrossRef]
  98. Anav, A.; Liu, Q.; De Marco, A.; Proietti, C.; Savi, F.; Paoletti, E.; Piao, S. The role of plant phenology in stomatal ozone flux modeling. Glob. Chang. Biol. 2018, 24, 235–248. [Google Scholar] [CrossRef] [PubMed]
  99. Xie, D.; Zu, M.; Li, M.; Liu, D.; Wang, Z.; Li, Q.; Cheng, H. A hyperspectral camouflage colorant inspired by natural leaves. Adv. Mater. 2023, 35, e2302973. [Google Scholar] [CrossRef] [PubMed]
  100. Huang, Z.; Long, L.; Gao, Y.; Tang, Z.; Zhang, J.; Xu, K.; Ye, H.; Liu, M. A color-changing biomimetic material closely resembling the spectral characteristics of vegetation foliage. Small 2023, 20, e2303966. [Google Scholar] [CrossRef]
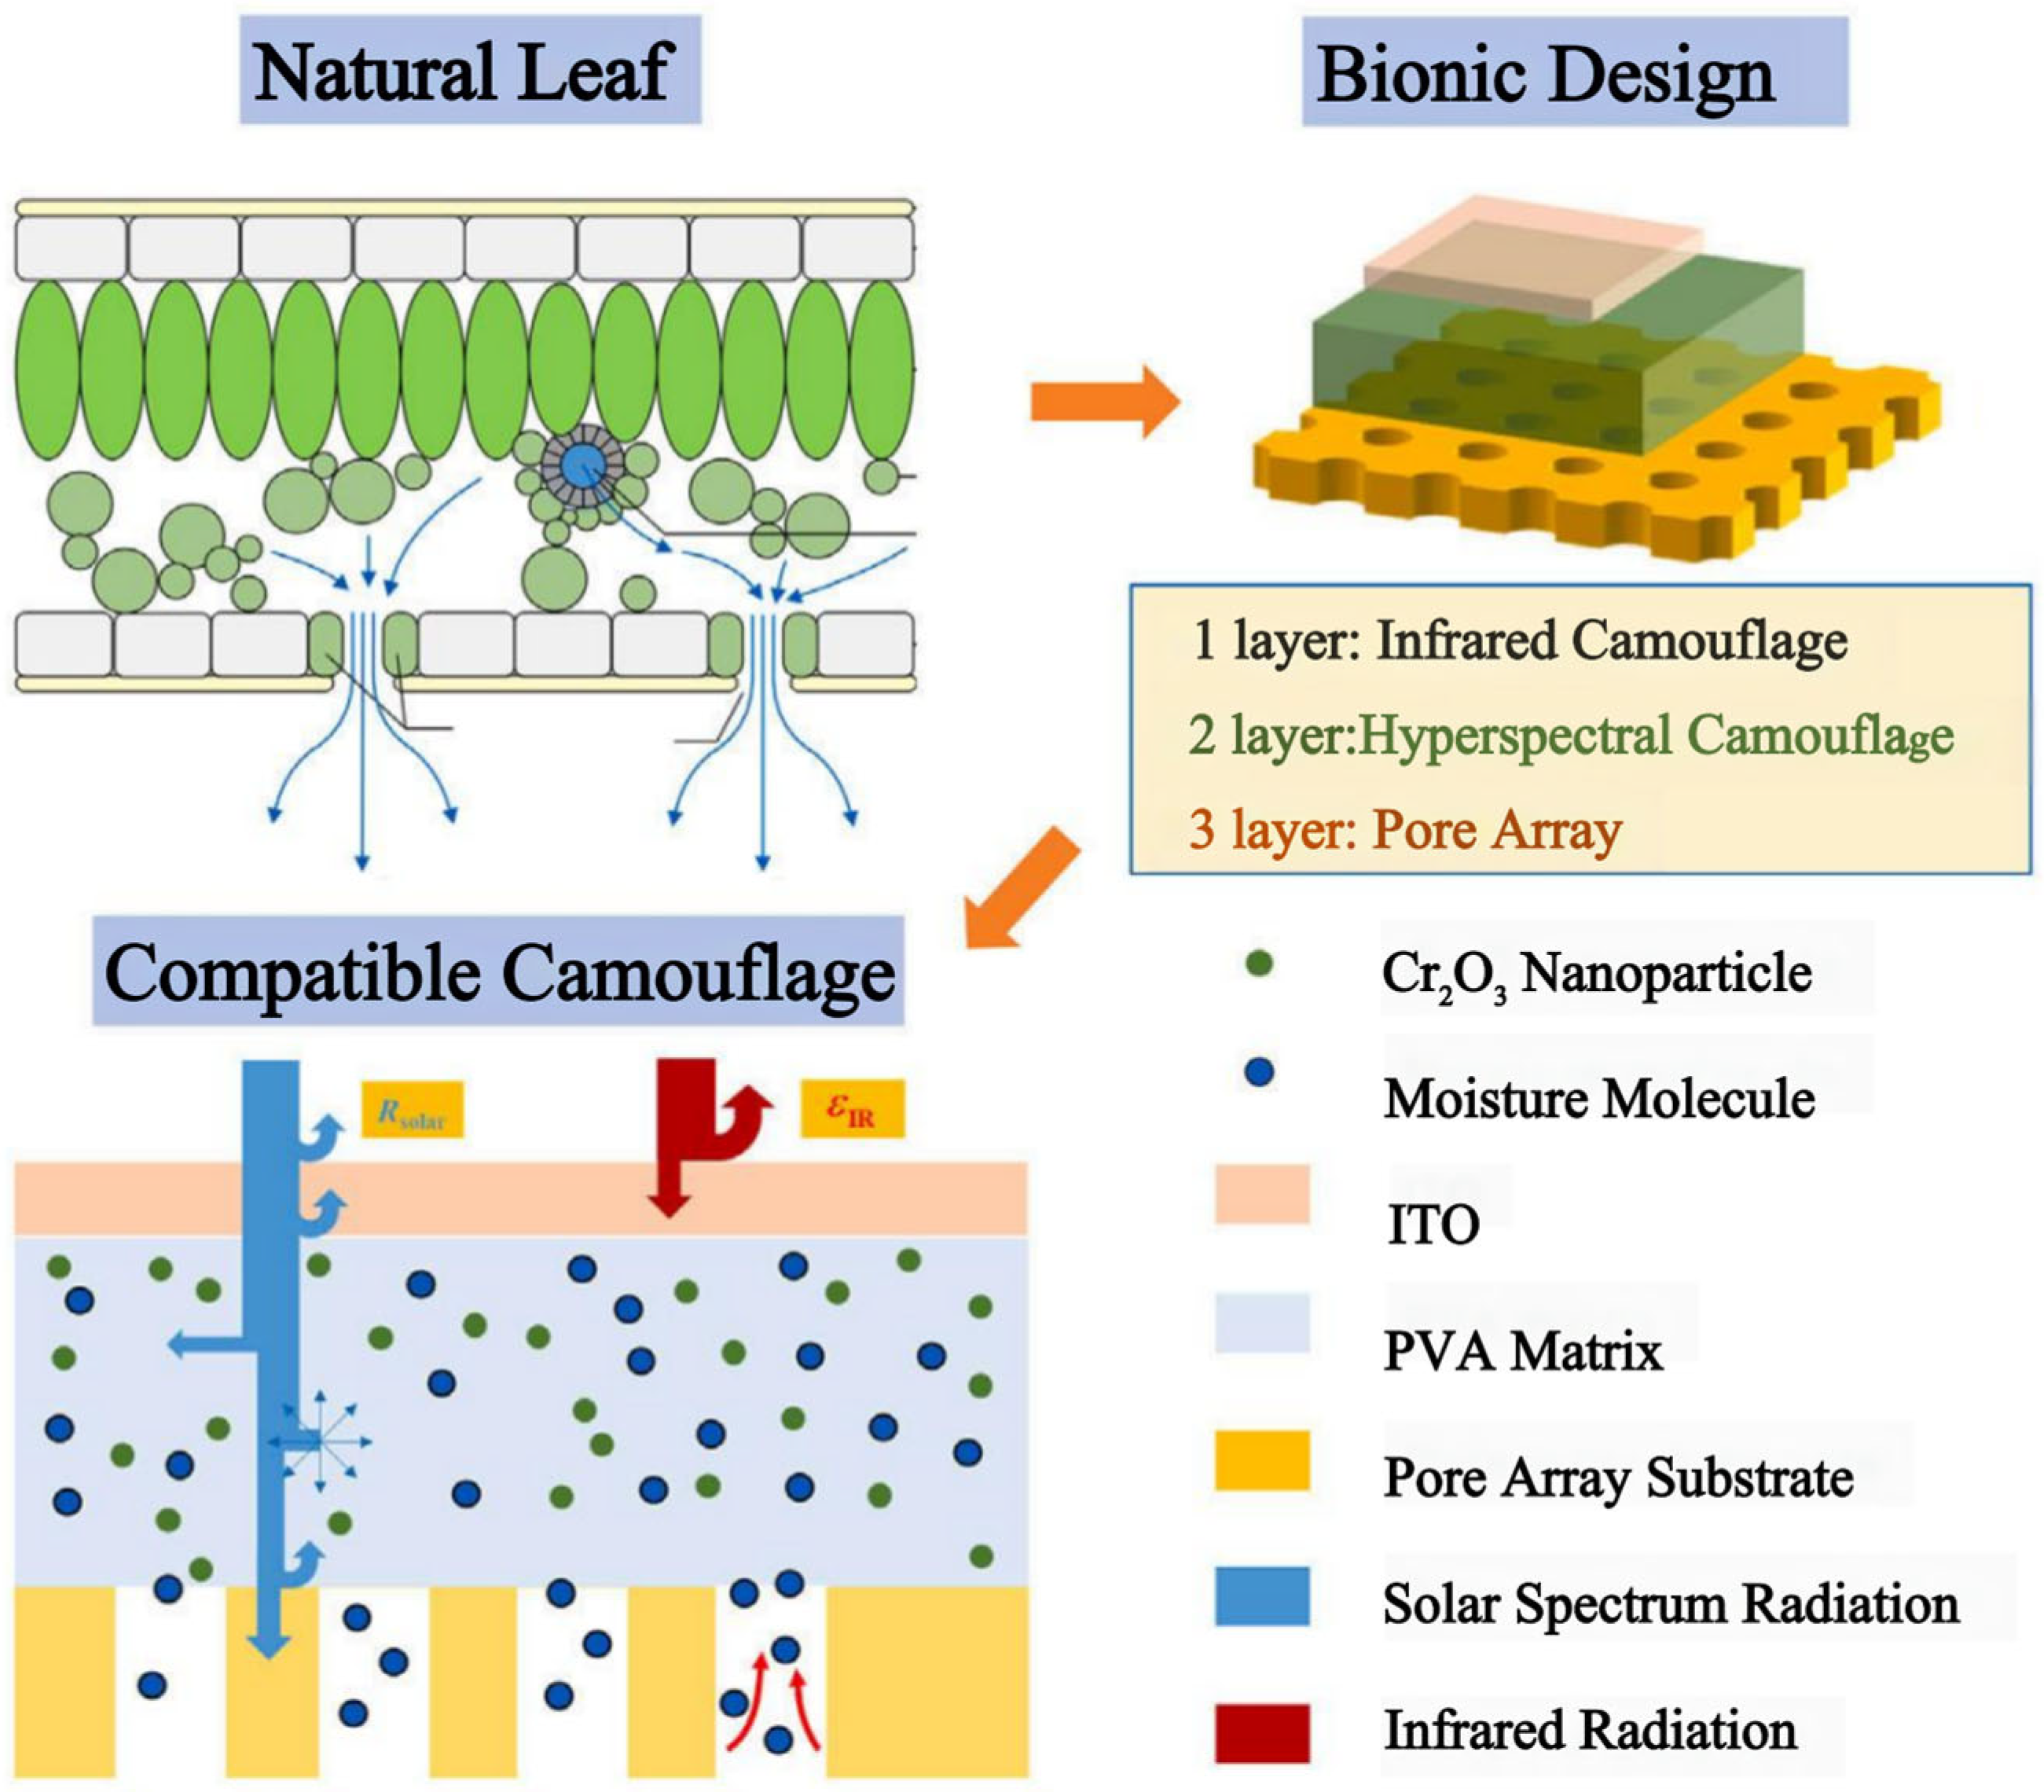
  101. Xu, K.; Long, L.; Yang, W.; Huang, Z.; Ye, H. Bionic metamaterial for multispectral-compatible camouflage of solar spectrum and infrared in the background of vegetation. Cell Rep. Phys. Sci. 2024, 5, 101798. [Google Scholar] [CrossRef]
Figure 1. High spectral imaging detection technology for green vegetation background.
Applsci 14 04404 g001
Figure 2. Solar spectral reflectance and transmittance of plant leaves [24].
Applsci 14 04404 g002
Figure 3. | Classic camouflage pattern. (A) The tiger-stripe camouflage of US military, (B) the leaf camouflage of Germany and former Soviet Union, and (C) the frog-shaped camouflage of US military.
Applsci 14 04404 g003
Figure 4. | Schematic diagram of the preparation processes of the biomimetic materials [11].
Applsci 14 04404 g004
Figure 5. | VIS–NIR diffuse reflectance spectrum of samples and AG pigment. (A) Different concentrations of acid green (B,C) different ratios of acid green and acid yellow [14].
Applsci 14 04404 g005
Figure 6. | Structure of bionic composite material [92].
Applsci 14 04404 g006
Figure 7. | Schematic view of procedure for preparing poly(urea-formaldehyde) microcapsules via in situ polymerization [13].
Applsci 14 04404 g007
Figure 8. Structure of biomimetic camouflage materials imitating plant-leaf organs [90].
Applsci 14 04404 g008
Figure 9. | (A) Three-dimensional profile of the BPSSM, (B) three-dimensional profile of the cross-section of the BPSSM, (C) structure diagram of leaves [93].
Applsci 14 04404 g009
Figure 10. | Four photographs show the seasonal changes of tree canopies throughout the growing season from spring to autumn. (A,B) show the time-lapse camera and temperature data logger under the radiation shield. (C) 10 May. (D) 18 July. (E) 2 October. (F) 21 October. 1: red maple, 2: sugar maple, 3: white ash, 4: pignut hickory [97].
Applsci 14 04404 g010
Figure 11. | Color-change model and visible images of the CCBM. Micrographs of the slices of (A) green and (B) yellow E. aureum foliage. (C) Schematic diagram of the color-change model. Micrographs of the slices of the CCBM in (D) green and (E) yellow. (F) Visible images of potted plants obtained by cutting the CCBM in green and yellow colors [100].
Applsci 14 04404 g011
Figure 12. | Three-ayer structured metamaterials inspired by the spectral characteristics of natural leaves in the solar and infrared bands [101].
Applsci 14 04404 g012
Disclaimer/Publisher’s Note: The statements, opinions and data contained in all publications are solely those of the individual author(s) and contributor(s) and not of MDPI and/or the editor(s). MDPI and/or the editor(s) disclaim responsibility for any injury to people or property resulting from any ideas, methods, instructions or products referred to in the content.

