Article

Physicochemical Characteristics, Vitamin C, Total Polyphenols, Antioxidant Capacity, and Sensory Preference of Mixed Juices Prepared with Rose Fruits (Rosa rugosa) and Apple or Strawberry

by
Andrzej Cendrowski
1,*,
Jarosław L. Przybył
2 and
Marcin Studnicki
3
1
Division of Fruit, Vegetable and Cereal Technology, Department of Food Technology and Assessment, Institute of Food Sciences, Warsaw University of Life Sciences-SGGW, Nowoursynowska 159 Str., 02-776 Warsaw, Poland
2
Department of Vegetable and Medicinal Plants, Institute of Horticulture Sciences, Warsaw University of Life Sciences-SGGW, Nowoursynowska 159 Str., 02-776 Warsaw, Poland
3
Department of Biometry, Institute of Agriculture, Warsaw University of Life Sciences-SGGW, Nowoursynowska 159 Str., 02-776 Warsaw, Poland
*
Author to whom correspondence should be addressed.
Appl. Sci. 2024, 14(1), 113; https://doi.org/10.3390/app14010113
Submission received: 28 November 2023 / Revised: 14 December 2023 / Accepted: 19 December 2023 / Published: 22 December 2023

Abstract

:
One of the main factors in the poor use of rose fruits (Rosa rugosa) for juice production is the tart-sour taste of the raw material. The aim of the present study was to evaluate the physicochemical characteristics (pH, titratable acidity, total soluble solids, and colour), vitamin C, total polyphenols, antioxidant capacity only performed by DPPH assay, and sensory preference of mixed juices prepared on the basis of rose fruits (Rosa rugosa). The pH values, total acidity values, total soluble solids, and colour on the CIE L*a*b* scale of mixed juices were in the range of 3.47–3.96, 0.94–1.36 g citric acid/100 mL, 15.8–21.1 °Brix, and L* 77.46–87.38, a* 1.90–13.90, b* 30.18–54.39, respectively. The mixed juices showed high contents of total phenolic compounds (116.21–250.48 mg GAE/100 mL), total vitamin C (64.18–132.21 mg/100 mL), and DPPH scavenging capacity (30.15–39.23 µg Trolox/mL). Rose-apple juices (AC1 and AC2) were rated best for tartness and sourness (least tart—3.5 and 3.32, least sour—4.73 and 4.43 for AC1 and AC2 juice, respectively), and also for overall impression (4.93 and 4.86 for AC1 and AC2 juice, respectively). The mixed-rosa juices can be an alternative for adding nutritional value.

1. Introduction

The fruit sector not only is looking for the possibility of improving its technological processes in order to preserve nutrients as much as possible, but also raw materials that, if properly processed, can expand the available range of wholesome food with health-promoting properties. In addition, processing often highly perishable fruit into longer-lasting, storable, and marketable products also allows for the addition of economic value to the raw materials used [1]. Fruits and their derived products are good sources of antioxidants which when consumed reduce the risk of inflammations, mutagenicity, and carcinogenicity [2]. Plant metabolites found in fruits have a direct impact on their sensory properties. The taste of fruits is directly influenced by primary metabolites (sugars and acids), and their aroma, colour, and health properties are influenced by secondary metabolites (polyphenols, terpenoids, aromatic substances) [3].
Rose fruits, apples, and strawberries are examples of foods with bioactive compounds and functional potential. Rose species have long been used for food and medicinal purposes in many cultures. Rose fruits are a rich source of polyphenolic compounds belonging to the group of natural antioxidants and other bioactive substances, including tocopherol, bioflavonoids, β-carotene, ascorbic acid, lycopene, pectins, organic acids, tannins, sugars, amino acids, essential oils, triterpenoids, and steroids [4,5,6,7]. The popularity of apples is associated not only with high taste values (fruits can be sweet or sour depending on the variety), but also with high dietary and health value. Apples (Malus domestica) are a source of polyphenol antioxidants, which occur in the form of flavonols, flavanols, and their oligomers and polymers [8]. The presence of phenolic compounds, organic acids, and aromatic substances in apples may reduce the risk of chronic diseases such as cancer, type II diabetes, and cardiovascular diseases, and also have anti-allergic properties [9,10]. Strawberries (Fragaria x ananassa Duchesne) are very popular due to their desirable sweet taste, attractive aroma, and red colour. They are characterized by a high content of polyphenols, flavonoids, vitamin C, and minerals and therefore have an impact on human health and disease prevention [11,12,13,14]. In the food industry, anthocyanins found in strawberries are used as natural pigments [13]. Strawberries have astringent and diuretic properties and therefore are described in many folk medicine sources and as a potential medicine [15]. Strawberry juices are used to treat inflammation of the nerves and lungs, and the paste is used in folk medicine to treat skin and wounds [16]. The antioxidants in strawberries may help reduce the risk of cardiovascular events and thrombosis [12,16,17].
Among fruit products, juices are characterized by high antioxidant potential. In Poland, apples and strawberries, rich in natural antioxidants, are very popular fruits for the production of juices. In terms of crop volumes, Poland is in the forefront of global and European producers of these types of fruit. In the production of strawberries, Poland was fifth in the world and second in the European Union and third in the world and first in Europe in the production of apples [18,19]. Poland produces more than 3.6 million tons of apples annually and 195.6 thousand tons of strawberries [12,18,19].
The main factor in the limited use of rose fruits for juice production is the tart-sour taste of the raw material. Because of this, it is very difficult to obtain from rose fruits a product that is tasty and of good quality at the same time. Apple and strawberry juices are products that have high nutritional value, mainly due to the richness of phenolic compounds and easily digestible sugars, which influence the sweetness of the product [20]. Thus, apple juice or strawberry juice can be a good option to combine with rose juice in a formulation of mixed juice. In the beverage segment, juice originating from mixed fruits is a new market opening with great potential [21]. Mixed beverages show an advantage of allowing for adjustments of the formulations aiming to increase the consumer preference and the potential health benefits [22]. Mixed fruit products are becoming increasingly popular among consumers because in addition to combining the nutritional properties of two or more fruits, they also provide pleasant sensory properties [23]. Preparing mixed products requires the use of optimization tools to precisely determine the appropriate proportion of ingredients based on sensory and nutritional values [24]. Therefore, it is very desirable to determine the possibility of combining rose juice with strawberry or apple juice in order to obtain a product attractive in terms of colour, taste, and odour and rich in bioactive compounds. To the best of the authors’ knowledge, there is no study that evaluated the development of mixed juices on the basis of the rose fruits of Rosa rugosa.
For this reason, the aim of this study was to prepare mixed fruit juices based on Rosa rugosa juice in order to improve its sensory properties while maintaining a high content of bioactive components. The processed fruit juice was mixed with different percentages of apple, strawberry, and rosa fruit juice. Rose, apple, and strawberry fruits were selected to be used in this work because of their high production in Poland. In the current study, the physicochemical characteristics (pH, titratable acidity, total soluble solids, and colour), vitamin C (measured by HPLC method), total polyphenols (measured by Folin-Ciocalteu reagent’s method), antioxidant capacity (performed by DPPH assay), and sensory properties of mixed fruit juices were investigated.

2. Materials and Methods

2.1. Plant Material and Juice Production

Plant material consisted of rose fruits (Rosa rugose), strawberries (Fragaria x ananassa Duch.) of the variety Rumba, and apples (Malus domestica) of the variety Szampion, collected in September of 2021 in Poland. The rose fruits were harvested at a plantation of the company Polska Róża Sp. z o.o., located in the Kotlina Kłodzka. Strawberries were harvested at a farm plantation located in the Zakroczym near Nowy Dwór Mazowiecki. Apples were harvested at a plantation of the Warsaw University of Life Sciences-SGGW located in Warsaw.
The research material consisted of various variants of mixed juices prepared from rose fruit juices (Rosa rugosa), strawberries, and apples (Table 1). Individual fruits (rose, strawberry, and apple) were homogenized separately in a Thermomix® device (Vorwerk, Poland). Then, the homogenized raw materials were separately subjected to enzymatic treatment for 1 h at 50 °C. Enzymatic treatment consisted of adding pectolytic enzymes (Rohapect® 181030ST, AKE Łaszkiewicz, Dzida, Poland) at a dose of 2 mL/kg of raw material. Juices (rose, strawberry, and apple) were pressed on a self-made laboratory juice press equipped with a filter cloth with a mesh diameter of 500 µm and mixed according to Table 1. The various variants of mixed juices obtained were heat treated at 85 °C/15 min and then bottled into glass 100 mL bottles. For analysis, the obtained juices were stored in a refrigerator at 4–8 °C.

2.2. Chemicals and Reagents

Hydrochloric acid, 0.1 M sodium hydroxide, anhydrous sodium carbonate, and Folin-Ciocalteu reagent were purchased from Chempur (Piekary Śląskie, Poland). Gallic acid anhydrous (GAE), 2,2-diphenyl-1-picrylhydrazyl (DPPH), L-ascorbic acid, oxalic acid, m-phosphoric acid,6-hydroxy-2,5,7,8-tetramethylchromane-2-carboxylic acid (Trolox), DL-dithiothreitol (DTT), and methanol were purchased from Sigma–Aldrich (Poznan, Poland). All reagents were of analytical grade.

2.3. Physicochemical Analysis

Determination of pH, Titratable Acidity, Total Soluble Solids, and Colour

The prepared juices were subjected to basic physicochemical analyses. Active acidity (pH) was determined in accordance with the Polish Standard PN-EN-1132:1999 using a calibrated electric pH meter (HI 221, Hanna Instruments Inc., Woonsocket, RI, USA) [25]. Titratable acidity (TA) was determined according to the Polish Standard PN-EN-12147:2000 using an automatic titrator TitroLine® 5000 (SI Analytics, Mainz, Germany) [26]. The results were expressed as g of citric acid per 100 mL of juice. Total soluble solids (TSS) were determined in accordance with the Polish Standard PN-90/A-75101:2002 using a Refracto 30PX refractometer (Mettler Toledo, Columbus, OH, USA) [27]. The results were expressed in °Brix. The colour of the juices was measured with a Konica Minolta CM-3600d colourimeter (Tokyo, Japan) on the CIE L*a*b* scale.

2.4. Determination of Total Phenolic Content

Samples of tested juices were diluted with distilled water in a ratio of 1:100 v/v. Total phenolic content (TPC) of juice samples was determined by Folin-Ciocalteu reagent’s method using a UV1650PC spectrophotometer (Shimadzu, Kyoto, Japan) [28]. Total phenolic content was expressed as mg gallic acid equivalents (GAE) per 100 mL of juice, based on the prepared calibration curve. The equation obtained from the calibration curve of gallic acid in the range of 5–50 mg/100 mL was y = 0.0334x + 0.1539 (r = 0.9965).

2.5. Determinations of Total Vitamin C (TAA), AA, and DHAA Content

For the determination of L-ascorbic acid (AA), samples of the tested juices were diluted with 2% oxalic acid in a ratio of 1:10 v/v and filtered through a 0.45 µm PTFE syringe filter to a chromatographic vial. For the determination of total vitamin C (TAA), samples of the tested juices were diluted in a 1:1 v/v ratio with a DL-dithiothreitol (DTT) solution and filtered through a 0.45 µm PTFE syringe filter to a chromatographic vial. Total vitamin C, L-ascorbic acid (AA), and L-dehydroascorbic acid (DHAA) were determined using high-pressure liquid chromatography coupled with a UV-VIS detector (Prominence HPLC system, Shimadzu, Japan) according to a previously published method [29]. The stationary phase was an Onyx Monolithic C18 column (100 × 4.6 mm, 5 μm, Phenomenex, Torrance, CA, USA). The mobile phase was a 0.1% m-phosphoric acid. The analysis was performed in an isocratic system at a flow rate of 1 mL/min. The chromatograms were recorded at a λ = 254 nm. The equation obtained from the calibration curve of AA in the range of 0.5–40 mg/100 mL was y = 480867x + 193017 (r = 0.999). The DHAA content in the samples was calculated as the difference between the total vitamin C and AA contents. All results were expressed in mg/100 mL of juice.

2.6. DPPH Assay

Antioxidant activity was determined with the radical scavenging activity (DPPH) method proposed by Yen and Chen [30] with some modifications. To 1 mL of the juice, 3 mL of methanol and 1 mL of DPPH solution were added and mixed. The absorbance of reagents mixture at 517 nm was measured accurately after 10 min using a UV1650PC spectrophotometer (Shimadzu, Japan). The corresponding Trolox values in μg, which were responsible for reducing DPPH• radicals by 50%, were read from the curve for Trolox. Taking into account dilutions and converting the mass of Trolox (250.259 g/mol) into μmol, the final result was expressed in μmol of Trolox per 1 mL of the tested juice.

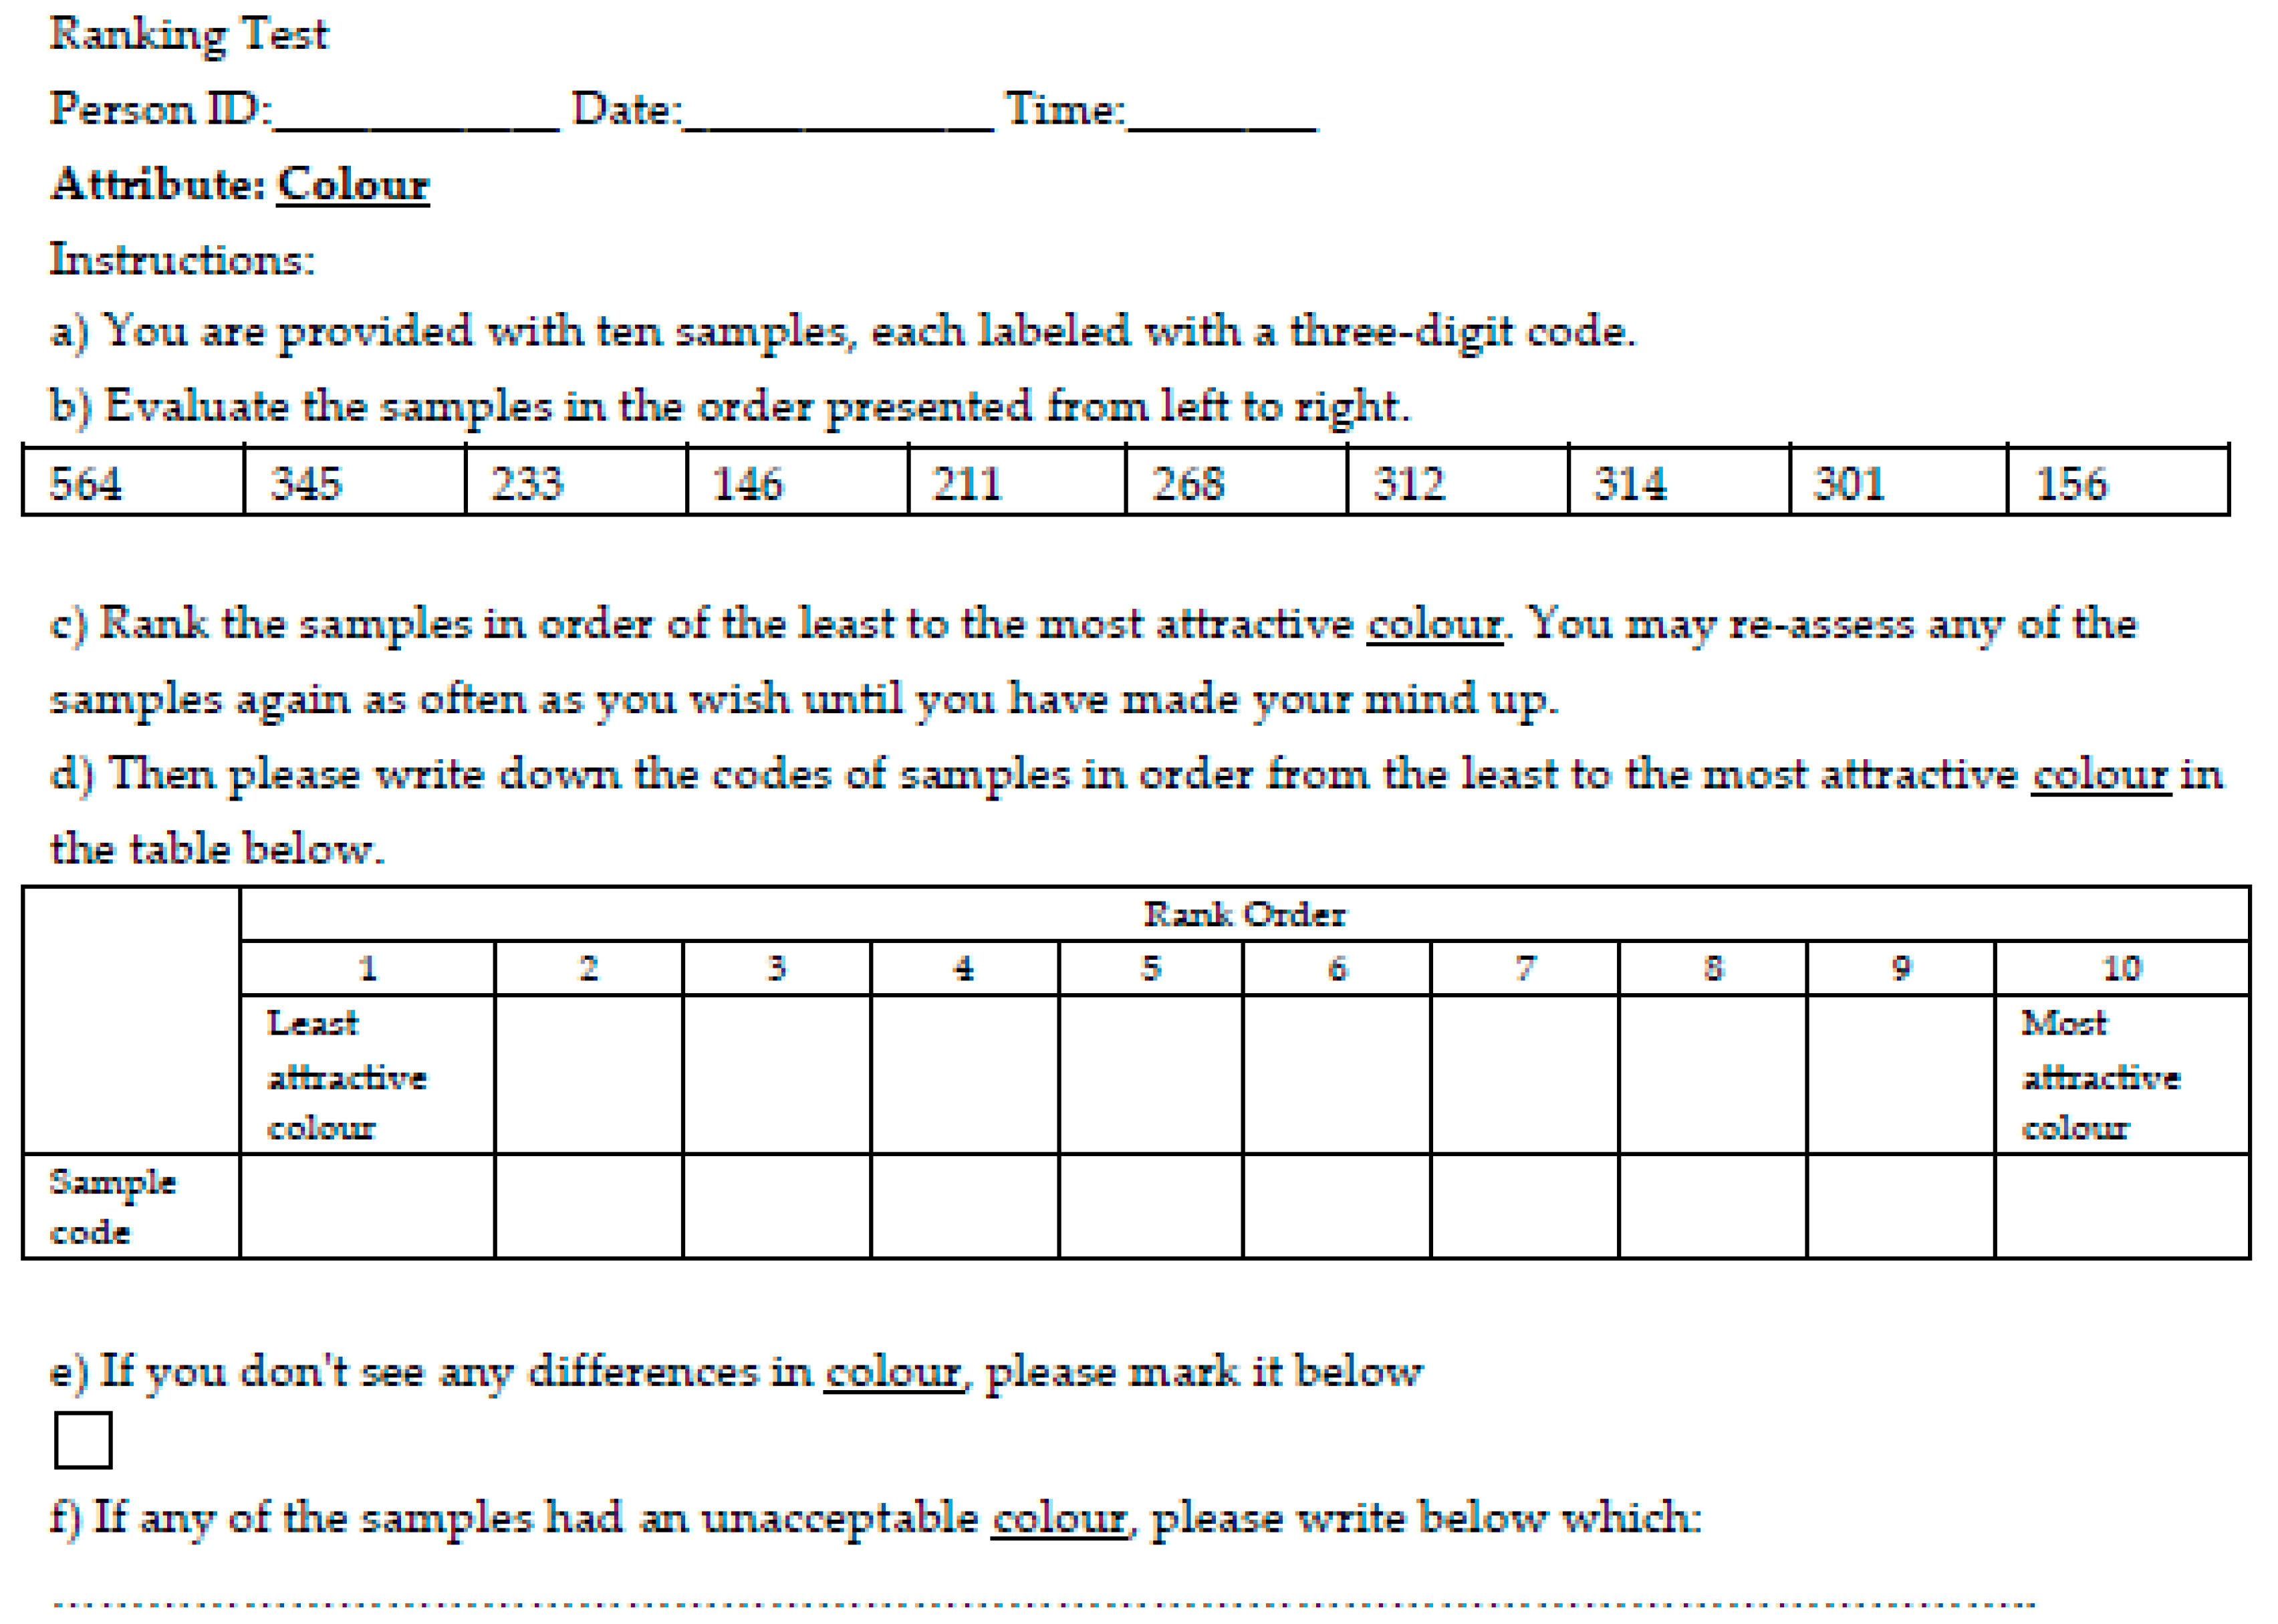
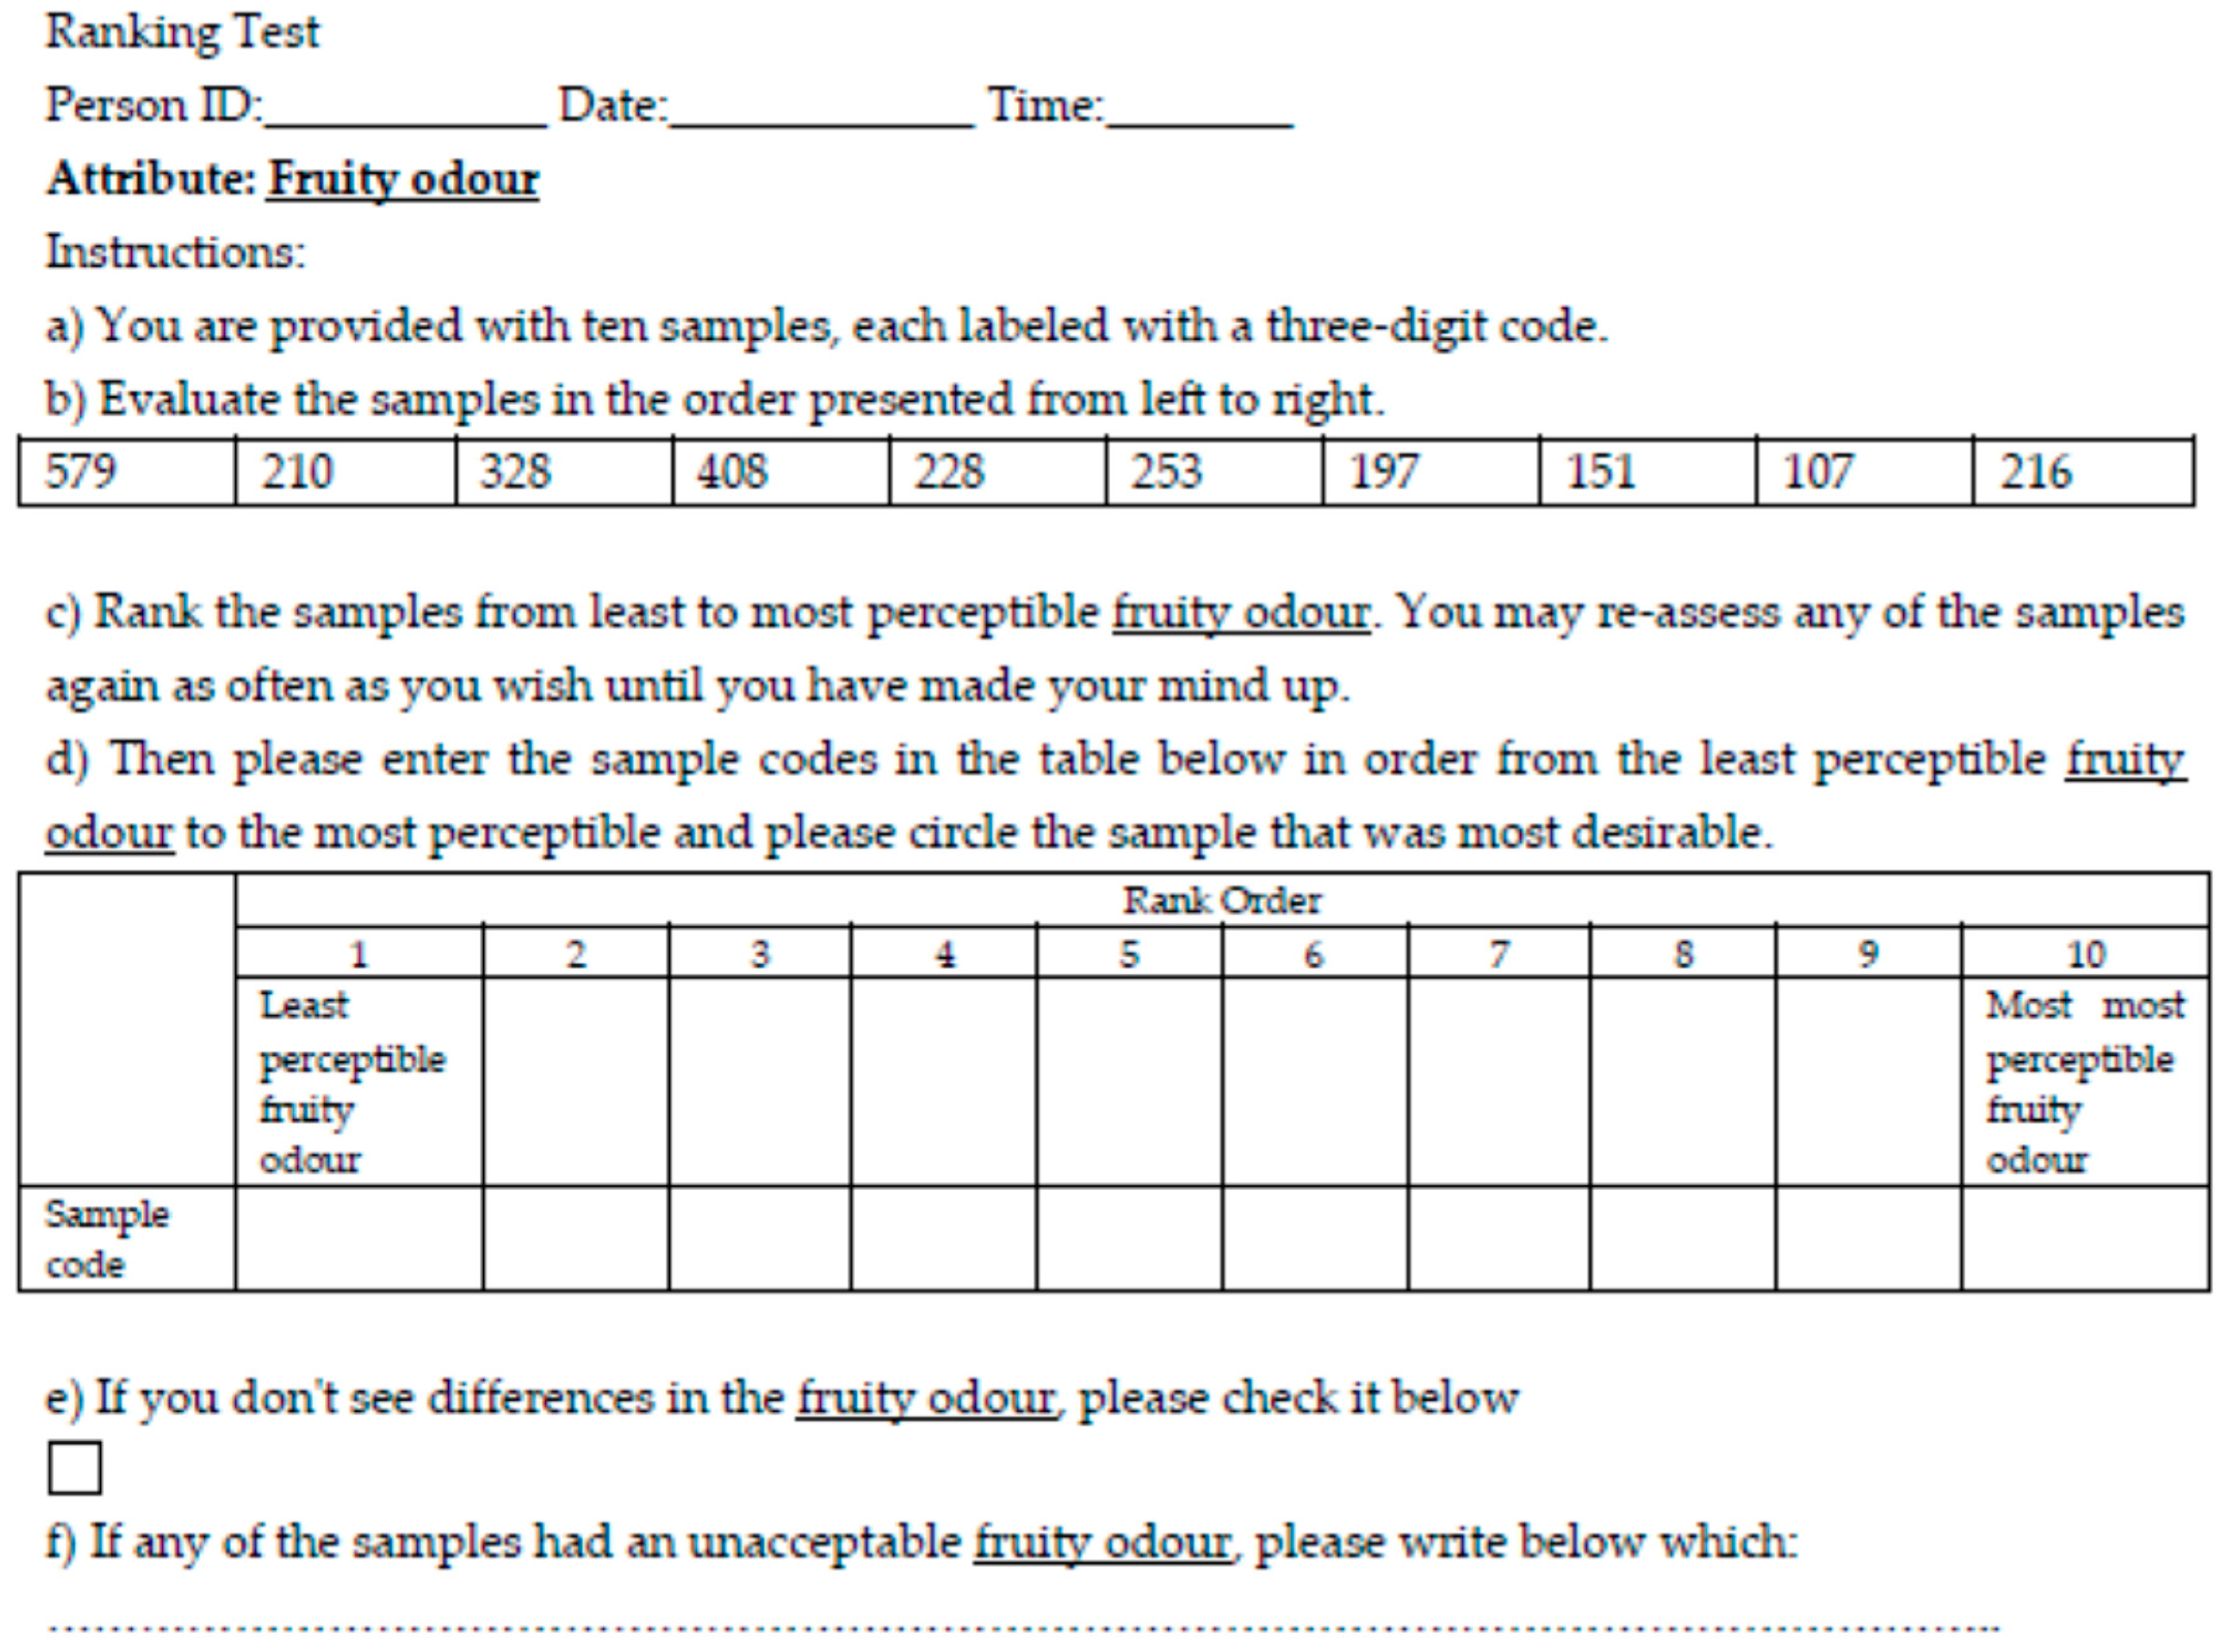
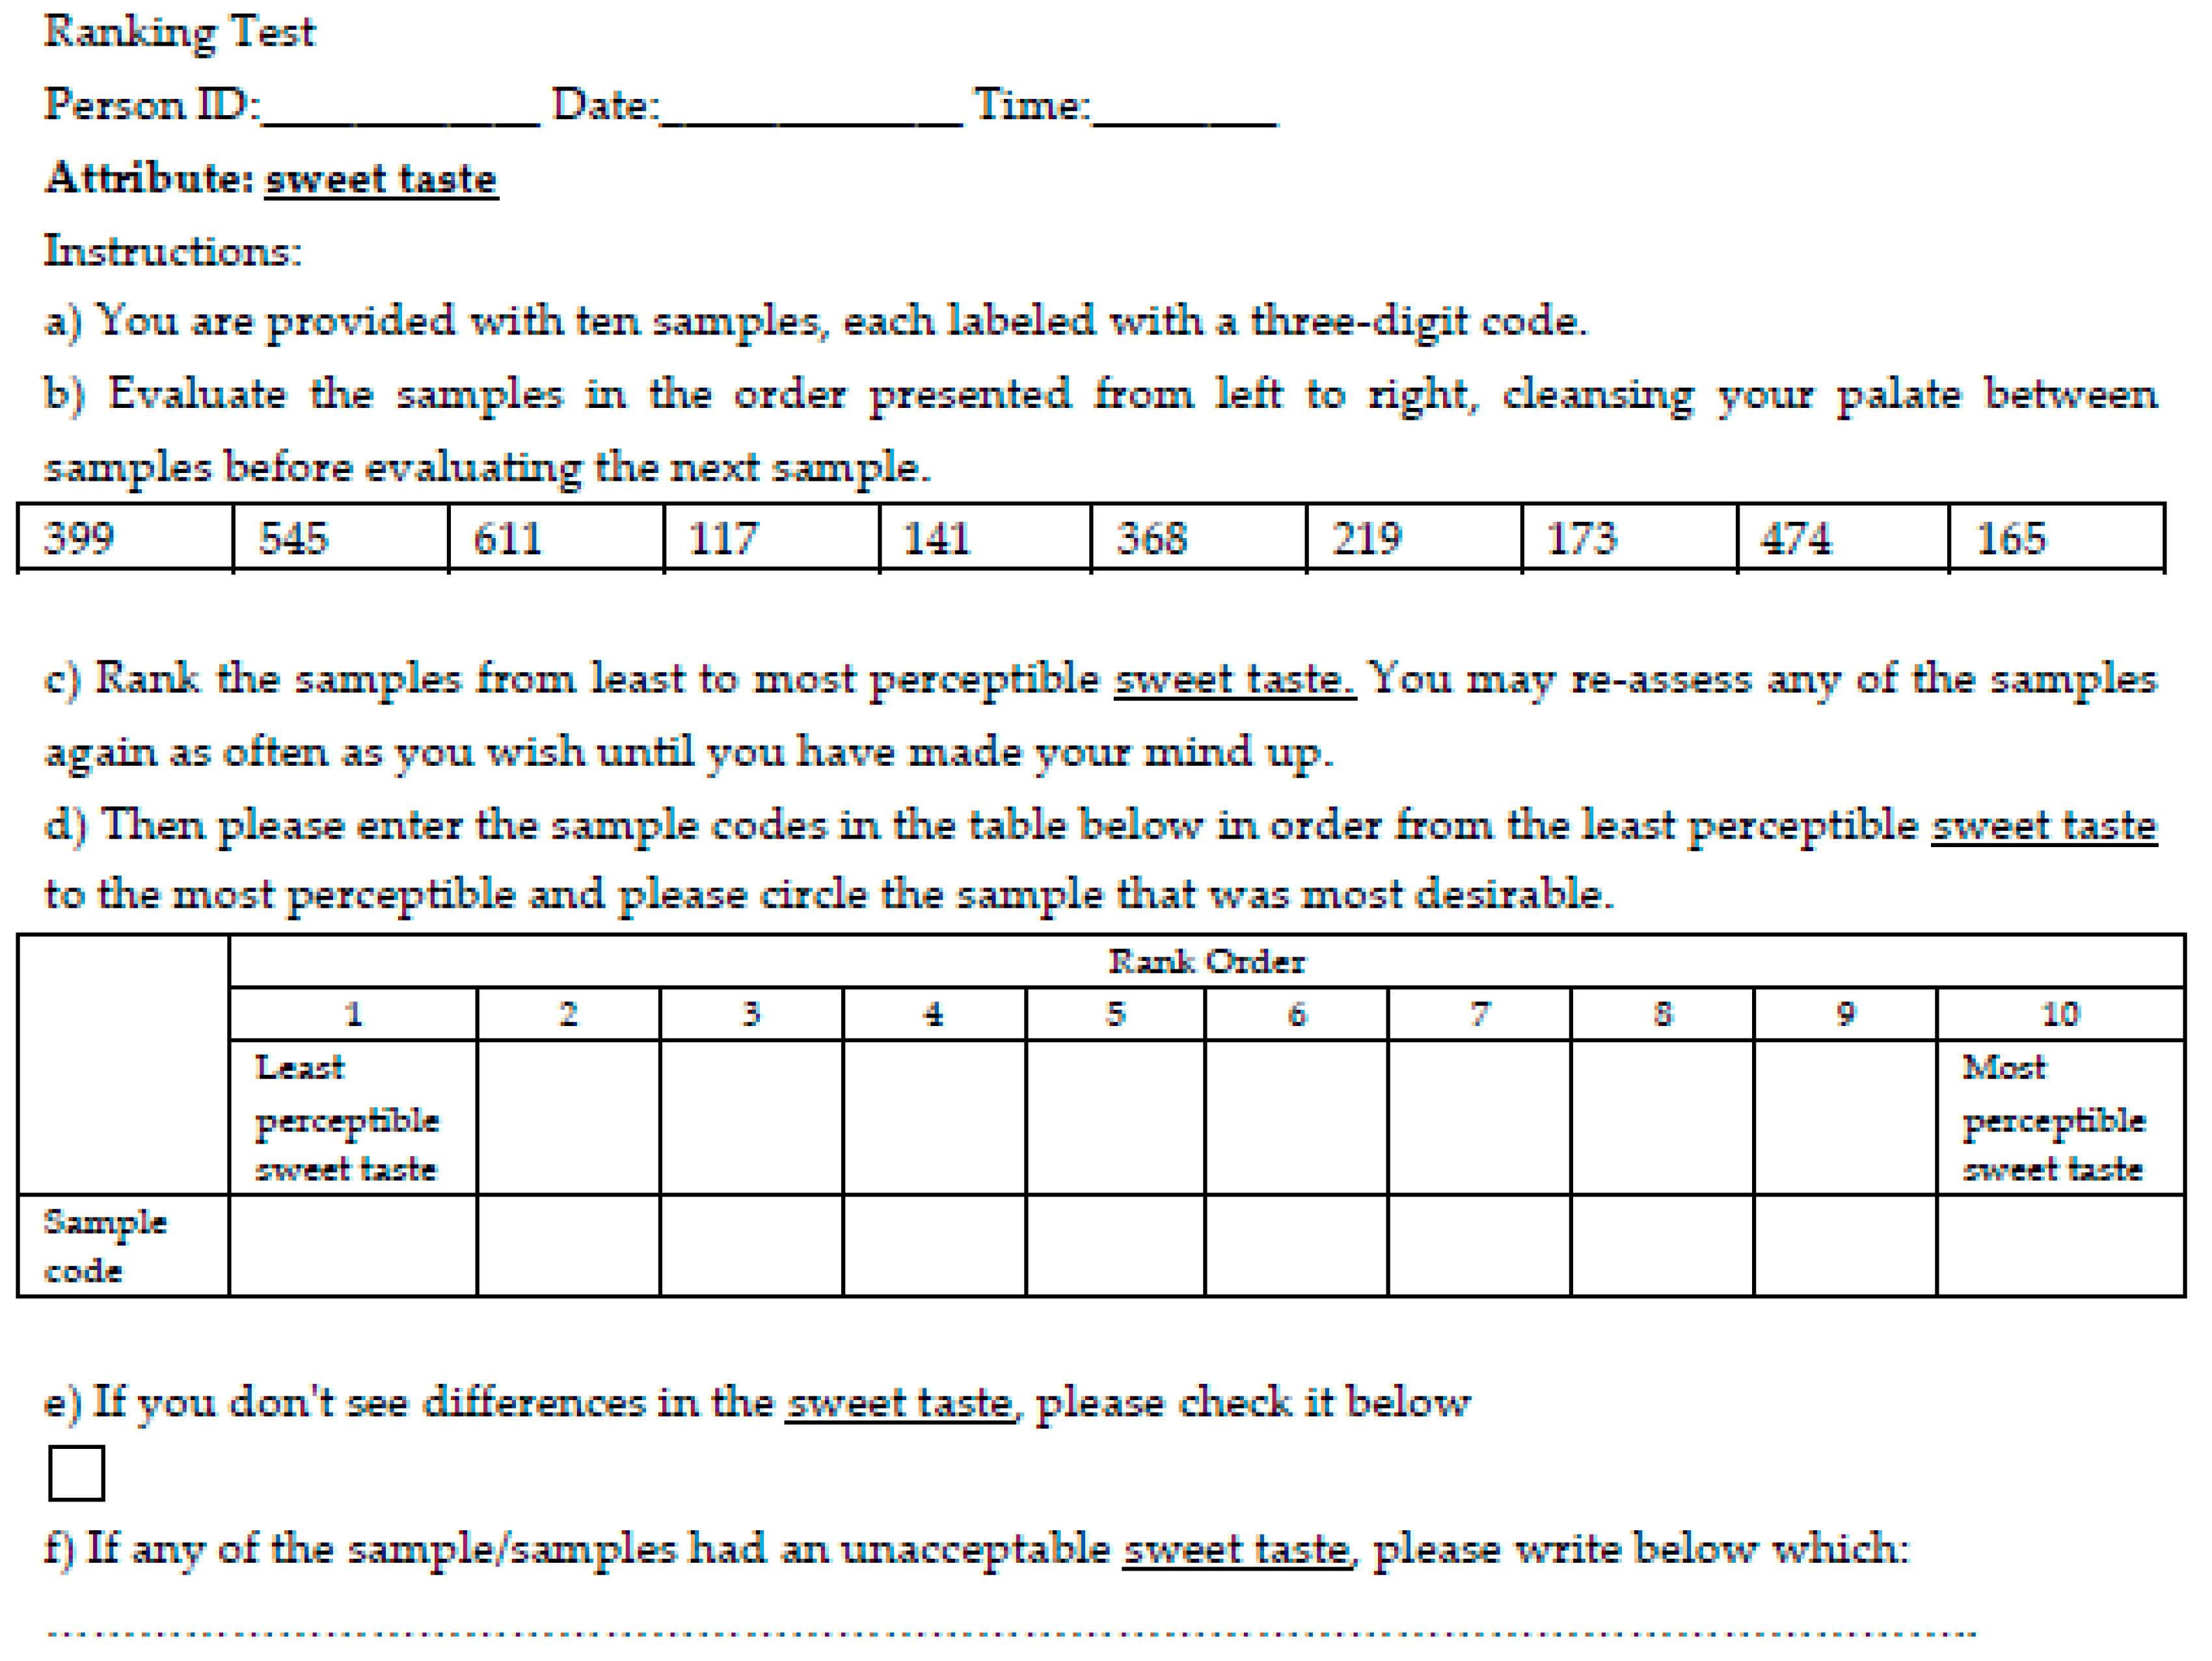
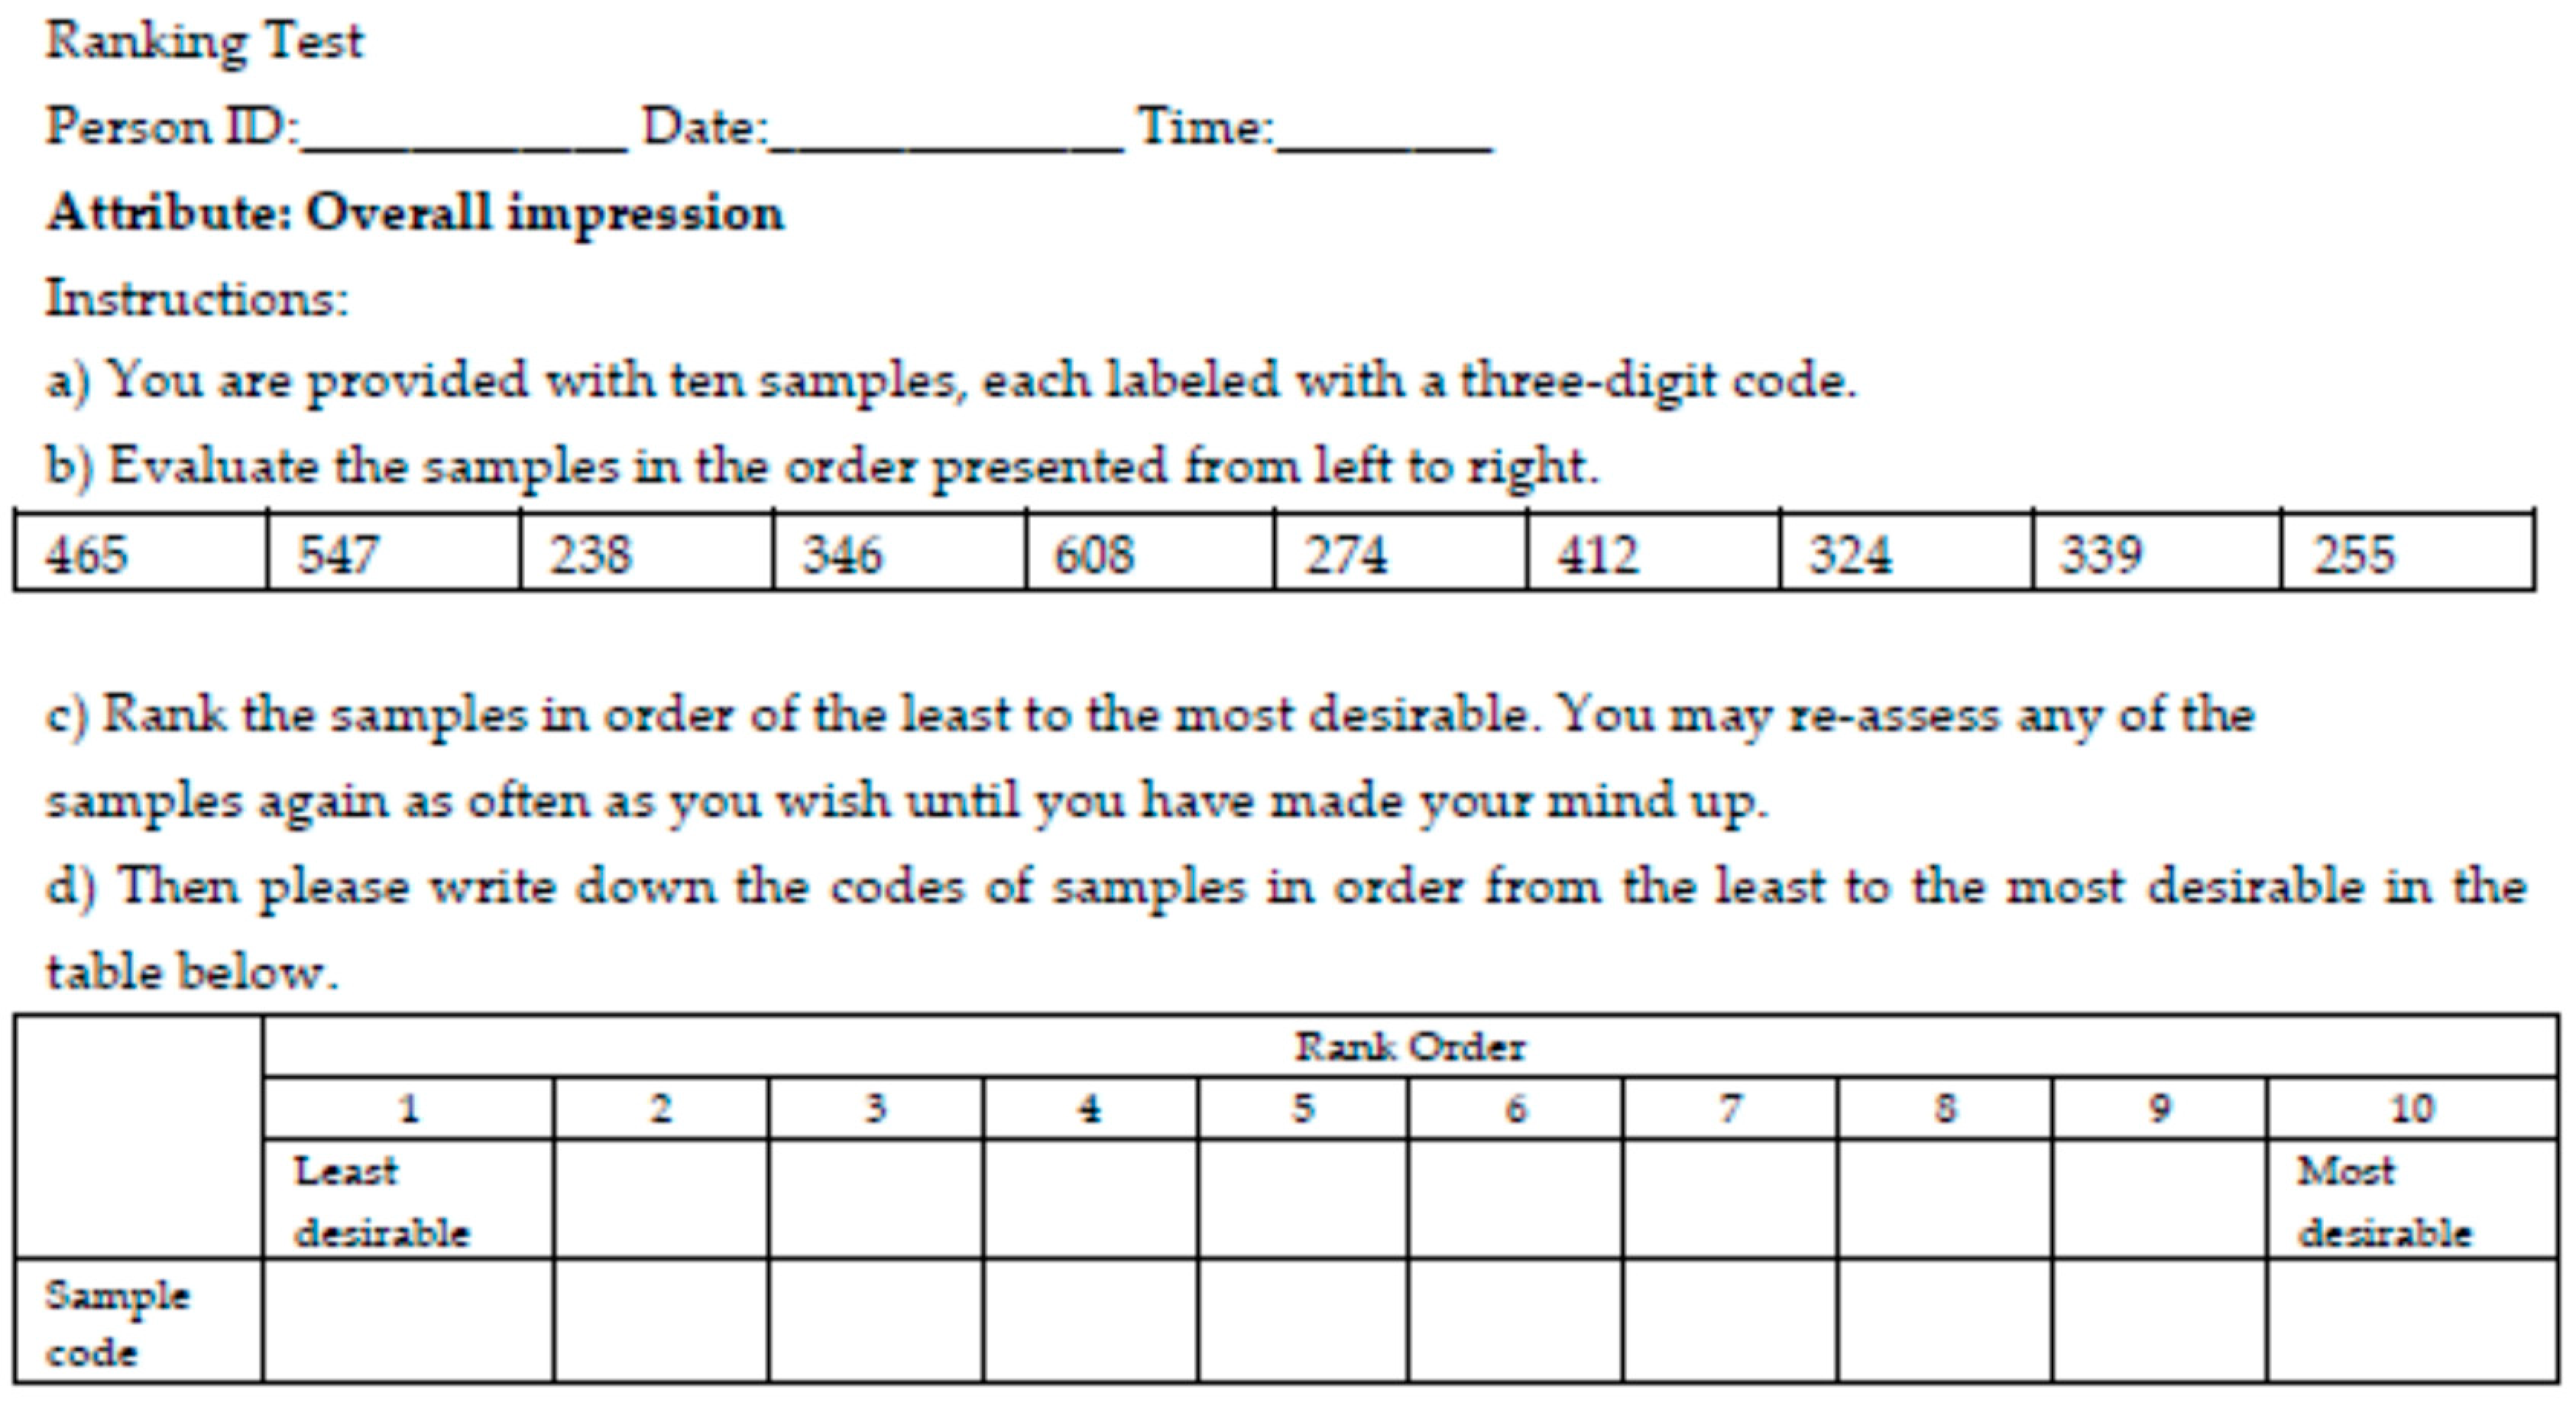
2.7. Sensory Evaluation

For fruit juices, colour, odour, and taste are the basic attributes determining the sensory quality. Samples were presented to thirty persons (15 females and 15 males between 18 and 40 years of age) in a consumer preference test [31]. The test was a pilot test (30 participants) and its main goal was to detect unacceptable attributes that could indicate defects in the technological process. The participants were recruited from staff and students of the Warsaw University of Life Sciences-SGGW based on their availability and interest for participation in this study. The persons did not communicate with each other, assessed the samples in daylight in a room at room temperature, and were provided with a glass of water to rinse their mouths between each test. Juice testing was performed in two sessions. Each sensory attribute was scored as a new test and new sample codes (a three-digit code) were assigned to each attribute assessed so that one test did not influence the next. All assessors were familiar with the test format (questionnaire) and were trained in the attributes assessed. They were asked to follow the instructions on the questionnaire (Appendix A). Samples were administered of twenty-five millilitres in clear glass containers at room temperature (approximately 20 °C). The following sensory attributes were assessed: colour, aromatic odour (floral scent), fruity odour, sweet taste, sour taste, tart taste (a drying out, roughening, and puckery sensation felt in the mouth), and overall impression. The assessor ranked the juice samples from the least attractive to the most attractive in terms of the tested feature and marked the codes of these samples in the survey, in which they could also enter the code of the sample considered unacceptable for a given feature. If it was impossible to determine differences in a given feature or if a given odour or taste was not detected, they also marked it on the survey. The ranking method was used for the assessment, with the option of indicating unacceptable variants, indicating the most desirable one, and with the option of stating that the indicated feature was not felt. When assessing colour, the most attractive variant received 5 points and the least 0. If the assessor did not distinguish colour among the samples, they all received 5 points, and if the assessor indicated unacceptable variants, they also received 5 points. Aromatic and fruity odour as well as sweet taste were ranked from the least to the most noticeable, and then the assessor marked the most desirable variant, which received 5 points, and further variants received one less point. In this case, the most desirable variant does not always coincide with the most noticeable juice variant, hence the score. If the assessor did not distinguish between the samples, all of them received 5 points, and if the assessor indicated unacceptable variants, they also received 5 points. The tart taste and sour taste were considered negative, so the least noticeable sample received 5 points and the most noticeable sample received 0 points. If the assessor did not detect a tart or sour taste, then all samples received 5 points. If the assessor indicated unacceptable variants, they also received 5 points. In the overall impression, the most desirable juice variant received 5 points, and the least desirable one received 0 points. The ranking method effectively allows for distinguishing the best and worst variants. However, it must be remembered that the worst option does not have to be bad. Therefore, it was possible to distinguish variants that were unacceptable in terms of a given feature and to distinguish these defective variants, as they also received 5 points.

2.8. Statistical Analysis

The production of fruit juices was achieved in two independent repetitions. All results determinations were carried out in triplicate and presented as a mean with standard deviation (SD). Statistical analysis was performed in the Statistica 13.3 (TIBCO Software Inc., Carlsbad, CA, USA). The effects of the different processing treatments on the measured compounds content were determined by ANOVA analysis of variance. The differences between means were evaluated with the Tukey HSD post hoc test (α = 95%). In order to study the relationships between sensory evaluation and physicochemical characteristics and between bioactive compounds and antioxidant activity, principal component analysis PCA was used. The results of the PCA analysis were displayed as biplots. To evaluate the consumer survey, regression analysis was used to describe the impact of consumer ranking on the overall impressions for individual juice variants.

3. Results and Discussion

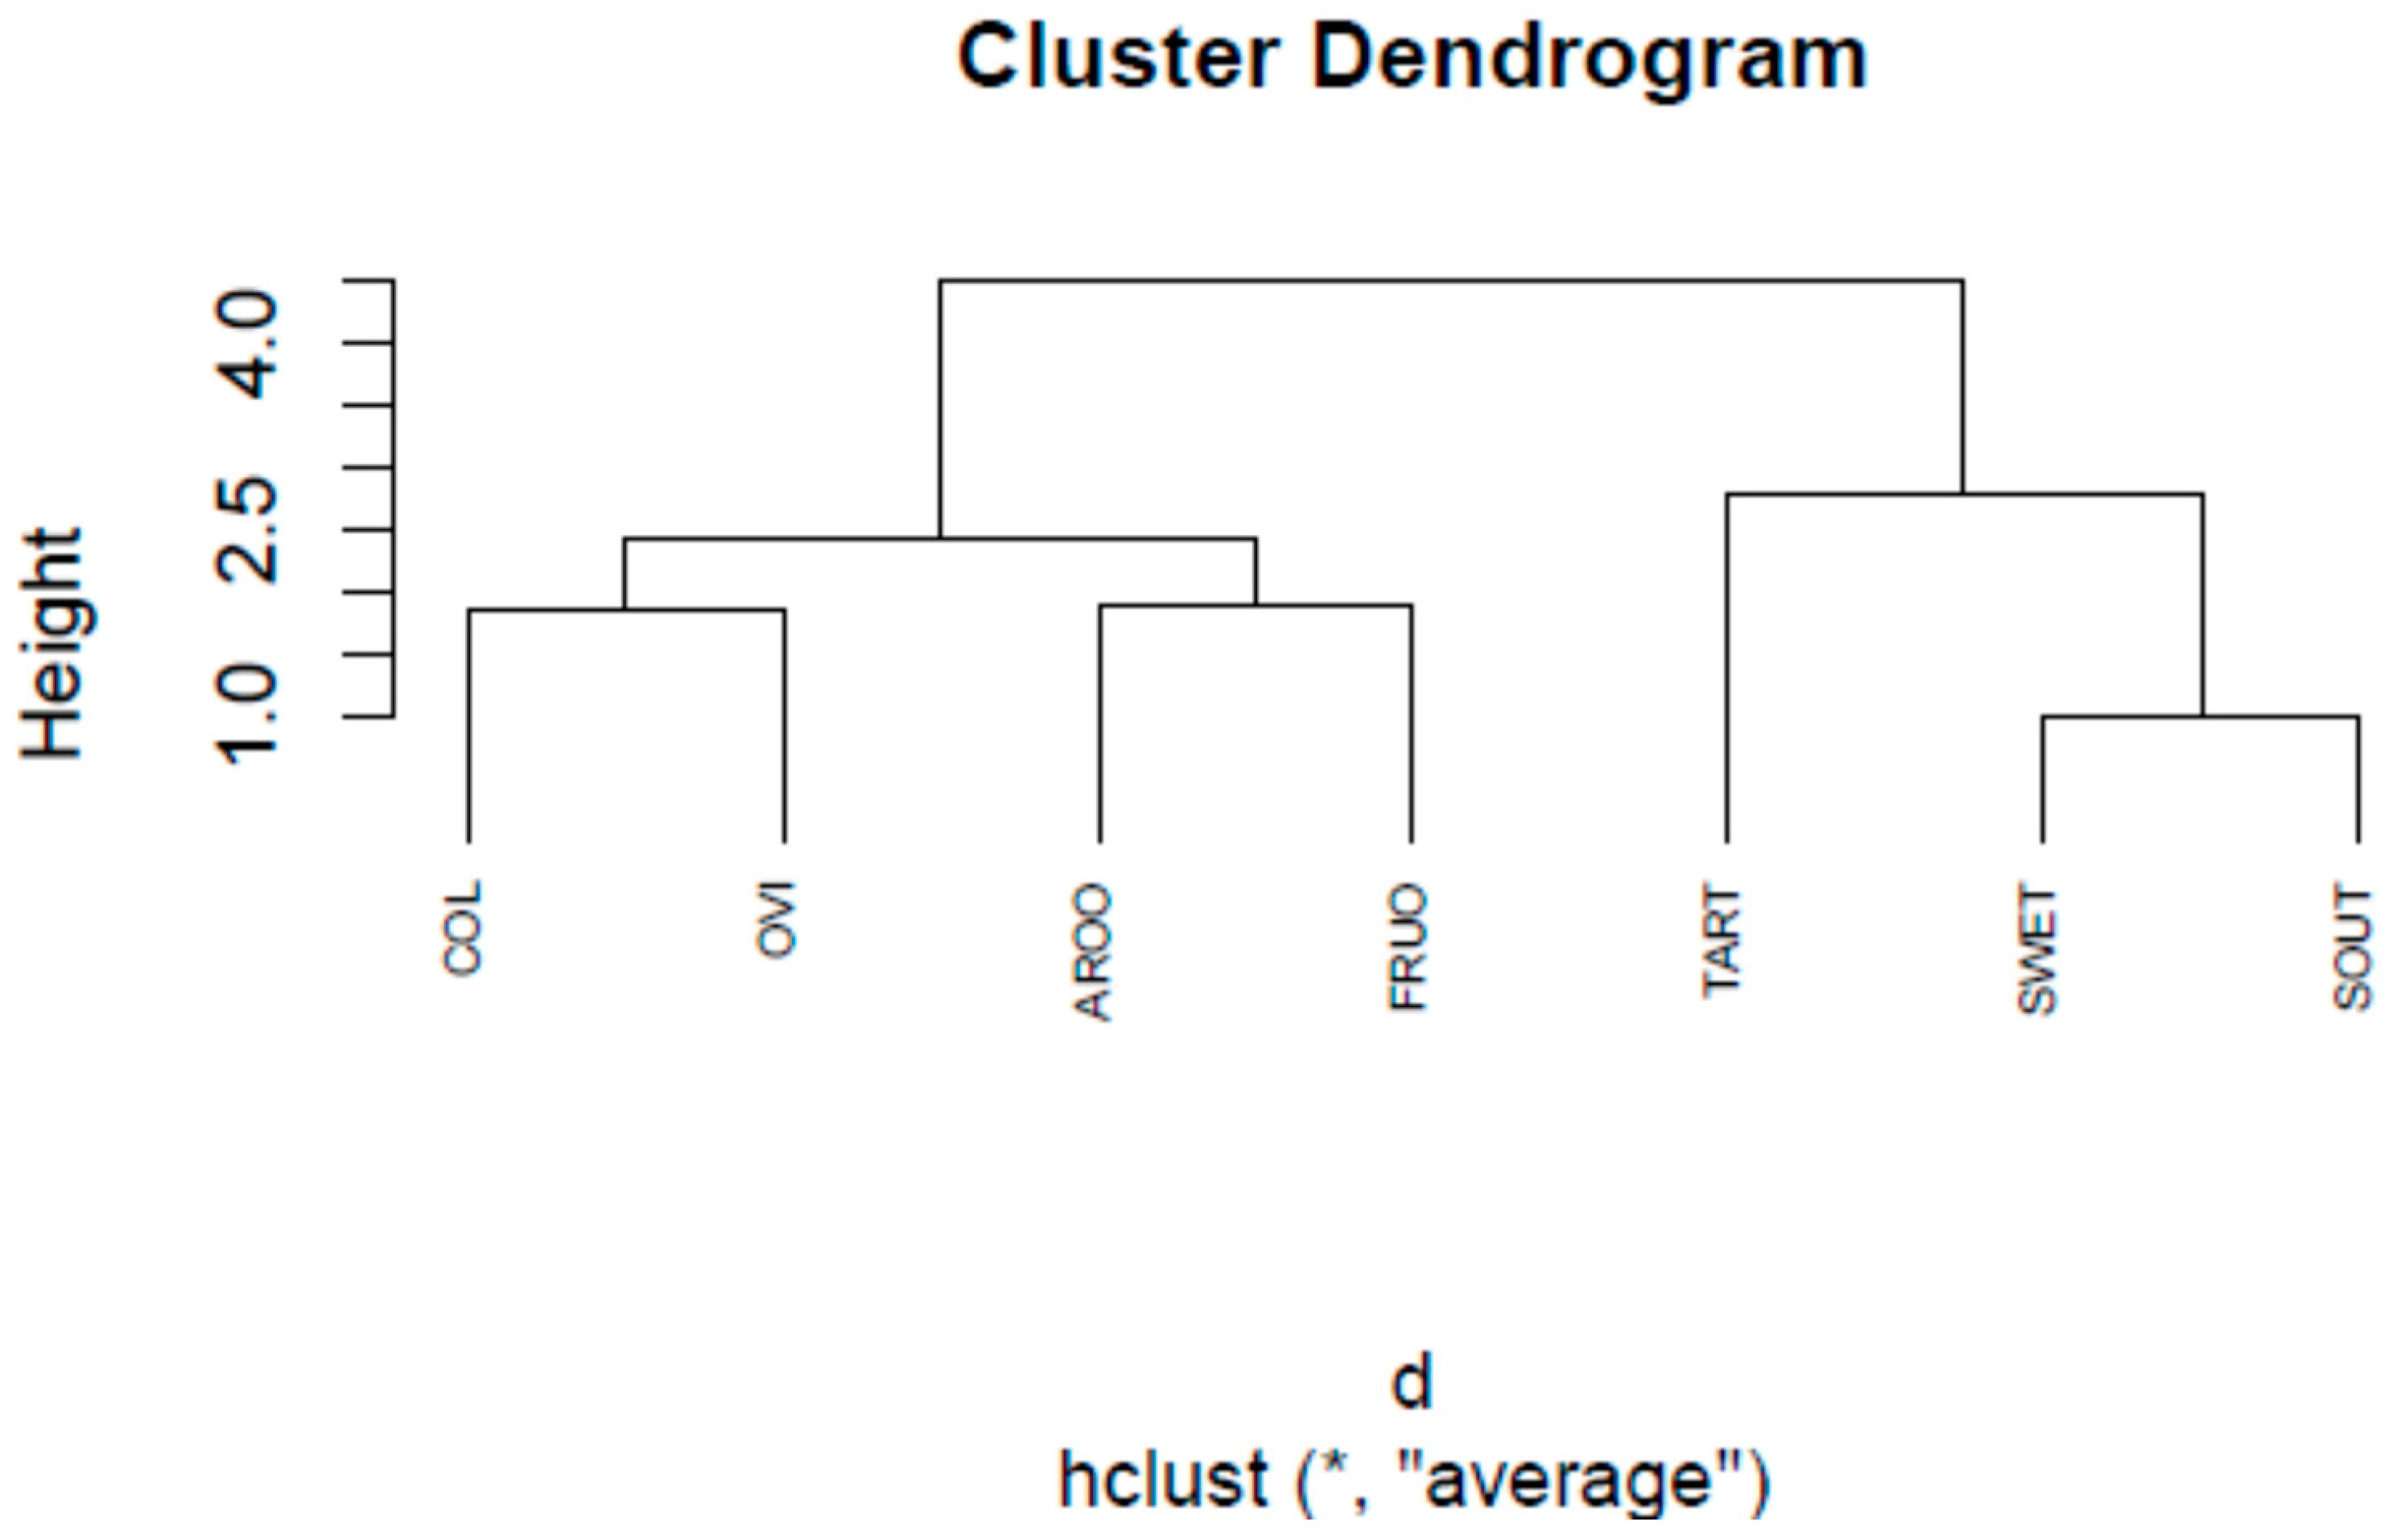
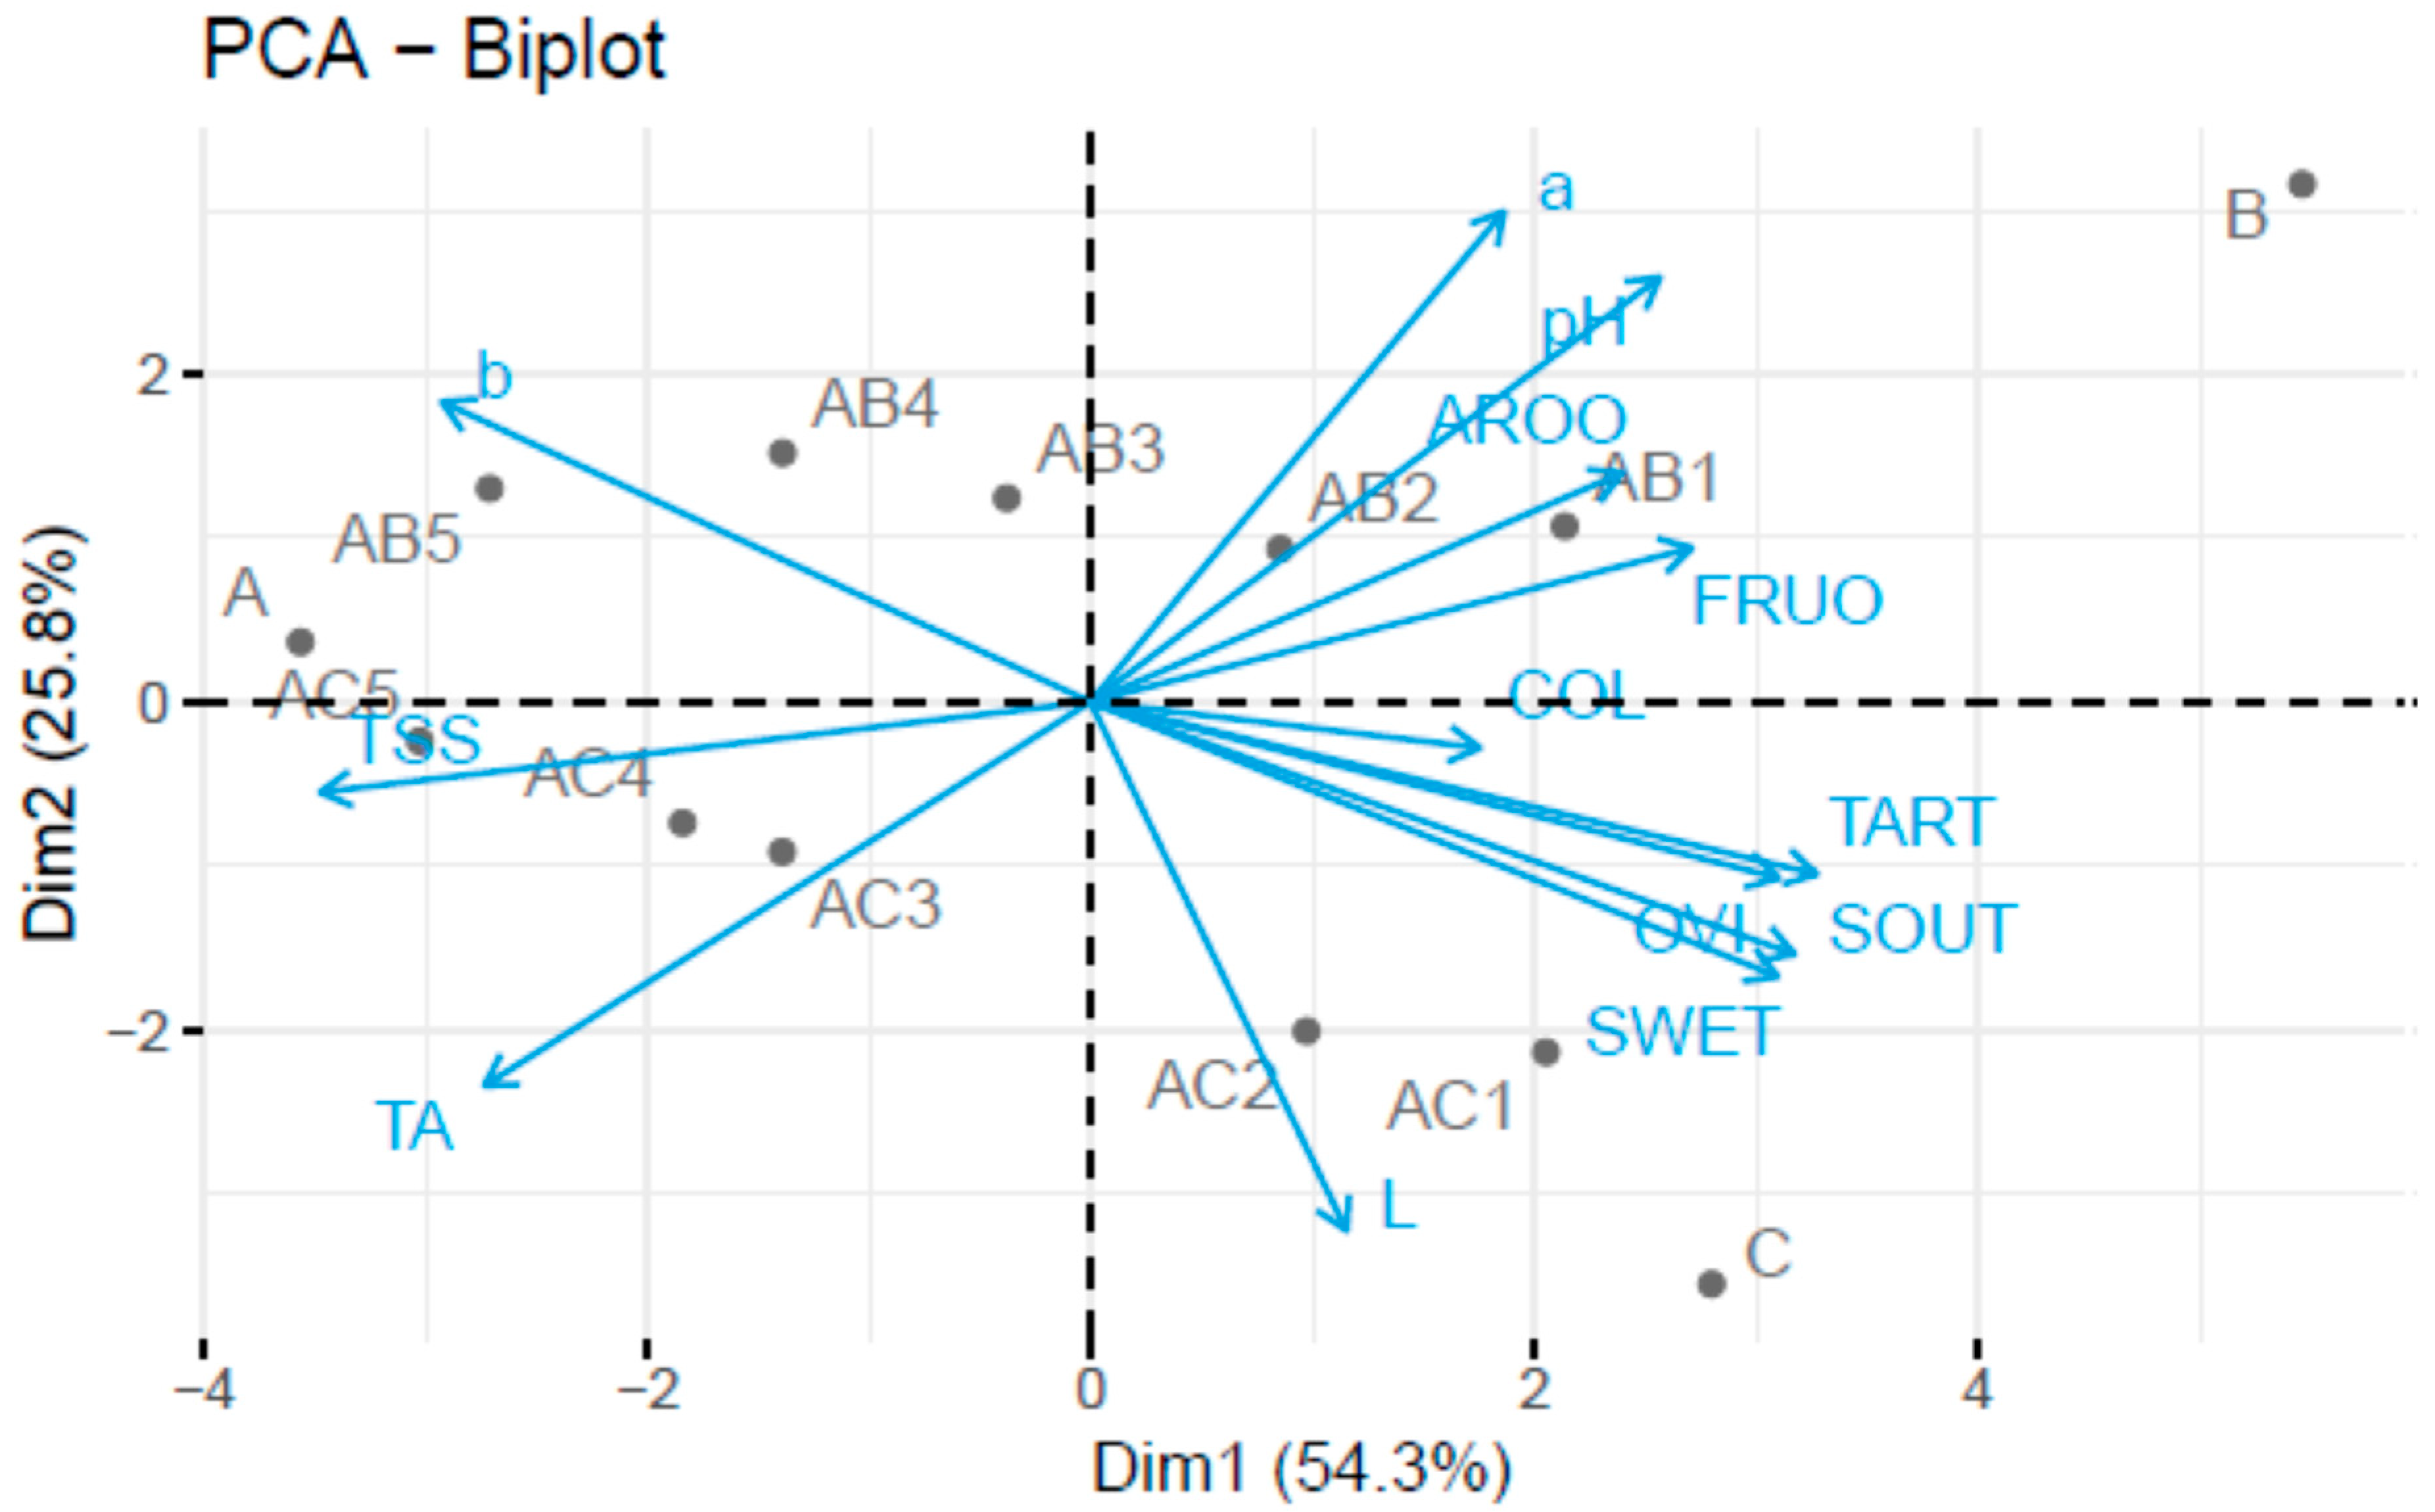
3.1. Sensory and Physicochemical Analysis of Fruit Juice Formulations

The results for the sensory and physicochemical analysis of the mixed fruit juice formulations are show in Table 2, Table 3 and Table 4, respectively.
Colour, odour (aromatic, fruity), taste (sweet, sour, tart), and overall acceptability were evaluated in terms of consumer preference. The study was of a pilot nature and its main task was to detect unacceptable features that could indicate defects in the technological process.
In terms of colour, rose-apple mixed juices had higher scores than rose-strawberry mixed juices. As the addition of rose juice increased, the colour acceptance scores of mixed juices were lower. Another key factor when evaluating food products, including juices, is odour. In the case of the aromatic odour (floral scent) for variants AB1, AB2, AB3, AB4, and AC1, none of the persons indicated that these variants were unacceptable. One person did not like the AC3 variant. Only two people did not like the aromatic odour of the AC4 and AC5 variants. With such small negative opinions for the AC3, AC4, and AC5 variants and no negative opinions for the remaining variants, it can be concluded that all variants of the technological process used produced mixed juice with an acceptable aromatic odour. In the case of the fruity odour, two people found it unacceptable only in the case of the AC5 variant. None of the persons ruled out the remaining variants. With such few negative opinions for the AC5 variant and no negative opinions for the remaining variants, it can be concluded that all variants of the technological process used produced juices with an acceptable fruity odour. Among all the mixed juices, the AB1 formulation of mixed rose-strawberry juice (50% rose and 50% strawberry juices) had the most preferred odour. The odour of this juice was aromatic and fruity, highly acceptable, typical, and characteristic of the raw materials used. The worst acceptance score in terms of odour was the AC5 formulation of mixed rose-apple juice (90% rose and 10% apple juices).
In the case of variants AB4, AB5, and AC5, only one person found the sweet taste unacceptable. None of the persons ruled out the remaining variants. With one negative opinion for variants AB4, AB5, and AB6 and no negative opinions for the remaining variants, it can be concluded that all variants of the technological process used produce mixed juices with an acceptable sweet taste.
Only one person found the sour taste unacceptable in the AC5 variant. None of the persons ruled out the remaining variants. However, this feature is considered a disadvantage and rejection by one person is alarming. In addition, the AC5 variant was rated the worst in terms of this feature (2.50). This means that the technological process for the AC5 variant may be inappropriate. Also, for some persons, some variants of rose fruits-based blended juices were rated lower because they had a sourer taste. This was the opinion of 12, 17, 8, and 12 people, respectively, for the AB4, AB5, AC4, and AC5 variants. A higher proportion of rose hips resulted in a more acidic mixed juice. In the case of the AB4, AB5, and AC4 variants, over 35% of persons preferred the less acidic variants of the mixed juice, and in the case of the AC5 variant, approximately half of the persons preferred the less sour variants of the mixed juice. This may suggest that a higher share of rose fruits may have a negative impact on this feature of the mixed juice. The AC1 variant of the juice was rated the best in terms of sour taste (the least sour), and the AC5 variant of the juice received the worst rating (the sourest).
In the case of tart taste (a drying out, roughening, and puckery sensation felt in the mouth), none of the persons ruled out any variant of mixed juice. In the absence of negative opinions, it can be concluded that all variants of the technological process used produced mixed juices with an acceptable tart taste. However, for some persons, some blended juice variants were rated lower because they were more tart in taste. For variants AB4 and AB5, as many as 12 people thought so, and for variants AB3 and AC5, 7 and 5 people, respectively. A higher proportion of rose hips resulted in more tart mixed juices. In the assessment of the taste (sweet, sour, tart) of mixed juices, the highest acceptance scores were given to the AC1 formulation of mixed rose-apple juice (50% rose and 50% apple juices) and to the AC2 formulation of mixed rose-apple (60% rose and 40% apple juices). These juices received the highest sensory scores for sweetness, tartness, and sourness (the most sweet—4.43 and 4.16, the least tart—3.5 and 3.32, and the least sour—4.73 and 4.43 for AC1 and AC2 juice, respectively).
The last tested attribute, which theoretically includes all the previously discussed features, is the overall impression. It shows that the AC1 variant of the mixed juice was the best, and the AB5 variant of the juice was the worst. Cluster analysis (Figure 1) and regression analyses were performed to determine which of the assessed features of mixed juices have the greatest impact on shaping the overall impression of mixed juices. The cluster analysis showed a high similarity between sweet and sour taste, but also between the overall impression and the colour of the tested juices. A division of features into two groups was also observed. The first group included features such as tart, sweet, and sour taste, and the second group included other sensory features. Regression analysis of sweet and sour taste explained 73.99% of the variability for the overall impression, and regression analysis of sweet, sour, and tart taste as well as aromatic and fruity odour explained 68.92% of the variability in the overall impression.
The pH values of the single-component juices were in the range of 4.34 ± 0.02 (B), 3.60 ± 0.03 (C), and 3.45 ± 0.03 (A), while the total acidity values were in the range of 1.40 ± 0.02 (A), 1.28 ± 0.03 (C), and 0.48 ± 0.03 (B) g citric acid/100 mL. In the research conducted by Villa et al. [32], it can be seen that both pH and other qualitative factors depend on the type of raw material and its variety and therefore the results may differ significantly for one species. The pH of the strawberry, apple, and rose juices were similar to those reported by other authors [33,34,35,36].
The pH values of the formulations of mixed juices were in the range of 3.96–3.70 (rose-strawberry juices) and 3.58–3.47 (rose-apple juices), while the total acidity values were in the range of 0.94–1.24 (rose-strawberry juices) and 1.28–1.36 (rose-apple juices) g citric acid/100 mL.
The addition of a higher concentration of rose juice resulted in mixed juices with lower pH values and higher total acidity (p < 0.05), which was related to the lower pH (3.45) and higher acidity (1.40 g citric acid/100 mL) of rose juice compared to strawberry juice and apple juice. It is known that pH is a very important parameter affecting the microbiological conservation [37]. All mixed juices had a pH below 4.5, which allows them to be classified as acidic foods that limit the growth of microorganisms. However, it should be remembered that too much acidity of the juice may change the taste of the juice and reduce its sensory preference, as consumers may not accept products with too much acidity [38].
The total soluble solids in fruits mainly contain sugars and acids, dissolved vitamins, fructans, proteins, pigments, phenolics, and minerals [39]. The rose juice presented higher TSS content (21.6 °Brix) than the strawberry (9.1 °Brix) and apple (13.2 °Brix) juices or the mixed juices (15.8–20.9 °Brix for the rose-strawberry juices; 17.7–21.1 °Brix for the rose-apple juices) (p < 0.05). Therefore, the mixed juices with the highest concentrations of rose juice presented the highest TSS contents (p < 0.05).
Diversified values of colour parameters for fruit juices are caused by the method of juices obtaining the degree of ripeness and the date of fruit harvest [40]. The obtained juices differed significantly in terms of brightness (L*), as well as the share of red (a*) and yellow (b*) (Table 4). The apple juice was the brightest among the single-component juices, while the rose juice was characterized by the highest share of yellow colour. Strawberry juice had the lowest brightness and the highest share of red colour.
In the study published by Kalisz and Mitek [41], the colour of apple juice was characterized by brightness at a level very similar to that obtained in this study. On the other hand, the share of yellow colour was four times higher compared to the tested juice. For strawberry juice, Kalisz [42] obtained its brightness as lower by more than a half, and red and yellow colours two and three times higher, respectively, compared to the strawberry juice described in this paper.
In another paper, Kalisz and Wolniak [43] studied strawberry juice reconstituted from concentrated juice. It was characterized by a brightness lower by almost five times (19.65) and a slightly higher share of red (44.56) and yellow (33.71). In the study of Tyburcy et al. [35], the parameters L*, a*, and b* for the juice of the Rosa rugosa rose were 76.50, 10.54, and 58.39, respectively. Two-factor analysis of variance showed a significant effect of the addition of strawberry or apple juice on the value of all colour parameters (Table 5). The proportion of rosa juice added also had a significant impact on all colour parameters. The proportions of added juices significantly changed individual colour parameters, which influenced the final colour assessment. The average value of the brightness parameter was lower for strawberry juice compared to apple juice. In the case of the share of red and yellow colours, strawberry juices had a higher average. These values did not depend on the amount of rose juice added. In rose-strawberry juices, with the increase in the share of rose juice, the brightness and the share of red colour decreased, while the share of yellow colour increased. In rose-apple juices, however, a decrease in brightness was observed, and an increase in the share of yellow and red colours with an increase in the addition of rose juice.
Similarly, Kalisz and Mitek [41] studied apple juices with the addition of rose nectars. The addition of rose nectars to apple juices resulted in the darkening of the colour of the products. With a 25% share of rose nectars, the value of the brightness parameter was 72.46 and with 50% it was 54.69. The increase in the rose component in apple juice caused an increase in the share of red and yellow colours, which was also confirmed by our own research. The mixed juices presented colour characteristics of both juices (rose and strawberry or rose and apple) (L* = 77.46–83.29; a* = 9.79–13.90; and b* = 34.52–54.39 or L* = 79.54–87.38; a* = 1.90–7.20; and b* = 30.18–46.72). In the case of mixed juices, when tested in terms of the L* parameter, single-ingredient juices (strawberry and apple) and those with 50% and 60% of rose juice were characterized by the highest brightness. Juices without the addition of rose juice differed statistically significantly in red colour. The share of rose juice in rose-strawberry juices caused a significant decrease in the a* parameter (p < 0.05). In the case of rose-apple juices, a significant increase in the share of the parameter determining the red colour was observed (p < 0.05). Among the mixed juices tested in terms of the b* parameter, the following juices had the lowest yellow content: without rose (strawberry and apple) and juices with 50%, 60%, 70%, 80%, 90%, and 100% of rose juice.
Through the PCA (Figure 2) and the averages tables for the sensory and physicochemical parameters (Table 2–4), strong positive correlations can be seen between a* and pH and sensory characteristics. Sensory attributes are strongly positively correlated with each other, but we observe negative correlations between these attributes for TSS (total soluble solids) and b*. Juices B (strawberry juice) and AB1 (50% rose and 50% strawberry juices) were characterized by high values for a*, pH, fruity odour (FRUO), and aromatic odour (AROO). Juices A (rose juice), AC5 (90% rose and 10% apple juice), and AB5 (90% rose and 10% strawberry juice) had high values of b*, total soluble solids (TSS), and titratable acidity (TA). On the other hand, C (apple juice) and AC1 (50% rose and 50% apple juice) juices had high values of the L* trait, sweet taste (SWET), sour taste (SOUT), and tart taste (TART). Juices prepared as a mixture of rose and strawberry had higher values for a* and pH than juices mixed with apple. Generally, mixed juices with apple juice added had higher sensory evaluation values.
Based on the results obtained, it can be concluded that the combination of rose fruits with other fruits, such as strawberries/apples, may be very interesting and may contribute to the creation of a juice that is more sensory acceptable than in the case of juice produced from only one fruit. Observations similar to those in our work were also indicated by Souza et al. [44], Pereira et al. [45], and Curi et al. [21].

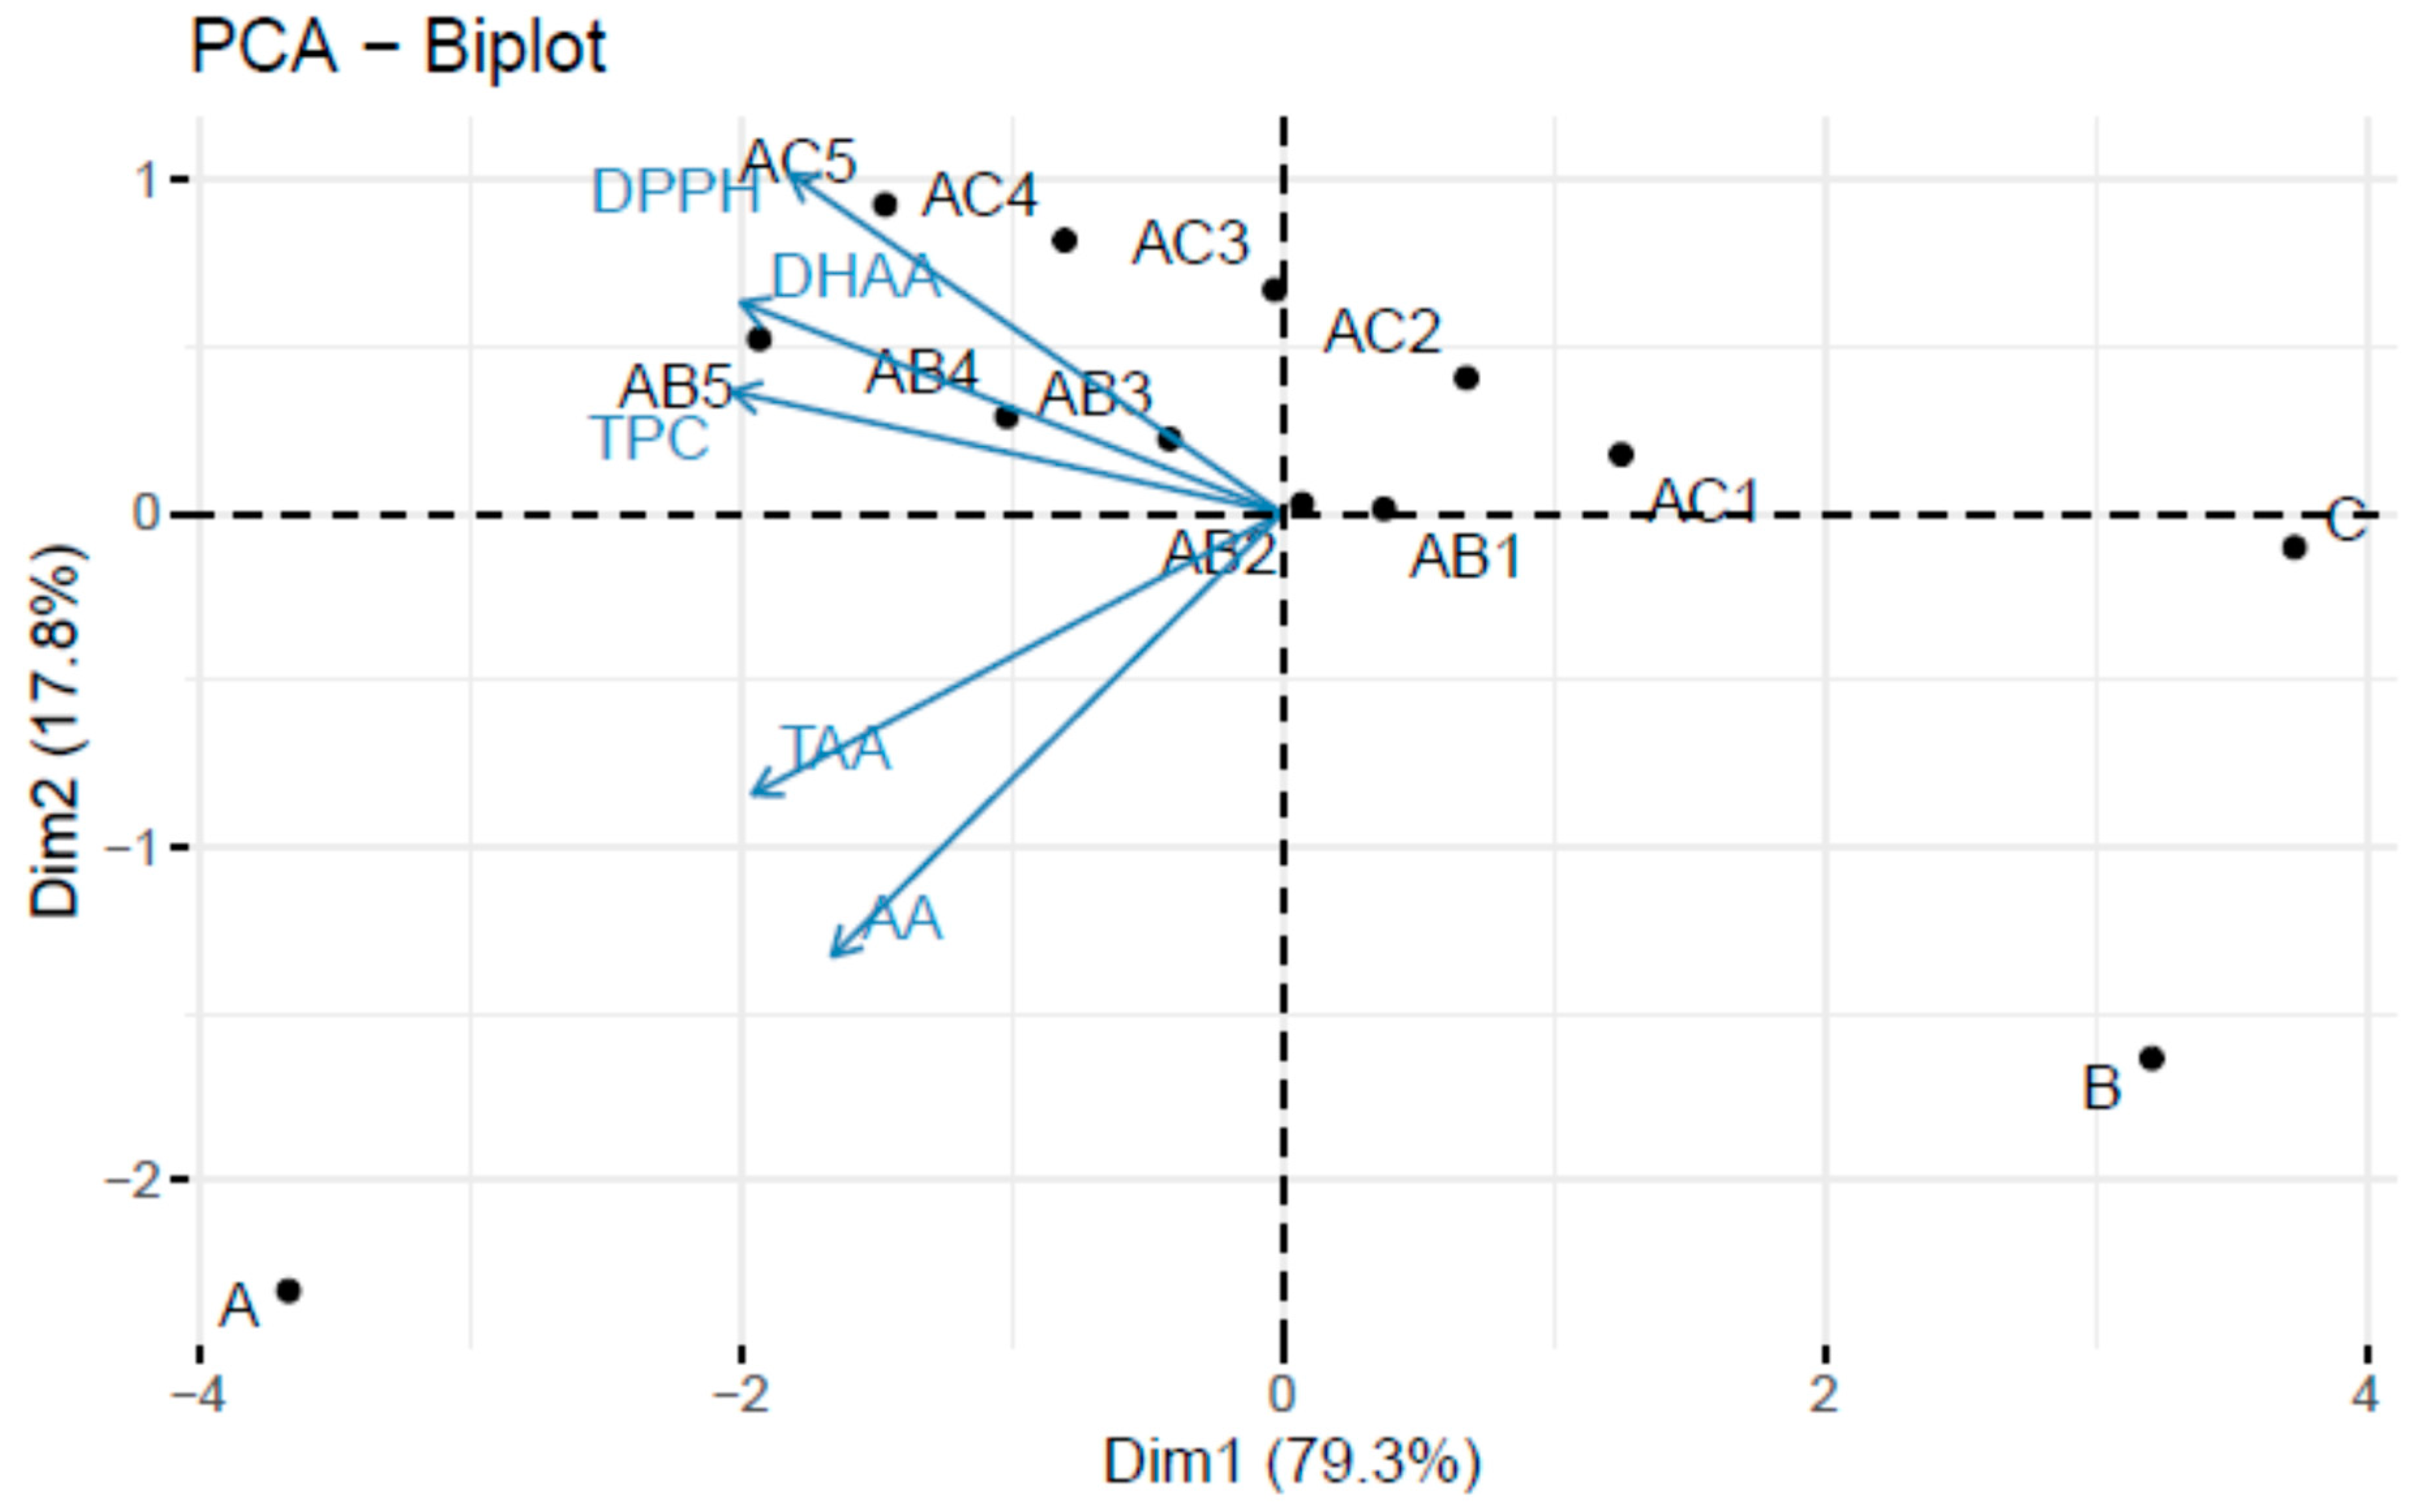
3.2. Vitamin C, Total Polyphenols, and Antioxidant Activity Analysis of Fruit Juice Formulations

The AA, DHAA, TAA, and TPC content and the antioxidant activity of the mixed fruit juice formulations are shown in Table 6. There are two biological active forms of vitamin C, L-ascorbic acid (AA) and L-dehydroascorbic acid (DHAA). L-ascorbic acid (AA) is highly sensitive to technological processes, as well as temperature and the availability of oxygen, which causes its decomposition [46]. AA degradation involves the conversion of AA to the form of DHAA, and then DHAA undergoes further reactions such as hydrolysis to 2,3-diketo-L-gulonate or oxidation to a series of products such as cyclic oxalyl threonate, oxalyl threonate, L-threonic acid, and oxalic acid [47]. As a water-soluble vitamin, AA is easily extracted into mash juices, but it degrades quickly after pressing and therefore its concentration in juices is lower compared to intact fruit or parts thereof [48]. The initial values of TAA were 253.60, 54.56, and 1.14 mg/100 mL in fresh rose, strawberry, and apple juices, respectively. According to the fitting results, percentages of AA in TAA were 78.2%, 86.5%, and 46.5% in fresh rose, strawberry, and apple juices, respectively. The average percentages of DHAA in TAA were 21.8%, 13.5%, and 53.5% in fresh rose, strawberry, and apple juices, respectively. These DHAA percentages suggest that irreversible degradation of DHAA may occur in fresh fruit juices, and that the oxidation of AA to DHAA and further degradation of DHAA might have different equilibriums in these three types of fruit juices.
The obtained values for ascorbic acid were similar to those obtained by other authors. Kalemba-Dróżdż et al. [49] obtained a vitamin C content of 268.3 ± 15.7 mg/100 mL in rosehip juices. Similar values were obtained by Tyburcy et al. [35], who in their research on Rose rugosa juice determined the content of L-ascorbic acid at the level of 259 ± 1.9 mg/100 mL. In strawberry juices determined by other researchers, the AA content ranges from 20 to 40 mg/100 mL. The same researchers showed that the reaction rate constants of AA degradation decrease in juices after adding sugar and also in juices stored at refrigerated temperatures [14]. Varming et al. [48] reported 3.1–10 mg/L of AA in freshly pressed apple juices. According to Bassi et al. [50], the explanation for the missing correlation between the AA content in apples and apple juice was closely related to AA stability, the content of other polyphenols, pH, pressing efficiency, and juice production conditions.
The mixed juices with a higher quantity of rose juice (AB5, AC5) presented higher AA content than the other mixed juices, as expected. In mixed juices, AA reductions of 56.6%, 58.4%, 60.6%, 59.7%, and 58.7% were found for rose-strawberry juices formulations AB1, AB2, AB3, AB4, and AB5, respectively. The AA reduction for rose-apple juices was found to be 63.5%, 67%, 69%, 69%, and 67.4% for AC1, AC2, AC3¸ AC4, and AC5 juices formulations, respectively. Schvab et al. [51] reported that ascorbic acid content of orange pasteurized juice was about 20% lower than a natural one. In this study, it is possible that the decrease in ascorbic acid content in mixed juices was, among other things, related to the pH value of these juices. According to Odriozola-Serrano et al. [52], the maximal degradation of ascorbic acid will occur at pH 4 and the minimal at pH 2. Mixed juices with higher rose juice content also had a higher DHAA content. Due to the low stability of DHAA, it can be expected that it may undergo an unfavourable and irreversible hydrolyse to 2,3-diketogulonic acid and other breakdown products, such as 2-furoic acid and 3-hydroxy-2-pyrone, in a short period of time [53].
The Folin-Ciocalteu method is usually used for determination of the total polyphenol content, but the reagent is nonspecific. The results of the determinations made by this method are affected by the presence of reducing sugars, aromatic amines, sulphur dioxide, ascorbic acid, organic acids, and other compounds, making the results often overstated. According to Prior [54] and others and Huang and others [55], this method is based on oxidation–reduction reactions (single electron transfer-SET), and can thus be considered as one of the methods for the determination of antioxidant activity. All juices are significant sources of polyphenols. The rose juice presented higher TPC content (272.93 mg GAE/100 mL) than the strawberry juice (44.64 mg GAE/100 mL) or the apple juice (42.69 mg GAE 100 mL). In a similar study conducted by Kalemba-Dróżdż et al. [49], the results for rose juice from Rosa rugosa fruit were close to 200 mg GAE/100 mL. However, Tyburcy et al. [35] in their research on Rosa rugosa fruit juices obtained a TPC content of 432.7 ± 3.3 mg GAE/100 mL. In the research conducted by Michalak-Majewska et al. [56], TPC was determined in apple juices at approximately 18.85 mg GAE/100 mL. This value was much lower than that obtained for the tested apple juice. According to Oszmiański et al. [57], the polyphenol content in apples and products obtained from them depends mainly on the variety used and the processing technology, and for fresh juices it is much higher because during storage the juices lose about 50–90% of their polyphenols content. Also, in strawberry juices different authors obtained different TPC results. The TPC determined by Kalisz [58] for strawberry juice was 197.4 mg GAE/100 mL and that determined by Wolniak and Kalisz [59] was approximately 143 mg GAE/100 mL for strawberry juice prepared from strawberries of the Marmolada variety. The rose-strawberry juices presented TPC in the range of 164.40 ± 2.04, 182.22 ± 3.03, 215.89 ± 3.07, 250.48 ± 1.44, and 306.17 ± 2.14 mg GAE/100 mL for AB1, AB2, AB3, AB4, and AB5 formulations, respectively. The rose-apple juices presented TPC in the range of 116.21 ± 2.65, 155.42 ± 3.02, 179.22 ± 3.65, 199.43 ± 3.21, and 230.87 ± 2.98 mg GAE/100 mL for AC1, AC2, AC3, AC4, and AC5 formulations, respectively. The increase in the rose juice concentration resulted in the increase in the TPC content (p < 0.05) in the mixed juices. The result may be related to the higher TPC content in rose juice, which is also confirmed by the results of other authors. Apple juices tested by Kalisz and Mitek [41] had a polyphenol content of 71.1 mg GAE/100 mL, and the addition of rose nectar at 25% and 50% increased the polyphenol content to 224.7 and 378.8 mg GAE/100 mL, respectively.
The addition of juices with rose fruits significantly affects the antioxidant activity of juices with strawberry and apple. Among single-ingredient juices, strawberry juice had lower antioxidant activity. This value was independent of the addition of rose juice. There was also a statistically significant difference between the addition of apple juice and strawberry juice to rose fruits juice (p < 0.05).
Antioxidant activity is related to the presence of various bioactive compounds in food products, such as polyphenols and vitamin C. Wolniak and Kalisz [59] observed in other strawberry juices a positive correlation between the total phenolic content (Folin-Ciocalteu) and the antioxidant activity (DPPH). The high content of polyphenols and vitamin C contributes to the high antioxidant potential of food products. However, compounds belonging to polyphenols differ in their antioxidant activity. In addition, we must not forget that synergistic interactions (e.g., vitamin C with other phenols) or inhibitory interactions may occur between compounds [29]. Therefore, for example, raspberries, although they have lower polyphenol content, bind the DPPH radical better than blackcurrants [60]. Juices without rose fruits juice had significantly the lowest antioxidant activity. Juices with 90% and 100% rose juice were characterized by the highest antioxidant activity. Rose juices with 50% apple juice had an antioxidant capacity of 30.15 μmol of Trolox/mL, which is almost twice as high as that obtained by Kalisz and Mitek [41]. In the case of strawberry juices, the antioxidant activity value was 13.13 μmol of Trolox/mL and this was a value three times higher than the value obtained by Kalisz [42].
Through the PCA (Figure 3) and the averages table for bioactive compounds and antioxidant activity (Table 6), a correlation between DPPH, DHAA, and TPC and a correlation between TAA and AA can be observed. The formulations A (rose juice) had the highest value of all five characteristics, and the formulations B (strawberry juice) and C (apple juice) had the lowest values. The formulations AB1 (50% rose and 50% strawberry juices), AB2 (60% rose and 40% strawberry juices), and AB3 (70% rose and 30% strawberry juices) had average values for all five characteristics. The formulation AB5 (90% rose and 10% strawberry juices) was characterized by the highest content of phenols. The high correlation between the polyphenol content and antioxidant activity in the case of all tested mixed juices may suggest that the high content of polyphenol compounds is accompanied by high antioxidant potential.
In general, as with the sensory, it appears that combining fruits may provide the opportunity to obtain juices with greater nutritional value than those prepared from individual fruits. For example, the content of phenolic compounds in the AB5 formulation (90% rose and 10% strawberry juices) and the antioxidant activity in the AB5 (90% rose and 10% strawberry juices) and AC5 (90% rose and 10% apple juices) formulations were higher than in the formulations of juice prepared from one of these fruits.

4. Conclusions

This study may contribute to increase the availability of the Rosa rugose fruit and its mixed fruit juices for consumers. The mixed rosa juices can be an alternative for adding nutritional value. One of the main factors in the poor use of rose fruits (Rosa rugose) for juice production is the tart-sour taste of the raw material. For this reason, it is very difficult to obtain a tasty and good quality product from rose fruits. Therefore, it was advisable to determine the processing suitability of rose fruits and the possibility of preparing a product based on this raw material, attractive in terms of colour, aroma, and taste and rich in bioactive ingredients. To obtain such product, different formulations of rose-apple and rose-strawberry juices were prepared which differed in the percentage of added juices. The mixed juices showed high total phenolic compounds (116.21–250.48 mg GAE/100 mL), total vitamin C (64.18–132.21 mg/100 mL), and DPPH scavenging capacity (30.15–39.23 µg Trolox/mL). A higher proportion of rose hips resulted in a more acidic mixed juice. This may suggest that a higher share of rose fruits may have a negative impact on this feature of the mixed juice. The research shows that the best rose-strawberry juice (AB5) in terms of vitamin C content (132.21 mg/100 mL), polyphenol content (TPC—306.17 mg/100 mL), and antioxidant activity (DPPH—37.16 µM Trolox/mL) was one of the worst in sensory evaluation (tart taste—1.86; sour taste—2.70, and overall impression—3.35). Rose-apple juices (AC1 and AC2), which received the highest sensory ratings for the tart and sour feature (least tart—3.5 and 3.32 and least sour—4.73 and 4.43 for AC1 and AC2 juice, respectively) and for overall impression (4.93 and 4.86 for juice AC1 and AC2, respectively) had a lower content of bioactive substances. These juices contained approximately 2.6 and 2.0 times less TPC for the AC1 and AC2 juices, respectively, and for vitamin C approximately 2.0 times less in comparison to the AB5 juice. The antioxidant activity of juices AC1 (30.15 µM Trolox/mL) and AC2 (32.51 µM Trolox/mL) was also lower in comparison to juice AB5. Despite the lower content of tested bioactive compounds and antioxidant activity in rose-apple juices (AC1 and AC2), this is many times higher than in apple juice (TAA—1.14 mg/mL; TPC—42.69 mg/mL; DPPH—21.28 µM Trolox/mL). Generally, mixing rose fruits juice with apple or strawberry juice resulted in a significant increase in antioxidant activity and the content of the tested bioactive compounds in comparison with single-ingredient apple or strawberry juice.
Based on the conducted research, it can be concluded that rose fruits are a suitable raw material for the production of mixed juices. It has been found that the mixed juice of these fruits can have better sensory and nutritional characteristics than when used individually.
Therefore, mixed rose-apple or rose-strawberry juice could be an alternative natural functional food that may contribute to increasing rose fruit consumption.

Author Contributions

Conceptualization, A.C.; Data curation, A.C.; Investigation, A.C. and J.L.P.; Methodology, A.C. and M.S.; Writing—original draft, A.C. and M.S.; Writing—review and editing, A.C. All authors have read and agreed to the published version of the manuscript.

Funding

This research received no external funding.

Institutional Review Board Statement

This study did not require ethical approval.

Informed Consent Statement

Informed consent was obtained from all subjects involved in the study.

Data Availability Statement

The data presented in this study are available on request from the corresponding author (Andrzej Cendrowski). The data are not publicly available due to privacy.

Conflicts of Interest

The authors declare no conflict of interest.

Appendix A

Questionnaire used in the ranking test of various variants of mixed juices prepared on the basis of the rose fruits (Rosa rugosa).
Applsci 14 00113 g0a1Applsci 14 00113 g0a2Applsci 14 00113 g0a3Applsci 14 00113 g0a4Applsci 14 00113 g0a5Applsci 14 00113 g0a6Applsci 14 00113 g0a7

References

  1. Paula, F.J.A.; Guiné, R.P.F.; Cruz-Lopes, L.; Duarte, A.C.; Fragata, A.O.S.; Reis, M.A.L. Effects of pre- and post-parvest factors on the selected elements contents in fruit juices. Czech. J. Food Sci. 2015, 33, 384–391. [Google Scholar] [CrossRef]
  2. Rajendran, P.; Nandakumar, N.; Rengarajan, T.; Palaniswami, R.; Gnanadhas, E.N.; Lakshminarasaiah, U.; Gopas, J.; Nishigaki, I. Antioxidants and Human Diseases. Clin. Chim. Acta 2014, 436, 332–347. [Google Scholar] [CrossRef]
  3. Pott, D.M.; Osorio, S.; Vallarino, J.G. From Central to Specialized Metabolism: An Overview of Some Secondary Compounds Derived From the Primary Metabolism for Their Role in Conferring Nutritional and Organoleptic Characteristics to Fruit. Front. Plant Sci. 2019, 10, 835. [Google Scholar] [CrossRef]
  4. Dashbaldan, S.; Rogowska, A.; Pączkowski, C.; Szakiel, A. Distribution of Triterpenoids and Steroids in Developing Rugosa Rose (Rosa rugosa Thunb.) Accessory Fruit. Molecules 2021, 26, 5158. [Google Scholar] [CrossRef] [PubMed]
  5. Demir, N.; Yildiz, O.; Alpaslan, M.; Hayaloglu, A. Evaluation of volatiles, phenolic compounds and antioxidant activities of rose hip (Rosa L.) fruits in Turkey. LWT Food Sci. Technol. 2014, 57, 126–133. [Google Scholar] [CrossRef]
  6. Klewicka, E.; Piekarska-Radzik, L.; Milala, J.; Klewicki, R.; Sójka, M.; Rosół, N.; Otlewska, A.; Matysiak, B. Antagonistic Activity of Lactic Acid Bacteria and Rosa rugosa Thunb. Pseudo-Fruit Extracts against Staphylococcus spp. Strains. Appl. Sci. 2022, 12, 4005. [Google Scholar] [CrossRef]
  7. Koczka, N.; Stefanovits-Bányai, É.; Ombódi, A. Total polyphenol content and antioxidant capacity of rosehips of some rosa species. Medicines 2018, 5, 84. [Google Scholar] [CrossRef] [PubMed]
  8. Feng, S.; Yi, J.; Li, X.; Wu, X.; Zhao, Y.; Ma, Y.; Bi, J. Systematic review of phenolic compounds in apple fruits: Compositions, distribution, absorption, metabolism, and processing stability. J. Agric. Food Chem. 2021, 13, 7–27. [Google Scholar] [CrossRef]
  9. Ferretti, G.; Turco, I.; Bacchetti, T. Apple as a source of dietary phytonutrients: Bioavailability and evidence of protective effects against human cardiovascular disease. Food Nutr. Sci. 2014, 5, 1234–1246. [Google Scholar] [CrossRef]
  10. Quan, W.; Tao, Y.; Lu, M.; Yuan, B.; Chen, J.; Zeng, M.; Qin, F.; Guo, F.; He, Z. Stability of the phenolic compounds and antioxidant capacity of five fruit (apple, orange, grape, pomelo and kiwi) juices during in vitro-simulated gastrointestinal digestion. Int. J. Food Sci. Technol. 2017, 53, 1131–1139. [Google Scholar] [CrossRef]
  11. Ornelas-Paz, J.J.; Yahia, E.M.; Ramírez-Bustamante, N.; Pérez-Martínez, J.D.; del Pilar Escalante-Minakata, M.; Ibarra-Junquera, V.; Acosta-Muñiz, C.; Guerrero-Prieto, V.; Ochoa-Reyes, E. Physical attributes and chemical composition of organic strawberry fruit (Fragaria x ananassa Duch, Cv. Albion) at six stages of ripening. Food Chem. 2013, 138, 372–381. [Google Scholar] [CrossRef] [PubMed]
  12. Newerli-Guz, J.; Śmiechowska, M.; Drzewiecka, A.; Tylingo, R. Bioactive ingredients with health-promoting properties of strawberry fruit (Fragaria x ananassa Duchesne). Molecules 2023, 28, 2711. [Google Scholar] [CrossRef] [PubMed]
  13. Skrovankova, S.; Sumczynski, D.; Mlcek, J.; Jurikova, T.; Sochor, J. Bioactive compounds and antioxidant activity in different types of berries. Int. J. Mol. Sci. 2015, 16, 24673–24706. [Google Scholar] [CrossRef] [PubMed]
  14. Sapei, L.; Hwa, L. Study on the Kinetics of Vitamin C Degradation in Fresh Strawberry Juices. Procedia Chem. 2014, 9, 62–68. [Google Scholar] [CrossRef]
  15. Giampieri, F.; Forbes-Hernandez, T.Y.; Gasparrini, M.; Alvarez-Suarez, J.M.; Afrin, S.; Bompadre, S.; Quiles, J.L.; Mezzetti, B.; Battino, M. Strawberry as a health promoter: An evidence based review. Food Funct. 2015, 6, 1386–1398. [Google Scholar] [CrossRef]
  16. Roshan, R.; Ahmed, S.; ul Hassan, M.M. Fragaria nubicola (Rosaceae): A review of medicinal uses, phytochemistry and pharmacology. J. Pharmacogn. Phytochem. 2019, 8, 3390–3393. [Google Scholar]
  17. Basu, A.; Morris, S.; Nguyen, A.; Betts, N.M.; Fu, D.; Lyons, T.J. Effects of dietary strawberry supplementation on antioxidant biomarkers in obese adults with above optimal serum lipids. J. Nutr. Metab. 2016, 2016, 3910630. [Google Scholar] [CrossRef]
  18. Apple Production by Country 2023. Available online: https://worldpopulationreview.com/country-rankings/apple-production-by-country (accessed on 10 December 2023).
  19. Pawlak, J.; Wróblewska, W.; Paszko, D. Production and economic efficiency in the cultivation of strawberry (Fragaria x ananassa Duch.) depending on the method of production—Case study. Agron. Sci. 2022, LXXVII. [Google Scholar] [CrossRef]
  20. Chiusano, L.; Cravero, M.C.; Borsa, D.; Tsolakis, C.; Zeppa, G.; Gerbi, V. Effect of the addition of fruit juices on grape must for natural beverage production. Ital. J. Food Sci. 2015, 27, 375–384. [Google Scholar] [CrossRef]
  21. Curi, P.N.; de Almeida, A.B.; Tavares, B.S.; Nunes, C.A.; Pio, R.; Pasqual, M.; de Souza, V.R. Optimization of tropical fruit juice based on sensory and nutritional characteristics. Food Sci. Technol. 2017, 37, 308–314. [Google Scholar] [CrossRef]
  22. Ogundele, O.M.A.; Awolu, O.O.; Badejo, A.A.; Nwachukwu, I.D.; Fagbemi, T.N. Development of functional beverages from blends of Hibiscus sabdariffa extract and selected fruit juices for optimal antioxidant properties. Food Sci. Nutr. 2016, 4, 679–685. [Google Scholar] [CrossRef] [PubMed]
  23. Grigio, M.L.; Moura, E.A.; Carvalho, G.F.; Zanchetta, J.J.; Chagas, P.C.; Chagas, E.A.; Durigan, M.F. Nutraceutical potential, quality and sensory evaluation of camu-camu pure and mixed jelly. Food Sci. Technol. 2022, 42, e03421. [Google Scholar] [CrossRef]
  24. Lagrange, V.; Norback, J.P. Product optimization and the acceptor set size. J. Sens. Stud. 1987, 2, 119–136. [Google Scholar] [CrossRef]
  25. The Polish Standard PN-EN-1132; Fruit and Vegetable Juices. pH Determination. Polish Committee for Standardization: Warsaw, Poland, 1999.
  26. The Polish Standard PN-EN-12147; Fruit and Vegetable Juices-Determination of Titratable Acidity. Polish Committee for Standardization: Warsaw, Poland, 2000.
  27. The Polish Standard PN-90/A-75101; Fruit and Vegetable Products-Preparation of Samples and Methods of Physicochemical Tests-Determination of the Content of Total Extract. Polish Committee for Standardization: Warsaw, Poland, 2002.
  28. Gao, X.; Ohlander, M.; Jeppson, N.; Bjork, L.; Trajkovski, V. Changes in antioxidant effect and their relationship to phytonutrients in fruit of sea buckthorn (Hippophae rhamnoides L.) during maturation. J. Agric. Food Chem. 2000, 48, 1485–1490. [Google Scholar] [CrossRef] [PubMed]
  29. Cendrowski, A.; Królak, M.; Kalisz, S. Polyphenols, L-Ascorbic Acid, and antioxidant activity in wines from rose fruits (Rosa rugosa). Molecules 2021, 26, 2561. [Google Scholar] [CrossRef]
  30. Yen, G.C.; Chen, H.Y. Antioxidant Activity of Various Tea Extracts in Relation to Their Antimutagenicity. J. Agric. Food Chem. 1995, 43, 27–32. [Google Scholar] [CrossRef]
  31. Singh-Ackbarali, D.; Maharaj, R. Sensory evaluation as a tool in determining acceptability of innovative products developed by undergraduate students in Food Science and Technology at the University of Trinidad and Tobago. J. Curric. Teach. 2014, 3, 10–27. [Google Scholar] [CrossRef]
  32. Villa, F.; Potrich, C.; Dall’Oglio, P.A. Sensory profile and physical-chemical analysis of integral grape juice prepared through steam extraction process. Sci. Agrar. Parana. 2018, 17, 300–304. [Google Scholar]
  33. Igual, M.; Garcia-Herrera, P.; Cámara, R.M.; Martinez-Monzό, J.; Garcia-Segovia, P.; Cámara, M. Bioactive compounds in rosehip (Rosa canina) powder with encapsulating agents. Molecules 2022, 27, 4737. [Google Scholar] [CrossRef]
  34. Touyz, L.Z.G.; Nassani, L.M. Acidity and dental erosion from apple-and grape-juice (an in vitro and in vivo Report). Int. J. Oral. Dent. Health 2018, 4, 061. [Google Scholar] [CrossRef]
  35. Tyburcy, A.; Ścibisz, I.; Rostek, E.; Pasierbiewicz, A.; Florowski, T. Antioxidant properties of cranberry and rose juices in meat products made of defrosted meat. Food Sci. Technol. Qual. 2014, 5, 72–84. [Google Scholar] [CrossRef]
  36. Basak, J.K.; Madhavi, B.G.K.; Paudel, B.; Kim, N.E.; Kim, H.T. Prediction of Total Soluble Solids and pH of strawberry fruits using RGB, HSV and HSL Colour spaces and machine learning models. Foods 2022, 11, 2086. [Google Scholar] [CrossRef] [PubMed]
  37. Rahman, M.S.; Rahman, M.R. Ph in food preservation. In Handbook of Food Preservation; CRS Press: Boca Raton, FL, USA; Taylor & Francis Group: Oxford, UK, 2020; pp. 323–332. [Google Scholar]
  38. Porto, M.; Okina, V.; Pimentel, T.; Prudencio, S. Physicochemical stability, antioxidant activity, and acceptance of beet and orange mixed juice during refrigerated storage. Beverages 2017, 3, 36. [Google Scholar] [CrossRef]
  39. Magwaza, L.S.; Opara, U.L. Analytical methods for determination of sugars and sweetness of horticultural products—A review. Sci. Hortic. 2015, 184, 179–192. [Google Scholar] [CrossRef]
  40. Zou, Z.; Xi, W.; Hu, Y.; Nie, C.; Zhou, Z. Antioxidant Activity of Citrus Fruits. Food Chem. 2016, 196, 885–896. [Google Scholar] [CrossRef]
  41. Kalisz, S.; Mitek, M. The influence of wild rose nectar addition into apple juices on the antioxidant activity and the bioactive components content. Food Sci. Technol. Qual. 2007, 5, 194–201. [Google Scholar]
  42. Kalisz, S. Effect of production method of strawberry juices on the content of anthocyanins and colour. Food Sci. Technol. Qual. 2008, 5, 149–160. [Google Scholar]
  43. Kalisz, S.; Wolniak, M. Changes in selected qualitative distinguishing features during storage of restored juices from concentrares. Food Sci. Technol. Qual. 2007, 5, 203–212. [Google Scholar]
  44. Souza, V.R.; Pereira, P.A.P.; Pinheiro, A.C.M.; Nunes, C.A.; Pio, R.; Queiroz, F. Evaluation of the jelly processing potential of raspberries adapted in Brazil. J. Food Sci. 2014, 79, 407–412. [Google Scholar] [CrossRef]
  45. Pereira, A.C.S.; Wurlitzer, N.J.; Dionísio, A.P.; Soares, M.V.L.; Bastos, M.D.S.R.; Alves, R.E.; Brasil, I.M. Synergistic, additive and antagonistic effects of fruit mixtures on total antioxidant capacities and bioactive compounds in tropical fruit juices. Arch. Latinoam. De Nutr. 2015, 65, 119–127. [Google Scholar]
  46. Al Fata, N.; Georgè, S.; Dlalah, N.; Renard, C.M.G.C. Influence of partial pressure of oxygen on ascorbic acid degradation at canning temperature. Innov. Food Sci. Emerg. Technol. 2018, 49, 215–221. [Google Scholar] [CrossRef]
  47. Dewhirst, R.A.; Fry, S.C. The oxidation of dehydroascorbic acid and 2,3-diketogulonate by distinct reactive oxygen species. Biochem. J. 2018, 475, 3451–3470. [Google Scholar] [CrossRef] [PubMed]
  48. Varming, C.; Petersen, M.A.; Toldam-Andersen, T.B. Ascorbic Acid Contents in Danish Apple Cultivars and Commercial Apple Juices. LWT-Food Sci. Technol. 2013, 54, 597–599. [Google Scholar] [CrossRef]
  49. Kalemba-Dróżdż, M.; Cierniak, A.; Kwiecień, I. Fruits, edible flowers and leaves of wild plants-polyphenolic raw materials act as effective antioxidant and genoprotective factors. In Polyphenol Raw Materials. Applications and Prospects; Oficyna Wydawnicza AFM: Kraków, Poland, 2022; Volume 3, pp. 51–98. [Google Scholar]
  50. Bassi, M.; Lubes, G.; Bianchi, F.; Agnolet, A.; Ciesa, F.; Brunner, K.; Guerra, W.; Robatscher, P.; Oberhuber, M. Ascorbic acid content in apple pulp, peel, and monovarietal cloudy juices of 64 different cultivars. Int. J. Food Prop. 2017, 20, S2626–S2634. [Google Scholar] [CrossRef]
  51. Schvab, M.C.; Ferreyra, M.M.; Davies, C.V.; Stefani, A.; Cayetano, M.C.; Gerard, L.M.; Gonzalez, R.F. Effects of orange winemaking variables on antioxidant activity and bioactive compounds. Food Sci. Technol Camp. 2015, 35, 407–413. [Google Scholar] [CrossRef]
  52. Odriozola-Serrano, I.; Hernández-Jover, T.; Martín-Belloso, O. Comparative Evaluation of UV-HPLC Methods and Reducing Agents to Determine Vitamin C in Fruits. Food Chem. 2007, 105, 1151–1158. [Google Scholar] [CrossRef]
  53. Giannakourou, M.C.; Taoukis, P.S. Effect of alternative preservation steps and storage on vitamin C stability in fruit and vegetable products: Critical review and kinetic modelling approaches. Foods 2021, 10, 2630. [Google Scholar] [CrossRef]
  54. Prior, R.L.; Wu, X.; Schaich, K. Standardized methods for the determination of antioxidant capacity and phenolics in foods and dietary supplements. J. Agric. Food Chem. 2005, 53, 4290–4302. [Google Scholar] [CrossRef]
  55. Huang, D.; Ou, B.; Prior, R.L. The chemistry behind antioxidant capacity assays. J. Agric. Food Chem. 2005, 53, 1841–1856. [Google Scholar] [CrossRef]
  56. Michalak-Majewska, M.; Żukiewicz-Sobczak, W.; Kalbarczyk, J. Assessment of the composition and properties of fruit juices most popular with consumers. Bromatol. I Chem. Toksykol. 2009, 42, 836–841. [Google Scholar]
  57. Oszmiański, J.; Wojdyło, A.; Kolniak, J. Effect of pectinase treatment on extraction of antioxidant phenolsfrom pomace, for the production of puree-enriched cloudy apple juices. Food Chem. 2011, 127, 623–631. [Google Scholar] [CrossRef] [PubMed]
  58. Kalisz, S. High-methoxyl pectins influence on the antioxidant compounds content in strawberry juices. Food Sci. Technol. Qual. 2007, 2, 145–154. [Google Scholar]
  59. Wolniak, M.; Kalisz, S. The influence of pectin on anthocyanins and total polyphenol content and its antiradical scavenging activity designated in strawberry juices. Food 2006, 4, 39–46. [Google Scholar] [CrossRef]
  60. Szajdek, A.; Dąbkowska, E.; Borowska, E.J. The influence of enzymatic treatment of berry pulp on the polyphenol content and antioxidant activity of the juice. Food Sci. Technol. Qual. 2006, 4, 59–67. [Google Scholar]
Figure 1. Cluster analysis for individual consumer evaluation attributes. Abbreviations: COL—Colour; AROO—Aromatic odour; FRUO—Fruity odour; SWET—sweet taste; SOUT—sour taste; TART—tart taste OVI—Overall impression.
Applsci 14 00113 g001
Figure 2. Principal component analysis (PCA) for the different samples of mixed fruit juice formulations and sensory attributes and physicochemical properties. Abbreviations: COL—Colour; AROO—Aromatic odour; FRUO—Fruity odour; SWET—sweet taste; SOUT—sour taste; TART—tart taste OVI—Overall impression; TA—Titratable acidity; TSS—Total soluble solids; a—a*; b—b*; L—L*.
Applsci 14 00113 g002
Figure 3. Principal component analysis (PCA) for the different samples of mixed fruit juice formulations and bioactive compounds and antioxidant activity.
Applsci 14 00113 g003
Table 1. Formulation of fruit juices.
SampleIngredients
Rose Juice (% v/v)Strawberry Juice (% v/v)Apple Juice (% v/v)
A10000
B01000
C00100
AB150500
AB260400
AB370300
AB480200
AB590100
AC150050
AC260040
AC370030
AC480020
AC590010
Table 2. Sensory attributes (colour, aromatic odour, fruity odour, sweet taste, sour taste, tart taste, overall impression) of the tested fruit juice.
Sensory Attributes
SampleCOLAROOFRUOSWETSOUTTARTOVI
A4.96 ± 0.20 d4.26 ± 1.21 d2.56 ± 1.55 a1.43 ± 0.97 a2.15 ± 0.65 a1.12 ± 0.87 a3.20 ± 0.27 a
B4.8 ± 0.00 cd4.77 ± 1.12 f4.5 ± 1.22 e4.15 ± 1.11 d4.19 ± 0.98 e4.89 ± 0.99 f4.90 ± 0.41 e
C4.00 ± 0.23 b3.93 ± 1.23 b3.89 ± 0.92 bc4.83 ± 1.25 f4.62 ± 1.11 g4.96 ± 1.54 f4.50 ± 0.29 d
AB14.70 ± 0.62 c4.60 ± 0.72 e4.87 ± 0.51 f3.37 ± 1.22 c3.53 ± 1.25 d2.93 ± 1.48 d4.60 ± 0.22 d
AB24.45 ± 0.75 c4.30 ± 0.98 d4.37 ± 0.99 d3.26 ± 1.60 c3.63 ± 1.25 d2.27 ± 0.98 c4.20 ± 0.37 c
AB34.00 ± 0.49 b4.07 ± 1.70 c4.23 ± 0.97 d2.87 ± 1.49 bc3.03 ± 1.52 c2.10 ± 0.84 bc4.00 ± 0.41 c
AB43.7 ± 0.88 a3.97 ± 1.73 c4.13 ± 1.57 cd2.71 ± 0.79 b2.90 ± 1.45 c1.97 ± 0.81 b3.75 ± 0.17 b
AB53.4 ± 0.35 a3.70 ± 1.71 b3.93 ± 1.23 c2.62 ± 0.73 b2.70 ± 1.32 b1.86 ± 0.82 b3.35 ± 0.00 ab
AC14.97 ± 0.18 d4.23 ± 0.18 d4.40 ± 0.93 de4.43 ± 0.94 e4.73 ± 0.52 h3.5 ± 1.53 e4.93 ± 0.25 e
AC24.75 ± 0.55 c3.73 ± 1.36 b3.90 ± 1.40 c4.16 ± 1.05 d4.43 ± 1.22 f3.32 ± 1.16 e4.86 ± 0.44 e
AC34.10 ± 0.35 b3.5 ± 1.53 b3.56 ± 1.23 b3.10 ± 1.37 c2.90 ± 1.18 c2.56 ± 0.90 c4.10 ± 0.75 c
AC44.05 ± 0.52 b3.2 ± 1.35 b3.47 ± 1.28 b3.00 ± 1.32 c2.83 ± 1.44 c2.30 ± 1.21 c4.20 ± 0.33 c
AC53.85 ± 0.16 a2.66 ± 1.83 a3.17 ± 1.51 b2.53 ± 1.07 b2.50 ± 1.17 b2.13 ± 0.90 bc4.00 ± 0.49 c
Mean values for triplicates ± SD. The values with different superscript letters are significantly different (p < 0.05). Abbreviations: COL—Colour; AROO—Aromatic odour; FRUO—Fruity odour; SWET—sweet taste; SOUT—sour taste; TART—tart taste; OVI—Overall impression.
Table 3. Physicochemical analysis (pH, titratable acidity, total soluble solids) of the tested fruit juice.
SamplepHTATSS
A3.45 ± 0.03 a 1.40 ± 0.02 i 21.6 ± 0.3 c
B4.34 ± 0.02 f 0.48 ± 0.01 a 9.1 ± 0.0 a
C3.60 ± 0.03 abc 1.28 ± 0.03 ef 13.2 ± 0.2 b
AB13.96 ± 0.01 e 0.94 ± 0.02 e 15.8 ± 0.0 b
AB23.86 ± 0.06 de 0.98 ± 0.01 e 16.9 ± 0.1 b
AB33.83 ± 0.02 cde 1.04 ± 0.03 e 18.1 ± 0.4 ab
AB43.75 ± 0.02 bcde 1.12 ± 0.01 e 19.5 ± 0.2 b
AB53.70 ± 0.01 abcd 1.24 ± 0.01 e 20.9 ± 0.1 bc
AC13.58 ± 0.03 abc 1.28 ± 0.02 ef 17.7 ± 0.3 b
AC23.54 ± 0.03 ab 1.30 ± 0.01 fg 18.7 ± 0.1 ab
AC33.50 ± 0.03 ab 1.32 ± 0.01 fgh 19.7 ± 0.1 b
AC43.49 ± 0.02 a 1.34 ± 0.01 gh 20.2 ± 0.3 b
AC53.47 ± 0.02 a 1.36 ± 0.01 hi 21.1 ± 0.3 c
Mean values for triplicates ± SD. The values with different superscript letters are significantly different (p < 0.05). Abbreviations: TA—Titratable acidity (in g citric acid/100 mL); TSS—Total soluble solids (in °Brix).
Table 4. Physicochemical analysis (colour L*, a*, and b*) of the tested fruit juice.
SampleL*a*b*
A82.70 ± 0.05 de5.51 ± 0.04 f47.16 ± 0.06 k
B77.16 ± 0.01 a36.92 ± 0.01 m23.95 ± 0.01 b
C93.71 ± 0.01 h0.40 ± 0.02 a7.12 ± 0.01 a
AB183.29 ± 0.04 e13.90 ± 0.03 l34.52 ± 0.04 e
AB282.22 ± 0.03 cde11.59 ± 0.05 k38.25 ± 0.03 g
AB381.09 ± 0.07 c10.75 ± 0.02 j43.53 ± 0.03 i
AB478.38 ± 0.02 ab10.38 ± 0.07 i49.59 ± 0.01 l
AB577.46 ± 0.06 a9.79 ± 0.06 h54.39 ± 0.02 m
AC187.38 ± 0.04 g1.90 ± 0.02 b30.18 ± 0.04 c
AC285.52 ± 0.02 f2.98 ± 0.01 c33.32 ± 0.02 d
AC383.63 ± 0.07 e3.41 ± 0.06 d36.86 ± 0.06 f
AC481.51 ± 0.05 cd3.95 ± 0.03 e39.18 ± 0.05 h
AC579.54 ± 0.07 b7.20 ± 0.06 g46.72 ± 0.09 j
Mean values for triplicates ± SD. The values with different superscript letters are significantly different (p < 0.05).
Table 5. Two-way ANOVA analysis of variance for L*, a*, and b* of the tested fruit juices.
ParameterFactorDegree of FreedomSum of SquareMean SquareF Valuep Value
L*The addition of apple or strawberry juice1430.486430.48660.90<0.0001
rose juice6492.81982.136611.62<0.0001
Error76537.1837.06819
Sum831460.49
a*The addition of apple or strawberry juice12314.312314.3166.45<0.0001
rose juice61402.41233.7346.71<0.0001
Error762646.8534.8269
Sum836363.56
b*The addition of apple or strawberry juice11107.31107.3166.36<0.0001
rose juice69943.921657.32248.99<0.0001
Error76505.866.65606
Sum8311,557.1
Table 6. L-Ascorbic acid, L-Dehydroascorbic acid, total vitamin C, total phenolic content, and antioxidant capacity of the tested fruit juices.
SampleAADHAATAATPCAntioxidant
Capacity—DPPH
A198.30 ± 3.13 j55.30 ± 1.28 i253.60 ± 1.28 l272.93 ± 2.12 j36.06 ± 0.10 fg
B47.19 ± 0.50 e7.37 ± 0.79 b54.56 ± 0.28 b44.64 ± 0.91 a13.13 ± 0.05 a
C0.53 ± 0.14 a0.61 ± 0.15 a1.14 ± 0.11 a42.69 ± 1.11 a21.28 ± 0.16 b
AB153.29 ± 0.10 f36.50 ± 0.05 e89,79 ± 0.05 f164.40 ± 2.04 d30.38 ± 0.20 c
AB257.35 ± 0.17 g39.45 ± 0.11 f96.80 ± 0.29 g182.22 ± 3.03 e30.86 ± 0.53 c
AB360.23 ± 0.03 g42.79 ± 0.33 g103.02 ± 0.36 h215.89 ± 3.07 g32.96 ± 0.39 d
AB467.78 ± 0.93 h48.21 ± 1.73 h115.99 ± 0.79 i250.48 ± 1.44 i34,38 ± 0,49 e
AB575.65 ± 1.32 i56.56 ± 1.78 i132.21 ± 0.46 k306.17 ± 2.14 k37.16 ± 0.34 h
AC136.29 ± 0.58 b27.89 ± 0.76 c64.18 ± 1.34 c116.21 ± 2.65 b30.15 ± 0.35 c
AC239.41 ± 0.32 c32.11 ± 1.09 d71.52 ± 0.77 d155.42 ± 3.02 c32.51 ± 0.40 d
AC343.11 ± 0.40 d42.27 ± 0.64 g85.38 ± 0.24 e179.22 ± 3.65 e35.22 ± 0.15 ef
AC449.28 ± 0.54 e56.11 ± 0.57 i105.39 ± 0.03 h199.43 ± 3.21 f36.68 ± 0.48 gh
AC558.20 ± 0.69 g61.23 ± 0.15 j119.43 ± 0.55 j230.87 ± 2.98 h39.23 ± 0.06 i
Mean values for triplicates ± SD. The values with different superscript letters are significantly different (p < 0.05). Abbreviations: AA—L-ascorbic acid (mg/100 mL); DHAA-L-dehydroascorbic acid (mg/100 mL); TAA—total vitamin C (mg/100 mL); TPC—Total phenolic content (mg GAE/100 mL); GAE: gallic acid equivalent; Antioxidant capacity—DPPH (µM Trolox/mL); DPPH—2,2-diphenyl-1-picrylhydrazyl radical scavenging activity.
Disclaimer/Publisher’s Note: The statements, opinions and data contained in all publications are solely those of the individual author(s) and contributor(s) and not of MDPI and/or the editor(s). MDPI and/or the editor(s) disclaim responsibility for any injury to people or property resulting from any ideas, methods, instructions or products referred to in the content.

