1. Introduction
The development and subsequent use of interactive technologies can be described as exponential. VR technology has led to the development of many new applications with commercial use, primarily in the entertainment industry. Due to significant progress in both software and hardware, VR has wide application potential in industrial practice and education. The use of VR for interactive projects or training activities is highly effective, as evidenced by the case study in the article. It is possible to focus on design and prototyping as well. For example, in assembly and training tasks, it provides a suitable platform for learning through practice [
1,
2], where the transfer of CAD models in a virtual environment gives the user a sense of the real environment and avoids concerns about any component failure, breakage and safety risks [
1,
2,
3,
4]. The authors of [
5] proved in a case study that the use of several software tools and the analysis of applications of related programs provide an opportunity to combine relevant approaches to the reproduction of a research object with 3D reconstruction.
VR can be considered a prospective technology for supporting the implementation of Industry 4.0 principles [
2].
The authors of [
2] state that the development of a universal standard for modelling 3D objects for VR applications would save redundant conversion processes between data from different sources. User interface (UI) design in a VR environment is, therefore, another challenge for improving the use of VR. In addition, studying within a standardized VR user interface and interaction design can facilitate the learning process for users.
The authors of [
1,
2,
3,
4] define the key factors of successful adaptation of VR with the user through the acceptance of a standardized design of VR interaction, which of course requires better communication and more related training. In the study, the interactive nature of the proposed guidelines manifests itself in two directions, i.e., the interactivity of VR systems and the interactivity of the factory layout planning (FLP) process. Various interaction designs have been implemented and tested in the VR system to bring the experience closer to reality.
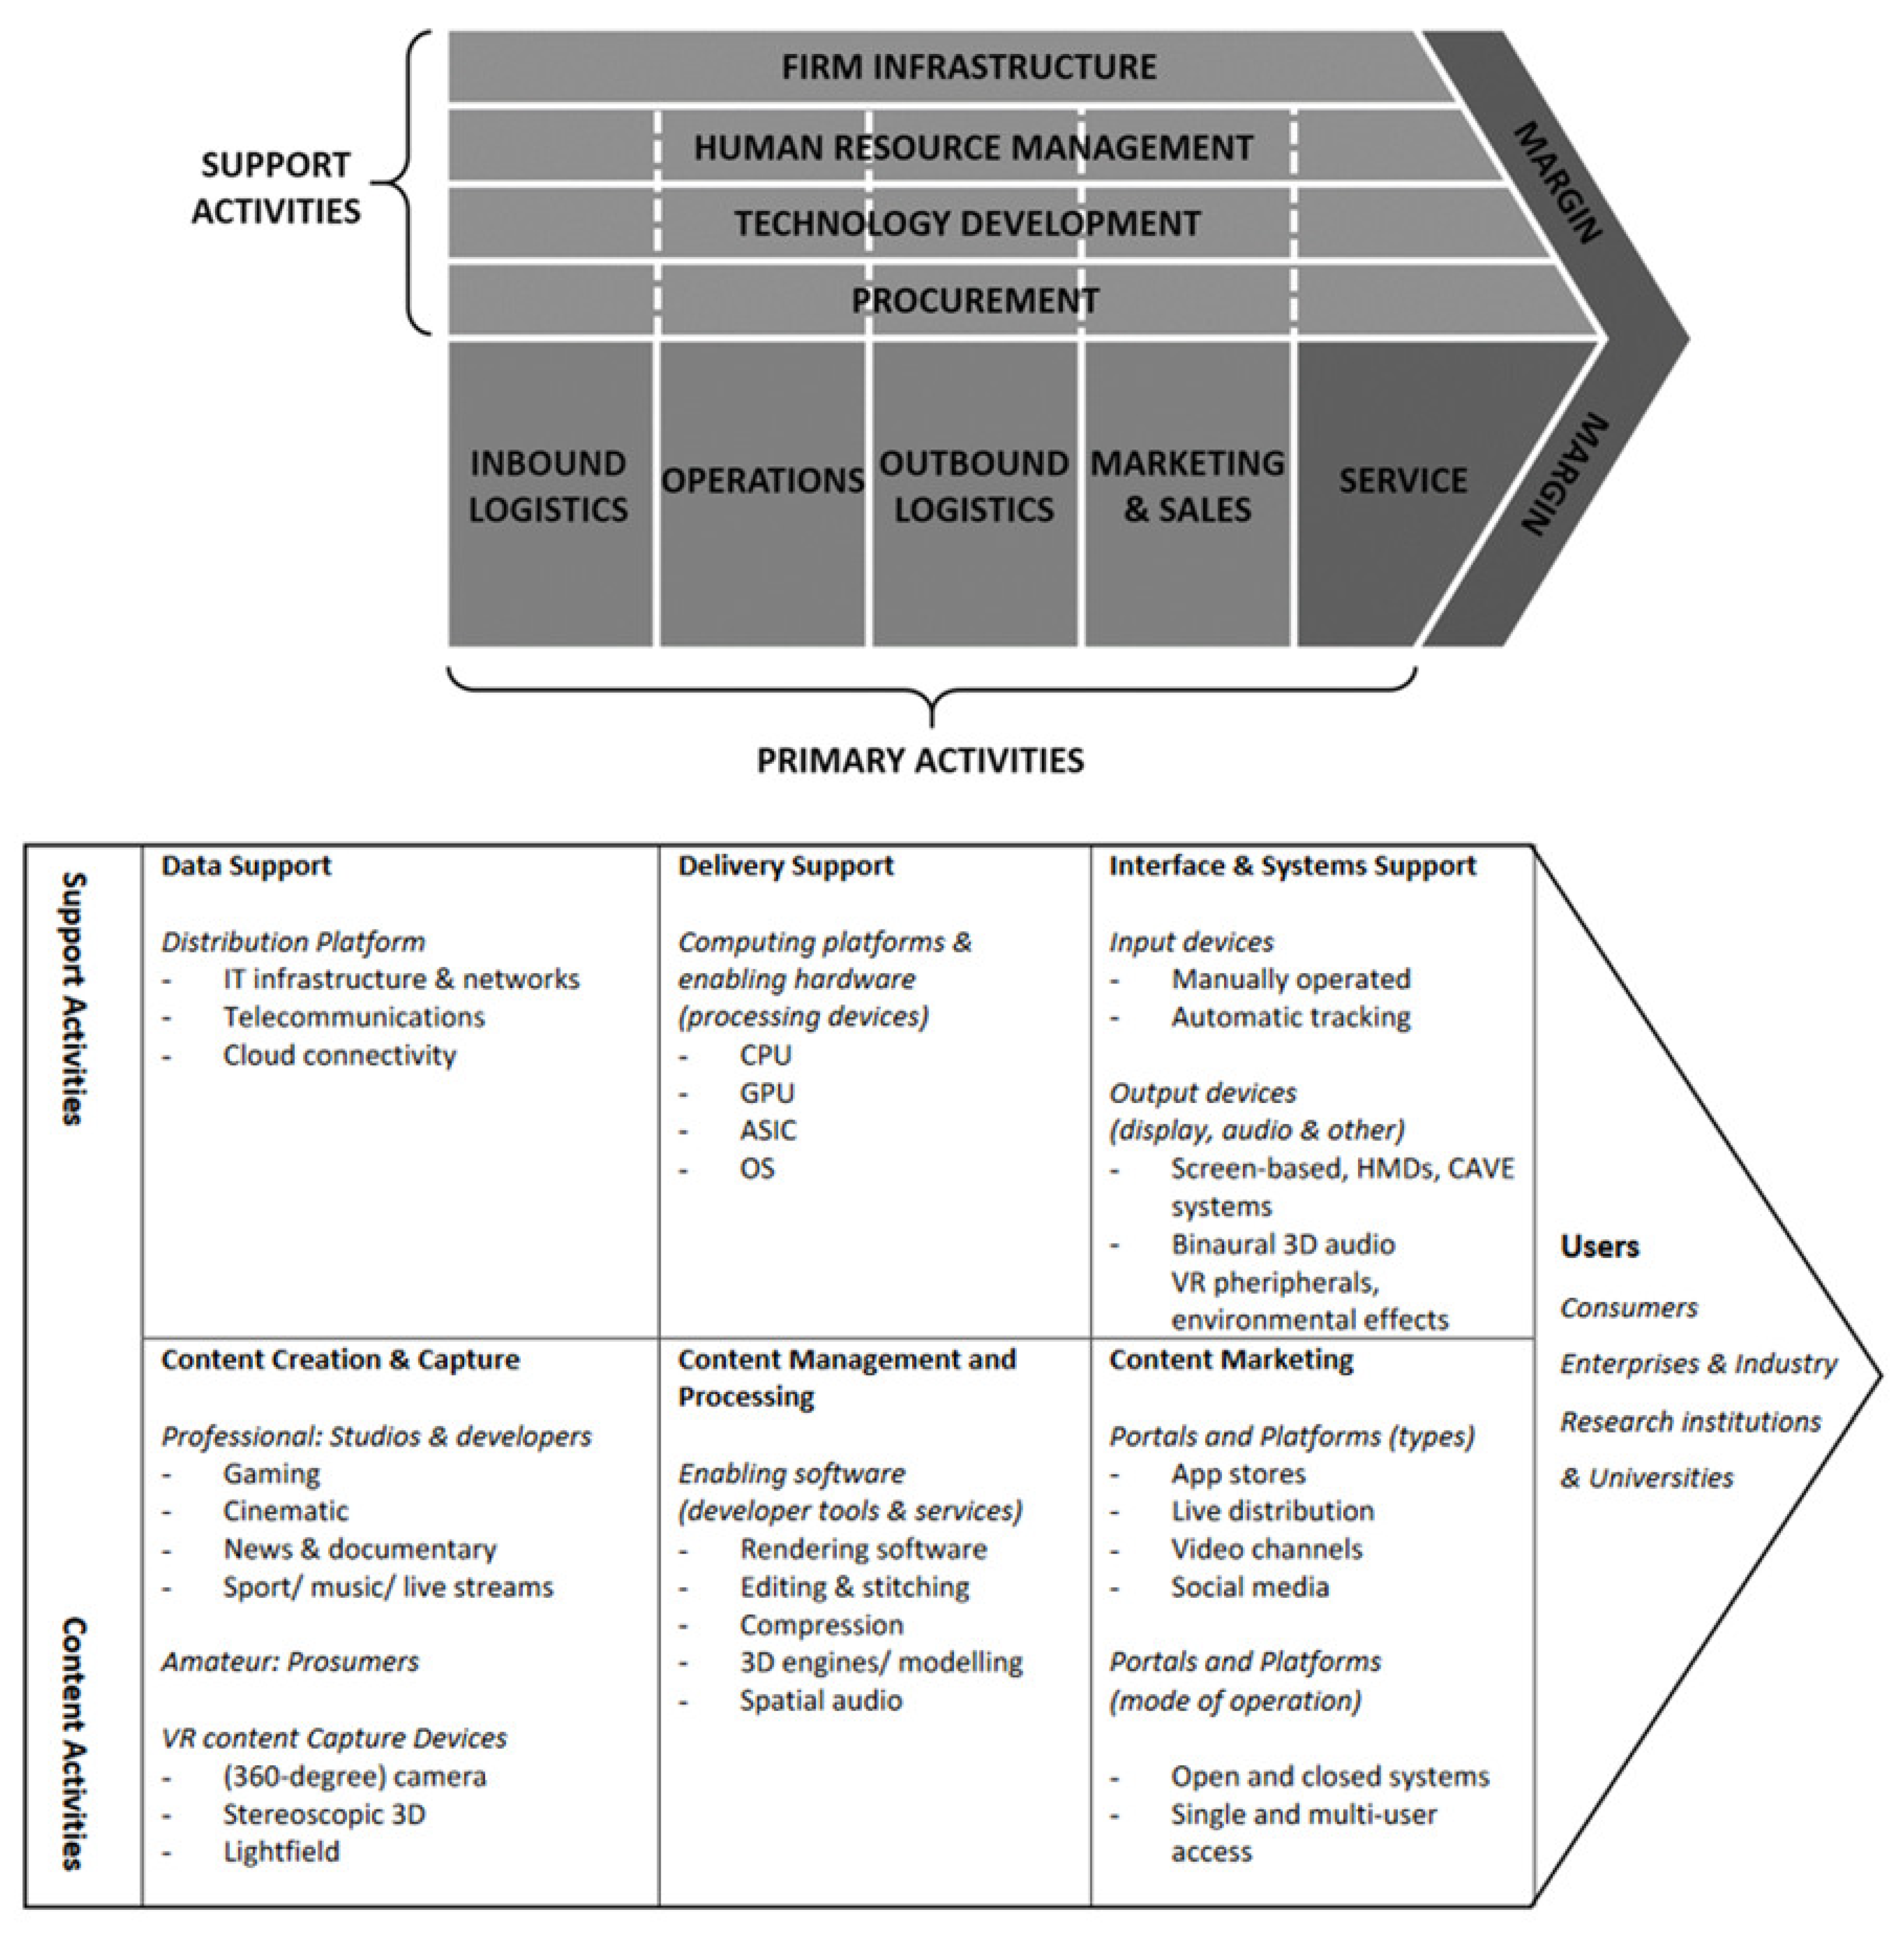
Interesting from the point of view of a scientific approach is the processing of Porter’s value chain for virtual reality at work [
4] (
Figure 1). In general, the goal is to process the potential of achieving a profit margin and create a strategy for both short-term and long-term growth. From the point of view of applying virtual reality, the authors defined three core processes for secondary activities, i.e., content creation and capture, content management and processing and content marketing.
In [
6], the author offers a procedure for creating an expert system, while the logical sequence given in the algorithm is partially usable in the solution of the presented case study. These are basic phases that can be generalized, i.e., acquisition and preparation of the necessary data, preparation of the simulation model, implementation of data and settings conversion, implementation of calculations of a specific parameter and display of the obtained results in the simulation model and in numerical expression.
The authors of studies [
7,
8,
9,
10] agree that the principles of computer simulation models remain the same, but they change the view of the resulting display and simulations of guidance, which assess new and realistic 3D—and realistically oriented computer simulation—systems [
11,
12]. The success of most companies depends on intangible assets and investment in research and development (R&D), which create this type of asset within the company [
13].
An extensive study by the authors of [
14] is aimed at defining the expectations of the transformation of Industry 4.0 into the concept of Industry 5.0. They emphasize that globalization and the development of Economy 4.0 supported by the development of Industry 4.0 and Industry 5.0 make it possible to create new value. The authors’ observations and analyses confirm the dehumanization of the industry due to the influence of Industry 4.0. It is an opportunity for businesses to create a network of value through intelligent systems throughout the supply chain, which will lead to the shift of the just-in-time manufacturing model to a higher level. The latest professional studies reflect the concept of Industry 5.0, and are aimed at reversing the dehumanization of industry while considering the fundamental role of man in society. Here, it is possible to see the potential of using VR to involve people in the value chain as part of the technological elements from the Industry 4.0 platform.
In connection with the above-mentioned facts and understanding the complexity of I4.0, respectively, I5.0 brings into focus the research of economic and political factors that create an environment for technological development and are related to the country’s risk. The authors of [
15] based their research on the economic and financial difficulties that the countries face, as well as based on the investment environment of the country’s risk assessment.
The lack of interactivity of real elements with a peripheral 3D environment created for VR in CAD software is problematic in relation to designing only in a VR environment. In this context, it will be necessary to carry out further research, i.e., achieve a higher degree of immersion in the VR environment with a high degree of interactivity between the designer and individual elements of the system as well as flexibility in designing, testing and optimizing designs. In this context, it is necessary to emphasize 3D prototyping in VR. Other equipment also includes spatial equipment to ensure safety when using VR directly in operation.
The use of VR also has negative aspects which can be eliminated by further development, especially of technical elements, or hardware, as the use of headsets poses a health risk and can cause discomfort when moving. It is also necessary to reduce the costs associated with the use of VR.
Another shift in the thinking of VR when solving research tasks connected with designing, virtual training, etc. will be the modelling of physical factors, e.g., vibration, temperature, humidity, sound, lighting, power, and other parameters. This progress will be an added value when testing the impact of changing selected physical factors in the process (such as the DOE/Design of Experiment method) with the aim of achieving complex process optimization. It can also add value for systems in defining key parameters and effectively interpret results with informative value for their further use. This approach will be supported by the algorithmizing of the behavior of individual elements of the system using classic methods such as Markov chains, neural networks, etc. to define relationships between individual parameters and the use of artificial intelligence in machine learning and in the context of digitization.
3. Results
Development of a General Procedure for Modelling and Testing a Virtual Model
The smart factory is one of the pillars of Industry 4.0, which means complex digitization and networking of individual components in the company. It is a system solution that creates a flexible network of intelligent elements of the company. Individual elements that are part of it behave as self-managing and self-regulating, using advanced technologies such as artificial intelligence and machine learning to analyze data, manage automated processes and learn. Unstable markets with high volatility mean the company needs to respond flexibly to ensure competitiveness; therefore, even by introducing agile and intelligent elements into production systems, the company can reflect on decreasing order sizes as well as increasing diversity and pressure for the shortest possible delivery times.
A smart factory is a computerized physical system with the ability to visualize the end-to-end operation of manufacturing facilities and their associated supply chains.
Visualization provides a representation of how resources are used in real-time, enabling optimized decisions based on production data or logistics in real-time, allowing for simulation of robot–human interaction or creation and optimization of production layouts.
This is a leap change, as it creates a complex intelligent system by using software support focused on modelling and simulation of discrete events connected with 3D presentation and intelligent software focused on data analysis.
The visualization provided by discrete event simulation and 3D representation is considered a scenario that can be created and tested within hours and offers a real advantage over various manual approaches. The virtual factory does not fully incorporate the technologies of production systems available today and is not fully connected with real-time data analysis.
The outputs from the decision-making process can be visualized in virtual and mixed reality through software and hardware support. In this way, an interactive space is created for the end user, which becomes part of the virtual space. End-to-end connectivity also enables decision support and real-time data analysis.
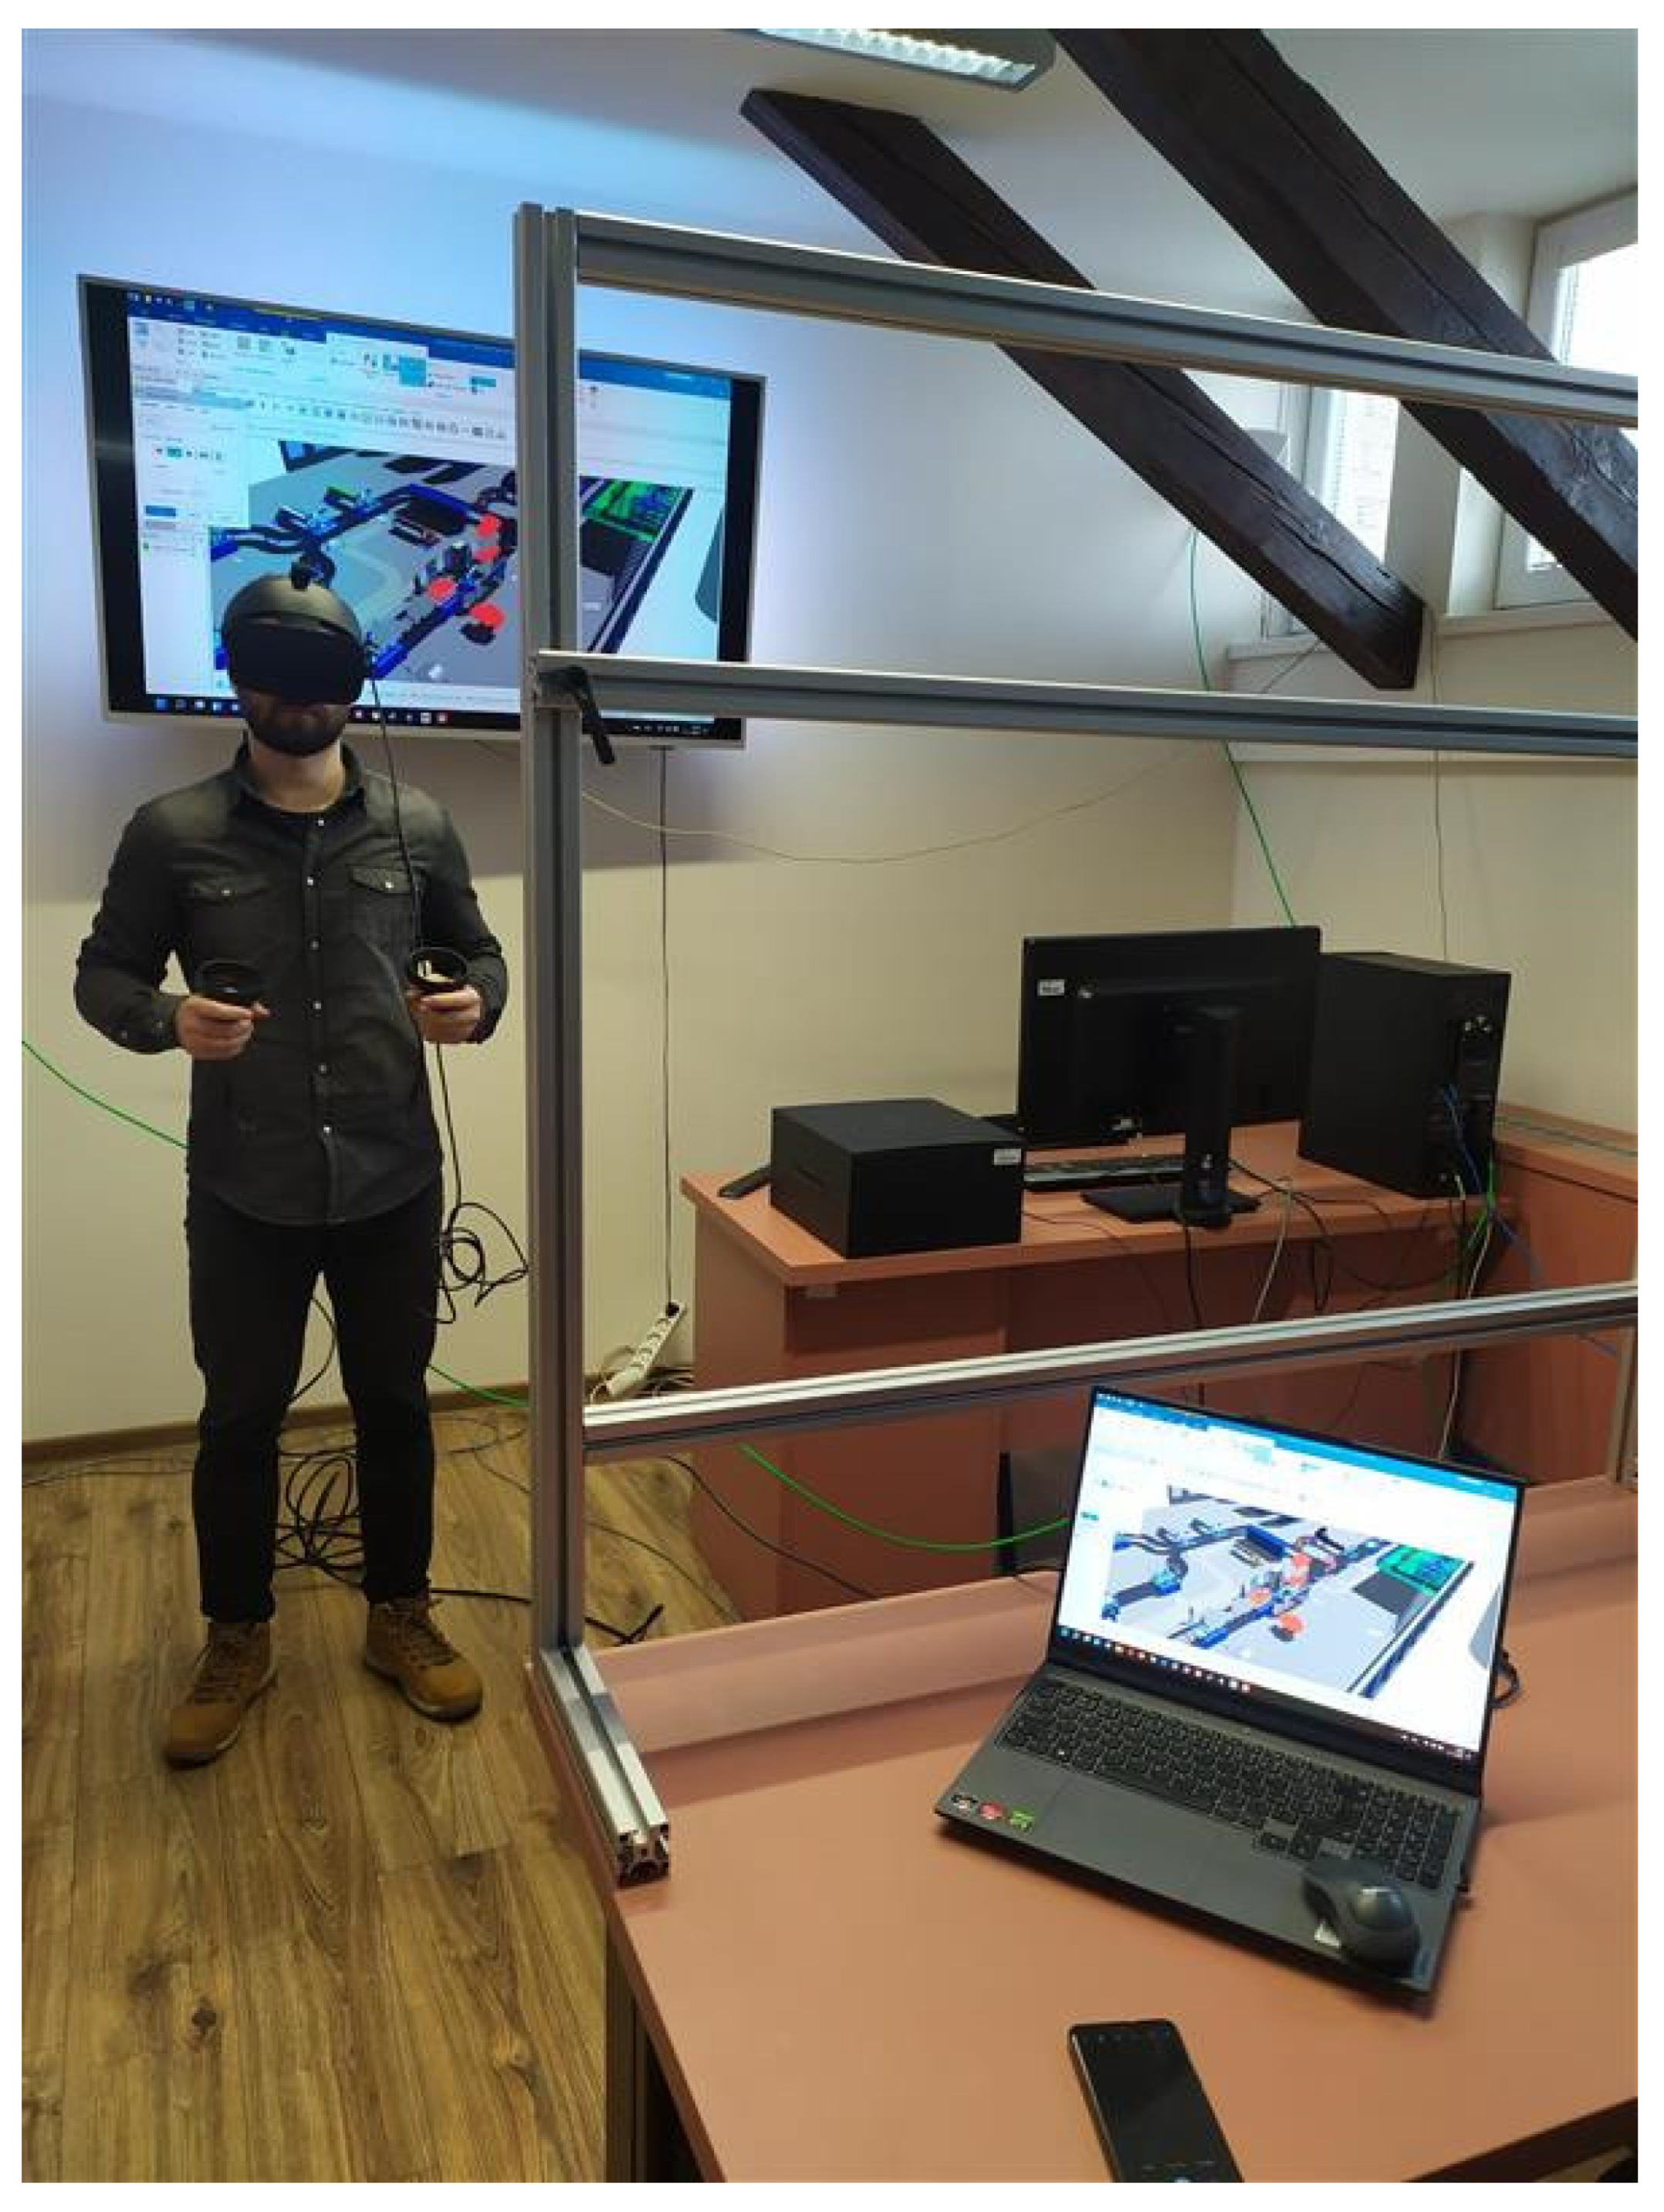
With a traditional type of factory, the availability of data and resources for their processing is relatively limited; it does not allow users to immerse themselves in the simulated running of the created model of the production system, and it does not allow for the collection, processing and evaluation of data in real-time; thus, flexible reflection on specific needs becomes impossible. A smart factory in conjunction with VR in a mixed reality environment can be very beneficial in solving challenges in an interactive way that includes individual managers (
Figure 8).
The simulation model can be looked at from different points of view. The movement of workers in a factory can highlight potential conflicts and obstacles that may occur in real life if created in 3D. Creating a 3D model of the operation is a basic requirement for using VR. A user who has VR glasses can become part of the simulation run and view a running simulation model of the production line. This will allow him to integrate with the model in real-time, be part of various solutions and decide, based on the results of experiments, which of the variants is optimal for the given conditions and the pursued goal.
Another potential of the combination of VR and the simulation model is the implementation of the customer as a part of PLM in its various phases. For example, they can be implemented within the initial stages of PLM, i.e., the design of structural or technological parameters of the product, or also the stages of the production, assembly and logistics processes. In each phase, it is necessary to define metrics that will be an important basis of criteria for validating the simulation model. From the customer’s point of view, for example, in the validation process, the manufacturability of the product and modifications on the production line are considered, and logistical solutions are proposed. Visualization of the product or production currently has a significant impact on the creation of an interactive network with customers based on trust and building quality supplier–customer relationships. Positive evaluations from customers can help strengthen relationships and build trust in the manufacturer’s capabilities and competencies [
16].
The following diagram (
Figure 9) shows the general procedure for modelling and testing the virtual model. It was processed according to both [
18,
19] and its own solution in laboratory conditions at the Department of Industrial and Digital Engineering. For formal design of the diagram, ARIS is used [
20].
This is a procedure that was tested during the implementation of a case study. The procedure can be divided into three stages, i.e.,:
- 9.
Creation of a virtual model, which is also a simulation model;
- 10.
Testing and tuning the simulation model;
- 11.
Virtual tour with the possibility of interactivity with individual elements of the simulation model in a virtual environment.
In the procedure, three monitored areas are marked in color which form part of the overall virtual and simulation model, i.e., physical production, virtual production and service system in production.
4. Discussion
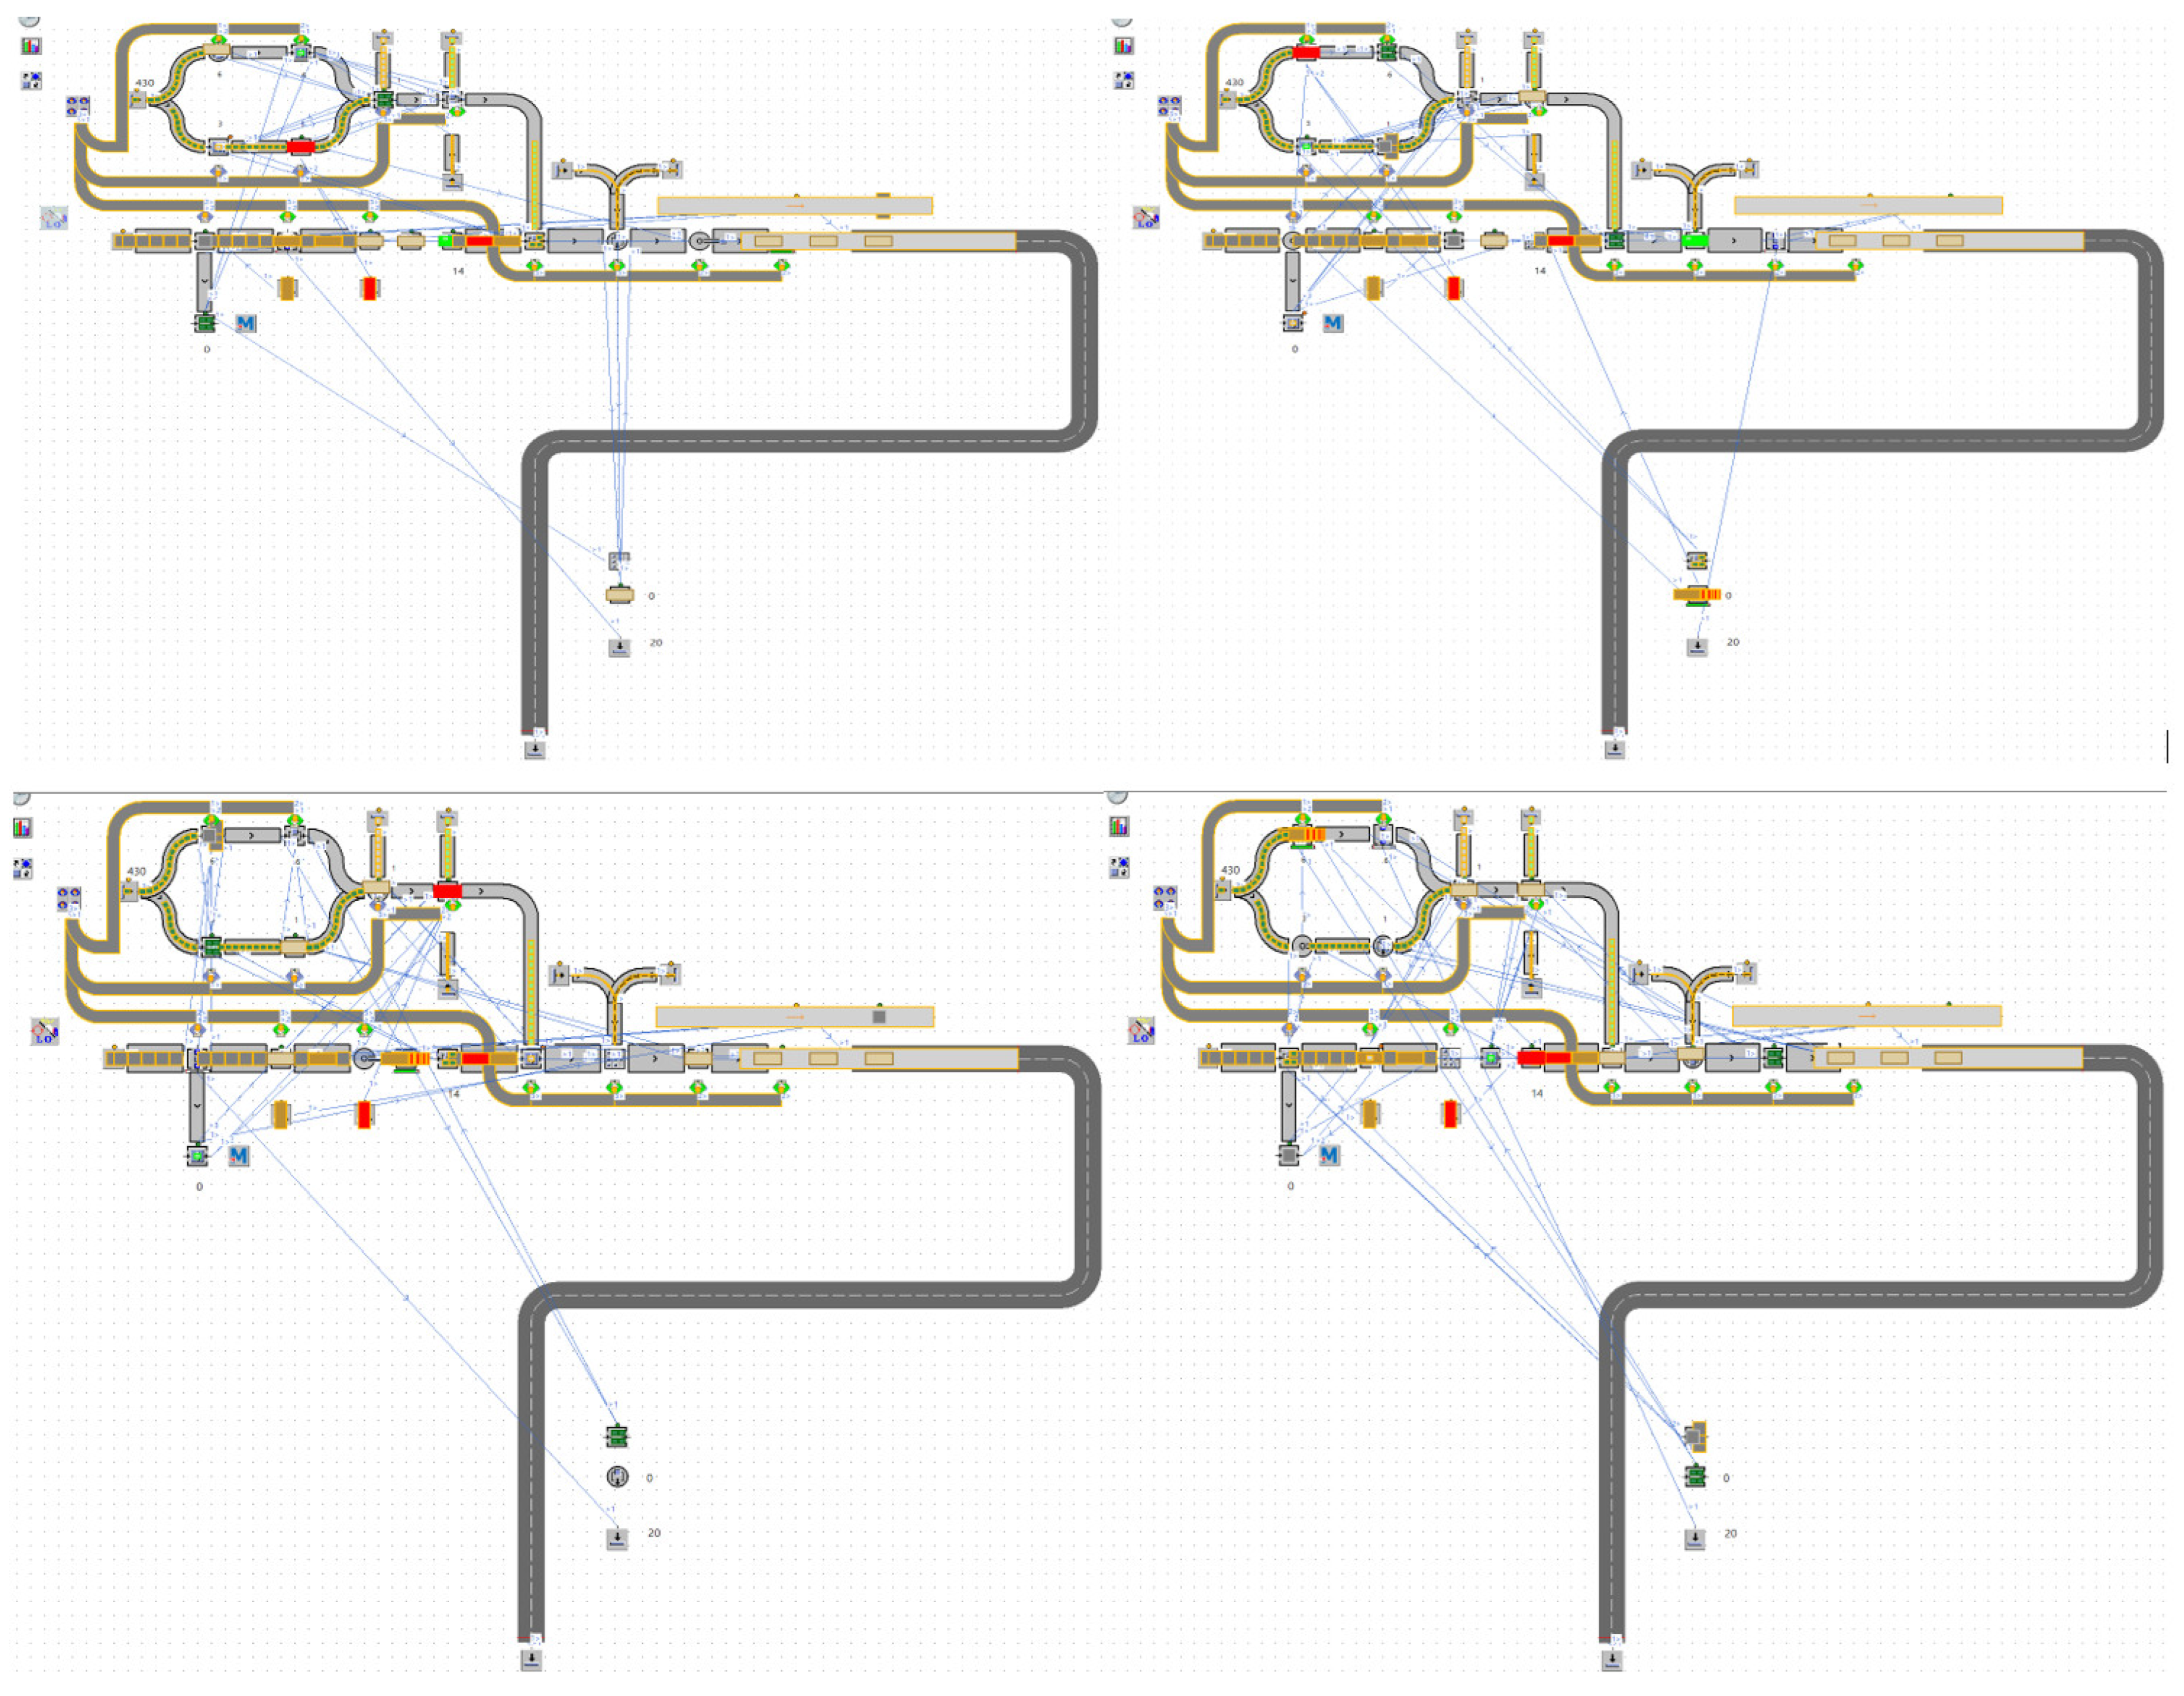
The simulation model was created in the laboratory conditions of the author’s collective using the software and hardware support that the workplace has, i.e., TX Plant Simulation software for modelling and simulating flows, Pixies software for creating a virtual environment, Oculus Quest virtual reality glasses and CAD software for creating selected 3D elements of the production–assembly process. The created simulation model represents the production–assembly process in which the user can move, interact with objects in the model, detect weak points and simulate variant solutions. The results and the progress of the case study implementation led the authors to conclude that the time related to analysis and experimentation in the virtual environment was significantly reduced and made more efficient, making it possible to quickly and efficiently process and subsequently evaluate variant solutions.
The aim of the processed case study was to point out the use of virtual reality in the simulation of business processes. Based on the problem solved, the TX Plant Simulation software was chosen in the work which allows the creation of a simulation model, starting the simulation and visual display in a virtual environment with the support of virtual reality glasses and hand controllers.
The authors of [
21,
22,
23,
24,
25] prove that the dynamic DES can be considered an effective tool to define the bottlenecks—and, thus, create the potential for response with timely intervention—in the planning. It also makes it possible to find alternative solutions that aim to eliminate negative impacts, e.g., increased costs related to an incorrect decision or investment in unnecessary technology with a low usability threshold. The authors express an opinion on the importance of connecting DES and VR, with a gradual introduction to all production lines in the context of a smart factory. It is also required to be implemented in education processes to raise qualified personnel to acquire competencies in the given field. The implementation of virtual reality in the education process is also of great importance due to the impact it can have on knowledge retention, as it is a visual—and, at the same time, interactive—way of acquiring knowledge and skills. Important, too, are motivational factors and engagement factors that could be developed compared to traditional methods of education.
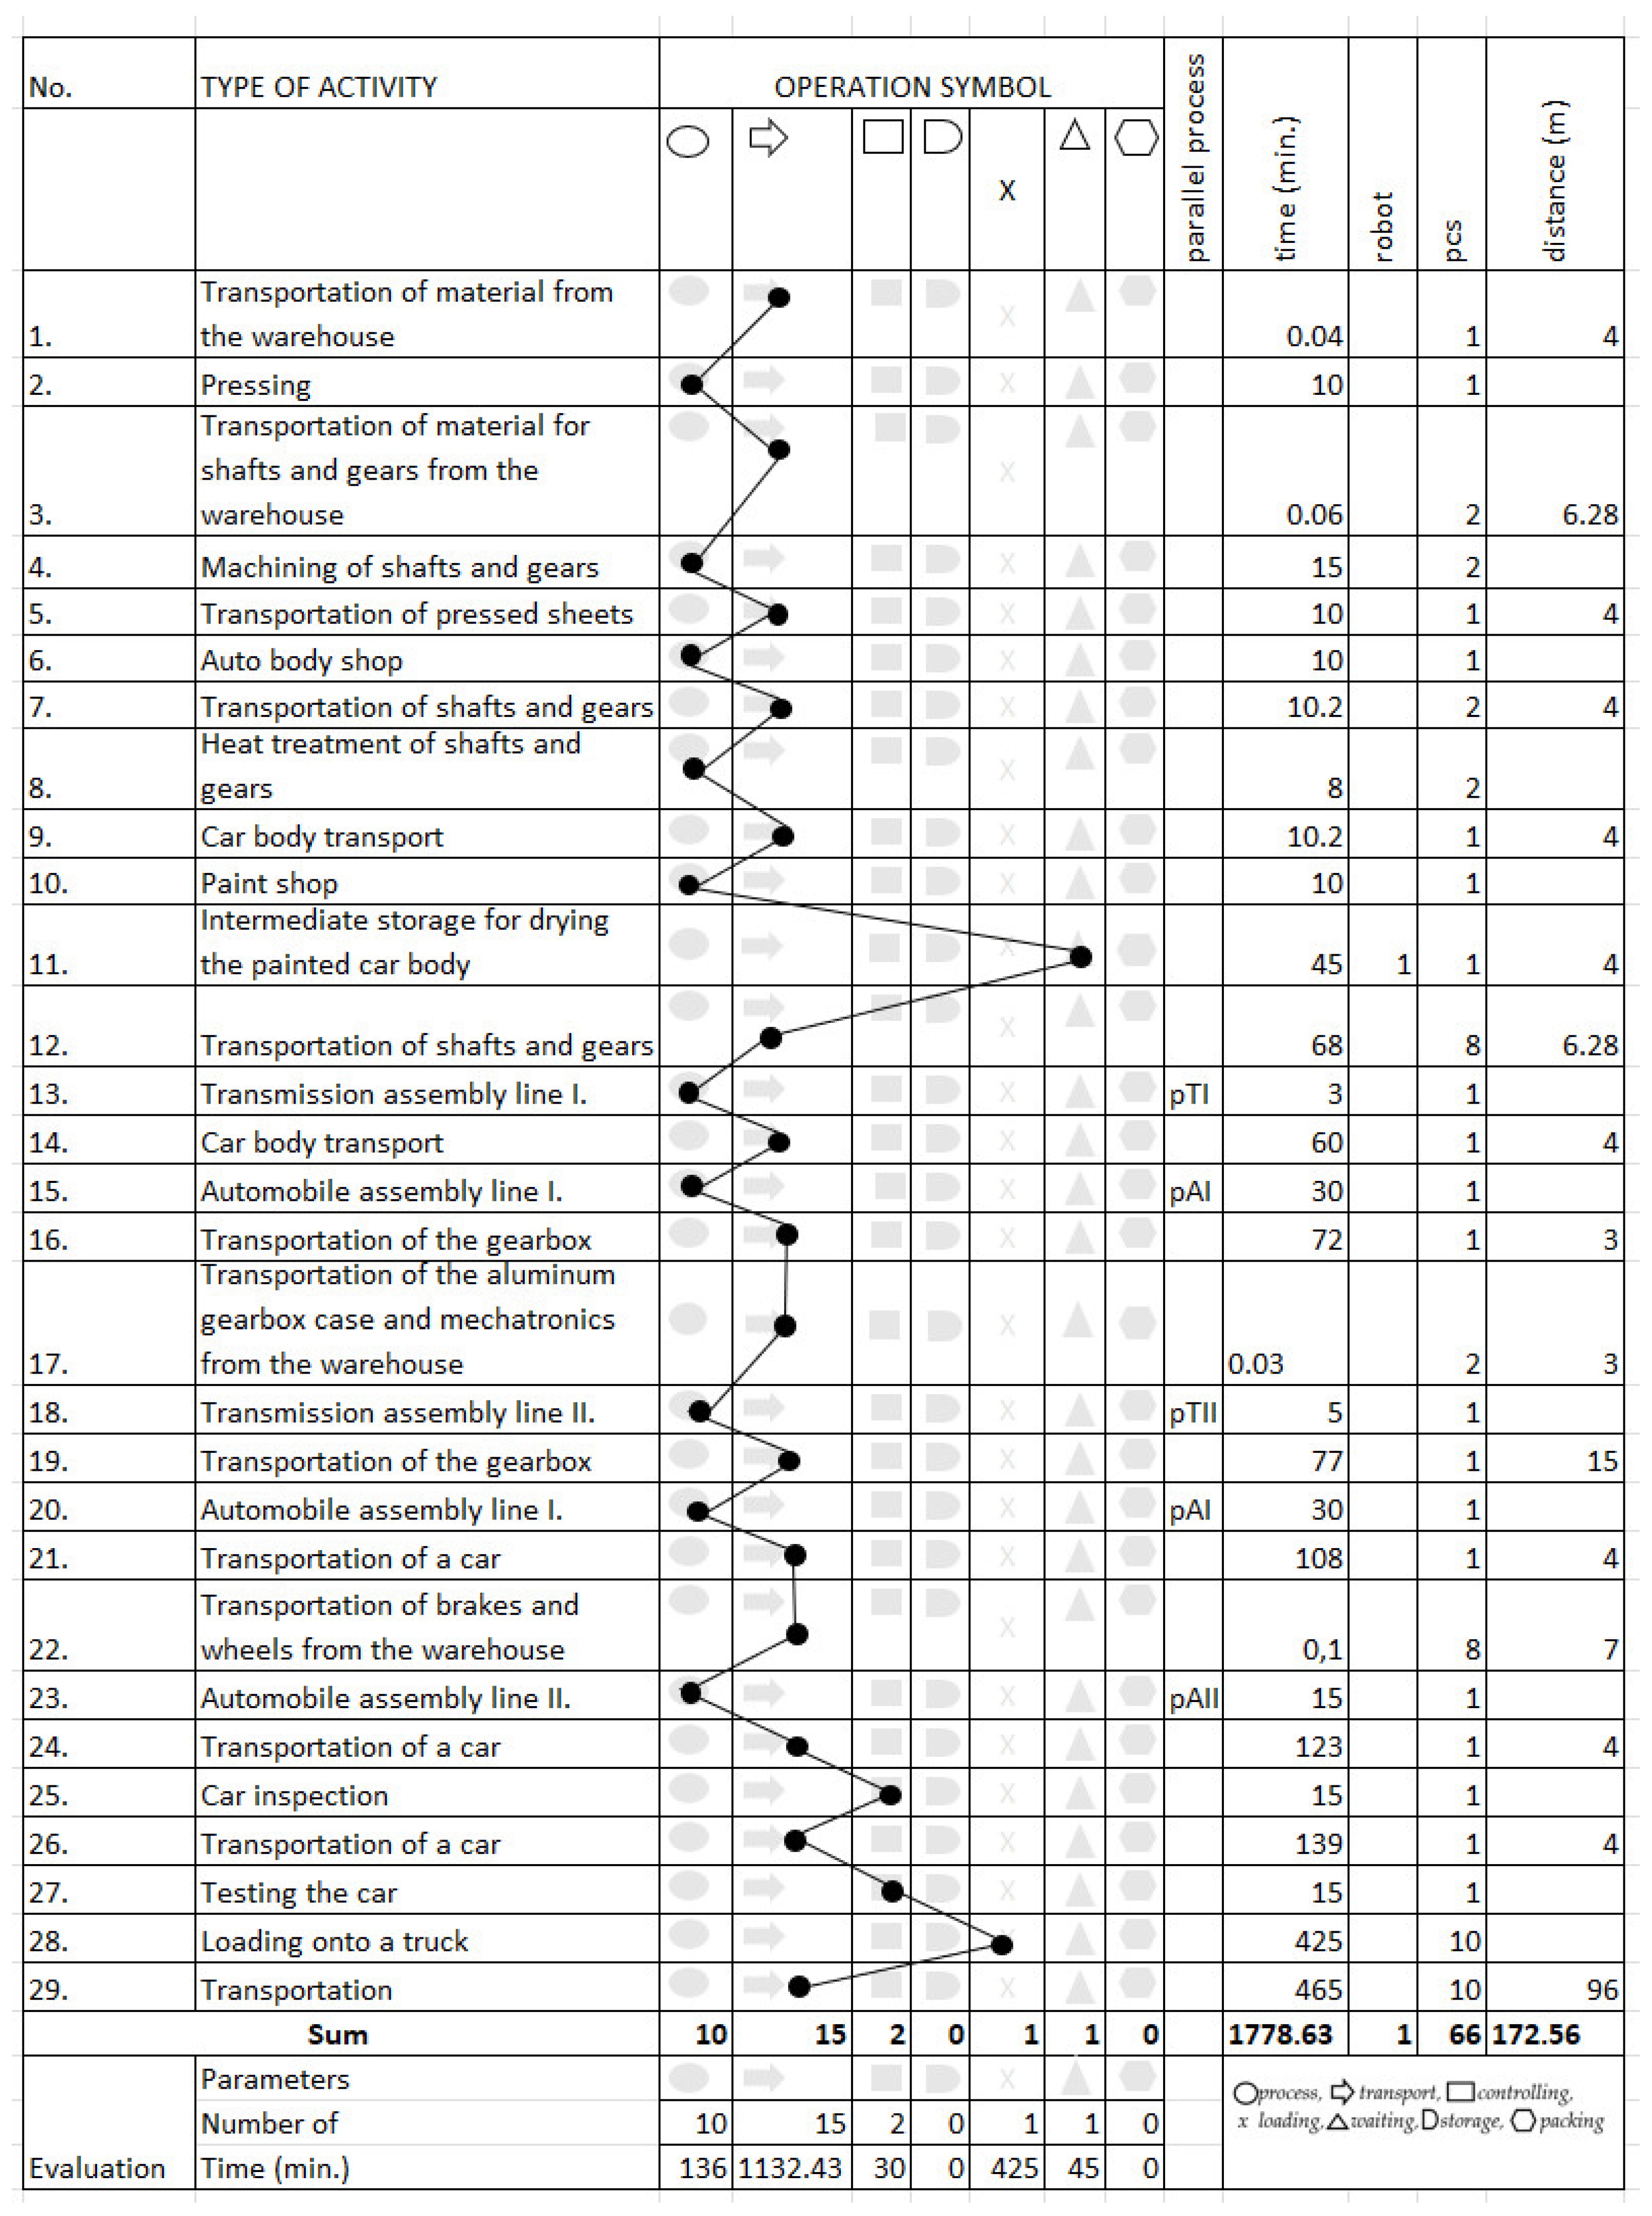
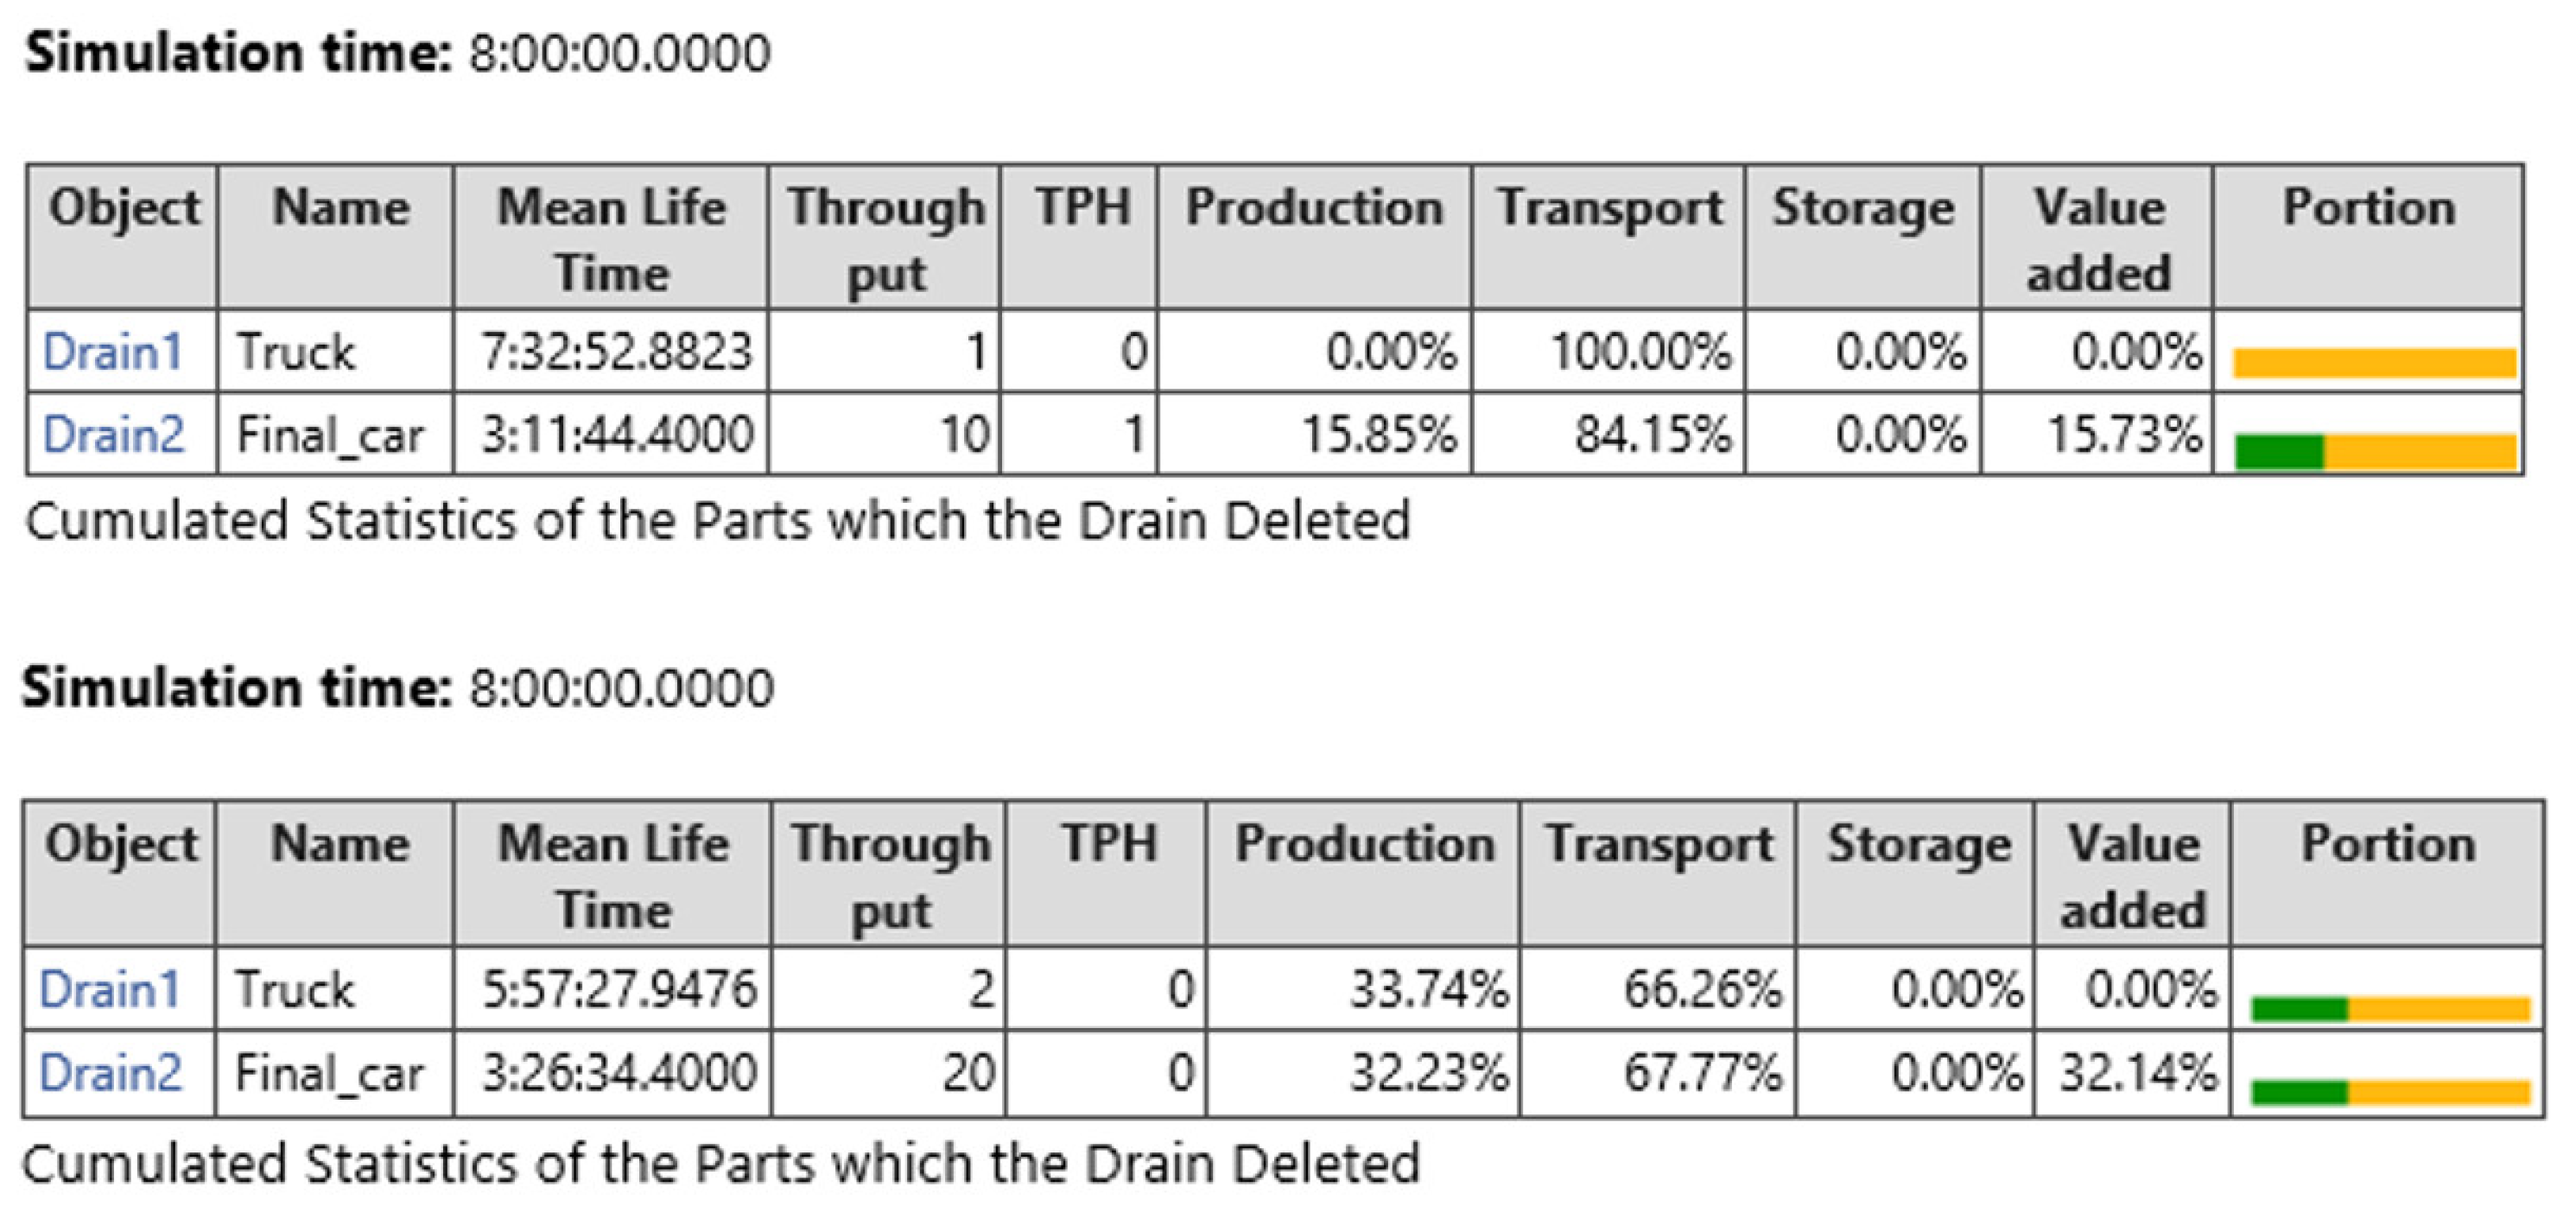
Currently, virtual reality is a great benefit for companies because, with the help of virtual reality and the simulation of the production process, companies can reveal bottlenecks or bugs to be ironed out before changes are implemented in real life. By running the simulation, the created automobile production was tested, and, according to the graph of the simulated work processes, it was possible to find out where bottlenecks occur, which production stations are waiting or blocked, etc. According to the graph, but also based on the evaluation of the summary overview from the simulation, improvements and modifications to automobile production were proposed. The simulation model was created on the basis of selected methods for the analysis of material flows. These methods were specifically concerned with the creation of the production process diagram, the production process graph and the step-by-step creation of the simulation process. By using the TX Plant Simulation software and the designed simulation model, the company can design the optimization of production and, thus, increase production and, with it, profit for the company. By testing the changes in TX Plant Simulation, there will not be such huge errors as if tested directly in the company and, thus, unnecessary problems can be avoided. The processed case study was carried out with the aim of creating and testing a virtual model in a VR space. One of the possibilities was to arrive at a relatively quick result in terms of testing variant solutions with the possibility of direct visualization of designs. Tendencies in further use can be seen in the digital twin, i.e., creating an interactive environment by connecting physical and virtual space. Interactive visualization significantly increases the efficiency of projects and, above all, activities connected with testing and finding the optimal setting of individual system elements.
5. Conclusions
Virtual reality is currently a very promising direction in the context of interactive designing and projecting environments with different characters. The benefit is primarily shortening the time and increasing the quality of the process and output from the design process. It allows the creation of models of workplaces, i.e., production and assembly lines, and creates an image of them as if they were real objects. Many companies also have experience with virtual training, which significantly increases efficiency, e.g., assembly activities. In addition to significant advantages, it is also possible to mention the disadvantage of using VR, which is the price or costs associated with hardware and software security. However, this disadvantage is currently limited by simulation software, which contains modules for creating a virtual environment, due to the exponential scientific–technical and technological development required, especially in the field of digitization. Within VR, it is possible to use simulation and animation software support.
The potential of using VR can also be seen when designing the ergonomic parameters of the workplace; e.g., the authors of [
26] created a simulation of the lighting of the working environment using the Dialux simulation software in a 3D environment, which can be used for further research when already in the virtual space using VR tools.
The purpose of connecting TX Plant Simulation with VR is the possibility of immersing yourself in the created simulation environment with the aim of visual controlling the created environment and ongoing processes, where it is possible to move using the VR controllers and see close-up the errors and shortcomings which can then be eliminated or even completely removed when a new enterprise or a new production process in an already established enterprise is introduced [
27,
28]. The potential for the future of the TX Plant Simulation software and the connection with VR could also be in the ability to move objects in the given environment or otherwise physically intervene in the simulation and, in this way, efficiently and quickly test and evaluate variants and make adjustments directly in virtual reality, etc. It should be noted that not only optical and auditory sensations are included in VR, but also sensations for other senses such as touch and smell in order to create a perfect image with all aspects characteristic of the real world.
Advanced information processing also enables the development of increasingly advanced IT diagnostic techniques, enabling efficient registration and analysis of signals while eliminating the human factor, thus ensuring an increase in the objectivity of the obtained results [
29].
