
Similarity Model Test on Stress and Deformation of Freezing Pipe in Composite Strata during Active Freezing


Abstract
:1. Introduction
2. Similarity Model Test
2.1. Test Modeling Based on Similarity Criteria
2.1.1. Similarity Criteria
- (1)
- Temperature field criterion
- (2)
- Water field criterion
- (3)
- Stress field criterion
2.1.2. Model Parameter
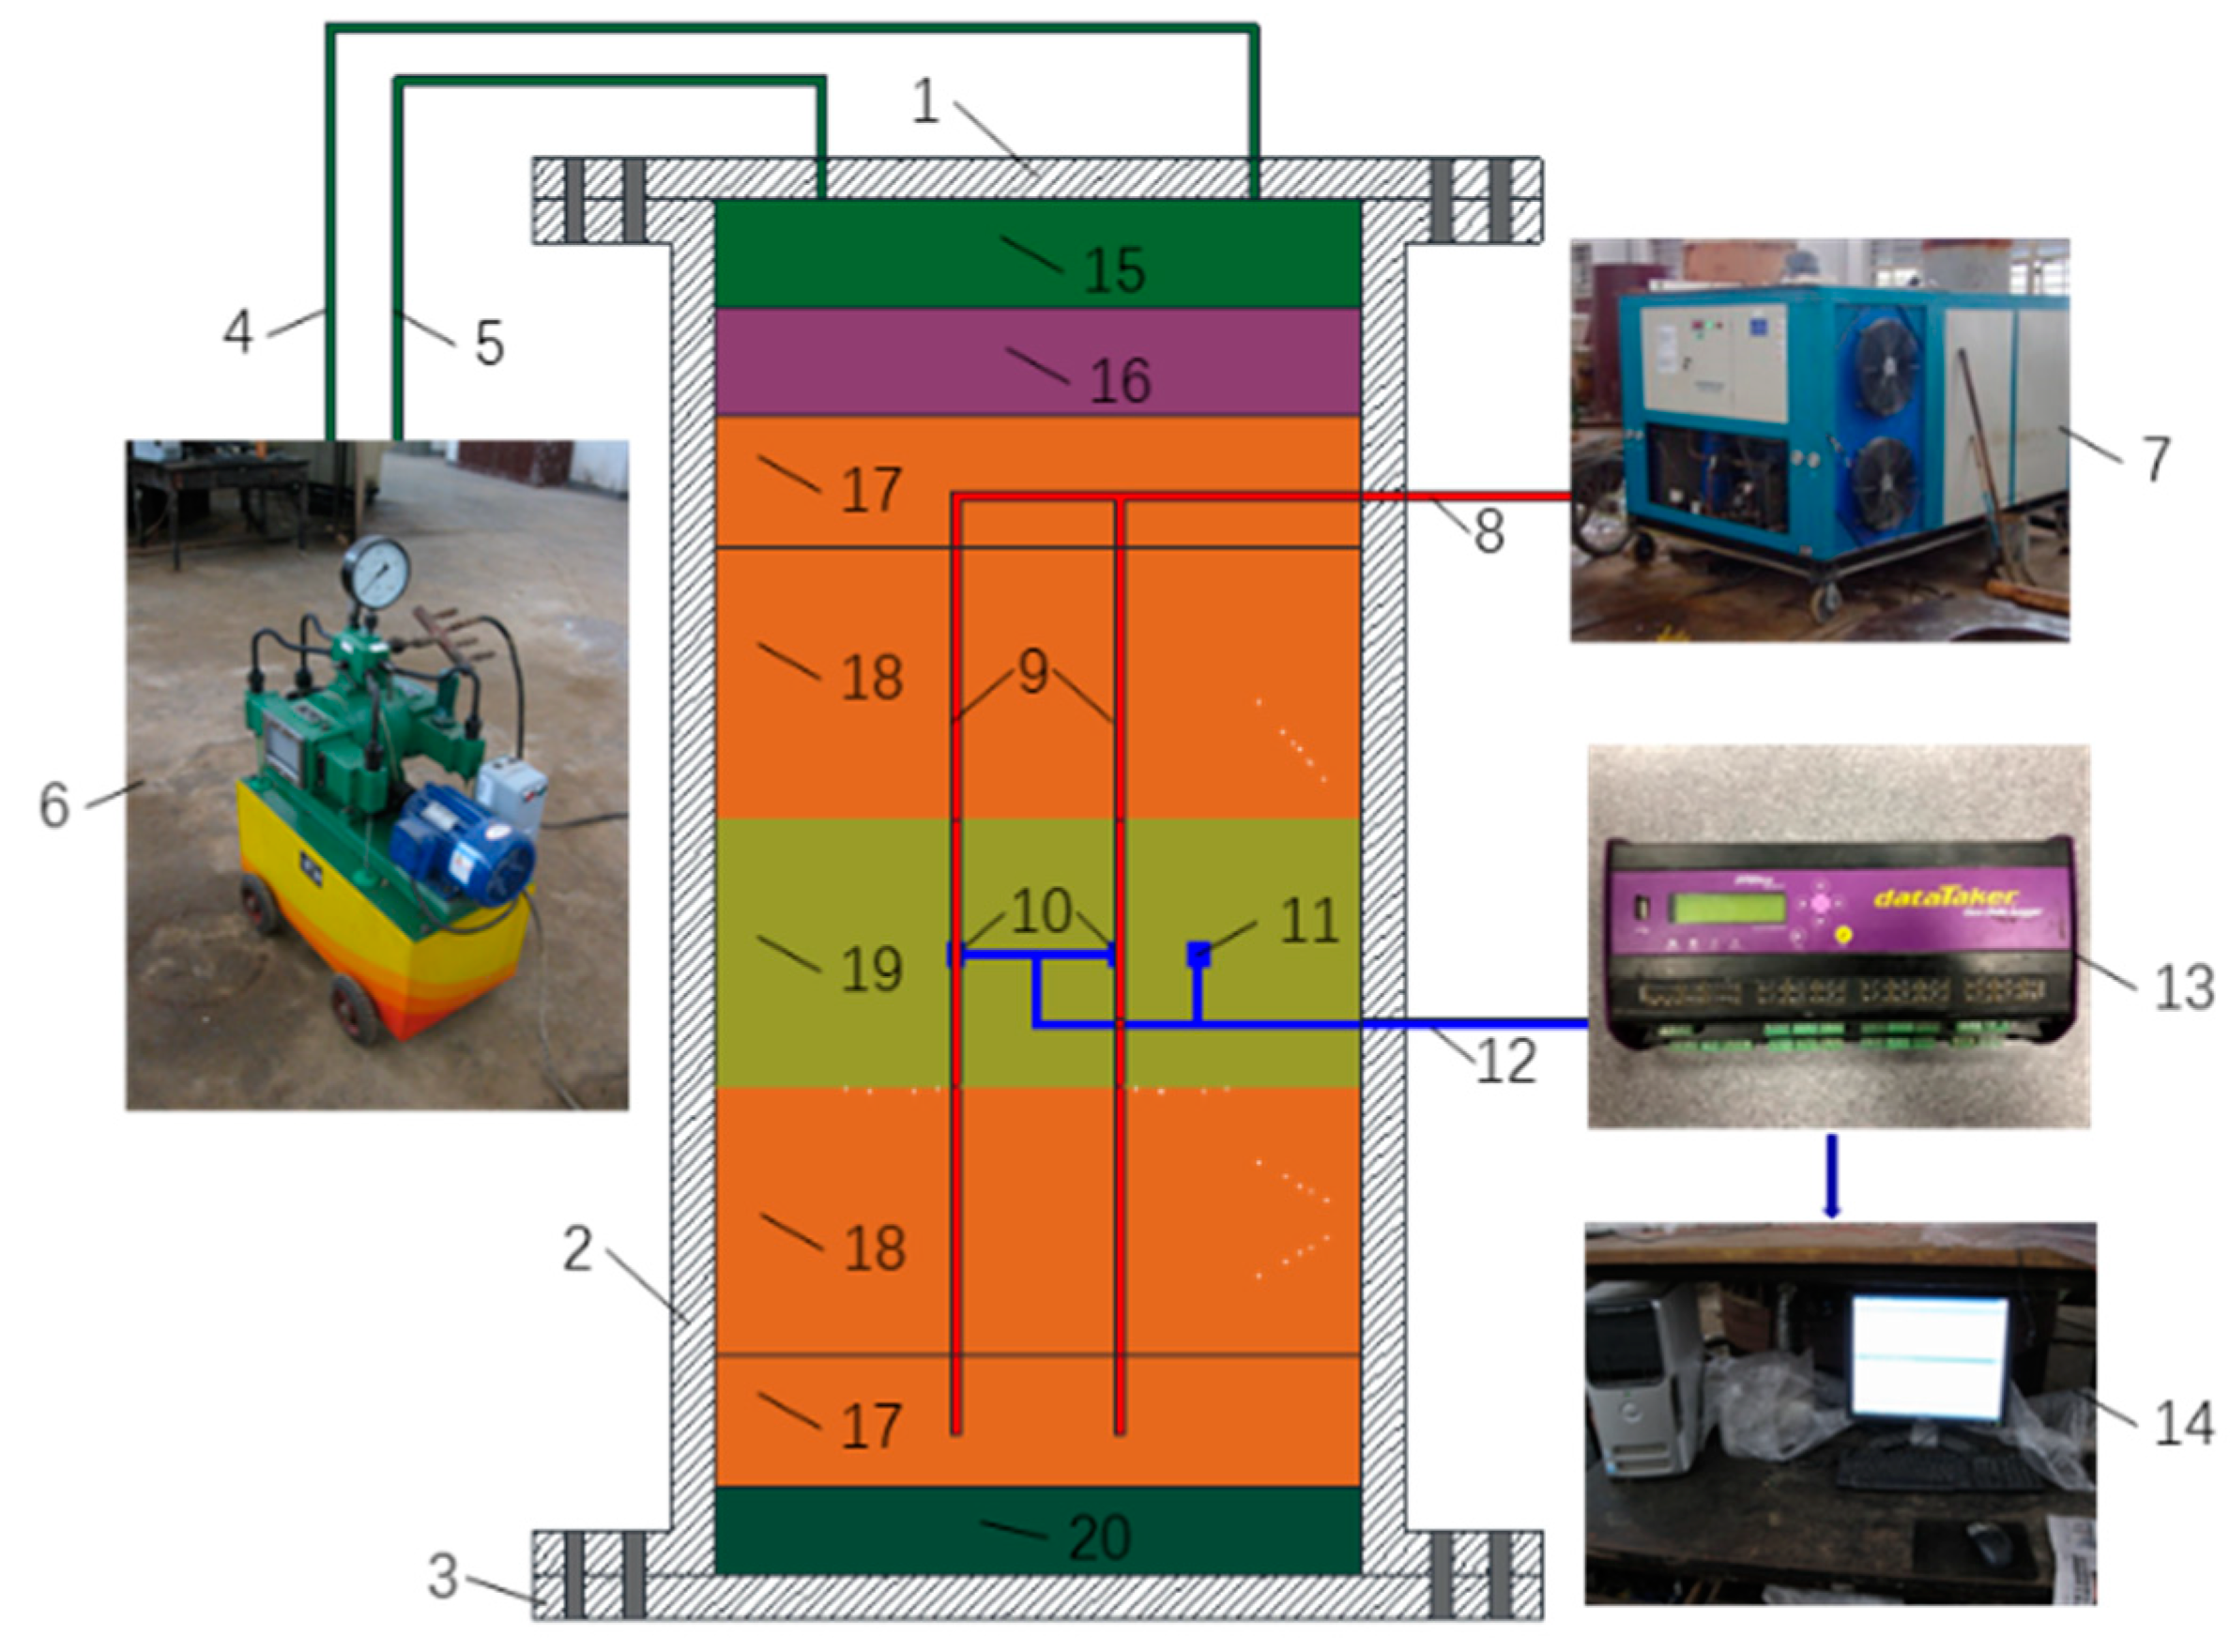
2.2. Test Device
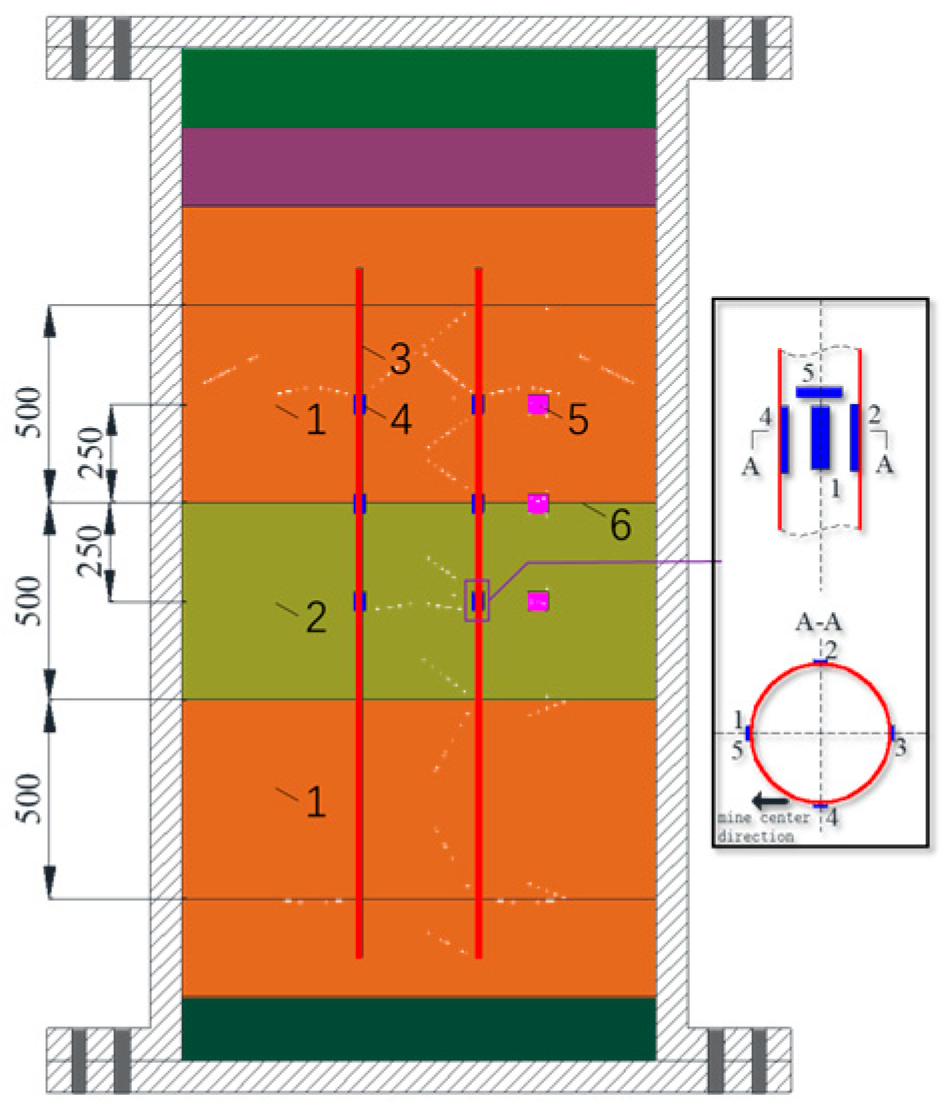
2.3. Test Scheme
2.4. Test Process
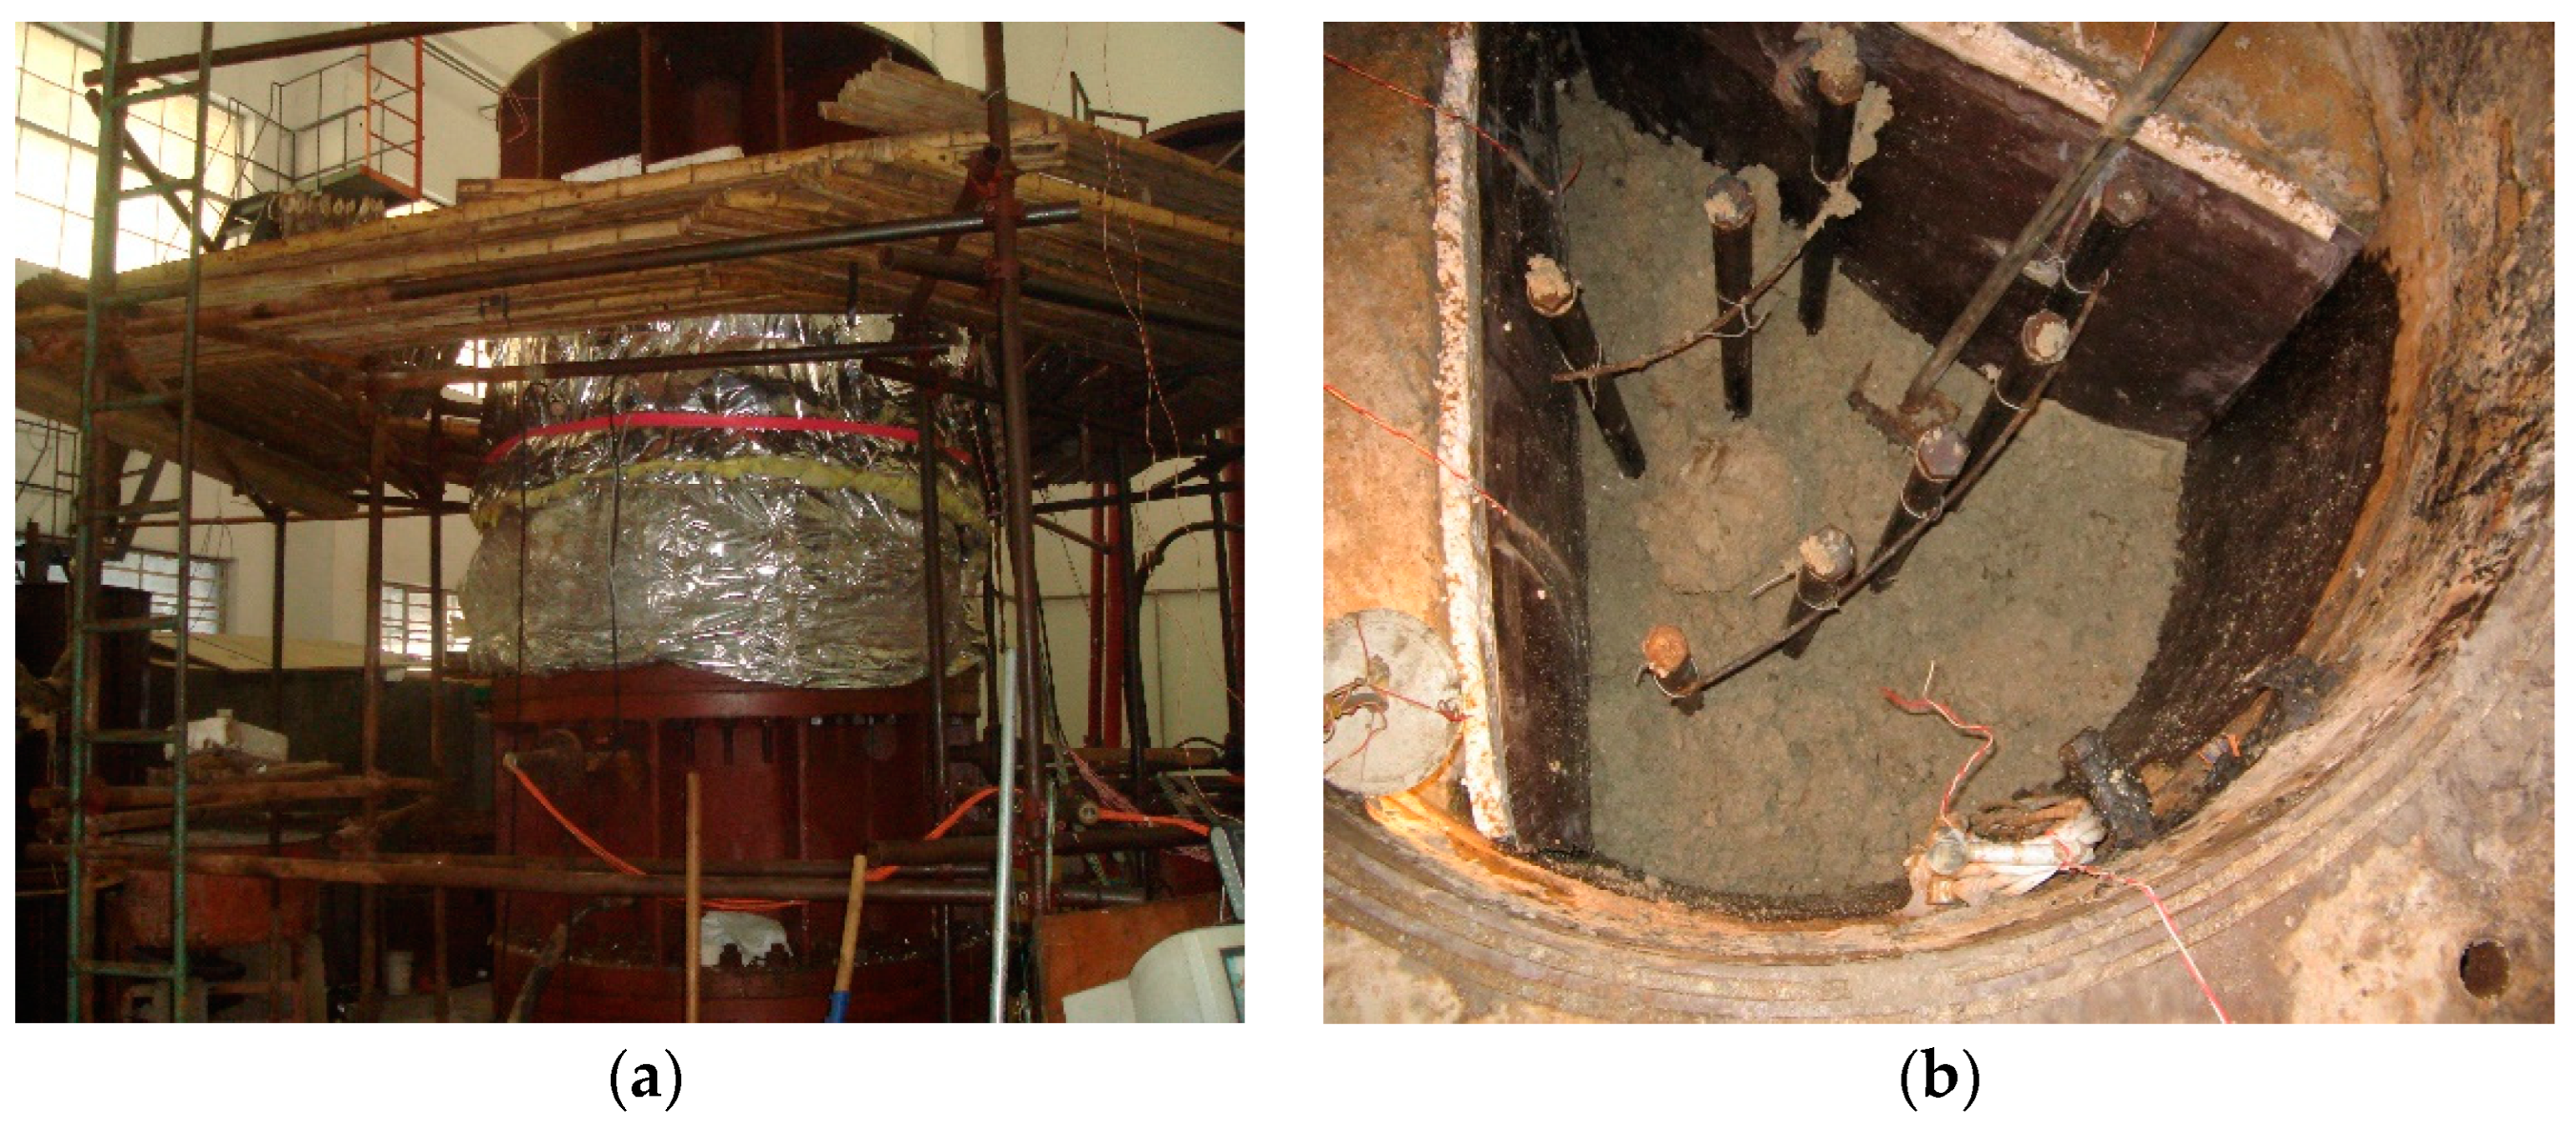
- (1)
- The 60° wedge was selected as the test area in the inner space of the test bench, and the non-test area was poured with concrete and equipped with insulation asbestos board to form an adiabatic rigid boundary, as shown in Figure 2b.
- (2)
- The soil sample was configured according to the designed moisture content and sealed for 24 h to make the moisture in the soil evenly distributed.
- (3)
- The pre-buried steel pipes were installed; the soils were filled in layers until the tamp to the design thickness; and the earth pressure box (showing the size of the consolidation pressure) and T-type thermocouple were installed.
- (4)
- The asphalt layer was cast; the top plate was installed and sealed; and the soil layer was graded pressurized consolidation.
- (5)
- After consolidation, the embedded steel pipes were replaced by the freezing pipe attached with strain gauge, and the asphalt layer was poured again, and the soil layer was applied the specific pressure.
- (6)
- Freezing was performed under the pressure holding state, and the freezing was stopped when the test target was reached.
3. Test Result and Discussion
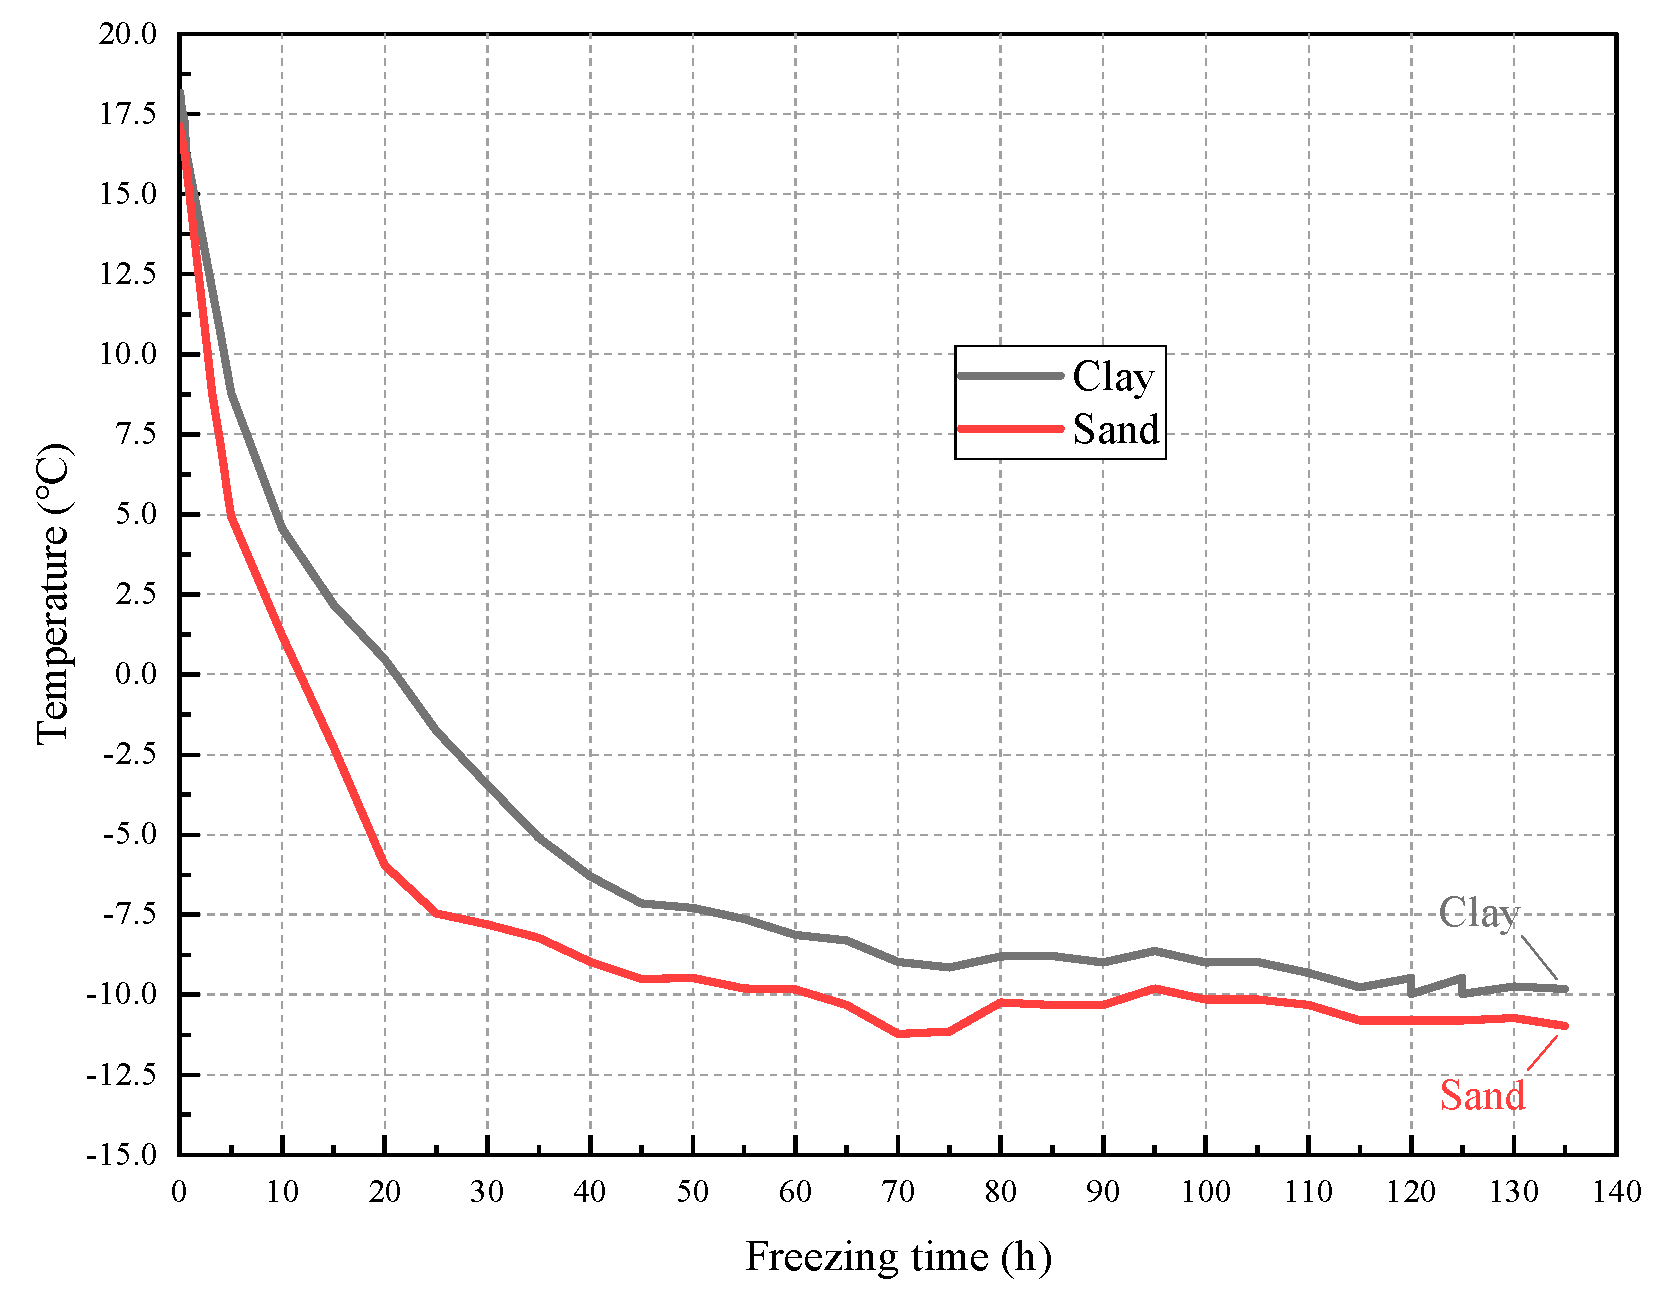
3.1. Variation Law of Freezing Temperature Field
3.2. Variation Law of Freezing Pipe Strain
3.2.1. Strain Gauge Data Processing Method
3.2.2. Analysis of Variation Law of Freezing Pipe Strain
- (1)
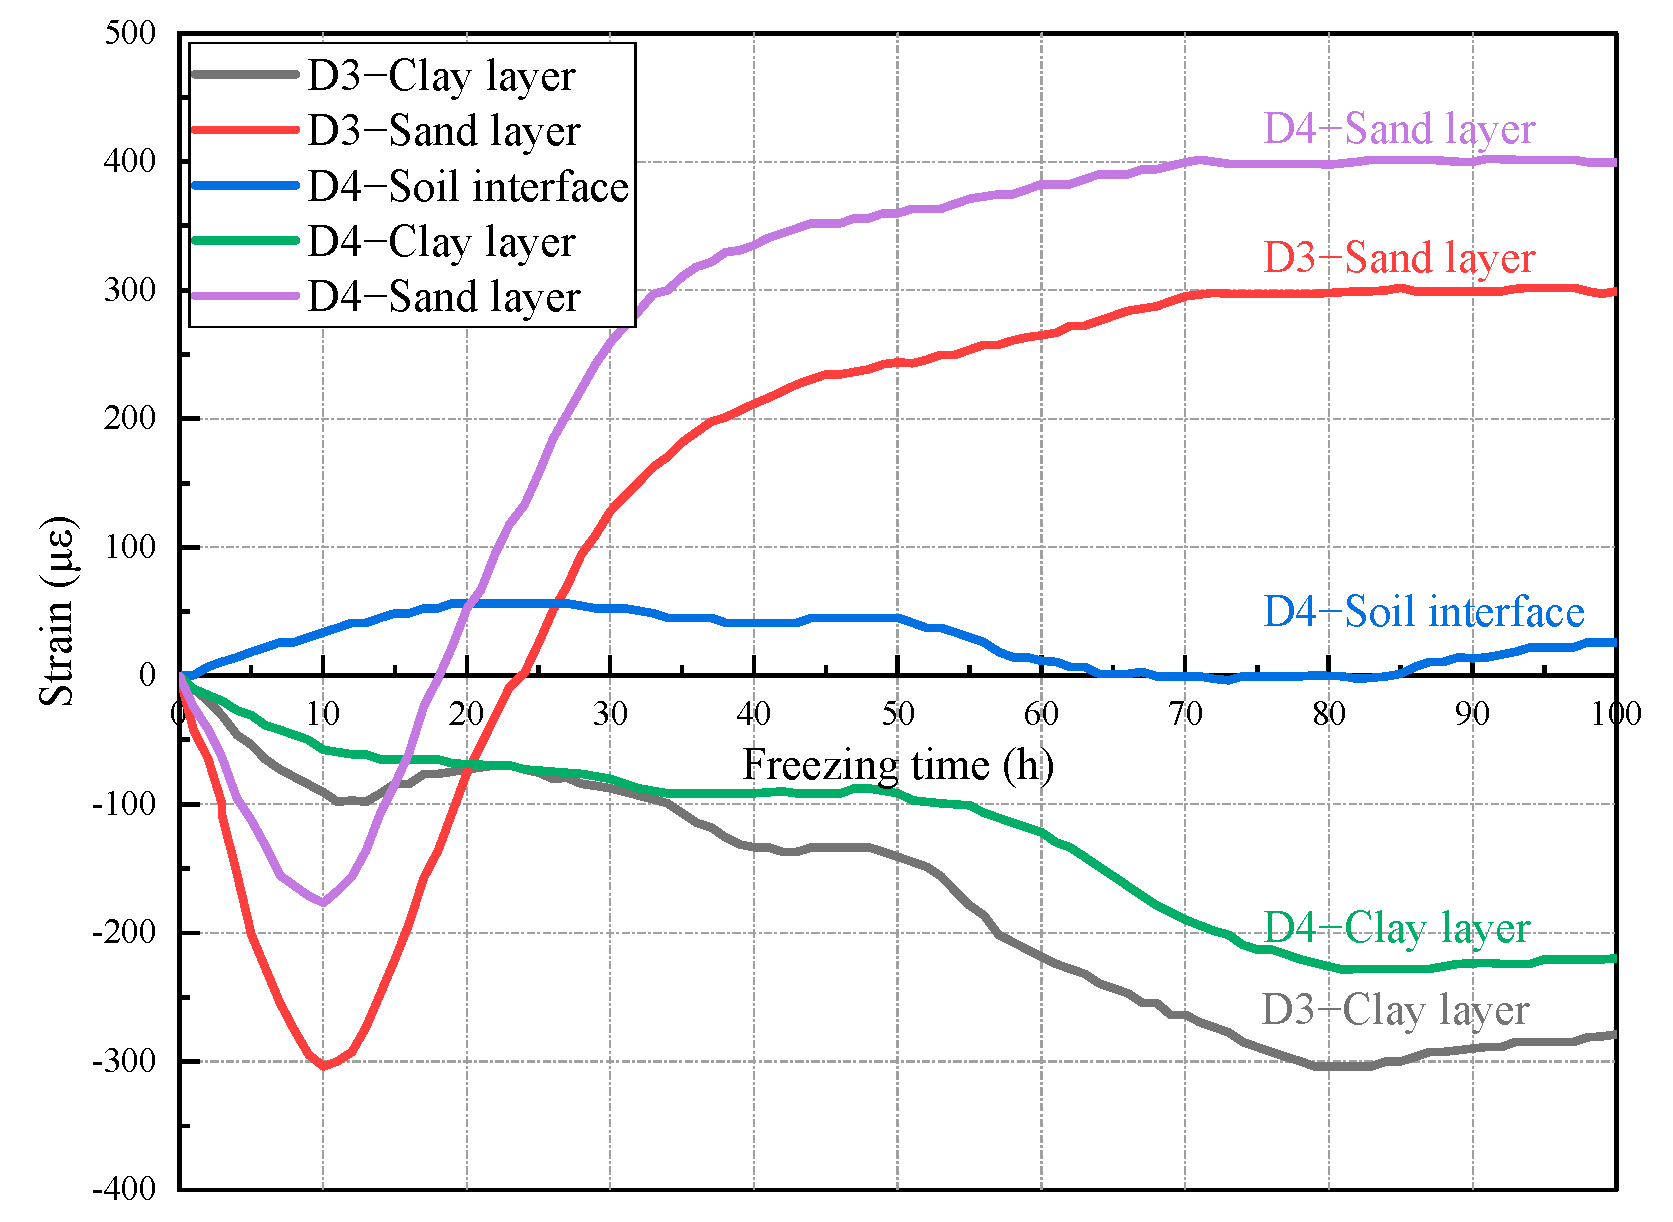
- Pure vertical tension–compression strain
- (2)
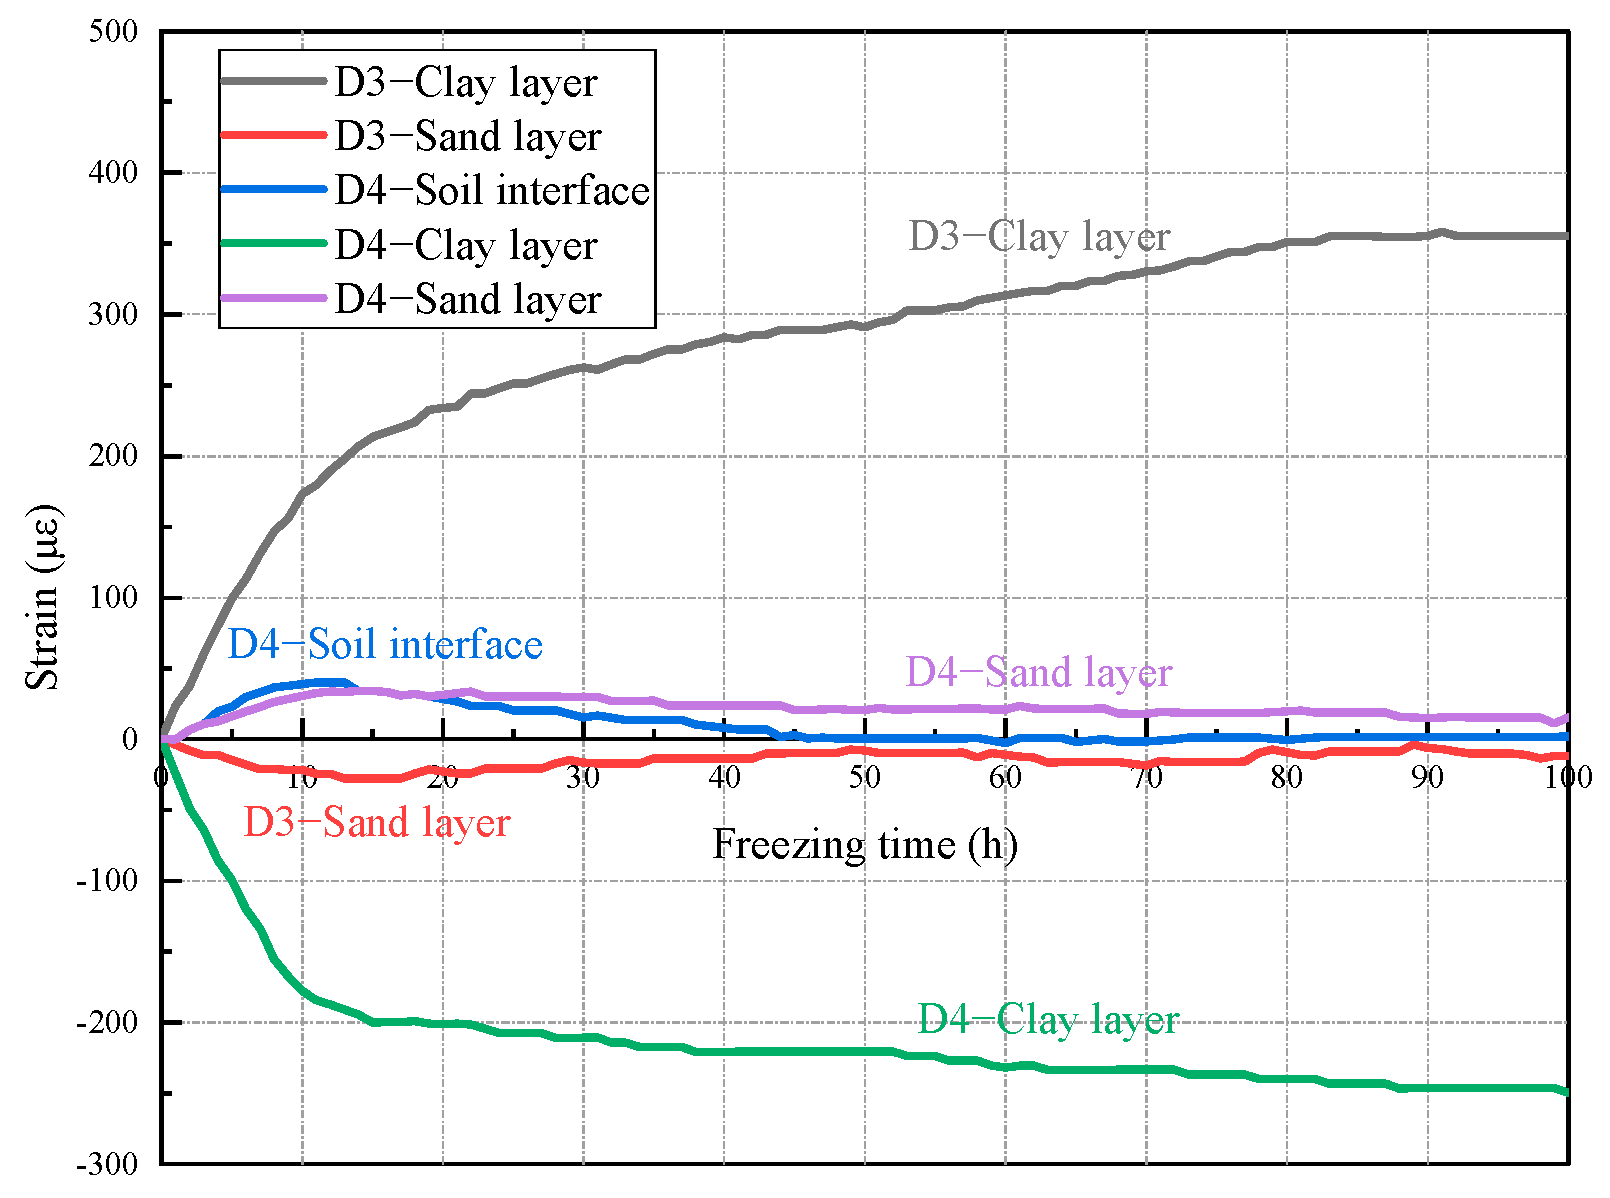
- Pure bending strain
4. Conclusions
- (1)
- The distribution of the freezing temperature field in different soil layers is similar, but the change rate of the freezing temperature field, the cycle time of freezing wall, and the average temperature are related to soil properties.
- (2)
- In the later stage of freezing, the freezing pipes in different soil layers are vertically subjected to pure tensile stress or pure compressive stress. However, in the initial stage of freezing, not only is the freezing pipe in the sandy soil layer subjected to the temporary vertical compression, but the freezing pipe in the clay layer is also always in the vertical compression state, which is different from the previous research results on the stress and deformation law of the freezing pipe in the freezing process of the single soil layer.
- (3)
- During the freezing process, the bending direction of different freezing pipes in different soil layers is not the same. The maximum bending strain of the frozen pipe in the clay layer can reach 779 με, which is 2.6 times the vertical strain at the same position, equivalent to 163.4 MPa, while the bending stress in the sand layer is relatively small. The accumulation of strain energy induced by bending can easily lead to the fracture of the frozen pipe in the process of digging.
- (4)
- The total strain of the freezing pipe is obtained by superimposing the pure vertical strain and the pure bending strain of the freezing pipe. It is concluded that the absolute value of the total strain of the freezing pipe in the clay layer is greater than that in the sand layer. By converting the strain into stress, it can be seen that the maximum tensile stress of the freezing pipe in the clay layer is 175.5 MPa, which can reach 0.75 times the yield limit of the freezing pipe, and will pose a certain degree of threat to the safety of the freezing pipe. At this time, the effective measures can be taken to improve the mechanical performance of the frozen pipe to increase the deformation capacity of the joint of the frozen pipe and reduce the strain energy stored by the frozen pipe, which will reduce the failure rate of the frozen pipe in the digging stage.
- (5)
- The model test results show that the freezing pipe in the composite stratum is in the spiral torsion shape. However, because the real stratum conditions are much more complex and changeable than the model tests, the real existing forms of freezing pipes in the actual stratum will be more diversified.
- (6)
- As the test load is only 8 MPa, the test results obtained are single and not three-dimensional enough. In the future, the model tests with different consolidation pressures and different freezing temperatures will be carried out, corresponding numerical simulation verification will be carried out for each group of model tests, and more innovative conclusions will be drawn. According to the innovative conclusions obtained, combined with the specific freezing project objects, the freezing problems and characteristics that the freezing project may face are proposed.
Author Contributions
Funding
Institutional Review Board Statement
Informed Consent Statement
Data Availability Statement
Conflicts of Interest
References
- Rong, C.; Wang, B.; Cheng, H.; Dong, Y.; Yang, F. Indoor model test on the formation mechanism of artificial frozen wall in high velocity per-meability strata. J. Rock Mech. Eng. 2022, 41, 596–613. [Google Scholar]
- Kang, Y.; Hou, C.; Li, K.; Liu, B.; Sang, H. Evolution of temperature field and frozen wall in sandy cobble stratum using LN2 freezing method. Appl. Therm. Eng. 2021, 185, 116334. [Google Scholar] [CrossRef]
- Wang, T.; He, Y.; Wu, Z.; Li, Y. Influence of groundwater seepage on artificial freezing process of gravel stratum. China Railw. Sci. 2022, 43, 1–8. [Google Scholar]
- Wang, Y.S.; Yang, R. Monitoring and analysis of the stress and deformation of shaft lining and the influence of freezing tube fracture in deep topsoil. Cold Reg. Sci. Technol. 2022, 193, 103420. [Google Scholar] [CrossRef]
- Wang, T.; Zhou, G.; Xu, D.; Wang, D.; Wang, J. Field experiment and stochastic model of uncertain thermal processes of artificial frozen wall around multi-circle freezing pipe. Int. J. Therm. Sci. 2021, 160, 106658. [Google Scholar] [CrossRef]
- Yang, Q.; Rong, C. The distribution of freezing temperature field and the formation of frost heaving force in deep expansive clay layer. Glacier Permafr. 2020, 42, 878–888. [Google Scholar]
- Yang, W.; Huang, J. Stress Analysis and Experimental Study of Freezing Pipe. Glacier Permafr. 1999, 21, 33–38. [Google Scholar]
- Huai, Y. Study on Fracture Mechanism of Deep Freezing Shaft Crossing Thick Clay Layer Freezing Pipe. Master’s Thesis, Anhui Jianzhu University, Hefei, China, 2013. [Google Scholar]
- Yu, C.; Yang, P.; Wang, R. Simulation test study on triaxial rheological deformation of frozen wall. J. Coal Ind. 1991, 16, 53–62. [Google Scholar]
- Li, J.; Wang, Y.; Li, D.; Zhang, C. Simulation test research on stress and deformation of freezing pipe during freezing of multi loop pipe before excavation. J. Geotech. Eng. 2011, 33, 1072–1077. [Google Scholar]
- Zhou, X. Stress calculation of freezing pipe in the deformation section of frozen wall. J. Coal Ind. 1996, 21, 30–34. [Google Scholar]
- Jing, L.; Cheng, S.; Guo, Y. Determination of fracture position of freezing pipe. J. Xi’an Univ. Sci. Technol. 2000, 20, 113–116. [Google Scholar]
- Li, G. Deformation and stress analysis of freezing wall and freezing pipe based on elastic foundation beam theory. J. Coal Ind. 2001, 26, 258–264. [Google Scholar]
- Huang, S.; Sheng, F.; Cheng, H. Simulation and analysis of stress mechanism of freezing pipe in deep clay layer. J. Anhui Jianzhu Univ. 2014, 22, 33–36. [Google Scholar]
- Du, M.; Rong, C.; Zheng, T. The reason of freezing pipe breaking and numerical calculation analysis of freezing temperature field. J. Anhui Inst. Archit. Technol. (Nat. Sci. Ed.) 2014, 22, 5–9. [Google Scholar]
- Cui, G.; Yang, W. Simulation test research on force of freezing pipe. J. China Univ. Min. Technol. 1990, 19, 60–68. [Google Scholar]


| Author | Published Time | Soil Texture | Research Stage | Research Method | Main Results |
|---|---|---|---|---|---|
| Yang Weihao [7] | 1999 | Sand–clay interbedding | Active freezing section/ Excavation construction section | Theoretical analysis/ model test | In the active freezing stage, the maximum bending stress of the freezing pipe at the soil interface can reach 80 MPa. In the excavation stage, the stress of the freezing pipe is proportional to the displacement of the freezing wall. |
| Yu Chuhou [9] | 1991 | Sand/clay/ Sand-clay interbedding | Excavation construction section | Model test | The floor heave of the working face and the advance displacement of the frozen wall are the main reasons for the possible pipe break below the excavation face. The freezing pipe at the junction of the soil layer will bear additional bending moment and shear force, and it is easy to break the pipe. |
| Li Jinhua [10] | 2011 | Sand–clay interbedding | Active freezing section | Model test | Due to the accumulation of strain energy induced by bending, it is easy to cause the freezing pipe to break during the excavation stage. |
| Zhou Xiaomin [11] | 1996 | Single soil layer | Excavation construction section | Theoretical analysis | Near the excavation section, the main force of the freezing pipe is the bending moment, accompanied by the composite action of tension and shear force, and there are multiple stress peaks. The deformation value of unit height of shaft wall and the deformation stiffness of freezing pipe are the main factors affecting the force of freezing pipe. |
| Jing Laiwang [12] | 2000 | Single soil layer | Excavation construction section | Theoretical analysis | It is pointed out that the theoretical position where the freezing pipe is most likely to break is 0.7 times the depth of the pipe. |
| Li Gongzhou [13] | 2001 | Single soil layer | Excavation construction section | Theoretical analysis | The mechanical model of the elastic foundation beam for analyzing the frozen wall near the construction section is proposed, and the calculation expression of the deformation displacement of the frozen wall based on the elastic foundation beam is derived. |
| Huang Shaoshi [14] | 2014 | Sand–clay interbedding | Excavation construction section | Numerical simulation | The distribution law of stress and displacement of freezing pipe is obtained, and the fracture position of freezing pipe is located at the junction of sandy clay and sandy soil. |
| Du Meng [15] | 2014 | Sand–clay interbedding | Excavation construction section | Numerical simulation | In the process of excavation and lining construction, the height of excavation and lining section is too high, and the exposure time of shaft wall is too long, which causes large displacement of shaft wall and floor heave of working face, which is the main reason for the fracture of freezing pipe. |
| Outer Diameter of Freezing Pipe /mm | Outer Tube | Inner Tube | Brine Temperature /°C | Axial Compression /MPa | |||
|---|---|---|---|---|---|---|---|
| Diameter /m | Hole Spacing /m | Diameter /m | Hole Spacing /m | ||||
| prototype | Φ159 | 17.69 | 1.59 | 8.95 | 1.59 | −20 | 8 |
| Model | Φ8 | 0.89 | 0.08 | 0.45 | 0.08 | −20 | 8 |
Disclaimer/Publisher’s Note: The statements, opinions and data contained in all publications are solely those of the individual author(s) and contributor(s) and not of MDPI and/or the editor(s). MDPI and/or the editor(s) disclaim responsibility for any injury to people or property resulting from any ideas, methods, instructions or products referred to in the content. |
© 2023 by the authors. Licensee MDPI, Basel, Switzerland. This article is an open access article distributed under the terms and conditions of the Creative Commons Attribution (CC BY) license (https://creativecommons.org/licenses/by/4.0/).
Share and Cite
Qiu, L.; Li, J.; Wang, Y. Similarity Model Test on Stress and Deformation of Freezing Pipe in Composite Strata during Active Freezing. Appl. Sci. 2023, 13, 5283. https://doi.org/10.3390/app13095283
Qiu L, Li J, Wang Y. Similarity Model Test on Stress and Deformation of Freezing Pipe in Composite Strata during Active Freezing. Applied Sciences. 2023; 13(9):5283. https://doi.org/10.3390/app13095283
Chicago/Turabian StyleQiu, Linjie, Jinhua Li, and Yansen Wang. 2023. "Similarity Model Test on Stress and Deformation of Freezing Pipe in Composite Strata during Active Freezing" Applied Sciences 13, no. 9: 5283. https://doi.org/10.3390/app13095283
APA StyleQiu, L., Li, J., & Wang, Y. (2023). Similarity Model Test on Stress and Deformation of Freezing Pipe in Composite Strata during Active Freezing. Applied Sciences, 13(9), 5283. https://doi.org/10.3390/app13095283