Article

Performance of AI-Based Automated Classifications of Whole-Body FDG PET in Clinical Practice: The CLARITI Project

1
Department of Biophysics and Nuclear Medicine-Molecular Imaging, Hôpitaux Universitaires Paris-Saclay, Assistance Publique-Hôpitaux de Paris, 94270 Le Kremlin-Bicêtre, France
2
INRIA EPIONE, Université Côte d’Azur, Inria Sophia Antipolis, Epione Research Project, 06902 Sophia Antipolis, France
3
Department of Clinical Research and Innovation, Assistance Publique-Hôpitaux de Paris, 75012 Paris, France
4
I&D PACTE, Assistance Publique-Hôpitaux de Paris, 75012 Paris, France
5
Clinical Research Unit AP-HP, Paris-Saclay, Hôpital Raymond Poincare, School of Medicine Simone Veil, University Versailles Saint Quentin—University Paris Saclay, INSERM (National Institute of Health and Medical Research), CESP (Centre de Recherche en épidémiologie et Santé des Populations), Anti-Infective Evasion and Pharmacoepidemiology Team, 78180 Montigny-Le-Bretonneux, France
6
Department of Medical Information, Hôpitaux Universitaires Paris-Saclay, Assistance Publique-Hôpitaux de Paris, 94270 Le Kremlin-Bicêtre, France
7
School of Medicine, Université Paris-Saclay, 94270 Le Kremlin-Bicêtre, France
8
IR4M-UMR8081, Université Paris-Saclay, 91401 Orsay, France
*
Author to whom correspondence should be addressed.
Appl. Sci. 2023, 13(9), 5281; https://doi.org/10.3390/app13095281
Submission received: 11 February 2023 / Revised: 19 April 2023 / Accepted: 20 April 2023 / Published: 23 April 2023
(This article belongs to the Special Issue AI Technologies in Biomedical Image Processing and Analysis)

Abstract

:
Purpose: To assess the feasibility of a three-dimensional deep convolutional neural network (3D-CNN) for the general triage of whole-body FDG PET in daily clinical practice. Methods: An institutional clinical data warehouse working environment was devoted to this PET imaging purpose. Dedicated request procedures and data processing workflows were specifically developed within this infrastructure and applied retrospectively to a monocentric dataset as a proof of concept. A custom-made 3D-CNN was first trained and tested on an “unambiguous” well-balanced data sample, which included strictly normal and highly pathological scans. For the training phase, 90% of the data sample was used (learning set: 80%; validation set: 20%, 5-fold cross validation) and the remaining 10% constituted the test set. Finally, the model was applied to a “real-life” test set which included any scans taken. Text mining of the PET reports systematically combined with visual rechecking by an experienced reader served as the standard-of-truth for PET labeling. Results: From 8125 scans, 4963 PETs had processable cross-matched medical reports. For the “unambiguous” dataset (1084 PETs), the 3D-CNN’s overall results for sensitivity, specificity, positive and negative predictive values and likelihood ratios were 84%, 98%, 98%, 85%, 42.0 and 0.16, respectively (F1 score of 90%). When applied to the “real-life” dataset (4963 PETs), the sensitivity, NPV, LR+, LR− and F1 score substantially decreased (61%, 40%, 2.97, 0.49 and 73%, respectively), whereas the specificity and PPV remained high (79% and 90%). Conclusion: An AI-based triage of whole-body FDG PET is promising. Further studies are needed to overcome the challenges presented by the imperfection of real-life PET data.

1. Introduction

Positron emission tomography (PET) has become a key imaging modality for cancer care worldwide [1]. Over the past decade, improved access for the medical community has spurred the extension of its clinical applications. In particular, whole-body PET imaging with 18F-fluorodeoxyglucose (FDG PET) is now widely used for numerous oncological, inflammatory and infectious purposes in daily practice [2,3,4,5,6].
Given the growing imbalance between patients flow and the number of trained nuclear medicine physicians, a high-throughput automated triage of simple scans could reduce oversight and misdiagnosis in general practice by increasing the physician reading time devoted to more complex medical imaging cases. Recently, deep learning—a branch of machine learning using neural networks—has received increased interest for its potential ability to assist medical imaging practitioners in various segmentation, detection or classification tasks [7,8,9,10]. More specifically, these new image-processing methods use convolutional networks that have surpassed empirical methods by allowing the extraction of intrinsic features from images. Recently, several network architectures have emerged, such as ResNet, which have proven their superior performance of 2D classification tasks. PET-CT imaging consists of volumetric acquisition, which is why we decided to develop a 3D convolutional algorithm based on ResNet for our study.
However, the validation of these new approaches requires a large amount of imaging data, which is often limited by access to large structured medical databases in practice [11]. In this proof-of-concept study, an EDS environment was dedicated for the first time to PET imaging to assess the feasibility of a three-dimensional deep convolutional neural network (3D-CNN) for the general triage of whole-body FDG PET scans in daily clinical practice: the CLARITI project.

2. Materials and Methods
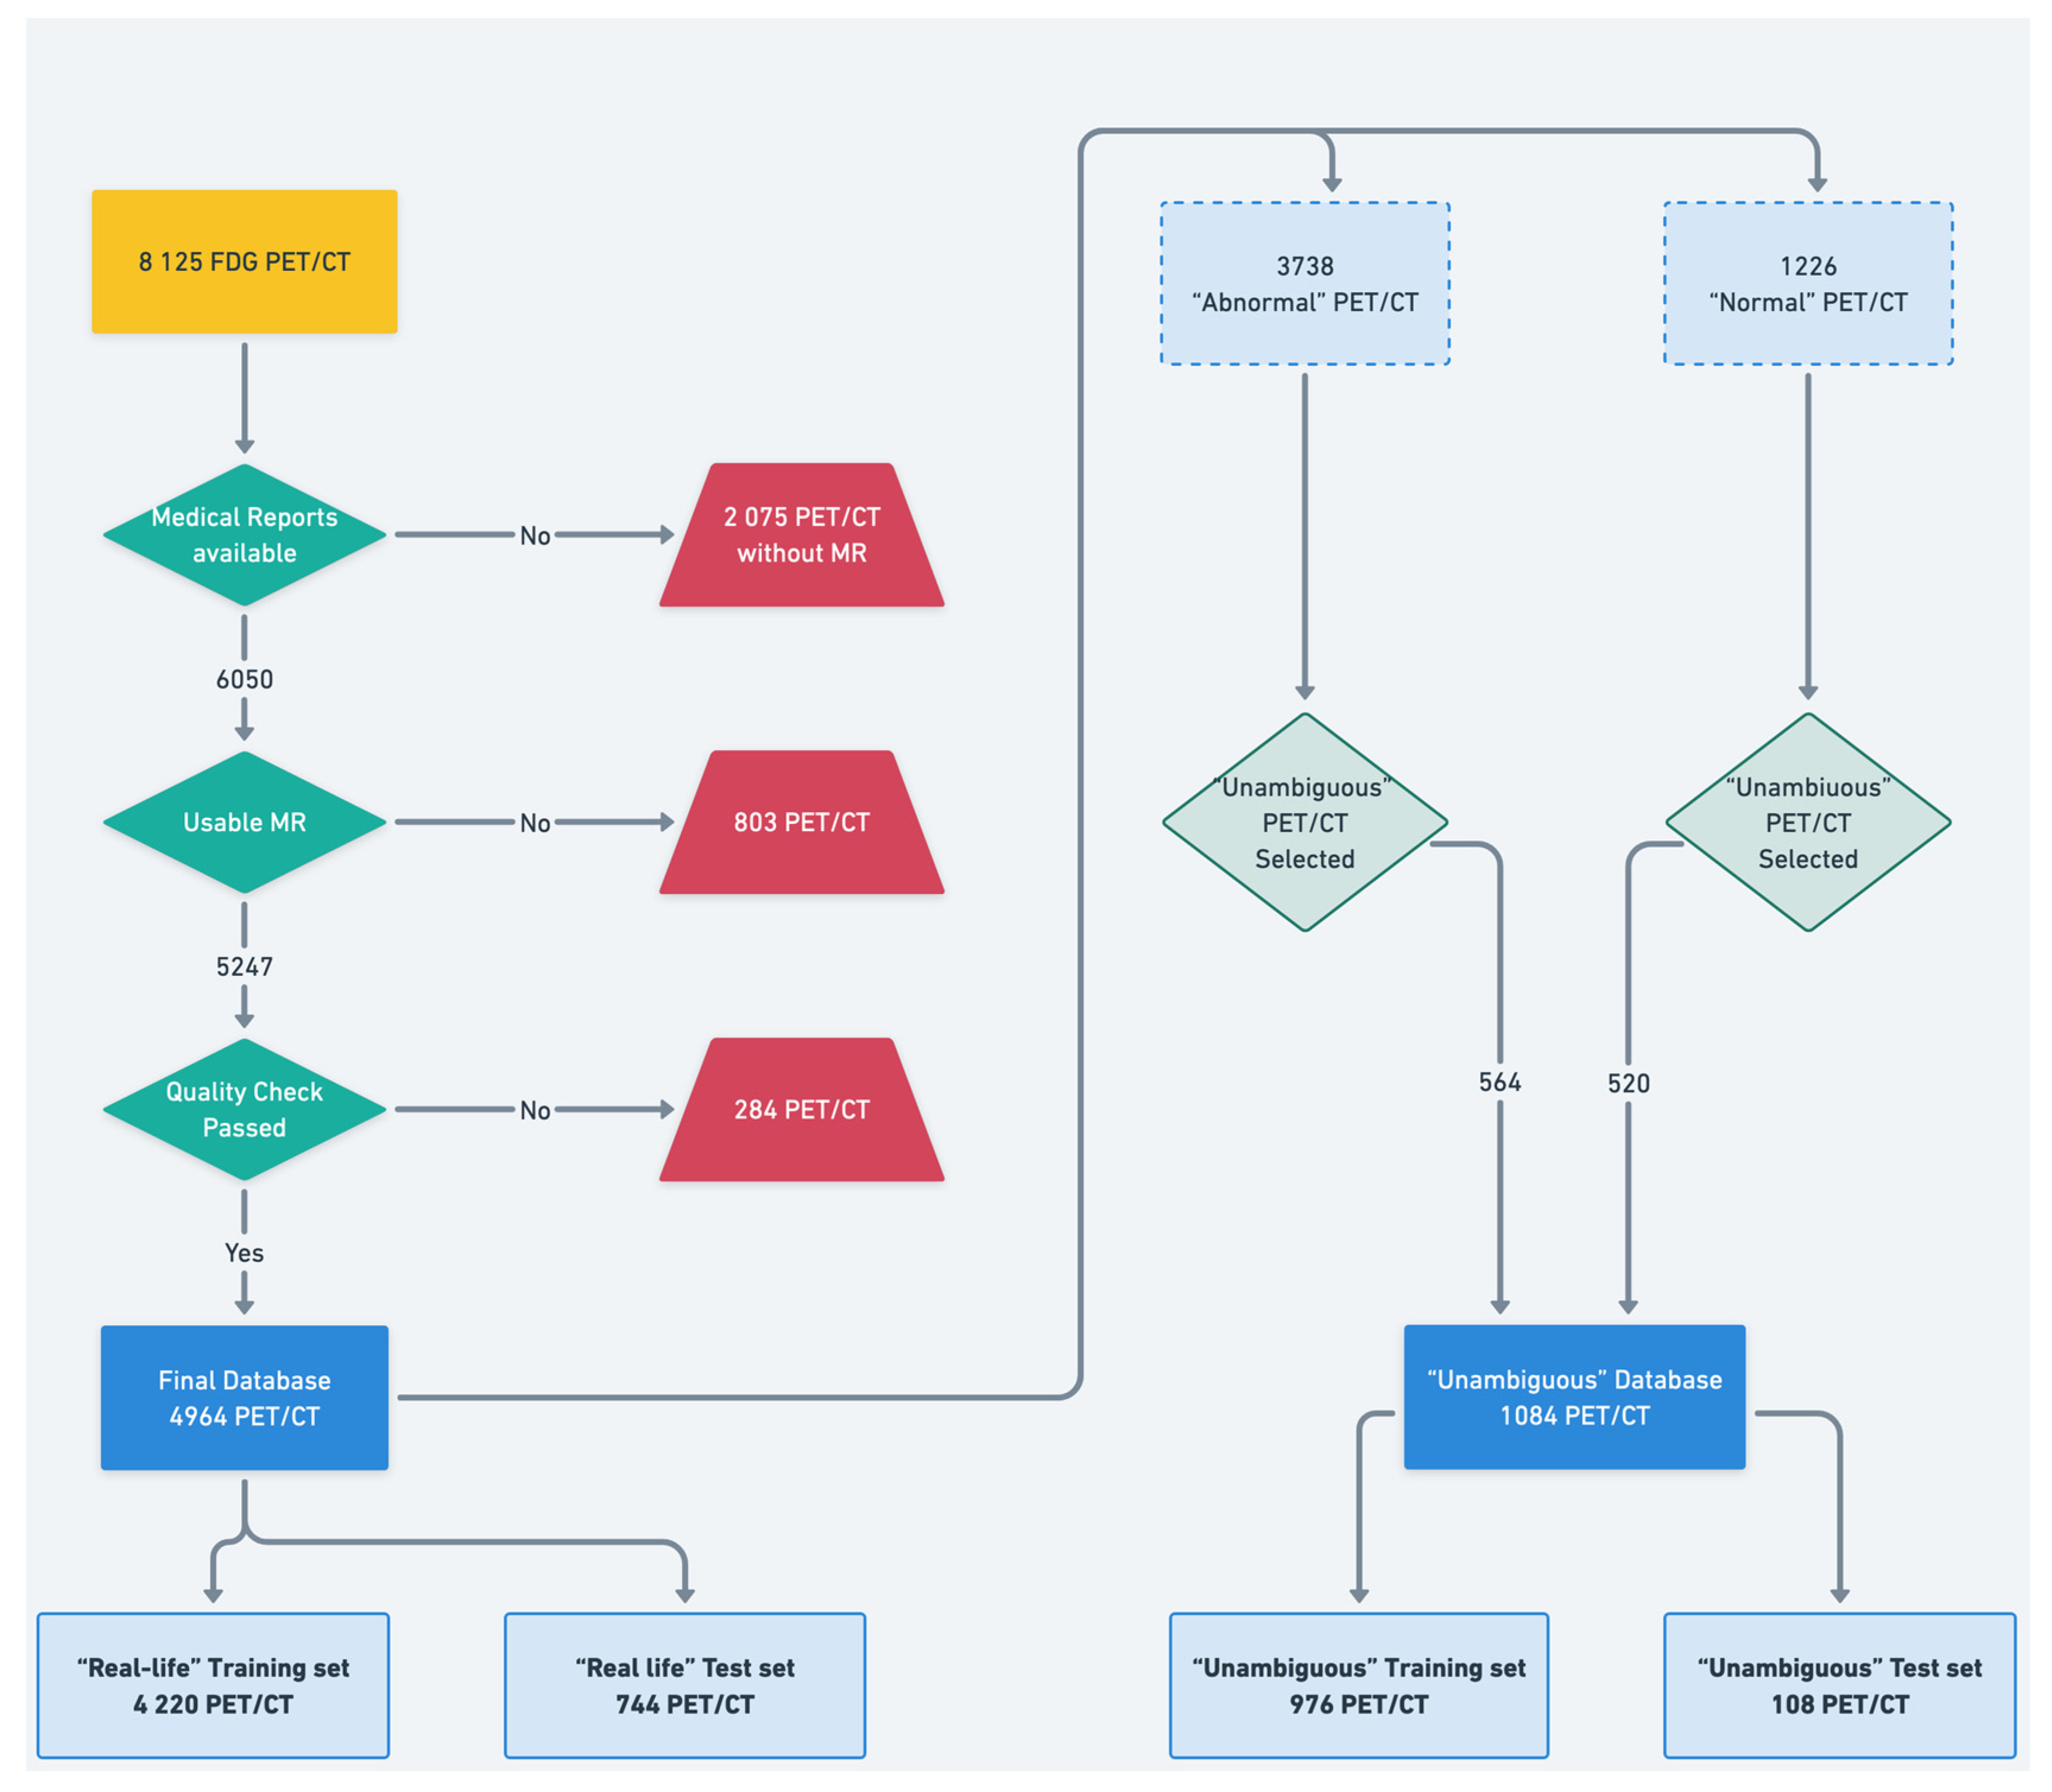
2.1. Dataset

In this retrospective monocentric study, all the whole-body FDG PET/CT scans performed on adult patients willing to have their data reused for research between 2015 and 2019 at the Hôpitaux Universitaires Paris Saclay/AP-HP (CHU Bicêtre) were preprocessed. The project was approved by the institutional review board (authorization number IRB 00011591) of the scientific and ethical committee (CSE EDS n°18–38, CLARITI). All scans were performed from vertex to mid-tight on the same PET/CT device (mCT flow, Siemens Healthineers, Erlangen, Germany) after an intravenous injection of 3.5 MBq per kg and fulfilled the international procedure guidelines for FDG PET imaging in standard clinical routine [3]. Image reconstruction was the same for all patients (3D OSEM with 2 iterations and 21 subsets with time-of-flight and point spread function modeling; matrix size: 400 × 400 voxels; voxel size = 2.036 × 2.036 × 2.027 mm; Gaussian postfiltering of 3 mm FWHM). Only the PET data corrected from the CT-based attenuation correction were used for this study’s purpose.

2.2. Data Preprocessing and Labeling

The Entrepôt de données de Santé (EDS) stores the medical data of millions of patients treated at the greater Paris University hospitals—Assistance Publique—Hôpitaux de Paris (AP-HP). The University hospitals are in full agreement with the European General Data Protection and Regulation (GPDR) and the French Data Protection Authority (CNIL) for health data processing (reference method MR-004). The EDS provided centralized virtual working environments with dedicated computing platforms.
The pseudonymized targeted 3D PET data (DICOM format) [12] were transferred, together with their corresponding matched report metadata, from the general storage space to a personalized dedicated working space by using advanced request procedures based on HiveQL (https://hive.apache.org/ accessed on 22 April 2023)—a query language which allows Hive to process and analyze structured massive data in the Metastore—and PySpark (http://spark.apache.org/ accessed on 22 April 2023), a Python application programming interface for massive structured data processing. In this dedicated working space, the 3D PET data were processed and downsampled by the removal of the body-surrounding background, the conversion of voxel values from float32 to float16 and matrix size reduction by a 3D kernel of 3 × 3 × 3 mean pooling and then normalized by z-scoring of the SUV values with standardization of the slice number (n = 549). All the 3D PET data were then labeled “normal” or “abnormal” through a two-step cross-validation procedure:
  • First, an “in-house” automated text mining procedure was developed to automatically classify the PET scans based on the anonymized written imaging reports.
All the reports were written following a predefined “normal” template. Reports that did not differ from this template were considered “normal” and the others were set aside for a deeper report verification.
  • Second, the maximum intensity projection of all the PET data was converted into nine 2D projections (from 0° to 180° rotation) to be carefully qualitatively reviewed by an experienced nuclear medicine physician (A.B., who had 5 years of expertise in PET imaging). For this purpose, any well-grounded nonphysiological uptake was considered abnormal.

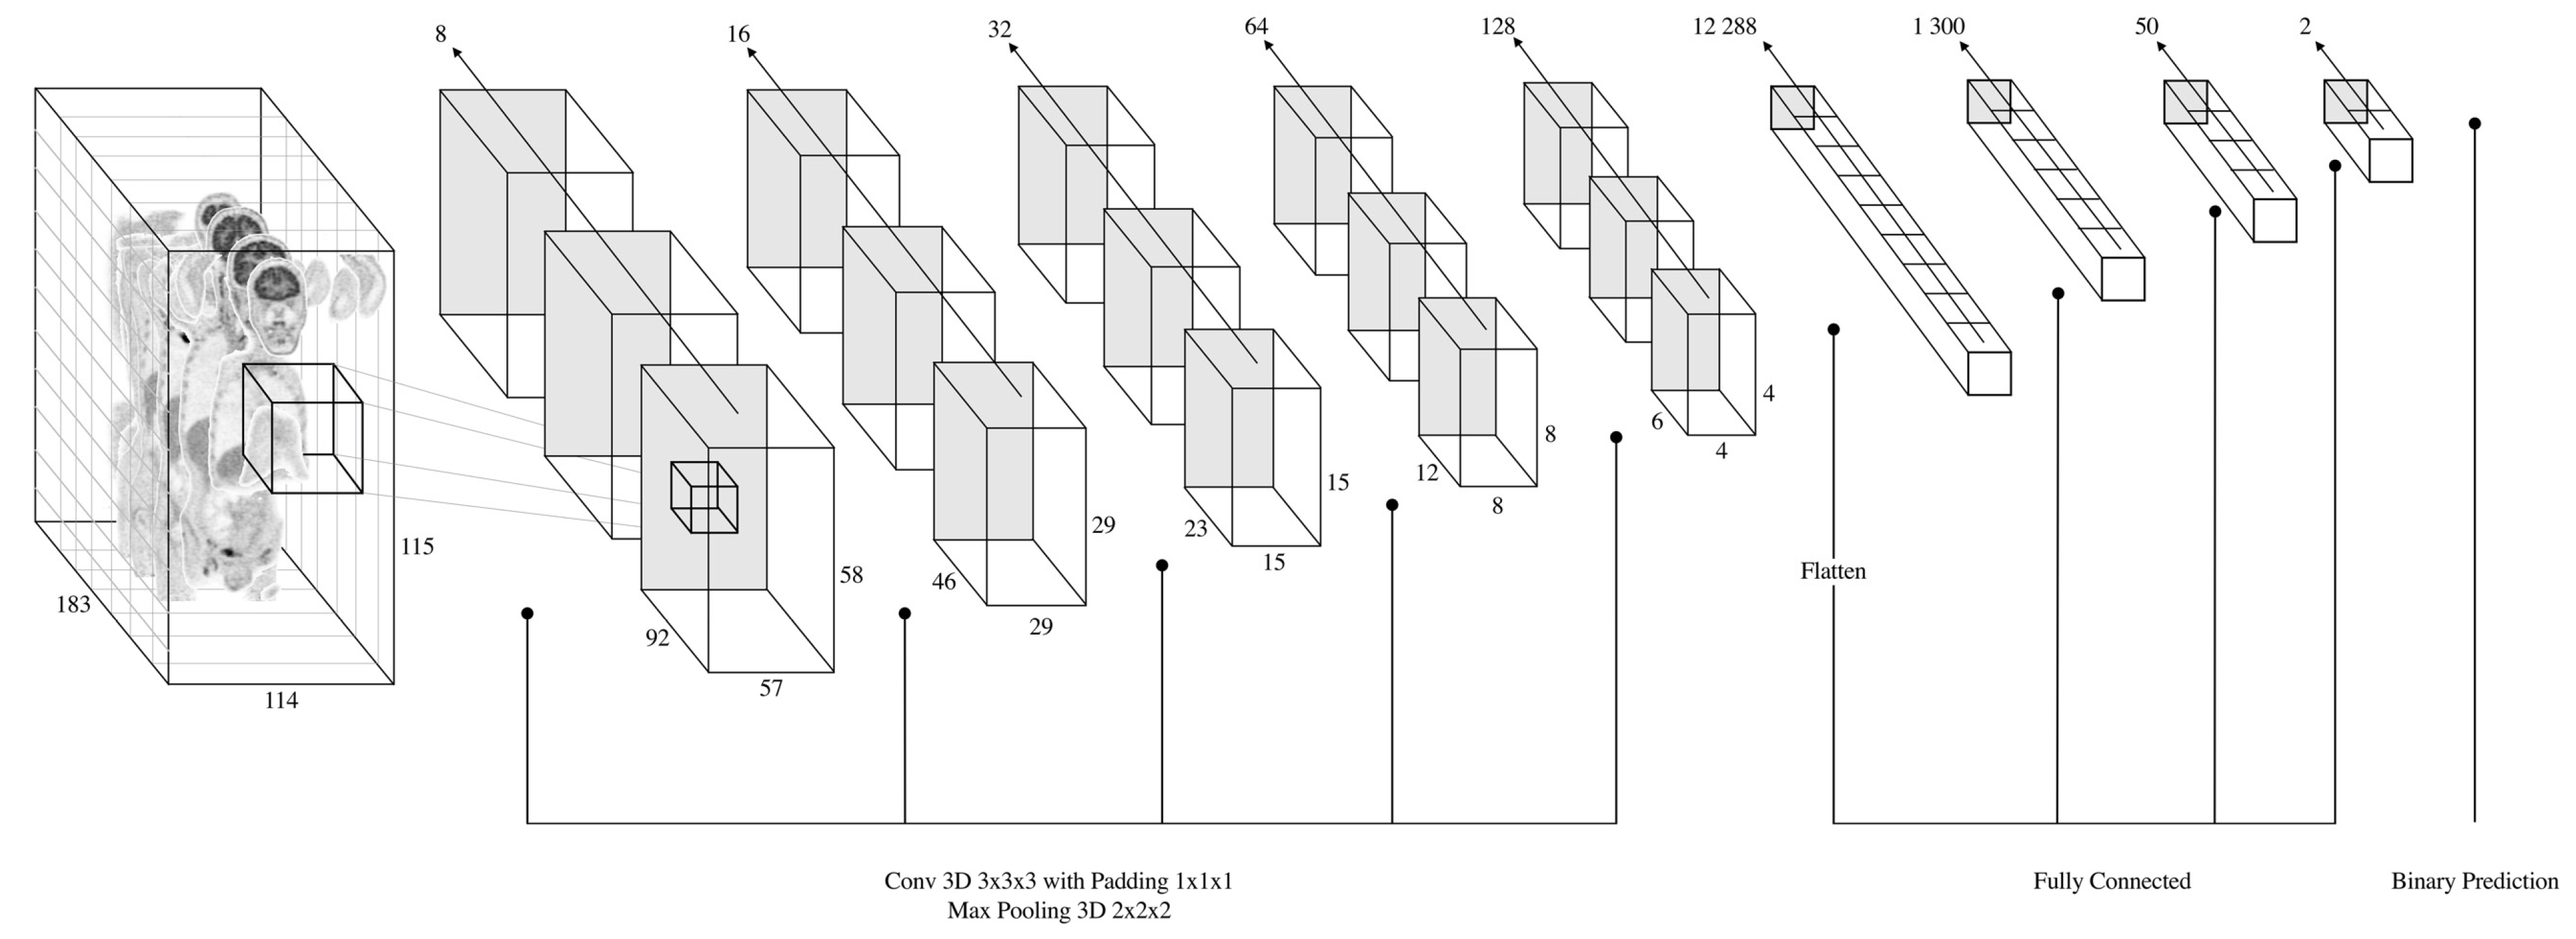
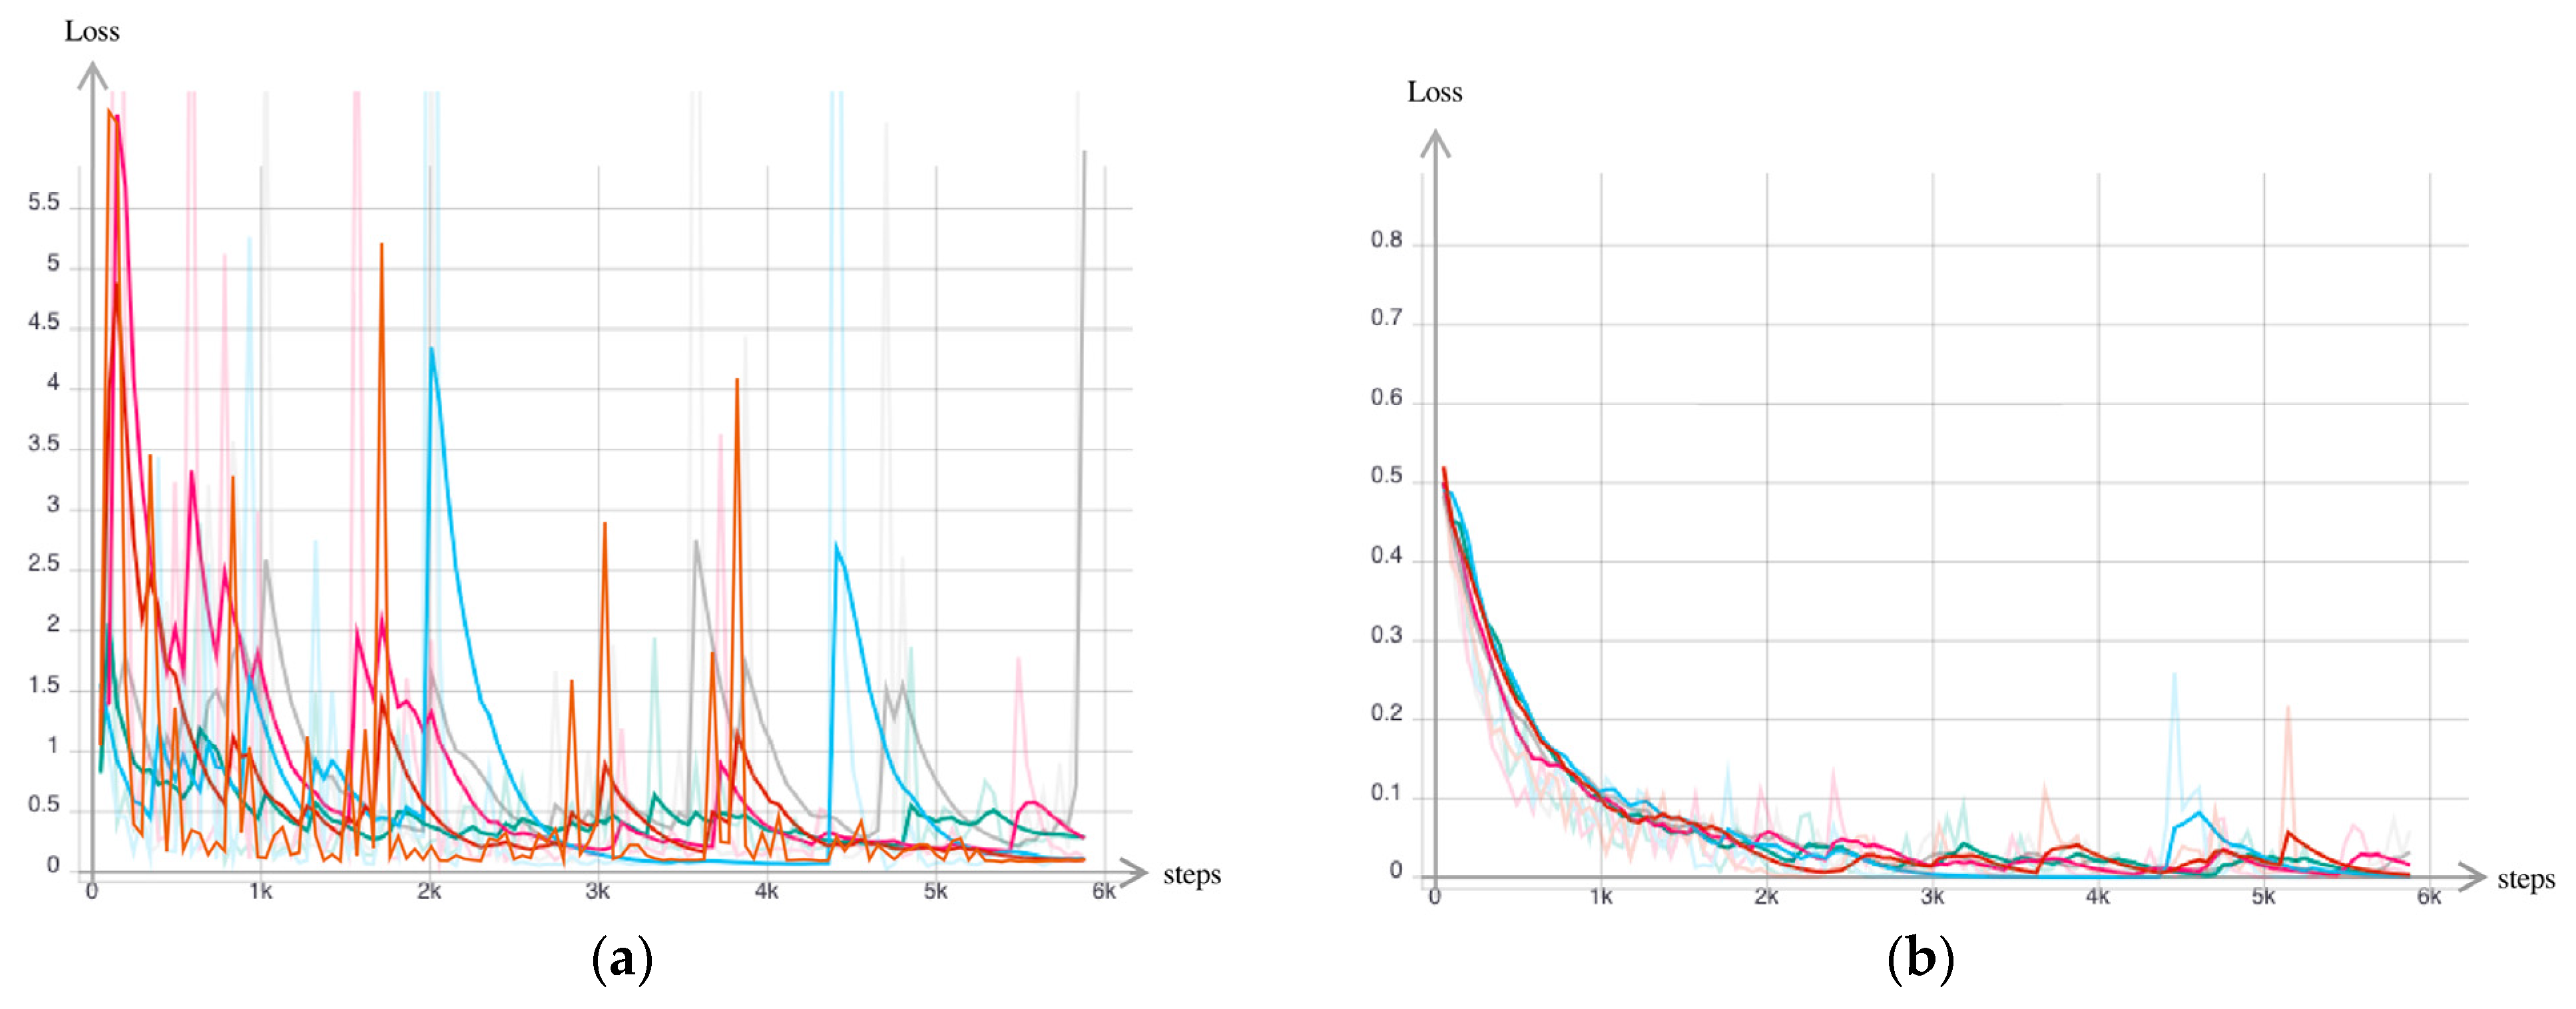
2.3. CNN Architecture, Training and Testing Procedures

The preprocessed 3D PET data were converted into tensors and fed as input, together with their corresponding binarized “label” predictions as output, to a 3D CNN. The CNN architecture is illustrated in Figure 1.
Briefly, we used a simplified convolutional neural network combining 5 blocks of a three-dimensional convolutional layer, a batch normalization layer and a 3D max-pooling layer, followed by a fully connected layer and a final 2-way activation layer (SoftMax function) for output binary classification purposes [13]. Rectified linear units (ReLUs) were used as activation functions at all the hidden convolutional layers to add nonlinear complexity. To verify the ability of the CNN to recognize normal scans, an ideal dataset was created by selecting all the strictly normal and highly pathological PET data, excluding injection hot spots, drug-related digestive hypermetabolism, urinary catheters, renal transplants and sophisticated surgical anastomoses. This ideal sample of strictly normal/highly pathological PET data (ratio approximately 50/50, respectively), named the “unambiguous” sample, was first used to train and test the CNN under optimal conditions. For this purpose, the “unambiguous” data sample was split into training and test sets (ratio 90/10). Eighty percent of the training set served to educate the CNN about the binary cross-entropy loss function for a maximum of 100 epochs, with a batch size of 4 per iteration, using the Adam optimizer [14] with a learning rate of 1 e 3 . To prevent overfitting, the training was stopped once the model loss reached the minimum on the validation set. To check the model’s stability, the trained CNN was assessed on the remaining 20% of the training set by using a stratified 5-fold cross-validation procedure [15] and tested on the test set (10% of the unambiguous dataset). We ensured that no patients from the training set were included in the test set.
In the second step, the CNN was trained by starting on the full dataset using a stratified 5-fold cross-validation procedure with the same training parameters, named the “real-life” data sample; it was then evaluated on the previously defined test set using the best fold. All the experiments were run inside the EDS dedicated environment on a GPU NVIDIA P40 (24 Go VRAM) and 48 CPU (188 Go of memory). All the CNN frameworks were built using the PyTorch backend.

2.4. Performance Assessment

To assess the full classification performance of the CNN, the sensitivity (Sen), specificity (Spe), positive and negative predictive values (PPV and NPV), Accuracy (Acc) and likelihood ratios (LR+ and LR−) were calculated from the true-positive, true-negative, false-positive and false-negative predicted classifications of the test sets. The F1 score, a surrogate of accuracy, which is the harmonic mean of precision (the positive predictive value) and recall (sensitivity), was also calculated.

3. Results

A flowchart of the data selection process is provided in Figure 2.
A predefined query search found 8125 FDG PET/CT scans in the EDS. Of these, 6050 had available reports and 5247 had processable cross-matched PET reports at the time of analysis (803 PETs with blank or incomplete reports dues to import or compatibility problems were discarded). After a visual evaluation of the 2D MIP projections of the overall available PET data, 252 exams were discarded due to poor quality (injected dose error, incomplete examination or patient movement artifacts that did not allow for the interpretation of the examination). Of the remaining 4964 PET data (3883 patients), 1084 PET data (986 patients) were included in the “unambiguous” dataset.

3.1. ”Unambiguous” Data Sample

The patients’ characteristics from the “unambiguous” data sample (1084 PETs) are provided in Table 1.
A total of 909 patients (92%) had one PET and 77 patients (8%) had two or more PETs. The training procedure took 20 h 30 min (with a mean of 4 h 06 min per block) and the loss curves showed that the CNN learned efficiently (Figure 3).
The learning process was stopped after 18 epochs. The results of the 5-fold cross validation are provided in Table 2.
Fold 1 provided the best results, with a Sen of 94%, Spe of 100%, PPV and NPV of 100% and 94%, respectively, corresponding to an F1 score of 97%. The pretrained CNN then analyzed the independent remaining test set (108 PETs) and achieved a Se of 84% and Spe of 98%, a PPV and NPV of 98% and 85%, respectively, a F1 score of 90% and LR+ and LR− of 42 and 16%, respectively. The heatmaps derived from the gradient weighted-class activation map method (Grad-CAM) [16] for one patient are provided in Figure 4.
The pretrained CNN then analyzed the remaining database composed of the “ambiguous” PETs (3911 PETs) and achieved a Se of 26% and Spe of 86%, a PPV and NPV of 97.8% and 5%, respectively, and a F1 score of 0.41.

3.2. “Real-Life” Data Sample
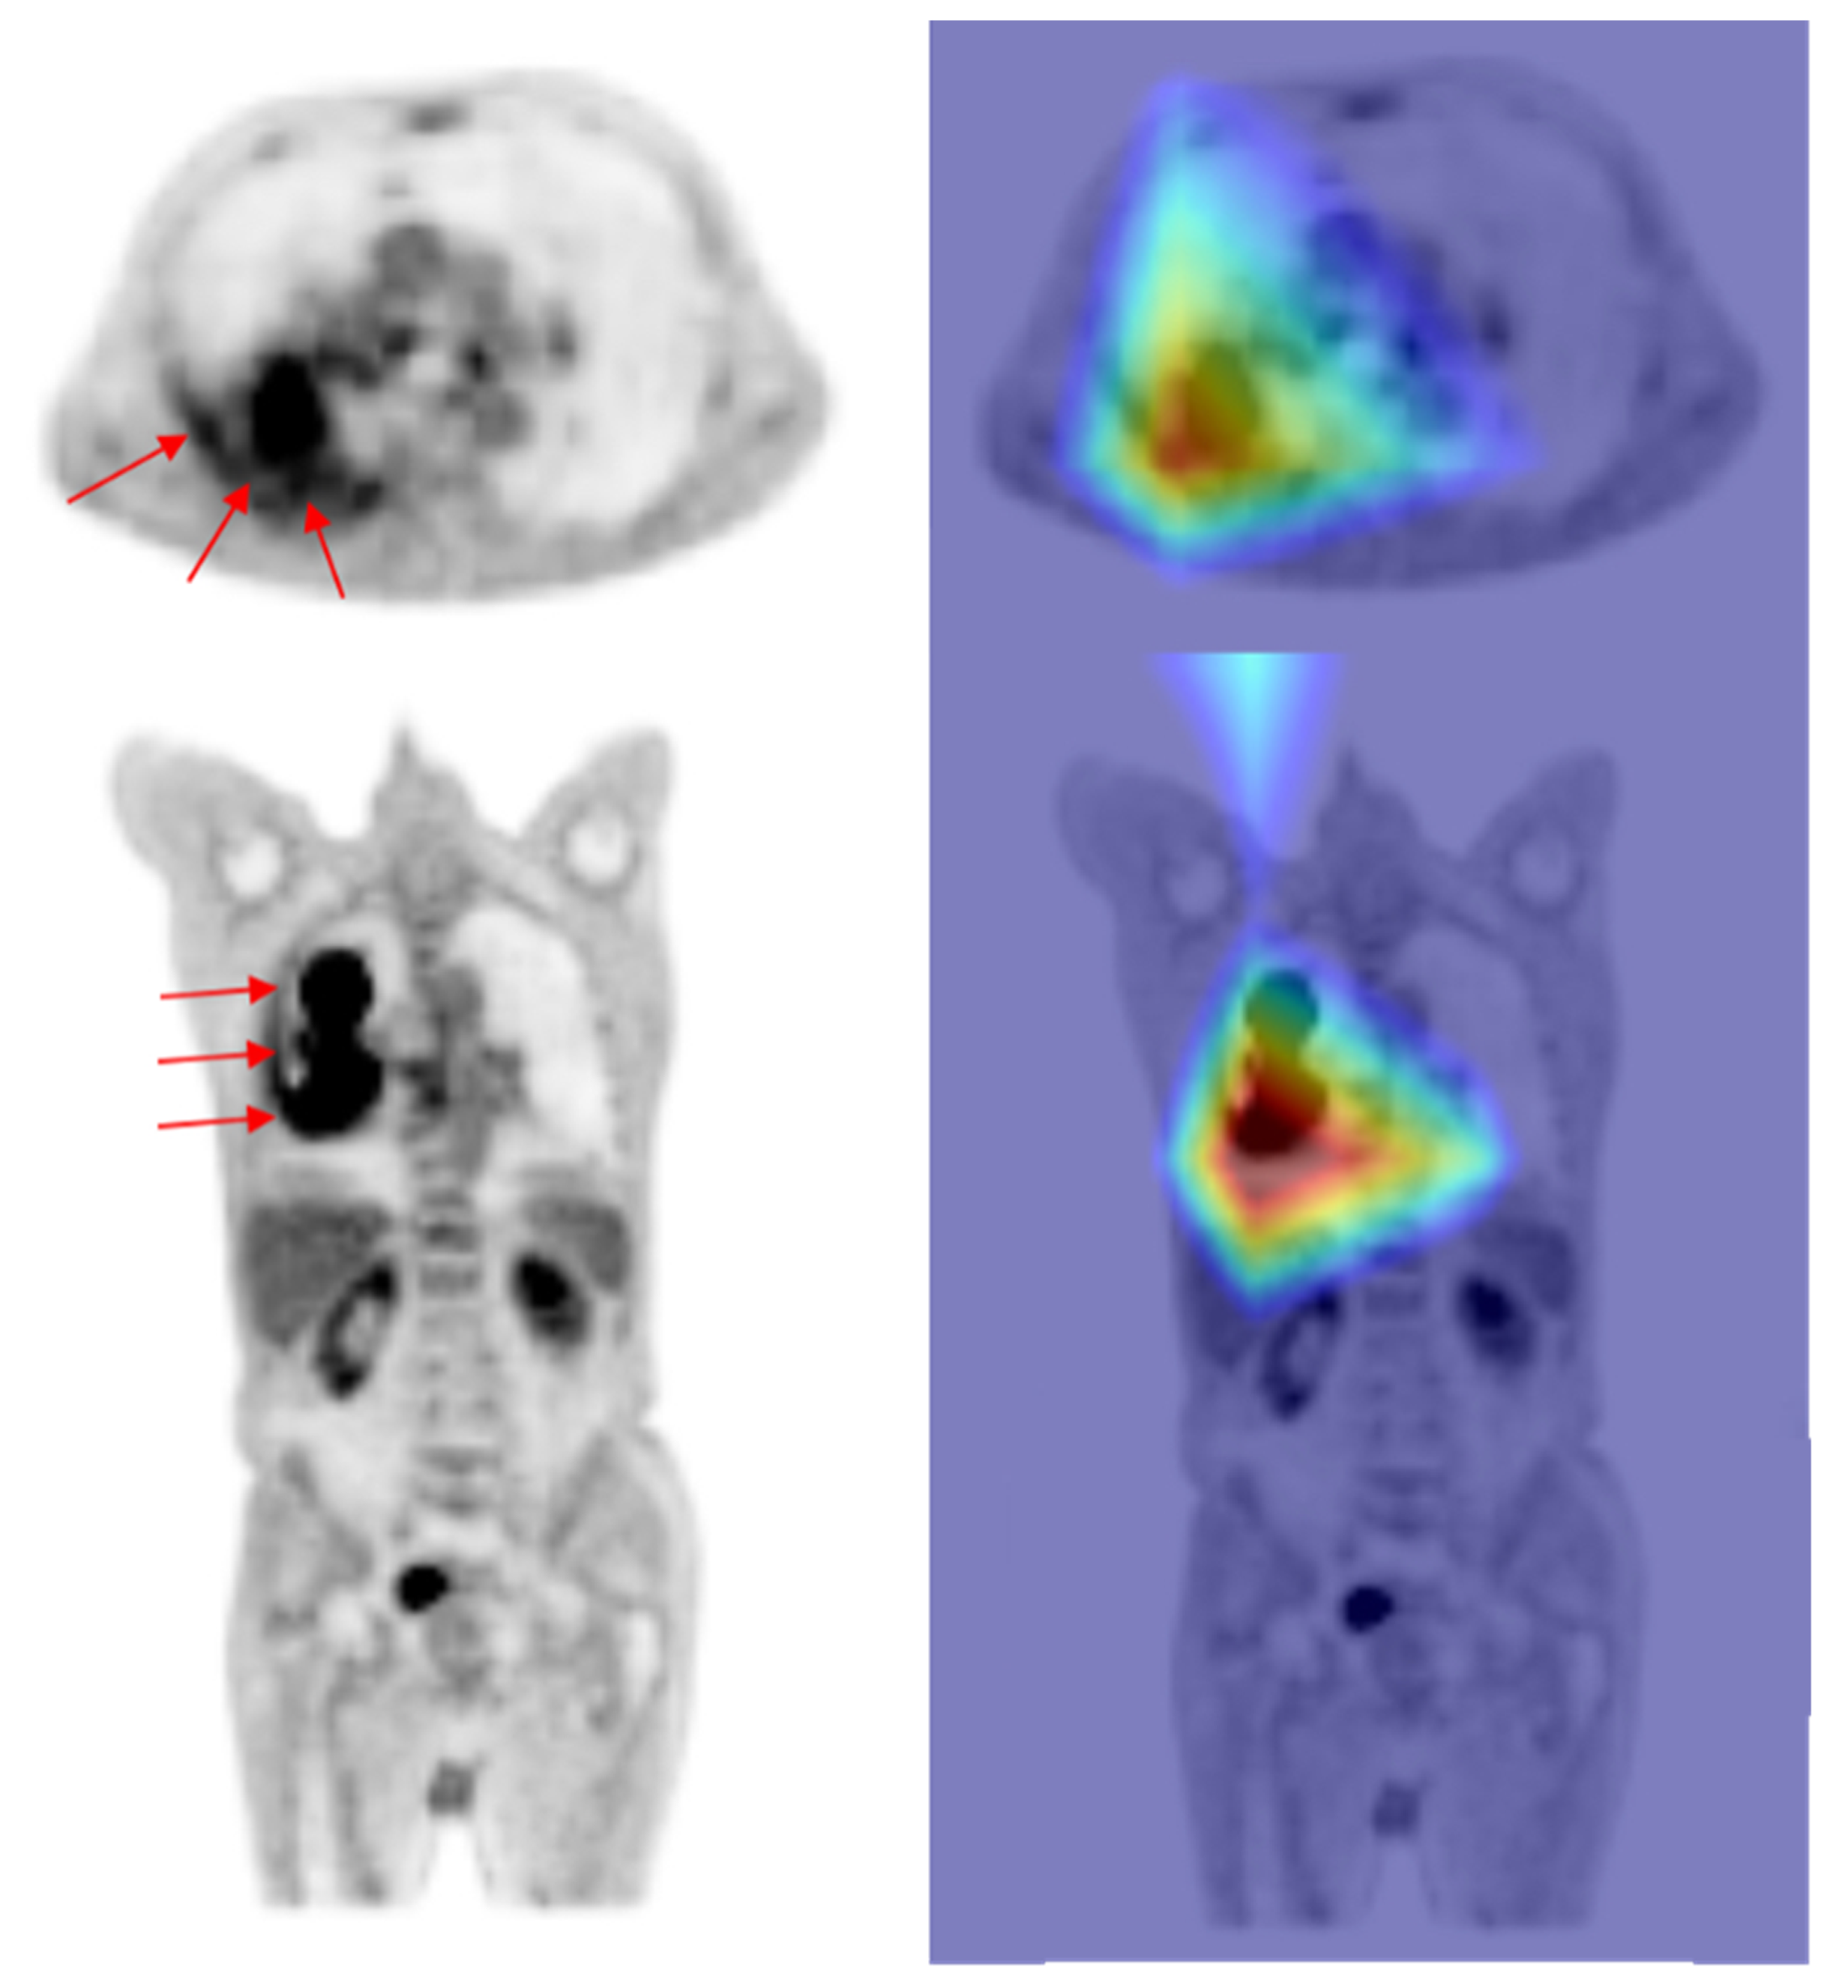
The patients’ characteristics from the “real-life” test set (4964 PETs) are provided in Table 3.
The training procedure took 110 h and 30 min (with a mean of 22 h 06 min per block). The results of the 5-fold cross validation are provided in Table 4.
Fold 4 provided the best results, with a Sen of 62%, Spe of 77%, PPV and NPV of 89.1% and 39.8%, respectively, corresponding to an F1 score of 73%. Finally, when this 3D-CNN was applied to the real-life independent test set (744 PETs), it showed moderate decreases in Sen (61%), NPV (40%), LR+ (2.97) and LR− (0.49), whereas the Spe and PPV remained good (79% and 90%, respectively). The F1 score showed an almost 20% decrease (from 90% in the “unambiguous” test set to 73% in the “real-life” test set) and the accuracy was equivalent (64%–IC95% [62.5–69.3]). There was no statistically significant difference in its performance based on gender. An illustrative heatmap of a wrong classification is provided in Figure 5.
For a better understanding of the model, the algorithm’s performance was evaluated by separating the “unambiguous” from the “ambiguous” PET studies (Table 5). A better performance was obtained on the “unambiguous” sub-test set with a PPV and NPV of 90% and 40%, with a slight decline in the NPV (20%) on the “ambiguous” sub-test set.

4. Discussion

To our knowledge, this study is the first attempt to propose a general AI-based whole-body 3D PET automated triage for general practice purposes, with a comparison of its performance in ideal conditions versus real-life practice. AI-based medical imaging support could become a major healthcare issue, especially due to the growing imbalance between the available dedicated manpower and the daily mass of imaging data [17]. In recent years, several PET studies have highlighted the promising performance of AI applied to basic segmentation or classification tasks [18,19]. However, its clinical relevance to patient workflow remains an open question, especially because of the drawbacks presented by very limited data samples (mono- or multicenter), very limited application scopes and strictly nonambiguous data samples.
Taking advantage of an institutional clinical data warehouse, nearly 5000 monocentric miscellaneous FDG PET data were fully exploited. This proof-of-concept study assessed the accuracy of a fully 3D-CNN at automatically classifying normal and abnormal whole-body FDG PETs in standard practice. Our results showed the 3D-CNN had a very impressive deep-learning capability to classify miscellaneous whole-body FDG PET scans when the corresponding PET data were voluntary and unequivocal. In this hyperselected context, the automated classification reached a Sen and Spe of 84% and 98%, respectively, with a PPV and NPV of 98% and 85% and a LR+ and LR− of 42 and 0.16, respectively. Interestingly, the model showed high specificity and NPV, emphasizing its capability to accurately identify “completely normal” from “highly pathological” scans. Our results from the “unambiguous” dataset are close to those obtained by Kawauchi et al. for the classification of clinical FDG PET MIP into benign/malignant or equivocal categories [19]. In their study, a ResNet-based 2D-CNN architecture reached 87.5–99% accuracy depending on the category. A low representation of non-oncological patients and equivocal scans, together with unknown characteristics of the training and test sets, should position their study as done under ideal conditions. Indeed, when applied to the remaining test set composed of ambiguous PET studies, our model performance dropped dramatically, reaching an NPV of only 5%. Recently, Sibille L. and coworkers [20] showed that their 2D neural network was highly efficient at identifying and delineating suspicious and nonsuspicious whole-body PET/CT uptakes in a monocentric cohort of 629 lymphoma and lung cancer patients. Similarly, when their PET Assisted Reporting System prototype (PARS) was applied to two additional external cohorts (119 lymphoma patients and 430 miscellaneous cancers) it failed to confirm the high initial performance [7]. One should consider the issues related to patient selection bias which leads to overrated models in AI-based imaging studies, especially in the high-pressure publishing context of a hot-topic field. In this sense, a recent review of AI-based radiological detection methods for COVID-19 highlighted the major methodological drawbacks and lack of model transparency in the majority of related models published in recent years, diminishing their clinical relevance to real-life practice [21]. Considering the intrinsic physiological variability of FDG distribution in the body, PET labeling conceptually appeared to be a hard task in our study. In particular, numerous inflammatory conditions show subtle FDG PET abnormalities, which would be, for the same patient, of low relevance in the case of oncological purposes. Thus, the right definition of a “normal” scan is challenging and needs to be further refined outside of optimized clinical contexts, in order to make automated general triage feasible in real clinical practice. From such a general triage perspective, we think training models which classify malignant from benign diseases have limited value in practice for at least two reasons: FDG PET systematically needs a histological confirmation in the case of abnormal findings, and there is much overlap between non-oncological and oncological diseases in terms of FDG pattern distributions or avidity degrees. It appears illusory to aim to totally free the imaging expert from his interpretation task, especially because AI does not integrate the holistic dimension of the analysis [22]. From this realistic perspective, and despite the technical challenges of the intrinsic variability within the PET data, we believe in the relevance of the automated identification of nonambiguous normal scans for general high-throughput triage in clinical practice.
Our study has several limitations. First, this was a monocentric and single vendor PET-CT, retrospective study. However, approximately 5000 structured PET data were used in this proof-of-concept study, increasing the majority of already published cohorts in this field by a factor of five to 20. Second, the “real-life” test set was highly unbalanced in favor of abnormal scans, contrary to the unambiguous dataset. This could explain the poor performance we observed when we initially tested the CNN pretrained with unambiguous data on the remaining equivocal data (NPV of 5%). We thus retrained the CNN from scratch, with the same training parameters and architecture, using the whole dataset (“real life”). This trained CNN showed an overall weaker performance with a PPV and NPV of 91% and 26%, but was comparable to its performance on the “unambiguous” data. These results may indicate better feature learning when realistic PET data ambiguity is integrated from the training phase. In this context, the definition of FDG PET normality is crucial but not absolute: without the particular context, the inherent heterogeneity in patients’ whole-body FDG uptake patterns is high, regardless of the monocentric and multicenter designs.
Although the performance of the model is promising, its routine clinical use is not yet possible. There are several avenues of improvement to explore. First, there is the clinical contextualization for each examination, allowing a subjective but clinically relevant definition of a “normal” examination. Our results suggest that increasing the number of examinations could allow for better learning of the extrinsic variabilities of the tracer distribution. Automated labeling based on NLP algorithms [23] or the use of k-fold averaging to test for general robustness [24] are also promising approaches to improve CNN performance.

5. Conclusions

AI-based automated classification of whole-body FDG PET is a promising method for high-throughput triage in general clinical practice. Before reaching multicenter operability, further studies are necessary to overcome the numerous conceptual and contextual challenges presented by the inherent heterogeneity of PET molecular imaging in humans.

Author Contributions

Design, acquisition analysis, revising for intellectual content, final approval and agreement to be accountable for all aspects of this work (accuracy and integrity of any part of the work): A.B., H.D., A.M., C.P., C.H.-K., S.B., C.D., P.M., L.G., M.F., E.D. and F.L.B. PET data processing and CNN building: A.B. Data warehouse logistic supervision and deployment for this PET study: F.L.B., A.M., C.P., C.H.-K., S.B., C.D., P.M., L.G. and M.F. All authors have read and agreed to the published version of the manuscript.

Funding

This work was partially supported by the French government through the 3IA Côte d’Azur Investments in the Future project managed by the National Research Agency (ANR) with the reference number ANR-19-P3IA-0002.

Institutional Review Board Statement

The project was approved by the institutional review board (authorization number IRB 00011591) of the AP-HP scientific and ethical committee (CSE-EDS n°18–38, CLARITI). This article does not contain any studies conducted with human participants or animals performed by any of the authors.

Informed Consent Statement

According to the rules of EDS, the written informed consent of patients is waived.

Data Availability Statement

The data that support the findings of this study are under license, and so are not publicly available. Data are, however, available from the authors upon reasonable request and with permission of the clinical data warehouse of the greater Paris University hospitals—Assistance Publique—Hôpitaux de Paris (AP-HP).

Acknowledgments

The authors would like to thank Cyrina SAUSSOL and Yannick JACOB for their technical help throughout the project, as well as the Department I&D-PACTE in charge of the implementation of EDS. The authors would also like to thank the AP-HP clinical research and innovation department, in particular the AP-HP, Université Paris Saclay research unit for their support in completing this project.

Conflicts of Interest

The authors declare there are no conflict of interest.

References

  1. Fletcher, J.W.; Djulbegovic, B.; Soares, H.P.; Siegel, B.A.; Lowe, V.J.; Lyman, G.H.; Coleman, R.E.; Wahl, R.; Paschold, J.C.; Avril, N.; et al. Recommendations on the Use of 18F-FDG PET in Oncology. J. Nucl. Med. 2008, 49, 480–508. [Google Scholar] [CrossRef] [PubMed]
  2. Jamar, F.; Buscombe, J.; Chiti, A.; Christian, P.E.; Delbeke, D.; Donohoe, K.J.; Israel, O.; Martin-Comin, J.; Signore, A. EANM/SNMMI Guideline for 18F-FDG Use in Inflammation and Infection. J. Nucl. Med. 2013, 54, 647–658. [Google Scholar] [CrossRef]
  3. Boellaard, R.; Delgado-Bolton, R.; Oyen, W.J.G.; Giammarile, F.; Tatsch, K.; Eschner, W.; Verzijlbergen, F.J.; Barrington, S.F.; Pike, L.C.; Weber, W.A.; et al. FDG PET/CT: EANM Procedure Guidelines for Tumour Imaging: Version 2.0. Eur. J. Nucl. Med. Mol. Imaging 2015, 42, 328–354. [Google Scholar] [CrossRef]
  4. Keraen, J.; Blanc, E.; Besson, F.L.; Leguern, V.; Meyer, C.; Henry, J.; Belkhir, R.; Nocturne, G.; Mariette, X.; Seror, R. Usefulness of 18F-Labeled Fluorodeoxyglucose–Positron Emission Tomography for the Diagnosis of Lymphoma in Primary Sjögren’s Syndrome. Arthritis Rheumatol. 2019, 71, 1147–1157. [Google Scholar] [CrossRef]
  5. Slart, R.H.J.A.; Writing Group; Reviewer Group; Members of EANM Cardiovascular; Members of EANM Infection & Inflammation; Members of Committees, SNMMI Cardiovascular; Members of Council; PET Interest Group; Members of ASNC & EANM Committee Coordinator. FDG-PET/CT(A) Imaging in Large Vessel Vasculitis and Polymyalgia Rheumatica: Joint Procedural Recommendation of the EANM, SNMMI, and the PET Interest Group (PIG), and Endorsed by the ASNC. Eur. J. Nucl. Med. Mol. Imaging 2018, 45, 1250–1269. [Google Scholar] [CrossRef]
  6. Besson, F.L.; Chaumet-Riffaud, P.; Playe, M.; Noel, N.; Lambotte, O.; Goujard, C.; Prigent, A.; Durand, E. Contribution of 18F-FDG PET in the Diagnostic Assessment of Fever of Unknown Origin (FUO): A Stratification-Based Meta-Analysis. Eur. J. Nucl. Med. Mol. Imaging 2016, 43, 1887–1895. [Google Scholar] [CrossRef] [PubMed]
  7. Pinochet, P.; Eude, F.; Becker, S.; Shah, V.; Sibille, L.; Toledano, M.N.; Modzelewski, R.; Vera, P.; Decazes, P. Evaluation of an Automatic Classification Algorithm Using Convolutional Neural Networks in Oncological Positron Emission Tomography. Front. Med. 2021, 8, 628179. [Google Scholar] [CrossRef] [PubMed]
  8. Mlynarski, P.; Delingette, H.; Criminisi, A.; Ayache, N. 3D Convolutional Neural Networks for Tumor Segmentation Using Long-Range 2D Context. Comput. Med. Imaging Graph. 2019, 73, 60–72. [Google Scholar] [CrossRef]
  9. Lotter, W.; Diab, A.R.; Haslam, B.; Kim, J.G.; Grisot, G.; Wu, E.; Wu, K.; Onieva, J.O.; Boyer, Y.; Boxerman, J.L.; et al. Robust Breast Cancer Detection in Mammography and Digital Breast Tomosynthesis Using an Annotation-Efficient Deep Learning Approach. Nat. Med. 2021, 27, 244–249. [Google Scholar] [CrossRef]
  10. Lakhani, P.; Sundaram, B. Deep Learning at Chest Radiography: Automated Classification of Pulmonary Tuberculosis by Using Convolutional Neural Networks. Radiology 2017, 284, 574–582. [Google Scholar] [CrossRef]
  11. Saraf, V.; Chavan, P.; Jadhav, A. Deep Learning Challenges in Medical Imaging. In Advanced Computing Technologies and Applications; Vasudevan, H., Michalas, A., Shekokar, N., Narvekar, M., Eds.; Springer: Singapore, 2020; pp. 293–301. [Google Scholar]
  12. Daniel, C.; Serre, P.; Orlova, N.; Bréant, S.; Paris, N.; Griffon, N. Initializing a Hospital-Wide Data Quality Program. The AP-HP Experience. Comput. Methods Programs Biomed. 2019, 181, 104804. [Google Scholar] [CrossRef] [PubMed]
  13. Wen, J.; Thibeau-Sutre, E.; Diaz-Melo, M.; Samper-González, J.; Routier, A.; Bottani, S.; Dormont, D.; Durrleman, S.; Burgos, N.; Colliot, O. Convolutional Neural Networks for Classification of Alzheimer’s Disease: Overview and Reproducible Evaluation. Med. Image Anal. 2020, 63, 101694. [Google Scholar] [CrossRef]
  14. Kingma, D.P.; Ba, J. Adam: A Method for Stochastic Optimization. arXiv 2017, arXiv:1412.6980. [Google Scholar]
  15. Refaeilzadeh, P.; Tang, L.; Liu, H. Cross-Validation. In Encyclopedia of Database Systems; Liu, L., Özsu, M.T., Eds.; Springer: Boston, MA, USA, 2009; pp. 532–538. ISBN 978-0-387-35544-3. [Google Scholar]
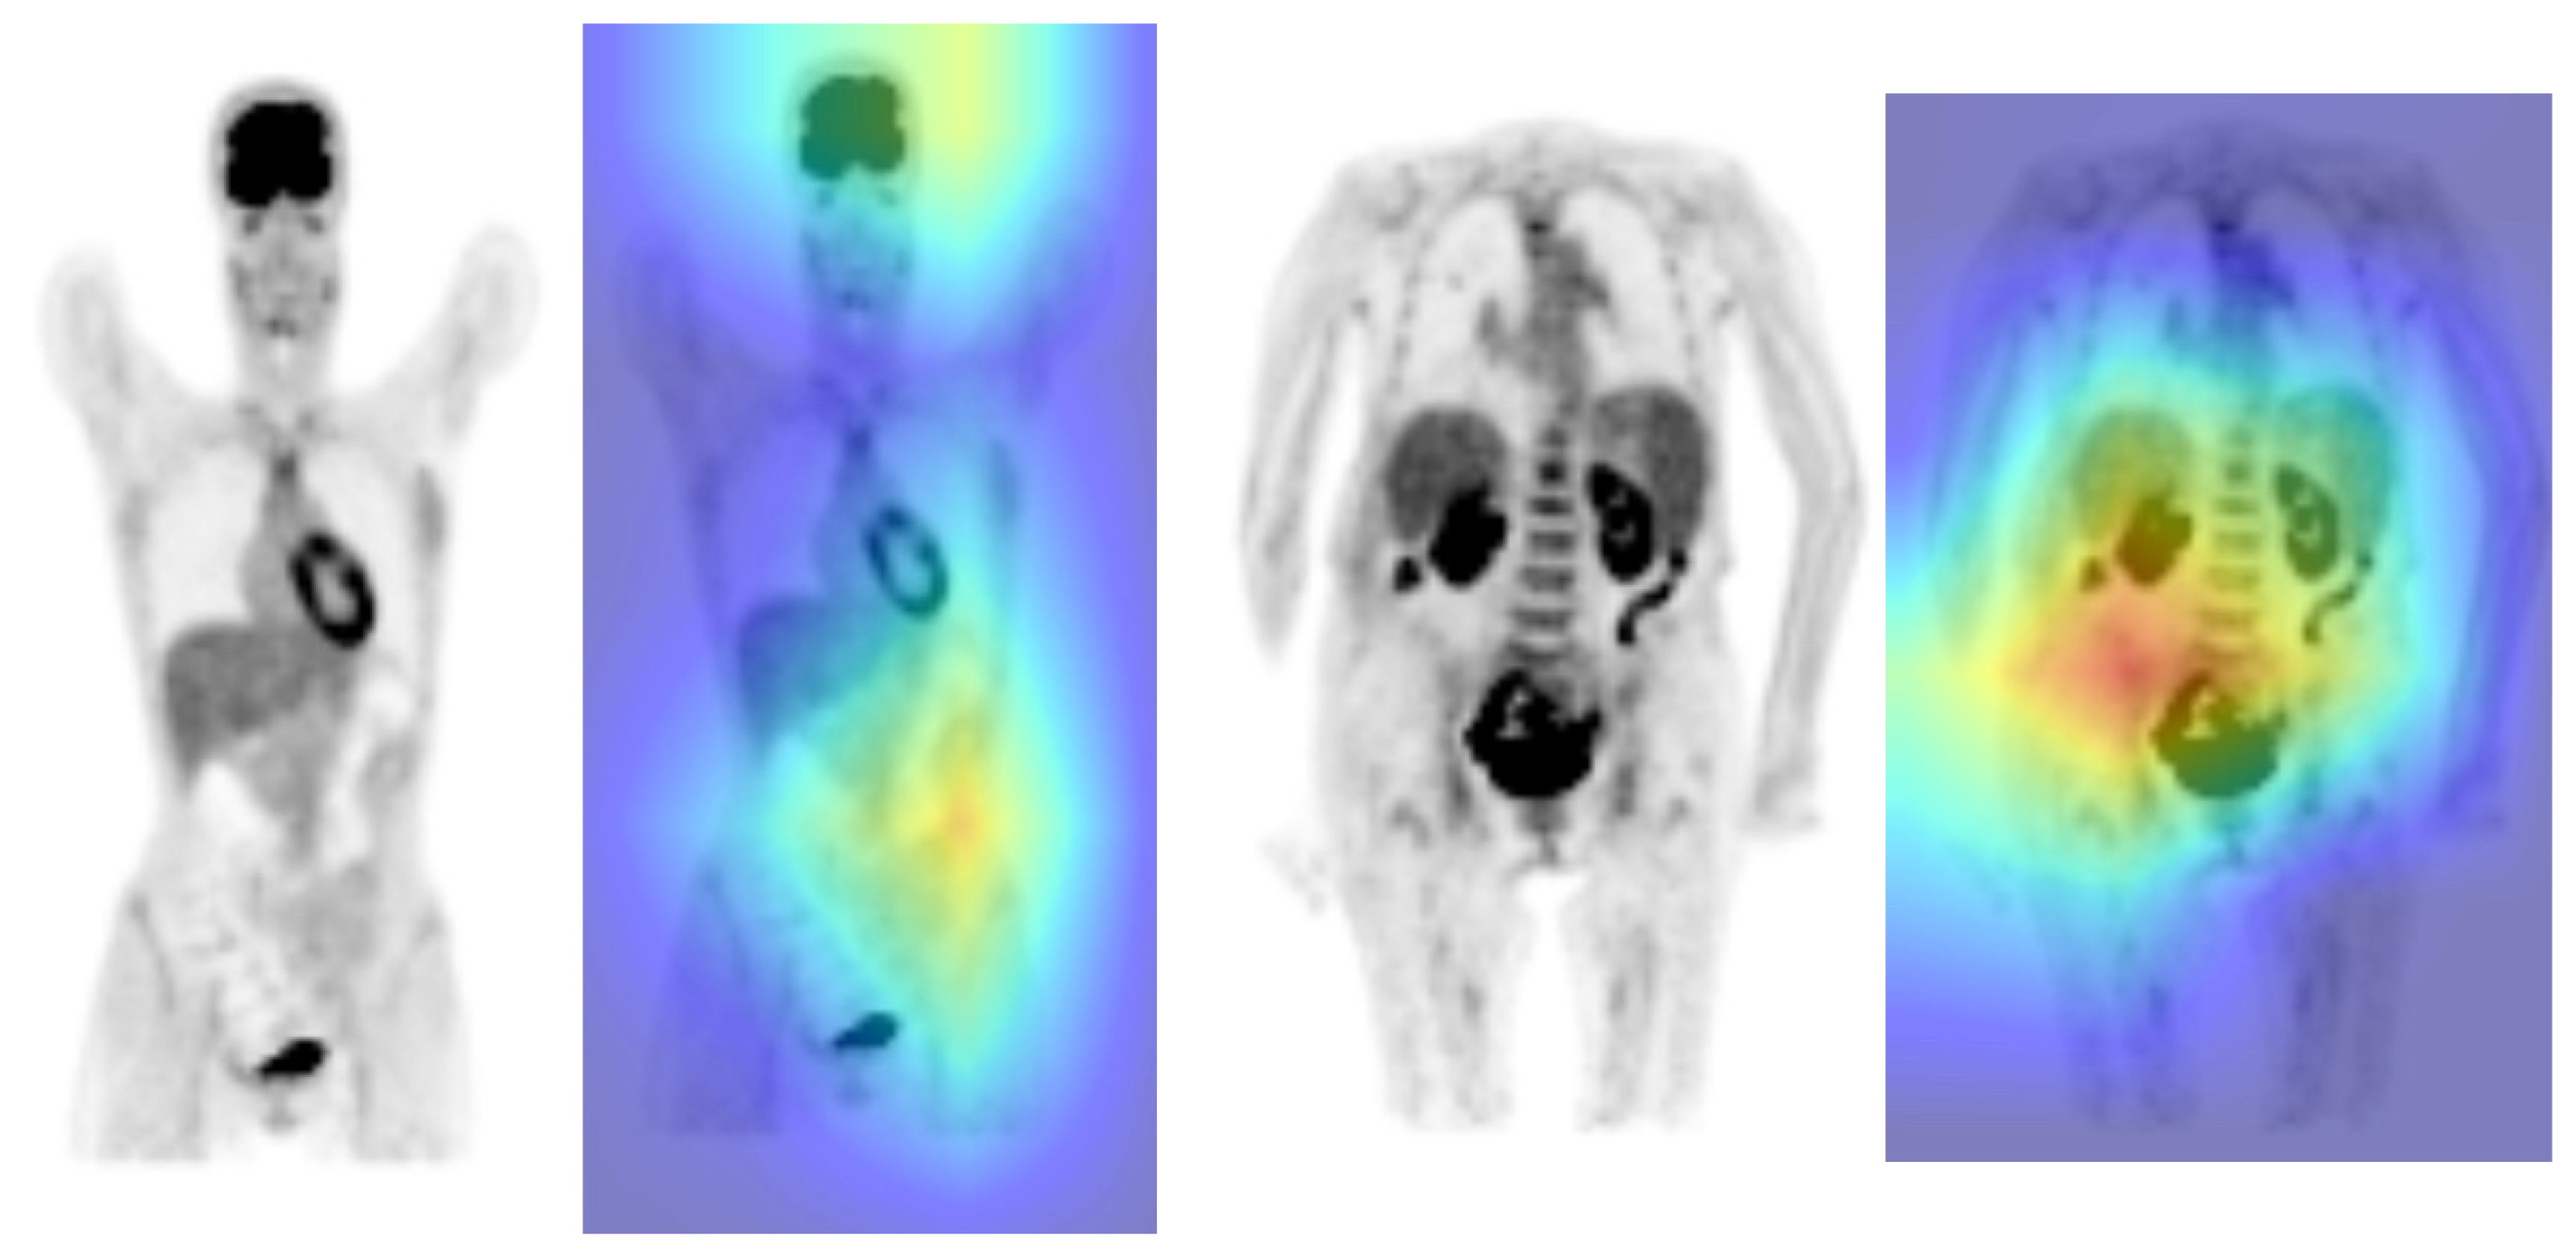
  16. Selvaraju, R.R.; Cogswell, M.; Das, A.; Vedantam, R.; Parikh, D.; Batra, D. Grad-CAM: Visual Explanations from Deep Networks via Gradient-Based Localization. Int. J. Comput. Vis. 2020, 128, 336–359. [Google Scholar] [CrossRef]
  17. Karimi, D.; Dou, H.; Warfield, S.K.; Gholipour, A. Deep Learning with Noisy Labels: Exploring Techniques and Remedies in Medical Image Analysis. Med. Image Anal. 2020, 65, 101759. [Google Scholar] [CrossRef] [PubMed]
  18. Kirienko, M.; Biroli, M.; Gelardi, F.; Seregni, E.; Chiti, A.; Sollini, M. Deep Learning in Nuclear Medicine—Focus on CNN-Based Approaches for PET/CT and PET/MR: Where Do We Stand? Clin. Transl. Imaging 2021, 9, 37–55. [Google Scholar] [CrossRef]
  19. Kawauchi, K.; Furuya, S.; Hirata, K.; Katoh, C.; Manabe, O.; Kobayashi, K.; Watanabe, S.; Shiga, T. A Convolutional Neural Network-Based System to Classify Patients Using FDG PET/CT Examinations. BMC Cancer 2020, 20, 227. [Google Scholar] [CrossRef]
  20. Sibille, L.; Seifert, R.; Avramovic, N.; Vehren, T.; Spottiswoode, B.; Zuehlsdorff, S.; Schäfers, M. 18F-FDG PET/CT Uptake Classification in Lymphoma and Lung Cancer by Using Deep Convolutional Neural Networks. Radiology 2020, 294, 445–452. [Google Scholar] [CrossRef]
  21. Roberts, M.; Driggs, D.; Thorpe, M.; Gilbey, J.; Yeung, M.; Ursprung, S.; Aviles-Rivero, A.I.; Etmann, C.; McCague, C.; Beer, L.; et al. Common Pitfalls and Recommendations for Using Machine Learning to Detect and Prognosticate for COVID-19 Using Chest Radiographs and CT Scans. Nat. Mach. Intell. 2021, 3, 199–217. [Google Scholar] [CrossRef]
  22. Veit-Haibach, P.; Buvat, I.; Herrmann, K. EJNMMI Supplement: Bringing AI and Radiomics to Nuclear Medicine. Eur. J. Nucl. Med. Mol. Imaging 2019, 46, 2627–2629. [Google Scholar] [CrossRef]
  23. Eyuboglu, S.; Angus, G.; Patel, B.N.; Pareek, A.; Davidzon, G.; Long, J.; Dunnmon, J.; Lungren, M.P. Multi-Task Weak Supervision Enables Anatomically-Resolved Abnormality Detection in Whole-Body FDG-PET/CT. Nat. Commun. 2021, 12, 1880. [Google Scholar] [CrossRef] [PubMed]
  24. Jung, Y.; Hu, J. A K-Fold Averaging Cross-Validation Procedure. J. Nonparametric Stat. 2015, 27, 167–179. [Google Scholar] [CrossRef] [PubMed]
Figure 1. Architecture of the CNN used: five blocks composed of a 3D convolution (3 × 3 × 3), a 3D batch normalization and a 3D max-pooling (2 × 2 × 2) layer, followed by a fully connected layer (3 layers, from 12,288 neurons to 2 neurons), with a binary output for prediction.
Applsci 13 05281 g001
Figure 2. Flowchart from the processing of the initial database up until the creation of the “real life” and “unambiguous” subset. MR: medical report.
Applsci 13 05281 g002
Figure 3. Evolution of the loss function on the training set (a) and the validation set (b) as a function of the number of steps during the cross validation. Each colored curve represents the loss function of a fold.
Applsci 13 05281 g003
Figure 4. The heatmap shows the area of interest used by the algorithm for prediction, which corresponds well with the visualized right lung hypermetabolic tumor. The red arrows show the metabolic anomaly of interest. On the right, the continuous color scale represents the weight assigned to each voxel to make the prediction (dark blue: low weight, to red: maximum weight).
Applsci 13 05281 g004
Figure 5. Heatmap of a wrong classification scan from the “real-life” data sample. Here, the heatmaps of two false-positive examinations do not correspond to the metabolic abnormalities on the PET scan. Grey scale images show a coronal slice of a normal FDG-PET scan. Continuous color scale images represents the weight assigned to each voxel to make the prediction (dark blue: low weight, to red: maximum weight).
Applsci 13 05281 g005
Table 1. Patients’ characteristics from the “unambiguous” data sample.
OverallTraining SetTest Set
n 1084976108
Age in years 58.5 ± 14.758.5 ± 14.958.5 ± 13.5
Weight in kg 72.1 ± 1672.2 ± 1671.3 ± 16.3
Activity in MBq 251.7 ± 57252 ± 57248.9 ± 57.8
SexF481 (44.4%)
603 (55.6%)
440 (45.1%)
536 (54.9%)
41 (38%)
67 (62%)
M
Clinical contextOncological940 (86.7%)847 (86.8%)93 (86.1%)
Non-Oncological144 (13.3%)129 (13.4%)15 (13.9%)
LabelNormal520 (48%)468 (48%)52 (48.1%)
Abnormal564 (52%)508 (52%)56 (51.9%)
Table 2. Results of the 5-fold cross validation of the “unambiguous” data sample.
TPTNFPFNNPV
(%)
PPV
(%)
Sensibility
(%)
Specificity
(%)
Accuracy
(%)
F1 Score
(%)
LR+LR−
fold 196940694.010094.110096.997.0>1000.059
fold 2859211784.498.883.398.990.890.475.7270.169
fold 3919211189.398.989.298.993.893.881.0910.109
fold 4899401288.710088.110093.893.7>1000.119
fold 5899221288.597.888.197.992.892.741.9520.122
Mean9092.80.81189.099.188.699.193.693.566.2570.116
Variance161.20.7150.100.1000.1450.2230.002
Std deviation4.001.090.843.913.40.93.80.92.22.421.2180.039
Table 3. Patients’ characteristics from the “real-life” data sample.
OverallTraining SetTest Set
n49644220744
Age in years60.7 ± 14.760.5 ± 14.562.0 ± 15.5
Weight in kg70.5 ± 1670.4 ± 1671.1 ± 16.4
Activity in MBq246.5 ± 58246 ± 58249.2 ± 58.7
SexF2453 (49.4%)2111 (50.0%)342 (46%)
M2511 (50.6%)2109 (50.0%)402 (54%)
Clinical contextOncological4370 (88.0%)3739 (88.6%)631 (84.8%)
Non-oncological594 (12.0%)481 (11.4%)113 (15.2%)
LabelNormal1226 (24.7%)1042 (24.7%)184 (24.7%)
Abnormal3738 (75.3%)3178 (75.3%)560 (75.3%)
Table 4. Results of the 5-fold cross validation of the “real-life” data sample.
TPTNFPFNNPV
(%)
PPV
(%)
Sensibility
(%)
Specificity
(%)
Accuracy
(%)
F1 Score
(%)
LR+LR−
fold 13401812729637.992.653.587.061.767.84.11830.5348
fold 23671614726937.488.657.777.462.669.92.55370.5464
fold 34221476121440.787.466.470.767.475.42.26250.4761
fold 43911614824439.889.161.677.065.472.82.68110.4988
fold 54061397022937.885.363.966.564.673.11.9090.5422
Mean385.2157.850250.438.788.660.675.764.371.82.7050.52
Variance1048.7257.22651062.30.00.10.30.60.10.10.7130.001
Std deviation32.3816.0416.2932.591.42.75.17.82.33.00.8440.031
Table 5. Results of the “real-life” based trained CNN.
TotalTPTNFPFNNPVPPVSensibilitySpecificityAccuracy
(CI95%)
F1 ScoreLR+LR−
All test sets744403143414030.260.910.500.780.73 ± 0.0320.642.240.64
Unambiguous
PET studies
177996711990.400.900.500.860.94 ± 0.0360.643.540.58
Ambiguous
PET studies
56730476303040.200.910.500.720.67 ± 0.0390.651.770.70
Disclaimer/Publisher’s Note: The statements, opinions and data contained in all publications are solely those of the individual author(s) and contributor(s) and not of MDPI and/or the editor(s). MDPI and/or the editor(s) disclaim responsibility for any injury to people or property resulting from any ideas, methods, instructions or products referred to in the content.

