
Assessing the Impact of AR HUDs and Risk Level on User Experience in Self-Driving Cars: Results from a Realistic Driving Simulation


Abstract
1. Introduction
2. Related Works
2.1. VR Use Cases and Effects in Experiments Related to Autonomous Vehicles (AVs)
2.2. Prior Research on the Degree of Risk and the Reliability of Users According to Information Provision
2.3. Quantitative Measurement of Valence and Arousal Using Galvanic Skin Response (GSR)
3. Study Design
3.1. Experimental Environment and Procedure
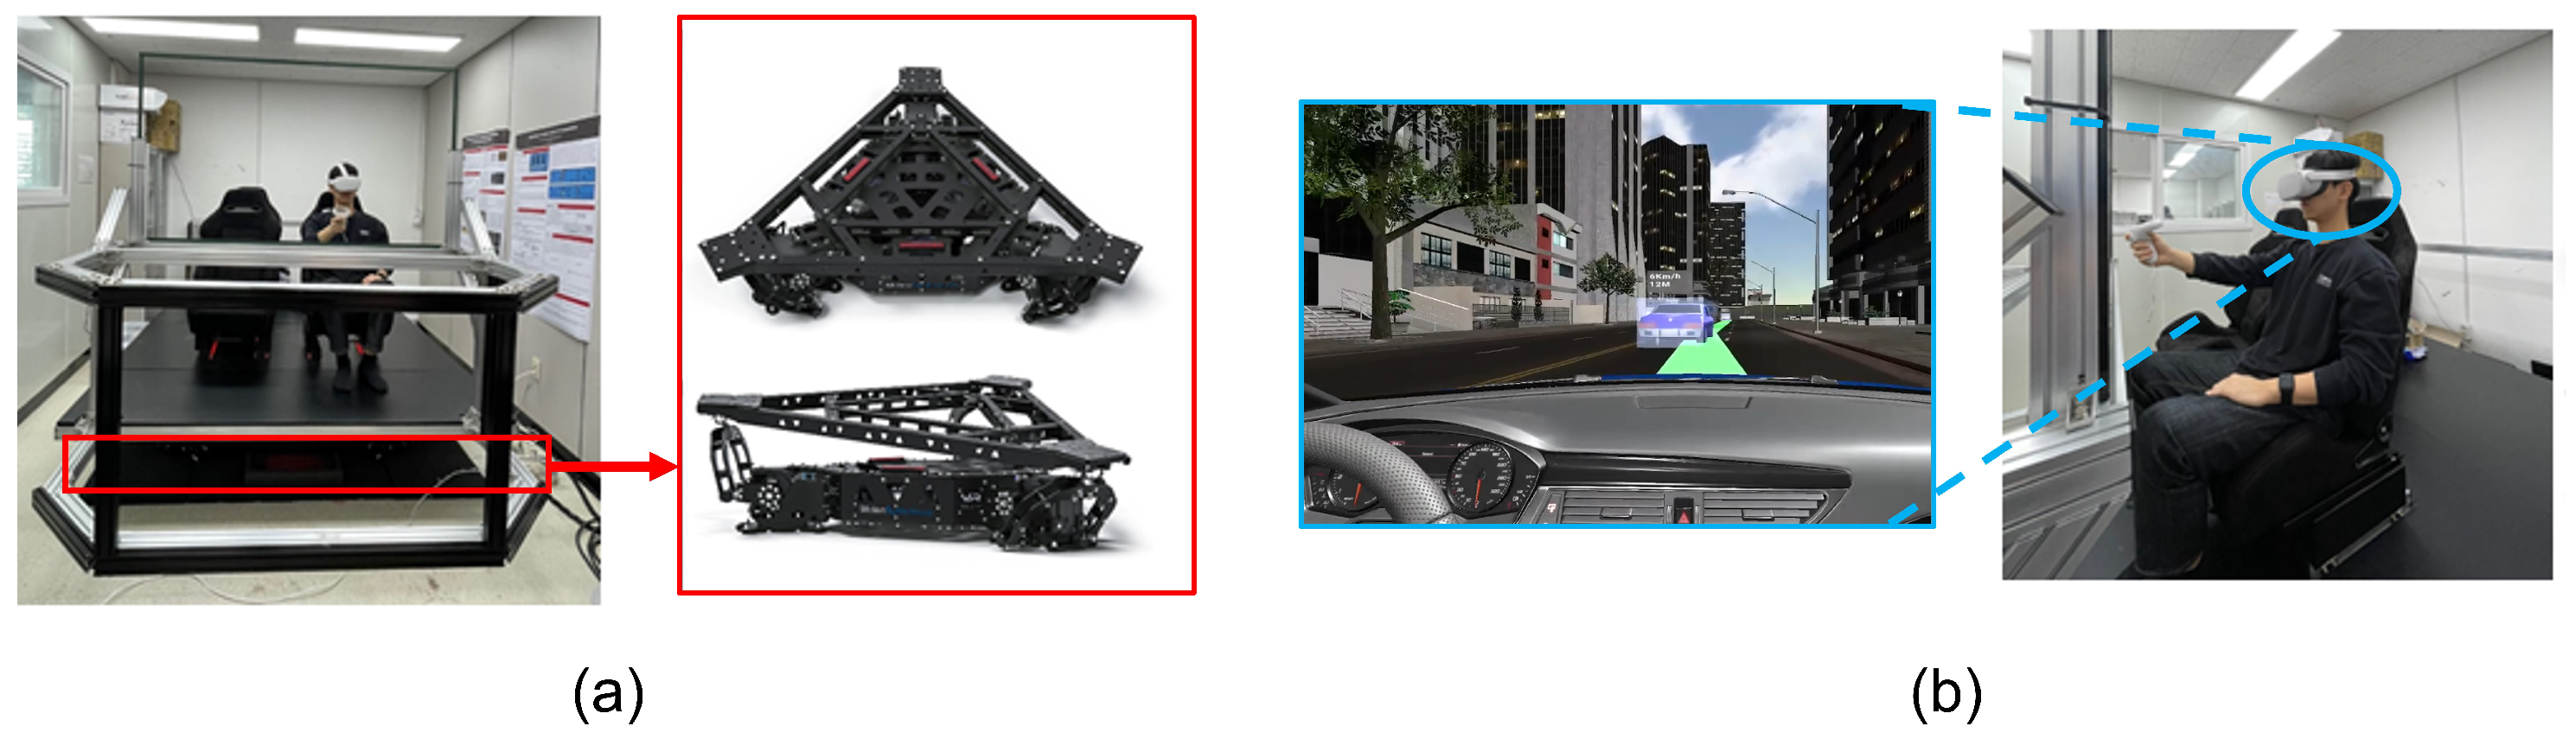
3.1.1. AV Simulator
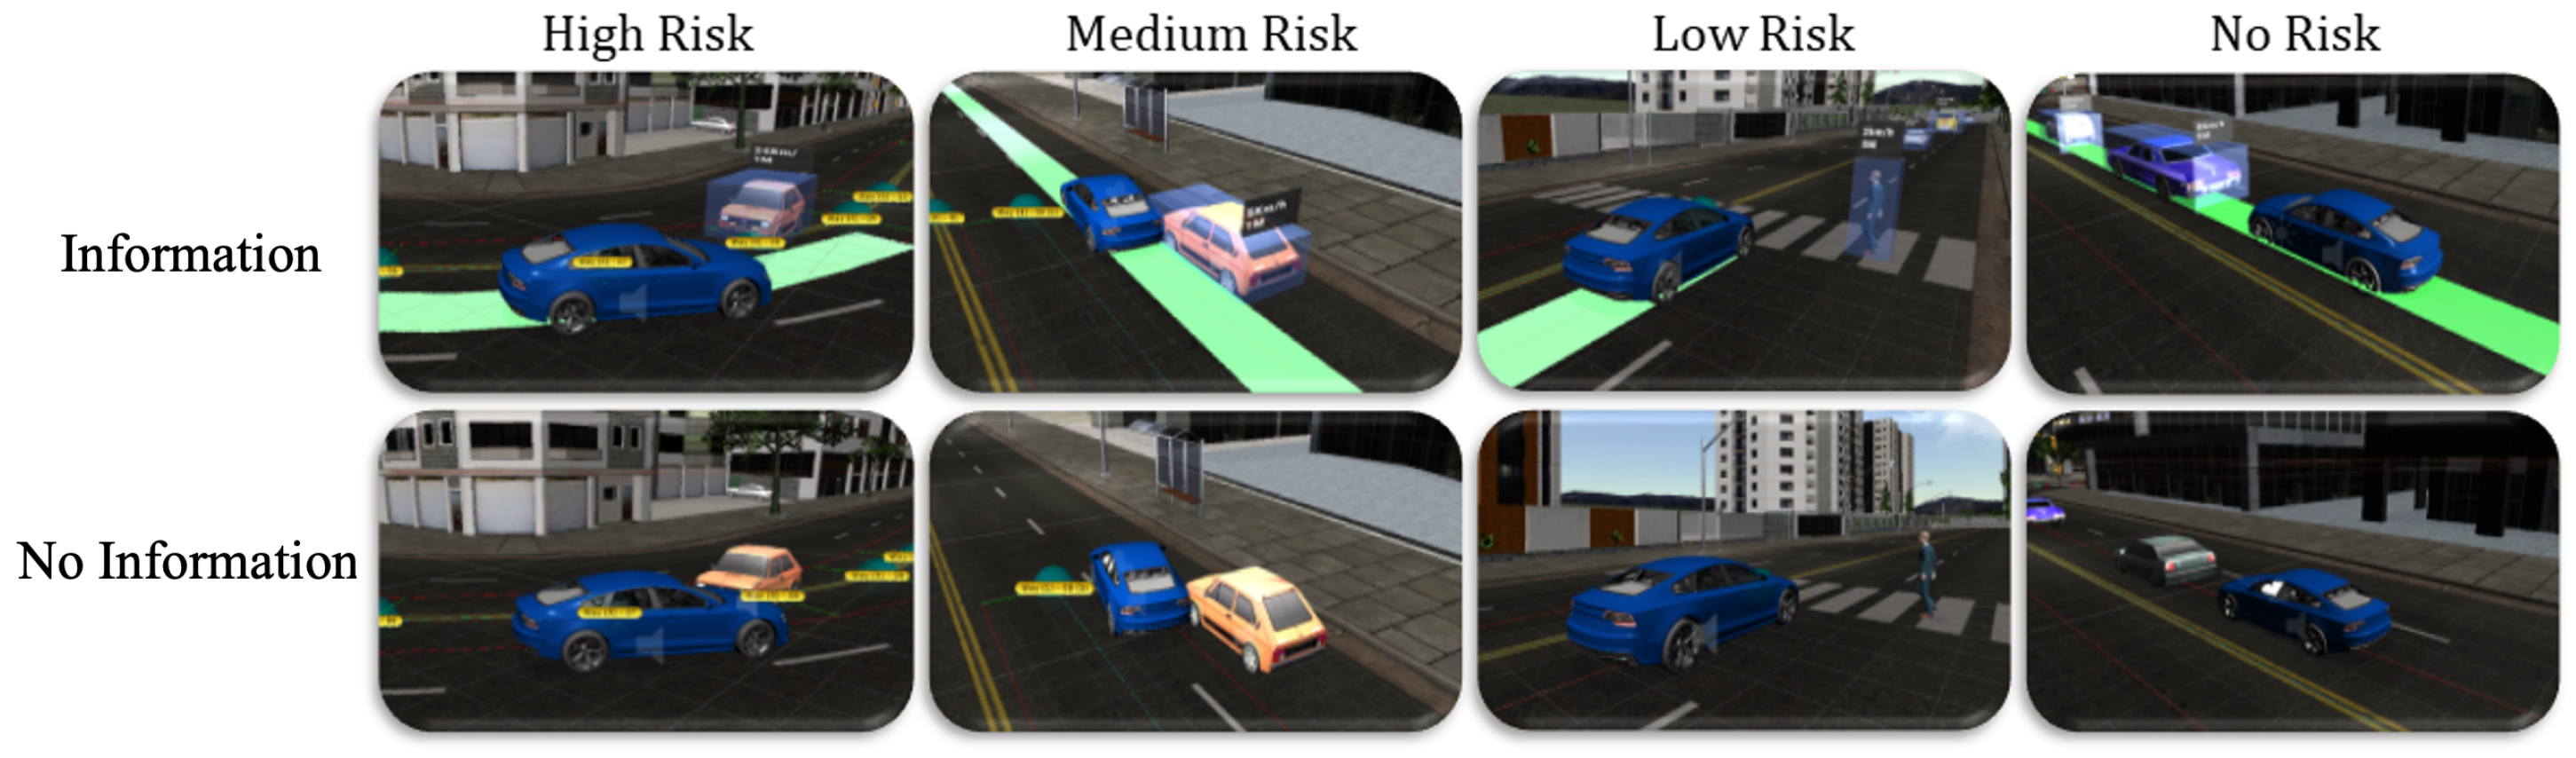
3.1.2. Scenario
- No Risk—The self-driving vehicle drives normally from the beginning to the end of a route without being in any danger.
- Low Risk—The self-driving vehicle is not directly impacted. There is a sudden change in speed due to situations such as a sudden stop by an object appearing on the road.
- Medium Risk—The self-driving vehicle receives a direct weak impact. A minor accident is caused by another vehicle driving on the road.
- High Risk—The self-driving vehicle is directly impacted. A serious accident is caused by another vehicle driving on the road. A detailed description of the presence or absence of information provision of the AR display is as follows:
- Information Given—A state in which the self-driving vehicle displays the information and the route of the currently detected object on the HUD;
- Information Not Given—A state in which the AV provides no information to the HUD;
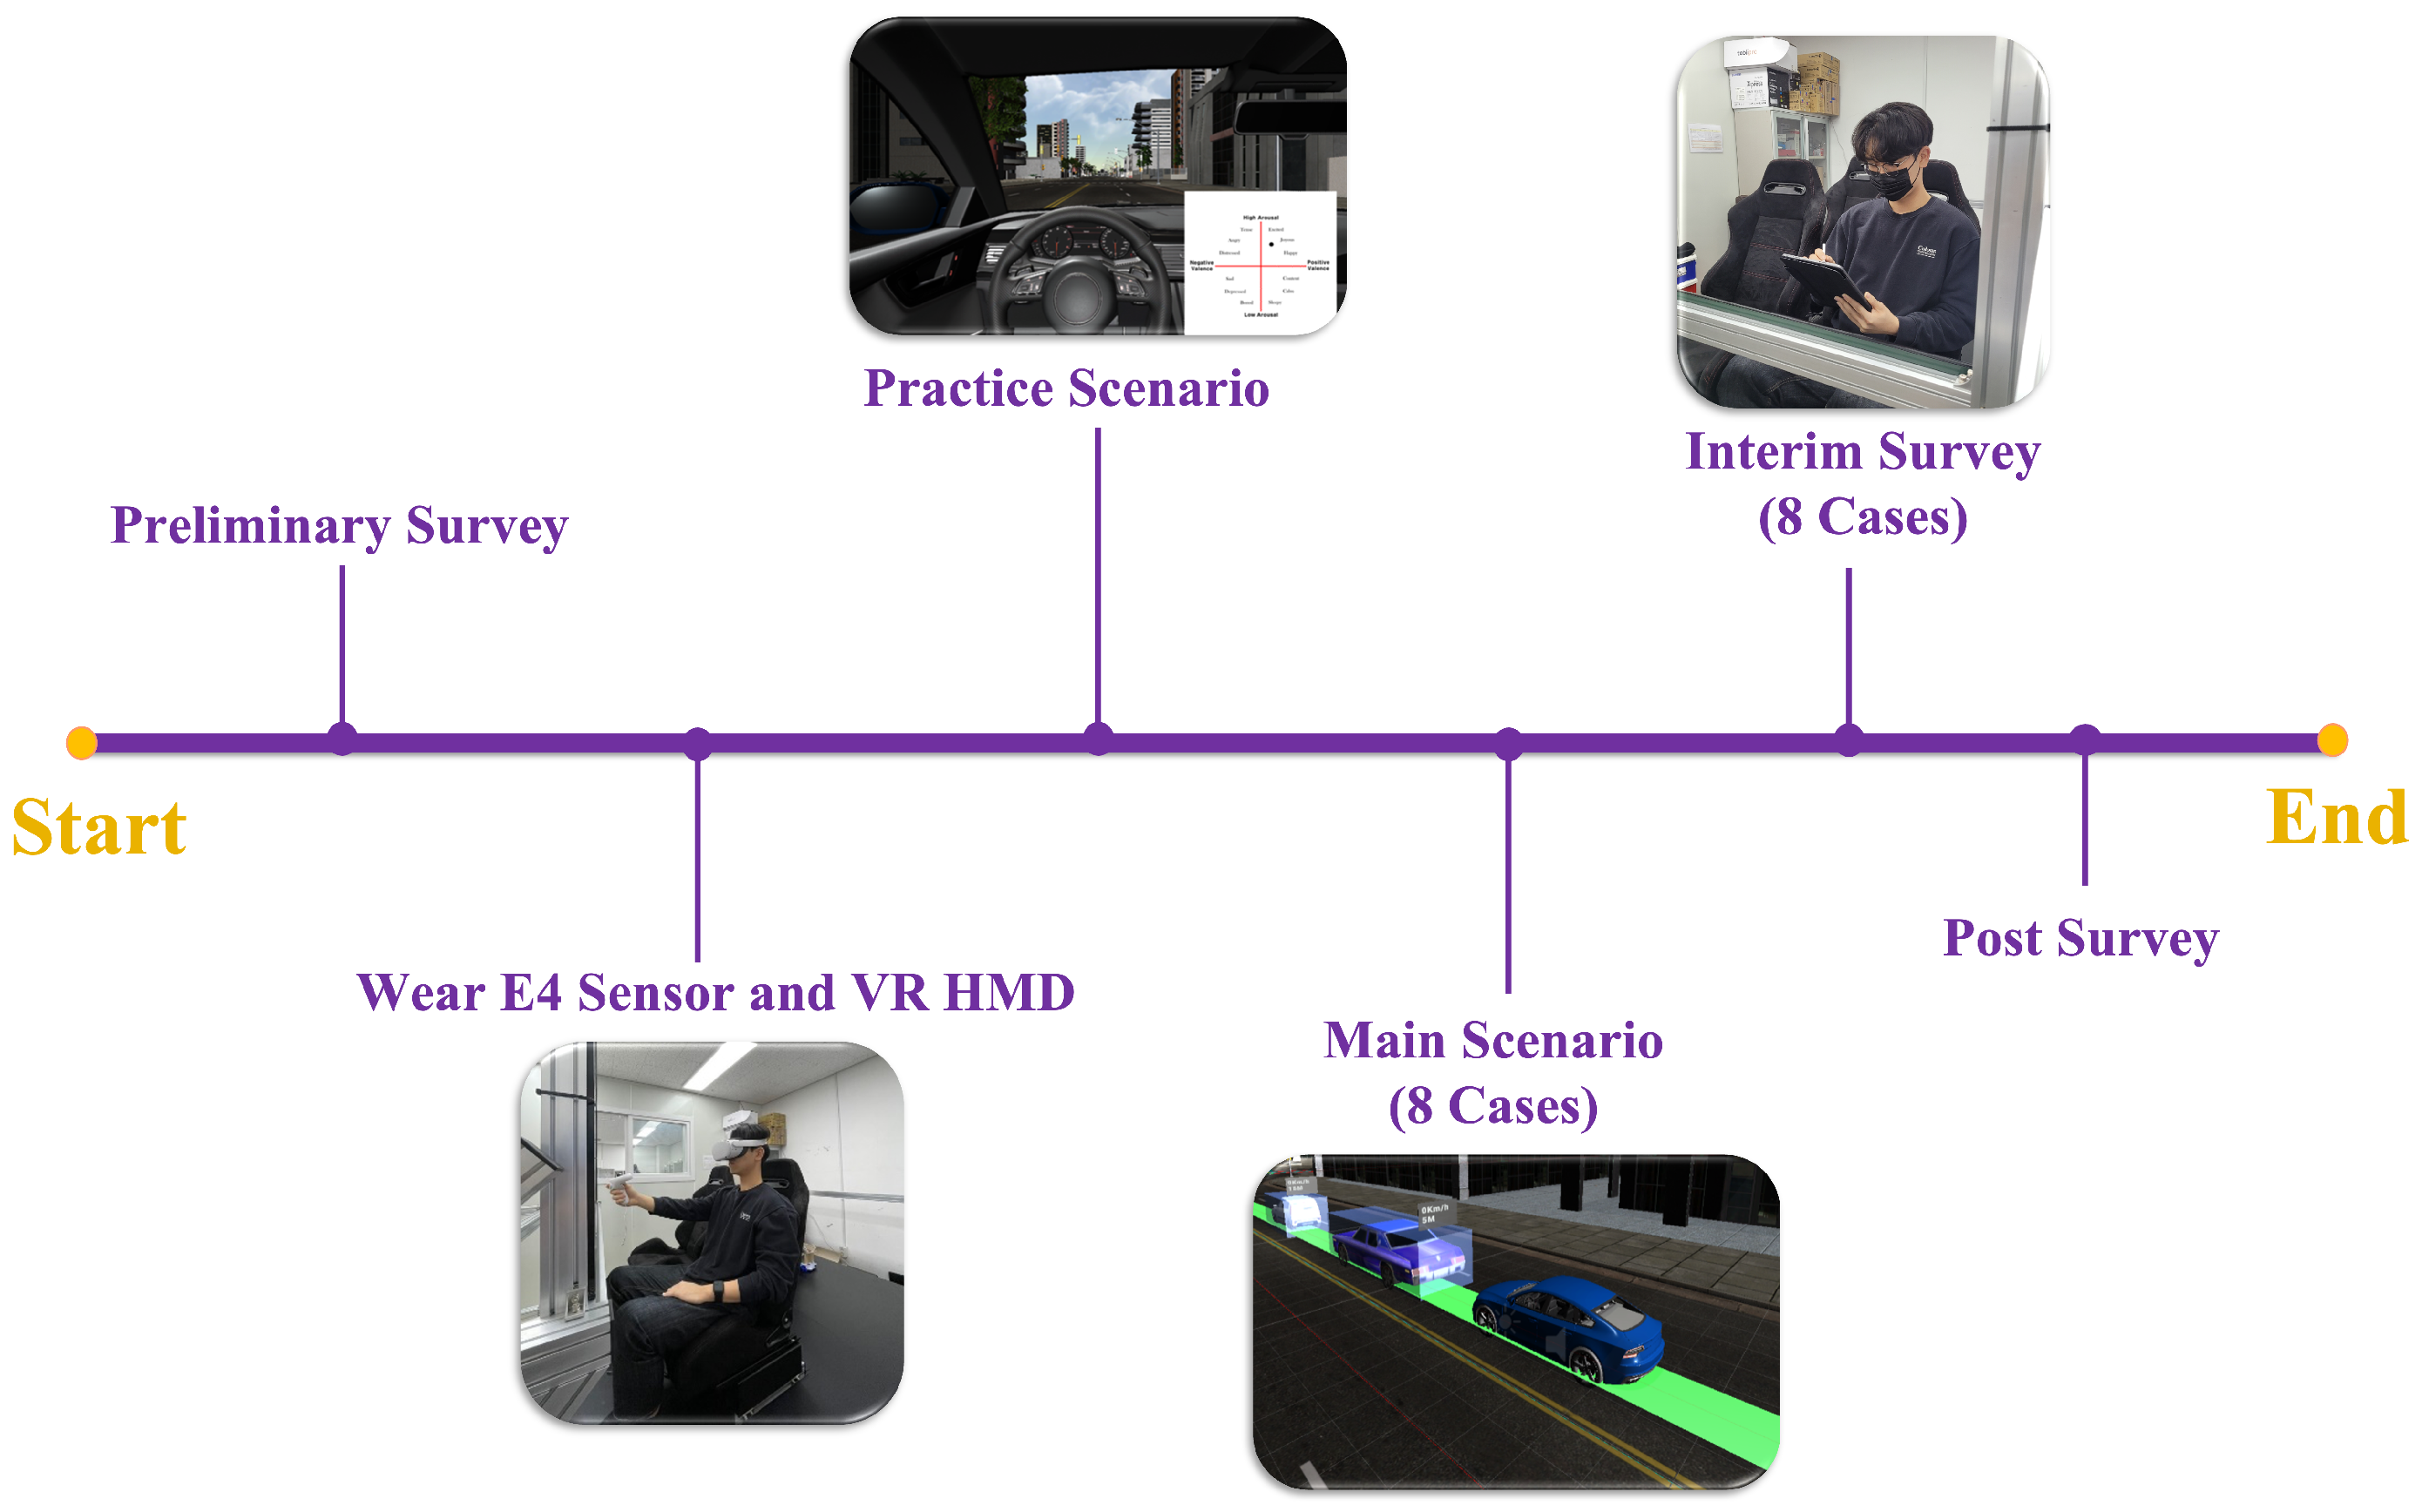
3.1.3. Procedure
3.2. Data Collection and Statistical Analysis
3.2.1. Quantitative Measurement
- The maximum value of GSR data in the 10 s before and after the event (GSR Max)
- The average value of GSR data in the 10 s before and after the event (GSR Mean)
- The maximum value of GSR Tonic data in the 10 s before and after the event (GSR Tonic Max)
- The average value of GSR Tonic data in the 10 s before and after the event (GSR Tonic Mean)
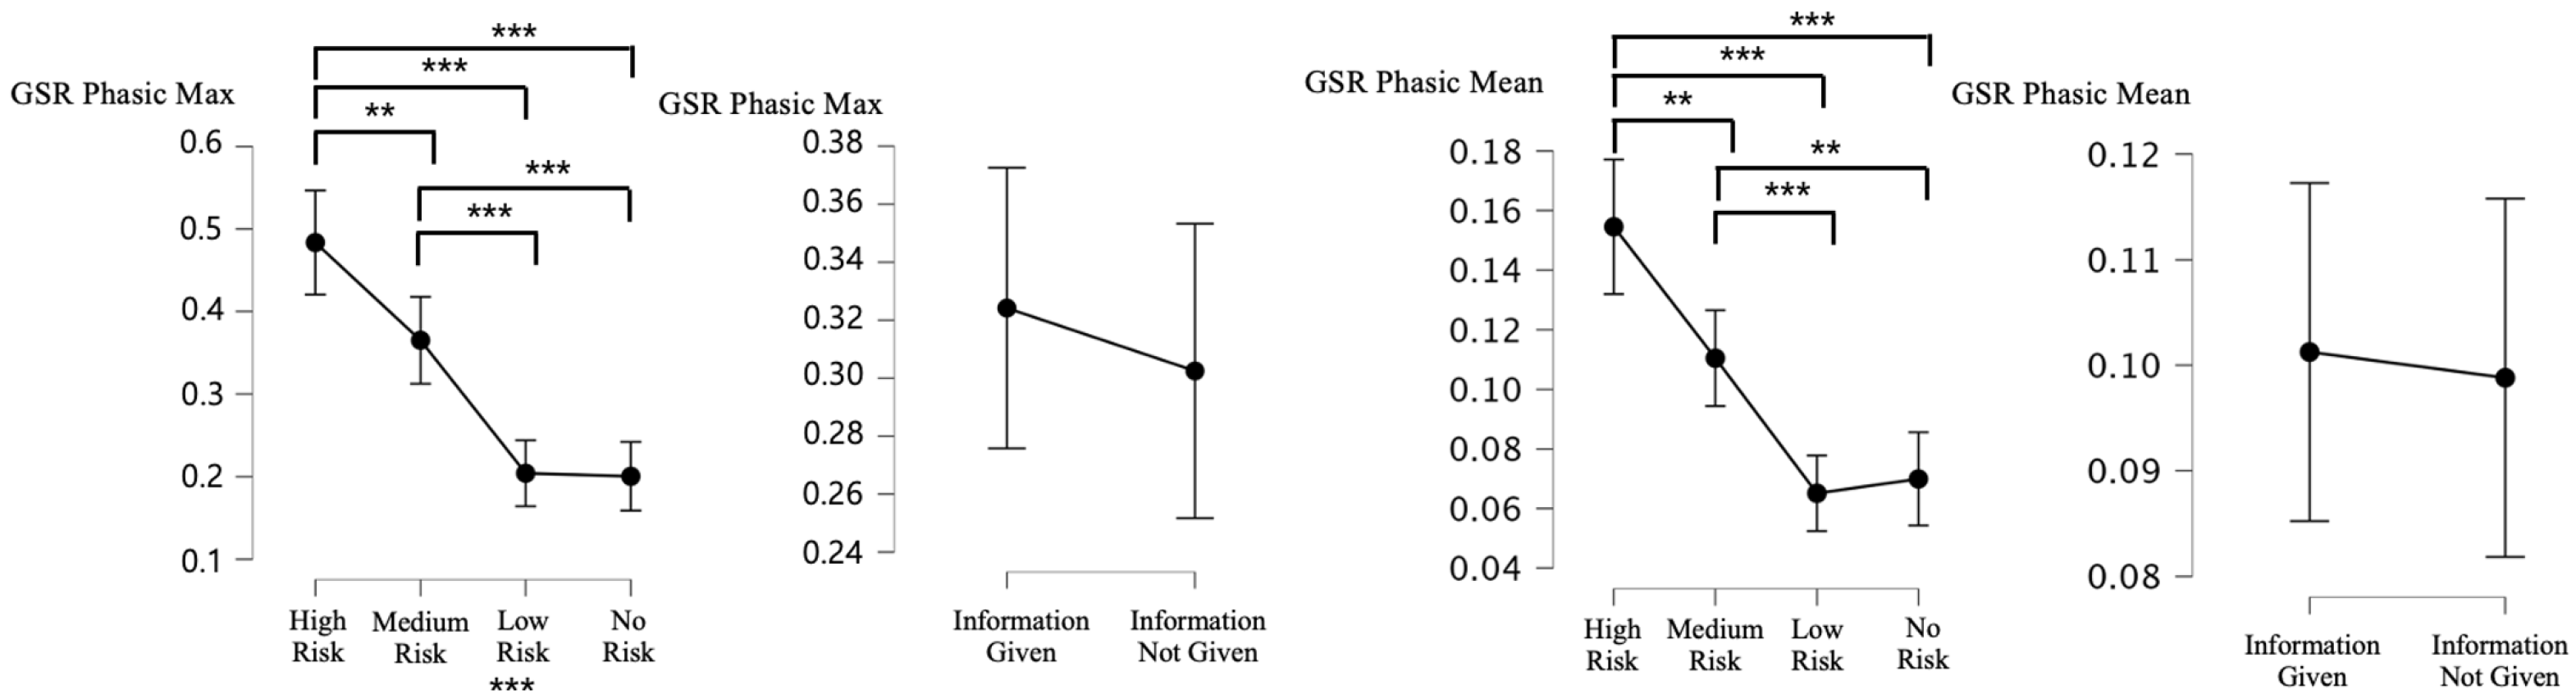
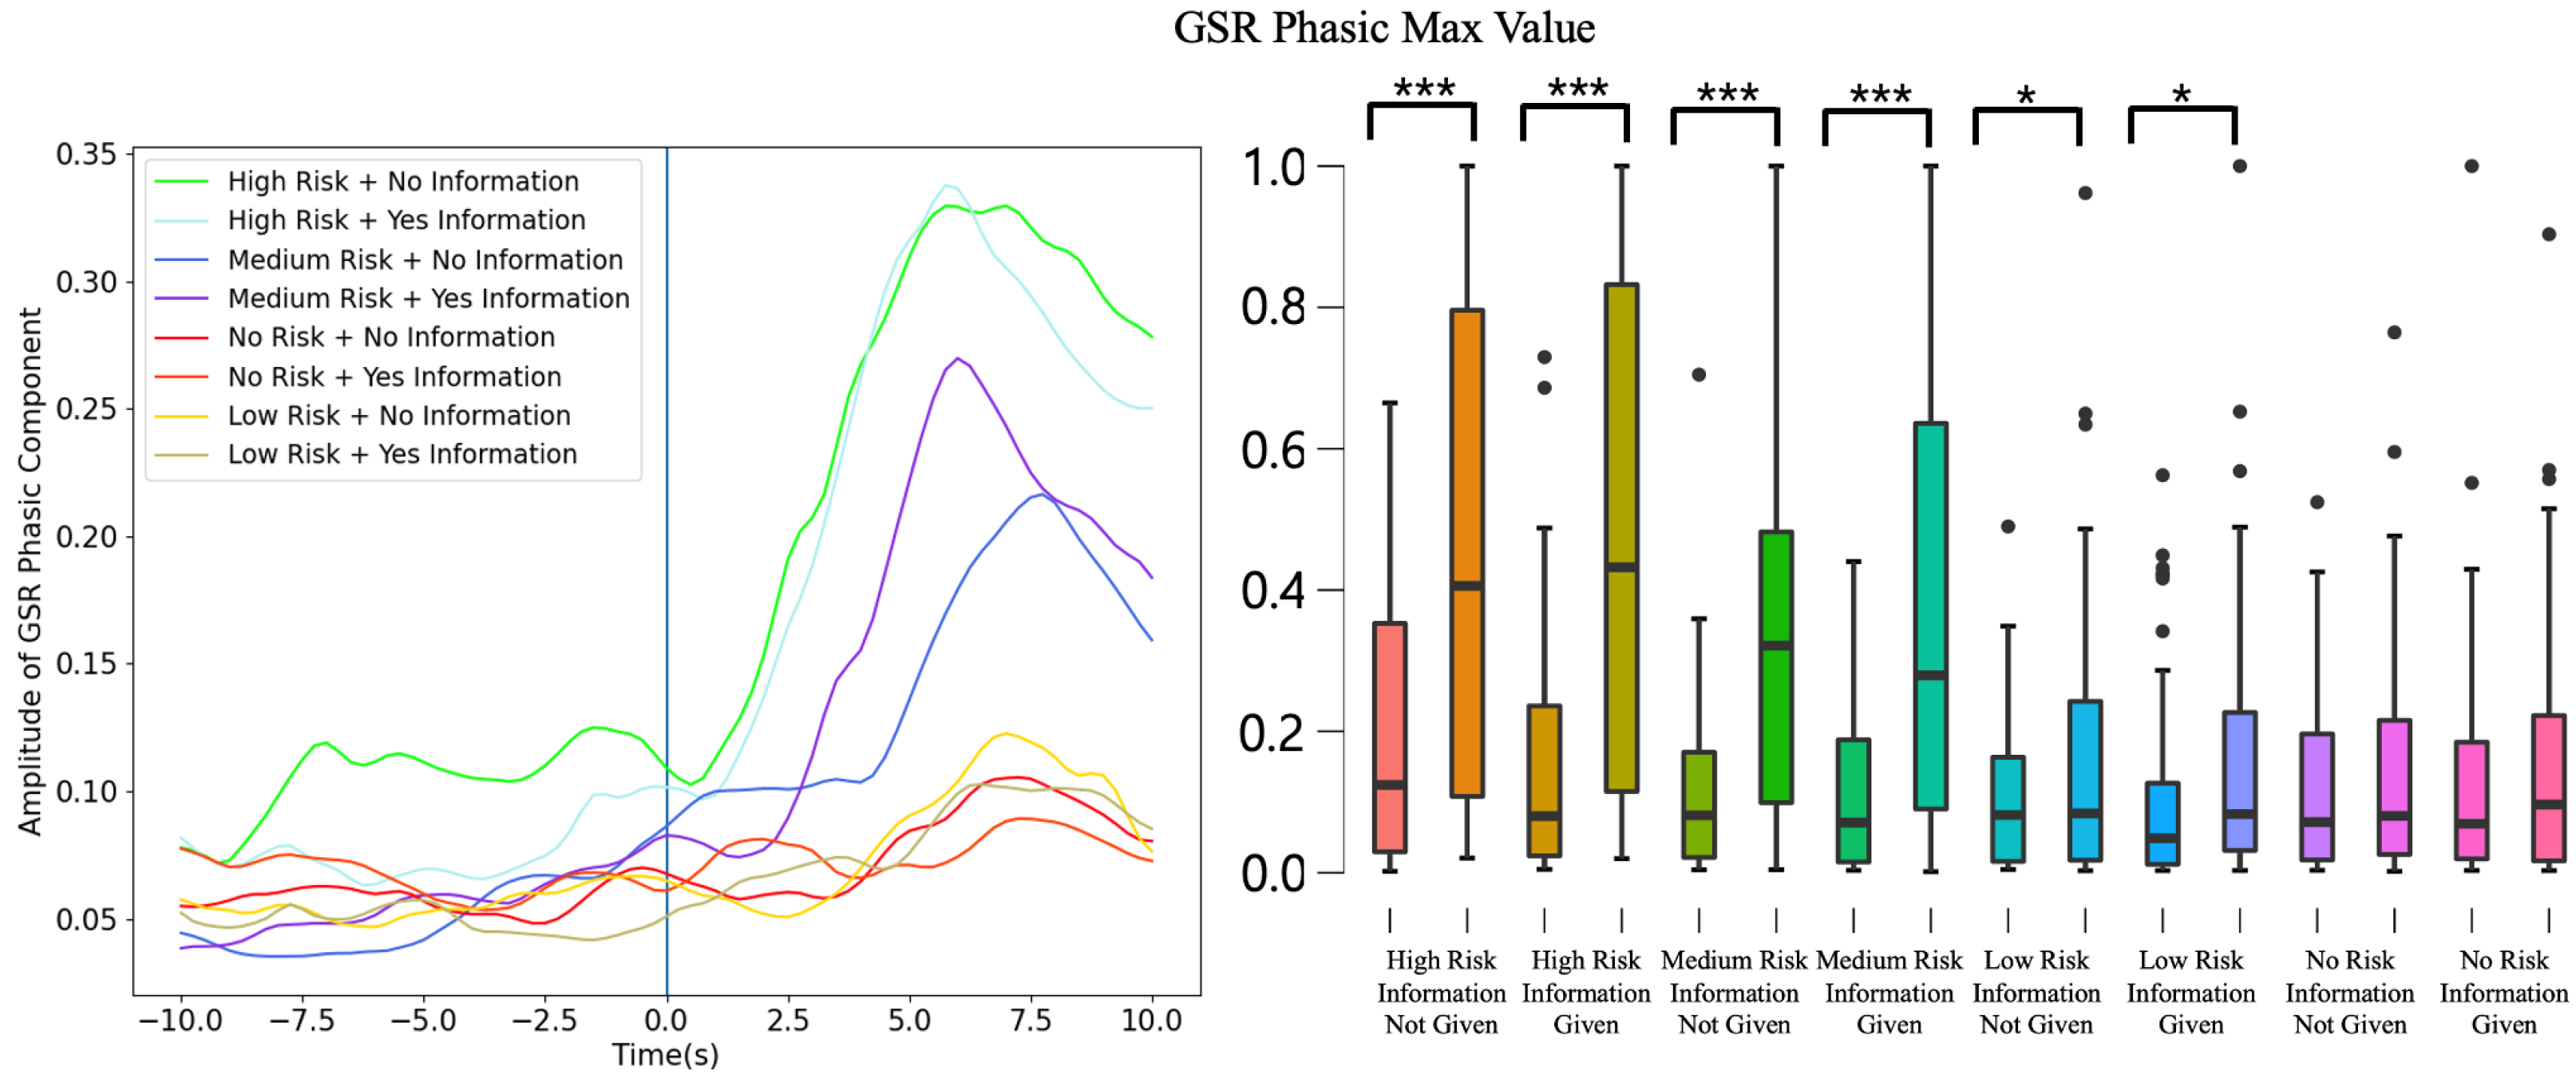
- The maximum value of GSR Phasic data in the 10 s before and after the event (GSR Phasic Max)
- The average value of GSR Phasic data in the 10 s before and after the event (GSR Phasic‘Mean)
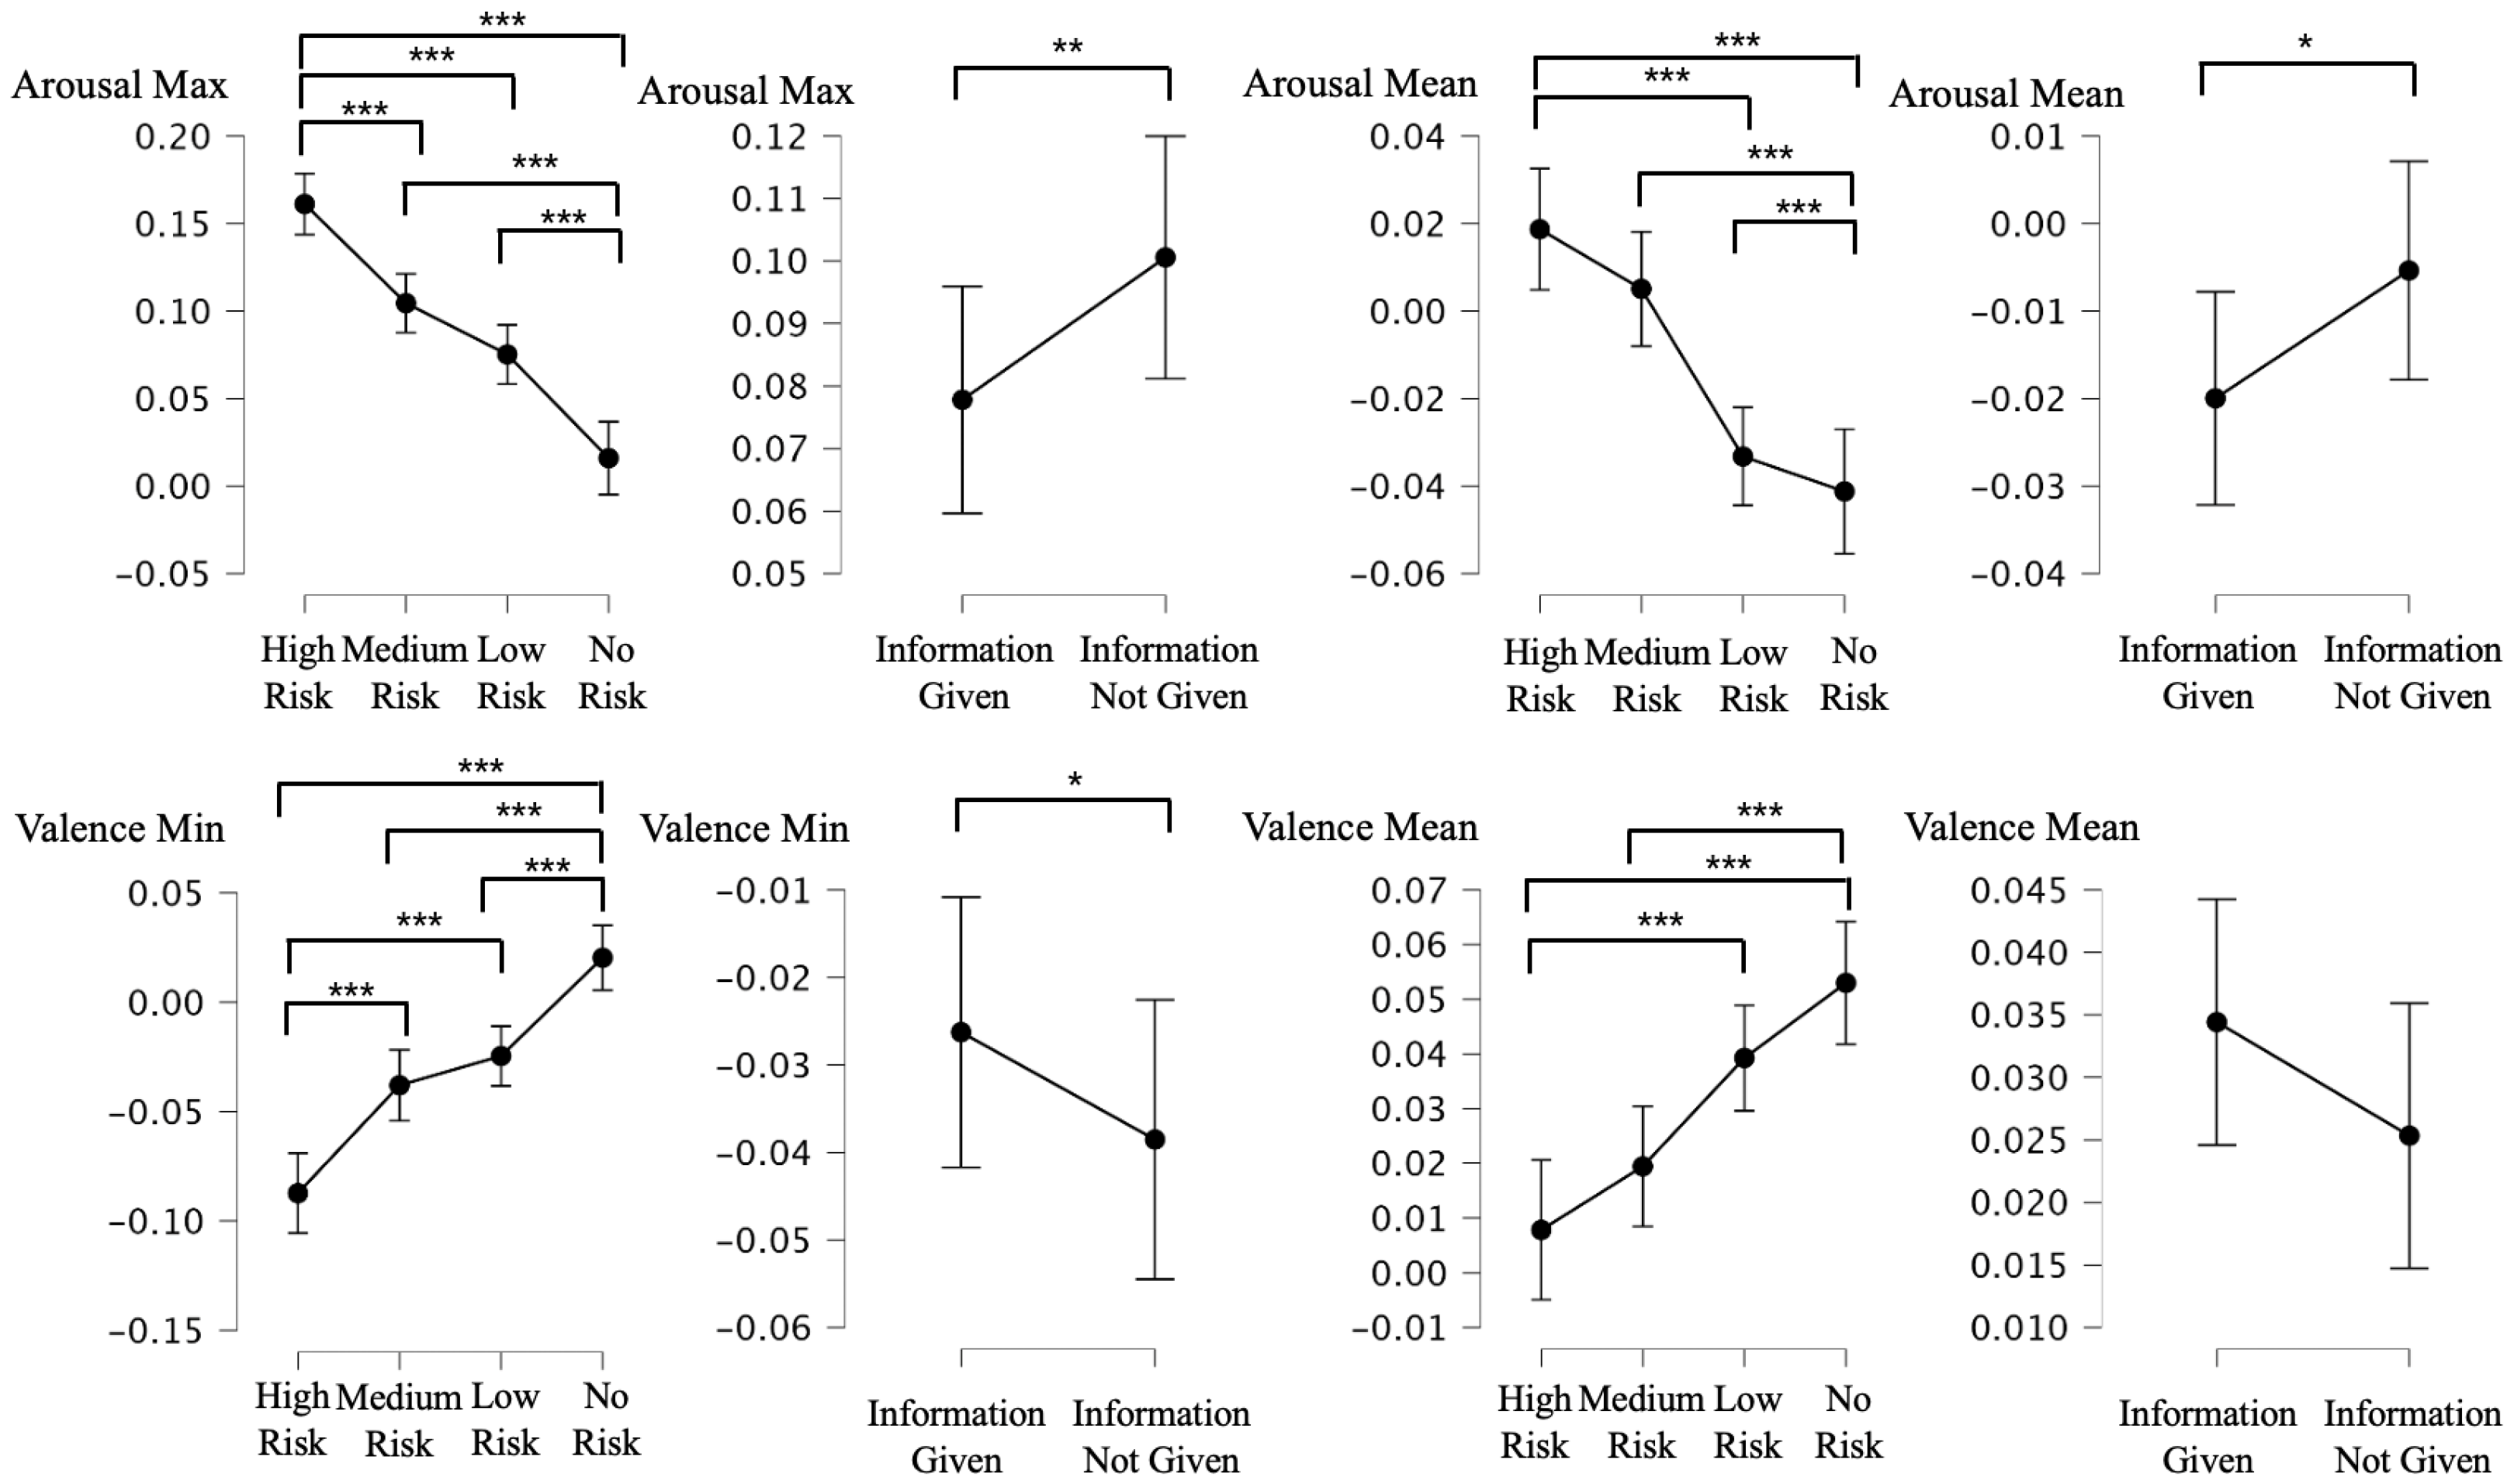
- The maximum value of arousal data in the 10 s before and after the event (Arousal Max)
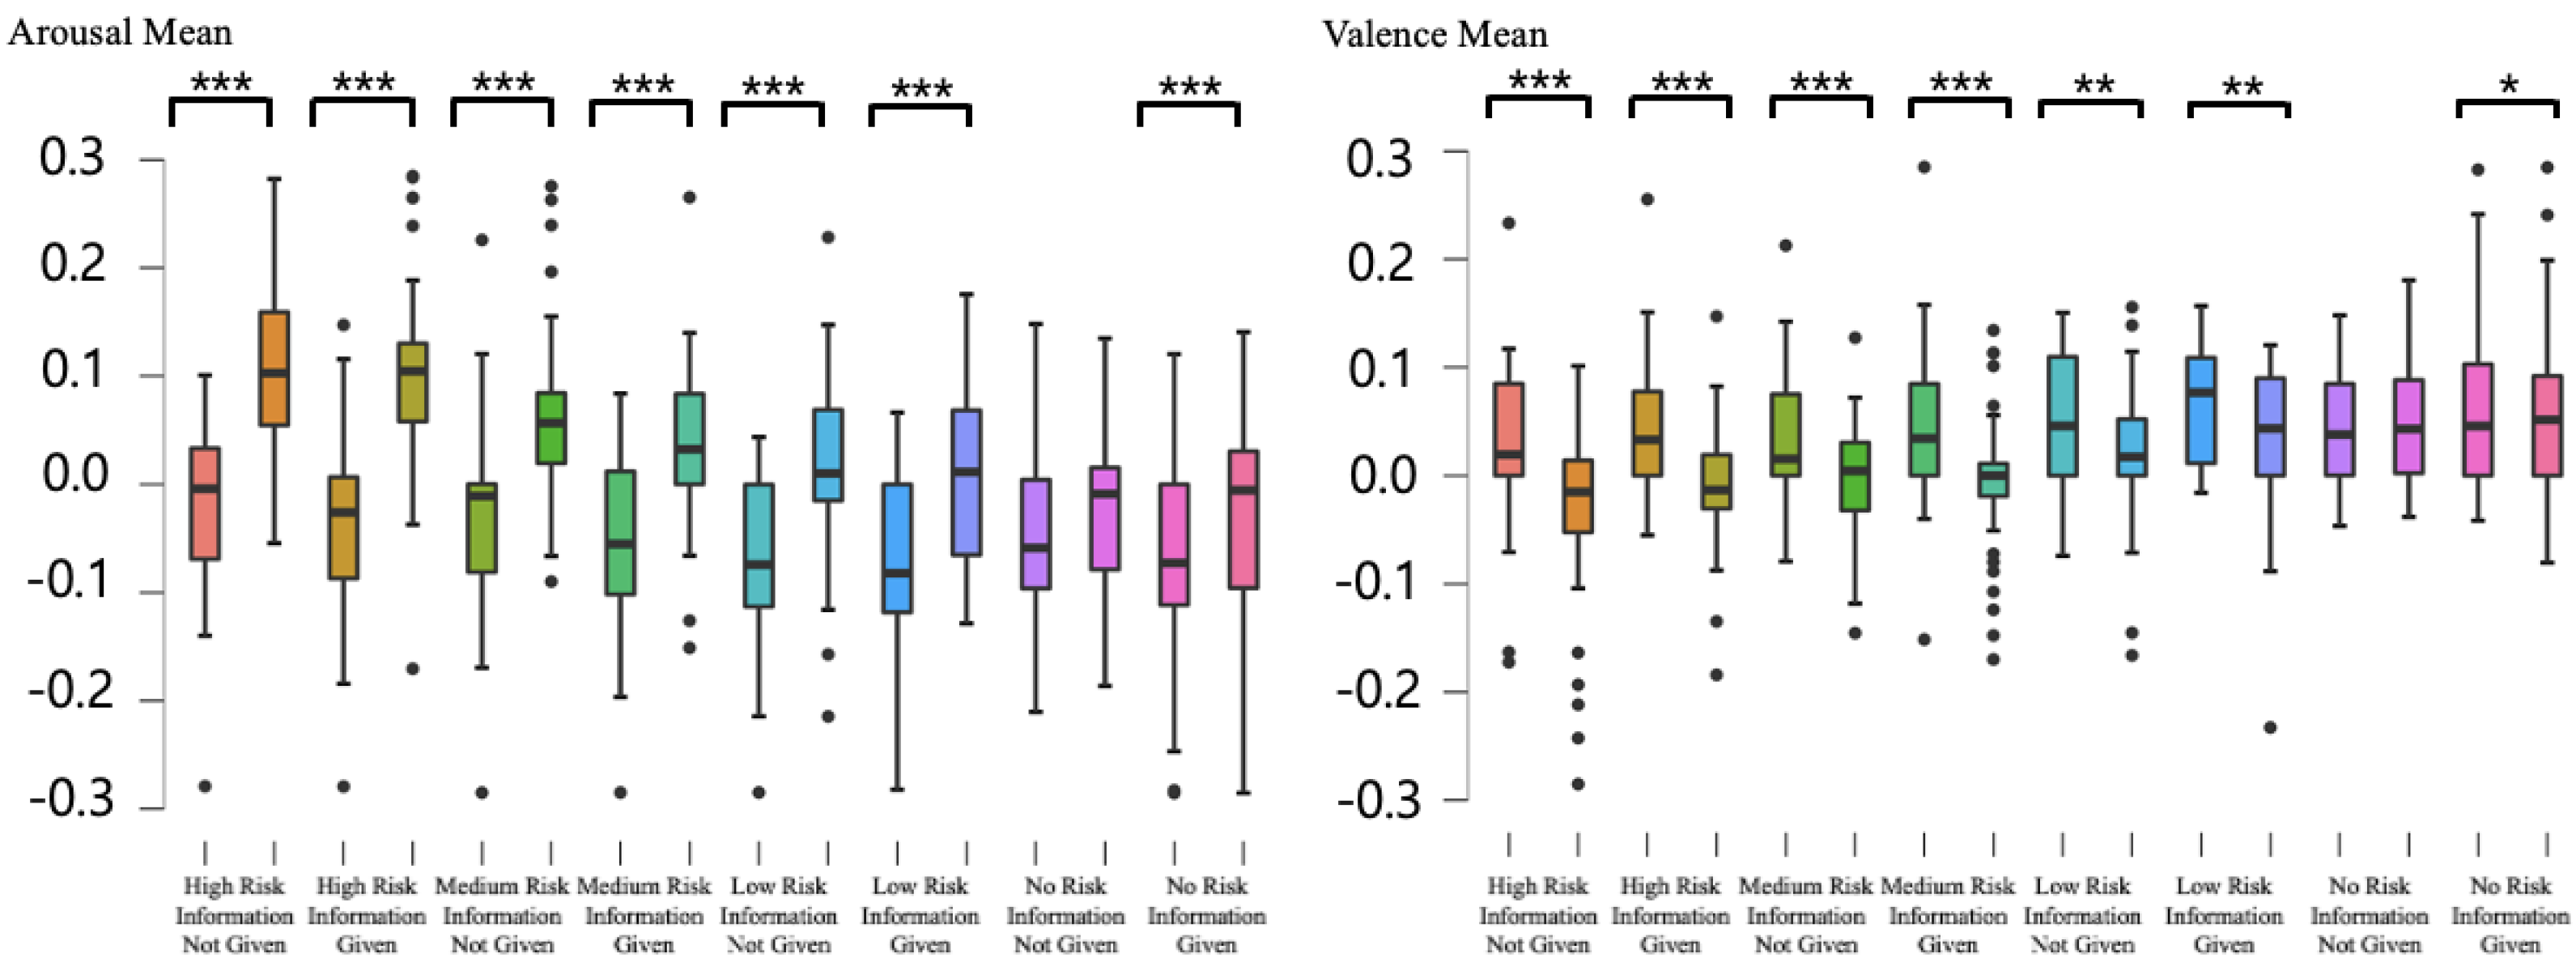
- The average value of arousal data in the 10 s before and after the event (Arousal Mean)
- The minimum value of arousal data in the 10 s before and after the event (Arousal Min)
- The maximum value of valence data in the 10 s before and after the event (Valence Max)
- The average value of arousal data in the 10 s before and after the event (Valence Mean)
- The minimum value of valence data in the 10 s before and after the event (Valence Min)
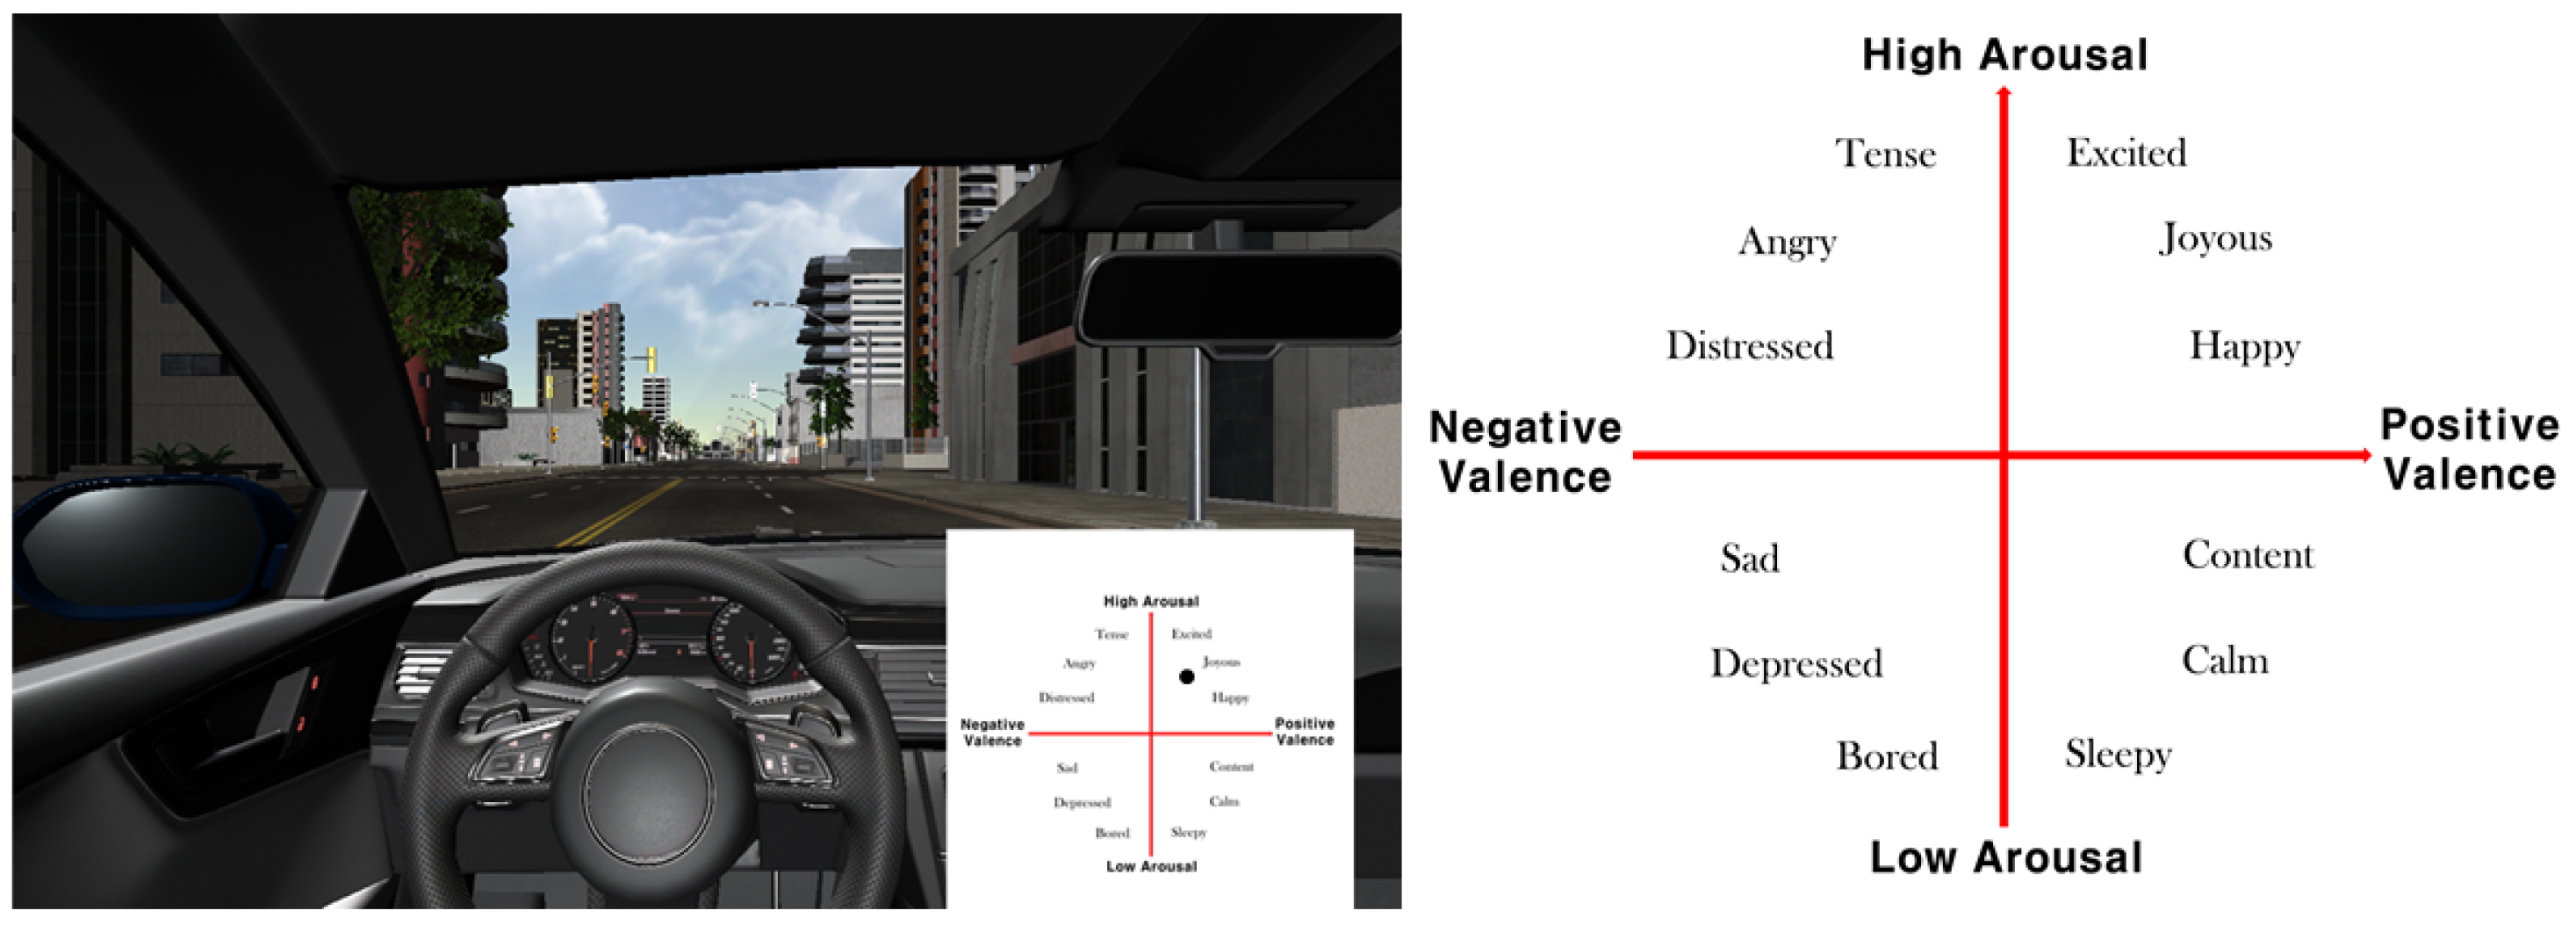
3.2.2. Qualitative Measurement
3.2.3. Statistical Analysis
4. Results
4.1. GSR Analysis Data
4.2. Self-Reported Valence and Arousal Data
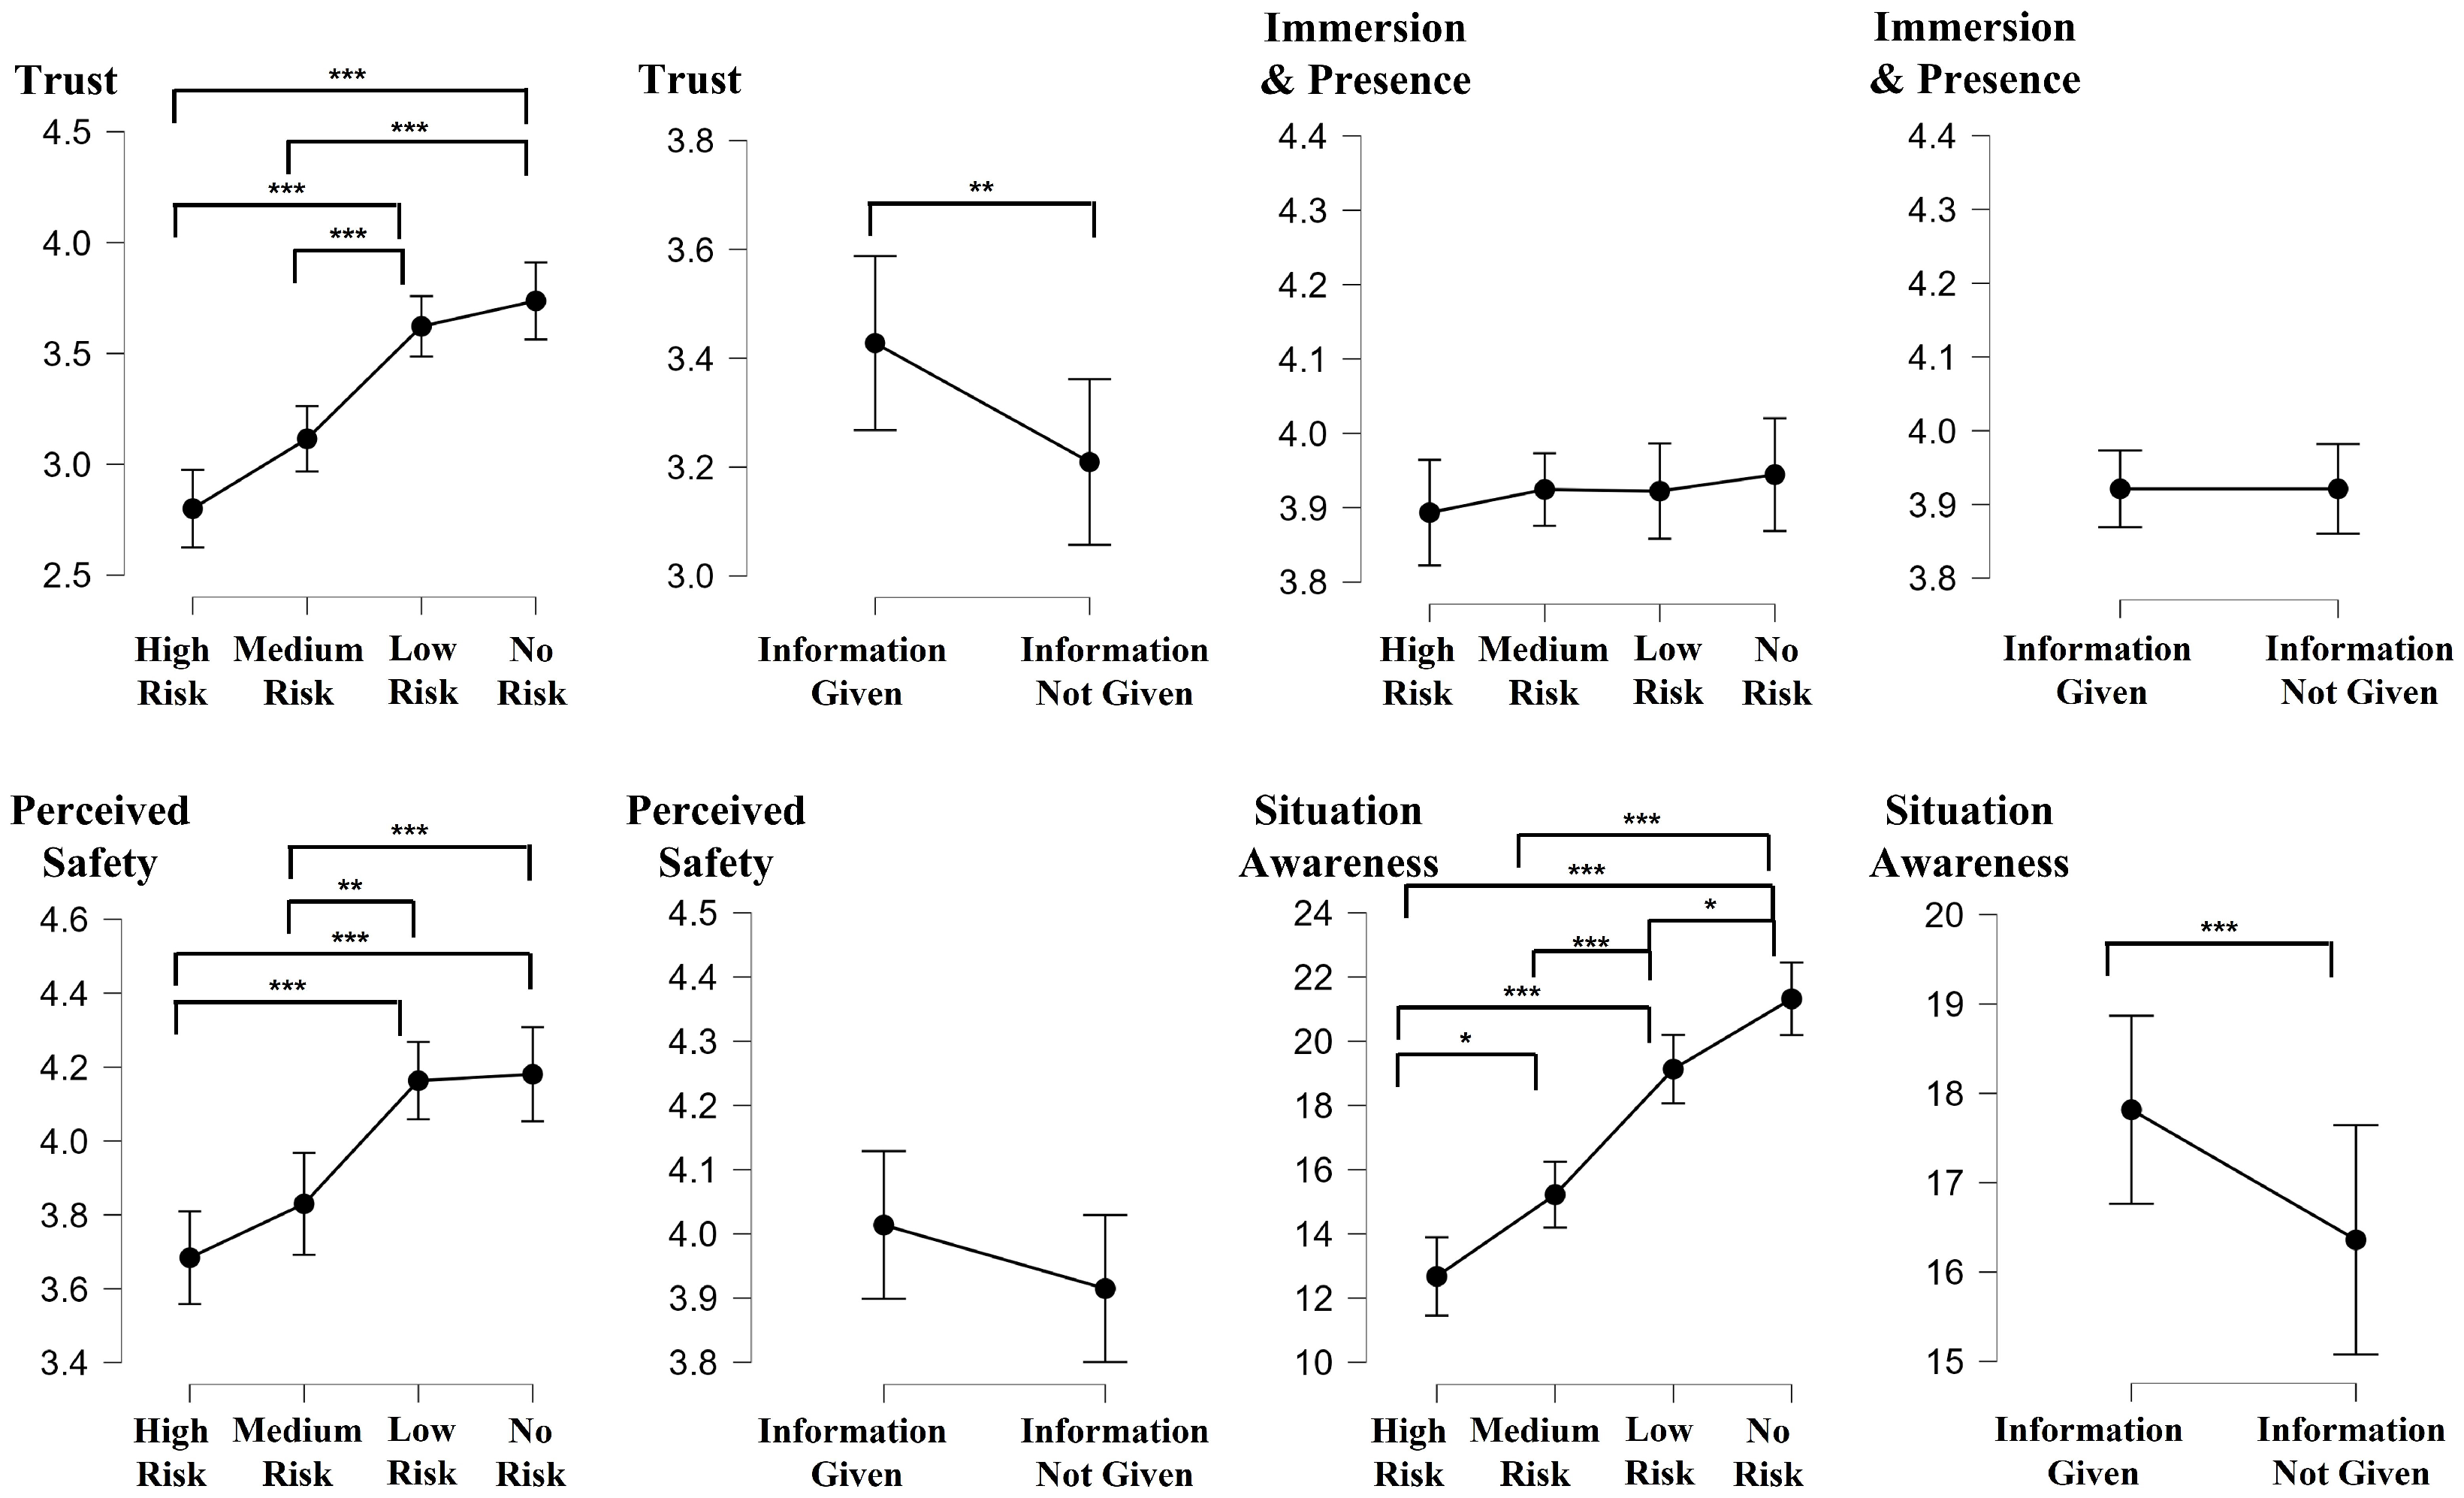
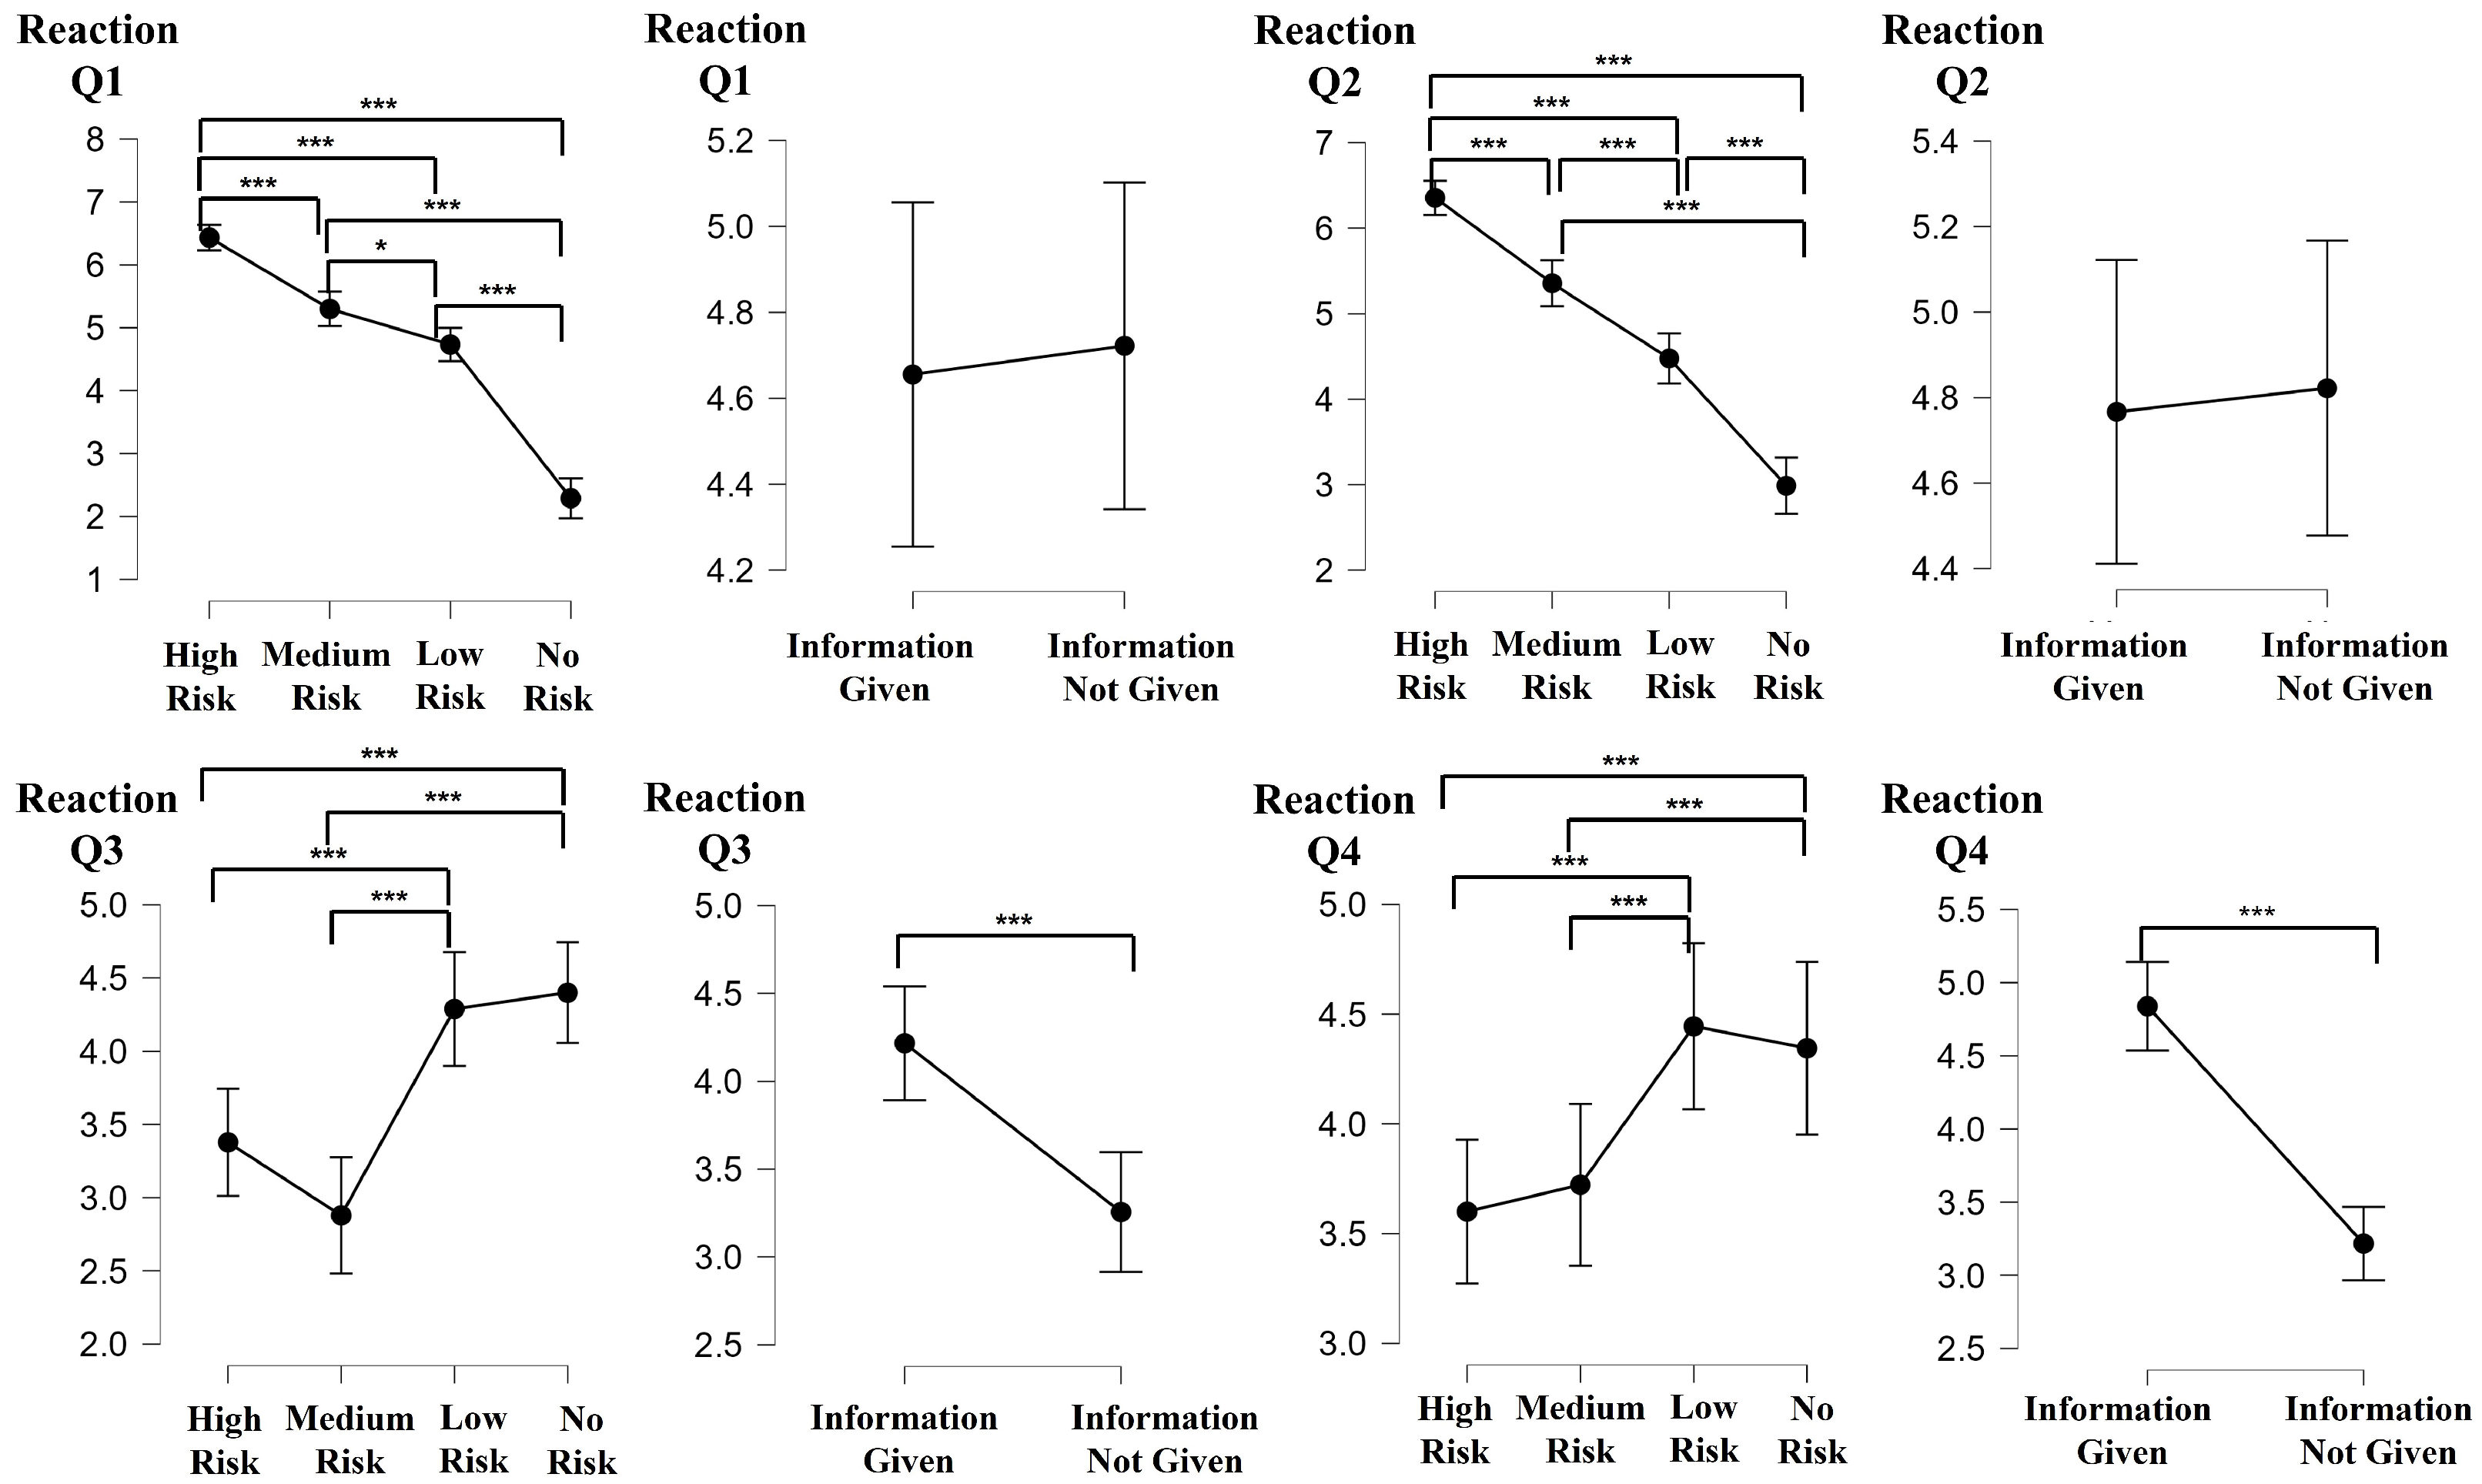
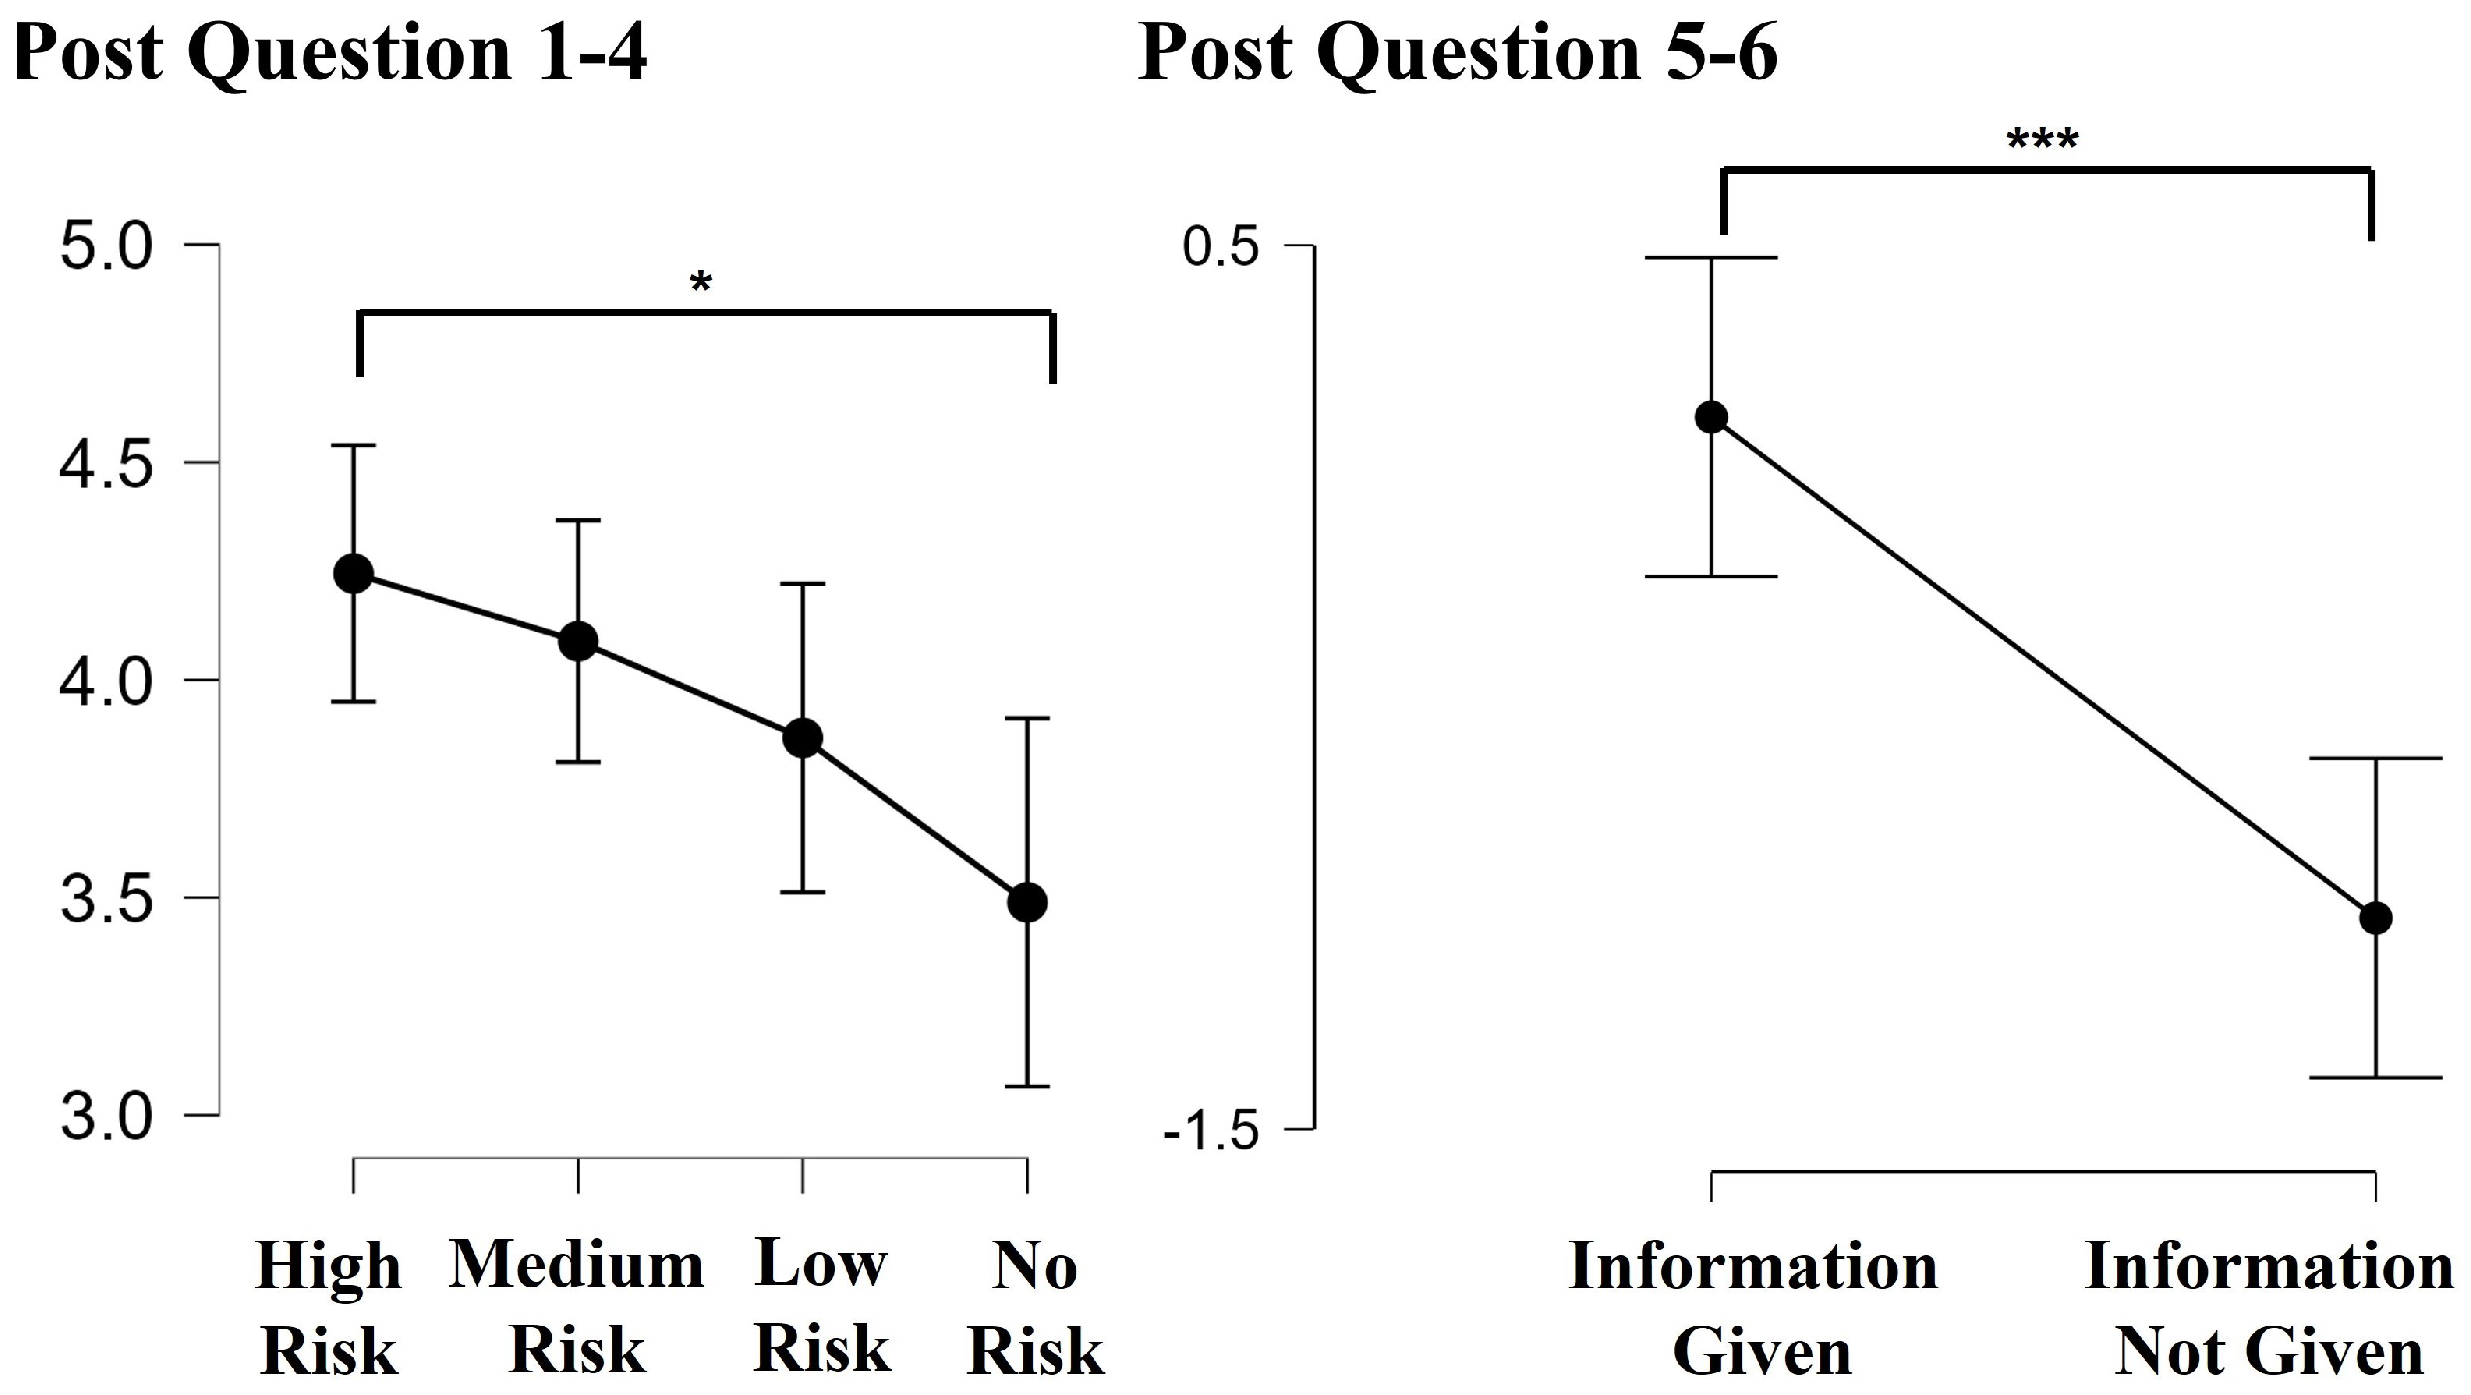
4.3. Analysis of the Questionnaire Data
5. Discussion
5.1. Risk Simulation Design
5.2. The Effect of Risk Level
5.3. The Effect of Information Provision
6. Limitations and Future Works
6.1. Limitations
6.2. Future Works
7. Conclusions
Author Contributions
Funding
Institutional Review Board Statement
Informed Consent Statement
Data Availability Statement
Conflicts of Interest
References
- Moody, J.; Bailey, N.; Zhao, J. Public perceptions of autonomous vehicle safety: An international comparison. Saf. Sci. 2020, 121, 634–650. [Google Scholar] [CrossRef]
- Yao, Q.; Tian, Y.; Wang, Q.; Wang, S. Control Strategies on Path Tracking for Autonomous Vehicle: State of the Art and Future Challenges. IEEE Access 2020, 8, 161211–161222. [Google Scholar] [CrossRef]
- Stilgoe, J. How can we know a self-driving car is safe? Ethics Inf. Technol. 2021, 23, 635–647. [Google Scholar] [CrossRef]
- Cysneiros, L.M.; Raffi, M.; do Prado Leite, J.C.S. Software transparency as a key requirement for self-driving cars. In Proceedings of the 2018 IEEE 26th international requirements engineering conference (RE), Banff, AB, Canada, 20–24 August 2018; pp. 382–387. [Google Scholar]
- Atakishiyev, S.; Salameh, M.; Yao, H.; Goebel, R. Explainable Artificial Intelligence for Autonomous Driving: A Comprehensive Overview and Field Guide for Future Research Directions. arXiv 2021, arXiv:2112.11561. [Google Scholar]
- Shen, Y.; Jiang, S.; Chen, Y.; Yang, E.; Jin, X.; Fan, Y.; Campbell, K.D. To explain or not to explain: A study on the necessity of explanations for autonomous vehicles. arXiv 2020, arXiv:2006.11684. [Google Scholar]
- Murugan, S.; Sampathkumar, A.; Kanaga Suba Raja, S.; Ramesh, S.; Manikandan, R.; Gupta, D. Autonomous Vehicle Assisted by Heads up Display (HUD) with Augmented Reality Based on Machine Learning Techniques. In Virtual and Augmented Reality for Automobile Industry: Innovation Vision and Applications; Springer: Berlin/Heidelberg, Germany, 2022; pp. 45–64. [Google Scholar]
- Colley, M.; Bräuner, C.; Lanzer, M.; Walch, M.; Baumann, M.; Rukzio, E. Effect of visualization of pedestrian intention recognition on trust and cognitive load. In Proceedings of the 12th International Conference on Automotive User Interfaces and Interactive Vehicular Applications, Virtual, 21–22 September 2020; pp. 181–191. [Google Scholar]
- Ajenaghughrure, I.B.; da Costa Sousa, S.C.; Lamas, D. Risk and Trust in artificial intelligence technologies: A case study of Autonomous Vehicles. In Proceedings of the 2020 13th International Conference on Human System Interaction (HSI), Tokyo, Japan, 6–8 June 2020; pp. 118–123. [Google Scholar]
- Morra, L.; Lamberti, F.; Pratticó, F.G.; La Rosa, S.; Montuschi, P. Building trust in autonomous vehicles: Role of virtual reality driving simulators in HMI design. IEEE Trans. Veh. Technol. 2019, 68, 9438–9450. [Google Scholar] [CrossRef]
- Sherman, W.R.; Craig, A.B. Understanding Virtual Reality: Interface, Application, And Design; Morgan Kaufmann: Burlington, CA, USA, 2018. [Google Scholar]
- Deb, S.; Strawderman, L.J.; Carruth, D.W. Investigating pedestrian suggestions for external features on fully autonomous vehicles: A virtual reality experiment. Transp. Res. Part Traffic Psychol. Behav. 2018, 59, 135–149. [Google Scholar] [CrossRef]
- Seo, H.J.; Park, G.M.; Son, M.; Hong, A.J. Establishment of virtual-reality-based safety education and training system for safety engagement. Educ. Sci. 2021, 11, 786. [Google Scholar] [CrossRef]
- Nascimento, A.M.; Queiroz, A.C.M.; Vismari, L.F.; Bailenson, J.N.; Cugnasca, P.S.; Junior, J.B.C.; de Almeida, J.R. The role of virtual reality in autonomous vehicles’ safety. In Proceedings of the 2019 IEEE International Conference on Artificial Intelligence and Virtual Reality (AIVR), San Diego, CA, USA, 9–11 December 2019; pp. 50–507. [Google Scholar]
- Colley, M.; Walch, M.; Rukzio, E. For a better (simulated) world: Considerations for VR in external communication research. In Proceedings of the 11th International Conference on Automotive User Interfaces and Interactive Vehicular Applications: Adjunct Proceedings, Utrecht, The Netherlands, 21–25 September 2019; pp. 442–449. [Google Scholar]
- Tarnowski, P.; Kołodziej, M.; Majkowski, A.; Rak, R.J. Combined analysis of GSR and EEG signals for emotion recognition. In Proceedings of the 2018 International Interdisciplinary PhD Workshop (IIPhDW), Swinoujscie, Poland, 9–12 May 2018; pp. 137–141. [Google Scholar]
- Raheel, A.; Majid, M.; Anwar, S.M. Dear-mulsemedia: Dataset for emotion analysis and recognition in response to multiple sensorial media. Inf. Fusion 2021, 65, 37–49. [Google Scholar] [CrossRef]
- PS-3TM-LP550. 2022. Available online: https://motionsystems.eu/product/motion-platforms/ps-3tm-lp550/ (accessed on 5 January 2023).
- Benedek, M.; Kaernbach, C. A continuous measure of phasic electrodermal activity. J. Neurosci. Methods 2010, 190, 80–91. [Google Scholar] [CrossRef]
- Valenza, G.; Lanata, A.; Scilingo, E.P. The role of nonlinear dynamics in affective valence and arousal recognition. IEEE Trans. Affect. Comput. 2011, 3, 237–249. [Google Scholar] [CrossRef]
- Choi, J.K.; Ji, Y.G. Investigating the importance of trust on adopting an autonomous vehicle. Int. J.-Hum.-Comput. Interact. 2015, 31, 692–702. [Google Scholar] [CrossRef]
- Hewitt, C.; Politis, I.; Amanatidis, T.; Sarkar, A. Assessing public perception of self-driving cars: The autonomous vehicle acceptance model. In Proceedings of the 24th International Conference on Intelligent User Interfaces, Marina del Ray, CA, USA, 17–20 March 2019; pp. 518–527. [Google Scholar]
- Kalawsky, R.S. VRUSE—A computerised diagnostic tool: For usability evaluation of virtual/synthetic environment systems. Appl. Ergon. 1999, 30, 11–25. [Google Scholar] [CrossRef] [PubMed]
- Salmon, P.M.; Stanton, N.A.; Walker, G.H.; Jenkins, D.; Ladva, D.; Rafferty, L.; Young, M. Measuring Situation Awareness in complex systems: Comparison of measures study. Int. J. Ind. Ergon. 2009, 39, 490–500. [Google Scholar] [CrossRef]
- Cosoli, G.; Poli, A.; Scalise, L.; Spinsante, S. Measurement of multimodal physiological signals for stimulation detection by wearable devices. Measurement 2021, 184, 109966. [Google Scholar] [CrossRef]
- Huff, E.W., Jr.; Day Grady, S.; Brinnkley, J. Tell Me What I Need To Know: Consumers’ Desire for Information Transparency in Self-Driving Vehicles. In Proceedings of the Human Factors and Ergonomics Society Annual Meeting, Baltimore, MD, USA, 25–28 October 2021; SAGE Publications Sage CA: Los Angeles, CA, USA, 2021; Volume 65, pp. 327–331. [Google Scholar]
- Petersen, L.; Robert, L.; Yang, X.J.; Tilbury, D.M. Situational awareness, drivers trust in automated driving systems and secondary task performance. arXiv 2019, arXiv:1903.05251. [Google Scholar]
- Canedo, D.; Neves, A.J. Facial expression recognition using computer vision: A systematic review. Appl. Sci. 2019, 9, 4678. [Google Scholar] [CrossRef]
- Li, J.; Jin, K.; Zhou, D.; Kubota, N.; Ju, Z. Attention mechanism-based CNN for facial expression recognition. Neurocomputing 2020, 411, 340–350. [Google Scholar] [CrossRef]
- Wang, K.; Peng, X.; Yang, J.; Meng, D.; Qiao, Y. Region attention networks for pose and occlusion robust facial expression recognition. IEEE Trans. Image Process. 2020, 29, 4057–4069. [Google Scholar] [CrossRef]
- Domínguez-Jiménez, J.A.; Campo-Landines, K.C.; Martínez-Santos, J.C.; Delahoz, E.J.; Contreras-Ortiz, S.H. A machine learning model for emotion recognition from physiological signals. Biomed. Signal Process. Control. 2020, 55, 101646. [Google Scholar] [CrossRef]
- Dar, M.N.; Akram, M.U.; Khawaja, S.G.; Pujari, A.N. CNN and LSTM-based emotion charting using physiological signals. Sensors 2020, 20, 4551. [Google Scholar] [CrossRef] [PubMed]
- Gupta, K.; Lazarevic, J.; Pai, Y.S.; Billinghurst, M. Affectivelyvr: Towards vr personalized emotion recognition. In Proceedings of the 26th ACM Symposium on Virtual Reality Software and Technology, Virtual, 1–4 November 2020; pp. 1–3. [Google Scholar]
- Zeng, H.; Wang, X.; Wu, A.; Wang, Y.; Li, Q.; Endert, A.; Qu, H. EmoCo: Visual analysis of emotion coherence in presentation videos. IEEE Trans. Vis. Comput. Graph. 2019, 26, 927–937. [Google Scholar] [CrossRef] [PubMed]
- Wei, Z.; Zhang, J.; Lin, Z.; Lee, J.Y.; Balasubramanian, N.; Hoai, M.; Samaras, D. Learning visual emotion representations from web data. In Proceedings of the IEEE/CVF Conference on Computer Vision and Pattern Recognition, Seattle, WA, USA, 13–19 June 2020; pp. 13106–13115. [Google Scholar]


| Component | Item | Questionnaire |
|---|---|---|
| 1 | It may be on an autonomous vehicle | |
| Trust | 2 | Autonomous vehicles are reliable |
| 3 | Overall, I trust autonomous vehicles. | |
| Perceived Safety | 4 | I felt it would be dangerous to use an autonomous vehicle |
| 5 | I felt safe while using the vehicle | |
| 6 | I believe in this vehicle |
| Item | Questionnaire |
|---|---|
| 1 | I felt a sense of being immersed in the virtual environment |
| 2 | I did not need to feel immersed in the virtual environment to complete my task |
| 3 | I had a sense of presence (i.e., being there) |
| 4 | The quality of the image reduced my feeling of presence |
| 5 | I thought that the field of view enhanced my sense of presence |
| 6 | The display resolution reduced my sense of immersion |
| 7 | I felt isolated and not part of the virtual environment |
| 8 | I had a good sense of scale in the virtual environment |
| 9 | I often did not know where I was in the virtual environment |
| 10 | Overall I would rate my sense of presence as: very satisfactory, satisfactory, neutral, unsatisfactory or very unsatisfactory |
| Item | Questionnaire |
|---|---|
| 1 | How changeable is the situation? |
| 2 | How complicated is the situation? |
| 3 | How many variables are changing within the situation? |
| 4 | How aroused are you in the situation? |
| 5 | How much are you concentrating on the situation? |
| 6 | How much is your attention divided in the situation? |
| 7 | How much mental capacity do you have to spare in the situation? |
| 8 | How much information have you gained about the situation? |
| 9 | How familiar are you with the situation? |
| Item | Questionnaire |
|---|---|
| 1 | The situation was dangerous |
| 2 | The event took me by surprise |
| 3 | I was able to perceive the potential danger before it affected the vehicle’s performance |
| 4 | The interface provided me useful information to foresee the event |
| Item | Questionnaire |
|---|---|
| 1 | In a driving situation without any risk (a scenario in which no accident occurred), |
| a vehicle in which information was provided on HUD was felt to be safer. | |
| 2 | In a low-risk driving situation (sudden stop by a pedestrian), |
| a vehicle in which information was provided on HUD was felt to be safer. | |
| 3 | In a medium-risk driving situation (direct weak impact by a car coming from behind), |
| a vehicle in which information was provided on HUD was felt to be safer. | |
| 4 | In a high-risk driving situation (serious car accident), |
| a vehicle in which information was provided on HUD was felt to be safer. | |
| 5 | In the presence of AR information, |
| the trust in autonomous vehicle increase as the risk level of the scenario increased. | |
| 6 | In the absence of AR information, |
| the trust in autonomous vehicle increase as the risk level of the scenario increased. |
Disclaimer/Publisher’s Note: The statements, opinions and data contained in all publications are solely those of the individual author(s) and contributor(s) and not of MDPI and/or the editor(s). MDPI and/or the editor(s) disclaim responsibility for any injury to people or property resulting from any ideas, methods, instructions or products referred to in the content. |
© 2023 by the authors. Licensee MDPI, Basel, Switzerland. This article is an open access article distributed under the terms and conditions of the Creative Commons Attribution (CC BY) license (https://creativecommons.org/licenses/by/4.0/).
Share and Cite
Kim, S.; Oh, J.; Seong, M.; Jeon, E.; Moon, Y.-K.; Kim, S. Assessing the Impact of AR HUDs and Risk Level on User Experience in Self-Driving Cars: Results from a Realistic Driving Simulation. Appl. Sci. 2023, 13, 4952. https://doi.org/10.3390/app13084952
Kim S, Oh J, Seong M, Jeon E, Moon Y-K, Kim S. Assessing the Impact of AR HUDs and Risk Level on User Experience in Self-Driving Cars: Results from a Realistic Driving Simulation. Applied Sciences. 2023; 13(8):4952. https://doi.org/10.3390/app13084952
Chicago/Turabian StyleKim, Seungju, Jungseok Oh, Minwoo Seong, Eunki Jeon, Yeon-Kug Moon, and Seungjun Kim. 2023. "Assessing the Impact of AR HUDs and Risk Level on User Experience in Self-Driving Cars: Results from a Realistic Driving Simulation" Applied Sciences 13, no. 8: 4952. https://doi.org/10.3390/app13084952
APA StyleKim, S., Oh, J., Seong, M., Jeon, E., Moon, Y.-K., & Kim, S. (2023). Assessing the Impact of AR HUDs and Risk Level on User Experience in Self-Driving Cars: Results from a Realistic Driving Simulation. Applied Sciences, 13(8), 4952. https://doi.org/10.3390/app13084952