Abstract
This study discussed the effect of oxygen impurity in the inlet gas of a nitrogen atmospheric pressure plasma jet (APPJ). A numerical model that takes into account the fluid dynamics, heat transfer, mass transfer, diffusion, and chemical reactions was developed to simulate the nitrogen APPJ. Further, a DC nitrogen APPJ experiment was performed to verify the plasma temperature characteristics on the treated surface. The plasma temperature decreased with an increase in the oxygen impurity. Moreover, the oxygen impurity influenced the related excited and neutral species. Specifically, with added oxygen impurity, N-related species decreased whereas O- and NOx-related species increased. Because the excited state species constitutes the most important reactant in APPJ treatment, this study could serve as a reference for the adjustment of a nitrogen APPJ.
1. Introduction
Atmospheric pressure plasma jets (APPJs) are inexpensive to produce because they do not require vacuum equipment [1,2,3]. Therefore, they are considered promising for plasma treatment applications in material surface treatment [4,5,6,7] and biomedicine [8,9,10,11]. The DC pulse nitrogen APPJ with a quartz tube discussed in this paper was proved to improve the power conversion efficiency of Perovskite solar cells better and within a shorter treatment time compared with DBD plasma and UV ozone treatment [6]. However, the amount of excited species on the treated surface cannot easily be evaluated through experiments because of the limitations of measuring techniques.
Studies have simulated [12,13] APPJ propagation in a transient state and used models to calculate the electronic and magnetic properties and chemical reactions. As a result, streamer and electric field propagation characteristics have been obtained. To improve mass transfer in the fluid flow downstream, combinations of laminar [14], large-eddy simulation (LES) [15], and k-ε and k-ω turbulent models [16,17] in commercial computational fluid dynamics (CFD) software or user-defined code [18,19,20] have been used.
Some studies have experimentally investigated the impact of adding oxygen impurity to the inlet gas used for the APPJ. For example, Asghar and Galaly [21] added oxygen (0.25%, 0.50%, 1%, and 1.5%) to an argon (Ar) APPJ and found that the oxygen content reduced the plasma temperature as well as the length and intensity of the emission spectra at the nozzle outlet and in the downstream, while oxygen-related species (e.g., O, OH, and NO) increased. Similarly, Komin and Pelipasov [22] mixed 0.1–1.2% O2 in nitrogen (N2) microwave-induced plasma (MIP) and found that increasing oxygen content in the inlet mixture reduced the temperature, electric density, and N2, and N2 ion species and increased the NO and OH species. Krumpolec et al. [23] utilized ambient air, nitrogen, a hydrogen–nitrogen mixture, and hydrogen as plasma inlet gas, and this research emphasized that the thermal effect of different inlet gas would affect the selective etching performance.
Tochikubo et al. [24] performed He dielectric barrier discharge (DBD) simulations and found that as the oxygen content in the inlet mixture was increased from 7.5% to 15%, and O atoms increased. Cheng [25] performed He DBD simulations and found that as the oxygen content in the inlet mixture was increased from 0.003% to 0.1%, the electronic density of the plasma and the nitrogen second positive system (SPS) excitation decreased. Other researchers studied humid air as an inlet gas impurity [26] and found that it increased OH in the downstream [27,28,29,30].
In this study, we simulated a nitrogen DC pulse APPJ with a quartz tube design [6,7] by using an axisymmetric model that takes into account the fluid dynamics, heat transfer, mass diffusion, and species transfer equations. We used the steady-state assumption because we focused on the treated surface downstream. We added different amounts of oxygen impurities to the nitrogen gas source and investigated the heat and species in the downstream above the substrate.
2. Materials and Methods
A nitrogen DC pulse APPJ with a quartz tube design was simulated using COMSOL Multiphysics 5.3a, in which finite element methods were applied, as illustrated in Figure 1, where ADLN is the nozzle of the plasma source, MRSQ is the quartz tube, and FGWV is the working plate. The inlet gas comes from AH, meets the electron and heat sources at BCJI, and spouts out from the nozzle DK. Then, the plasma gas meets the working plate (FV), at which the treated substrate is usually placed, passes the gap (RT) under the quartz tube, and finally flows to the outside air (NabUV). The details of other materials and applied calculations are shown in Table 1.
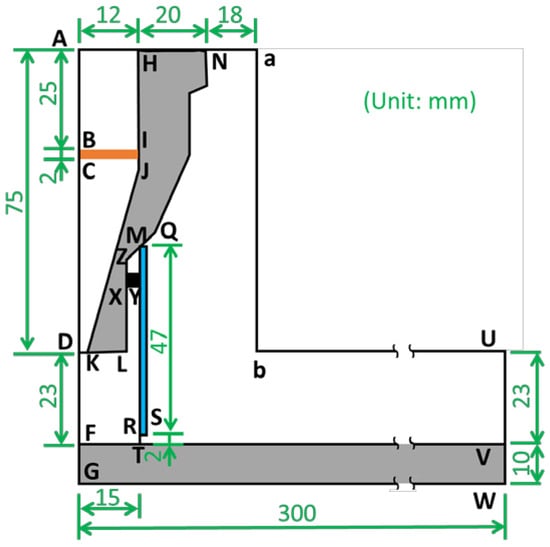
Figure 1.
Scheme of the computing model for APPJ.

Table 1.
Setting of the computing model domains.
In this study, the turbulence model, heat transfer equation, species transfer equation, and diluted species transfer equation were evaluated. The radius of the nozzle (DK) was 2 mm, the radius of the quartz tube (FT) was 15 mm, the height from nozzle to the substrate (DF) was 23 mm, and the gap from bottom of quartz tube to substrate (RT) was 2 mm. The height and width of the simulated domain were 108 mm and 300 mm, respectively. The mesh consisted of 78,000 elements with 45,000 vertices, where 66,000 triangle elements were for fluid and 120,000 quadratic elements were for solid. Additionally, the meshes of regions with high gradients were locally refined and those of the fluid–solid interfaces had boundary layer refinement. The boundary conditions are described in Table 2 with the inlet nitrogen source of 45 slm. The plasma generation regime (BCJI) was set as a heat source of 1500 W, electron density of 1013 cm−3, and electron temperature of 3 eV.
Table 2.
Boundary condition settings of the computing model.
The Reynolds-averaged Navier–Stokes shear stress transport (RANS SST) turbulence model was applied to the fluid, and the Navier–Stokes equation,
conservation equation,
and turbulence equations
were applied to solve the pressure (), velocity field (), turbulent kinetic energy (), specific dissipation rate (), and reciprocal wall distance (G), where is density, is unit matrix, is external force, is viscosity, is turbulent viscosity, and is the production term of turbulent kinetic energy. Other parameters could be found or calculated by the interpolation method in the default setting in the software.
The species transfer equations of N2, O2, and N2O are included in the diffusion model of Fick’s law, in which the mass and thermal diffusivity of different gas components are considered.
where is temperature, is thermal diffusion coefficient, is male fraction, is molar mass, is equivalent molar mass, and denotes the reactions which can be found in Table 3. is the equivalent diffusion coefficient and can be calculated from the diffusion coefficient () and the Knudsen diffusion coefficient ().
Therefore, the mixture density of air can be calculated using the ideal gas law depending on the molar mass and mass fraction of N2, O2, and N2O.
Table 3.
Reaction rates considered in this computing model.
The species considered in the diluted species transfer equation included N2(A), N2(B), N2(C), N2(a), N, O, O3, NO, NO2, and NO3.
Because the concentration () of these rare species is much lower than that of the surrounding air, the calculation of the diluted species and of N2, O2, and N2O should be separated to avoid a numerical round-off error. This transfer equation is based on the diffusion of these rare species and their reactions (); specifically, 87 reactions were considered, as described in Table 3.
The heat transfer model is valid for both the solid and fluid parts.
where is heat capacity at constant pressure and is thermal conductivity. The heat sources () included the heat source in the plasma-creating region (BI) and the reaction heats calculated by Hess’s law from the species and diluted species transfer equations.
The linear basis function was applied on the abovementioned equations by default in COMSOL Multiphysics 5.3a.
To overcome the convergence issue arising from the combination of complicated equations, iterative and auxiliary calculations are applied in this model. Figure 2 shows the iteration calculation of the computing sequences, where the turbulence model; heat transfer without reaction heats; and species transfer equations of N2, O2, and N2O are calculated first, and then the diluted species transfer equation and heat source are applied. In addition, auxiliary calculations are used in the diluted species transfer equation, where the reaction rates are multiplied by 0.001, 0.01, 0.1, and 1 to reach the real reaction rates. Consequently, the heat and species do not change dramatically, and the model remains stable. After several iterations, the solution convergence is evaluated.
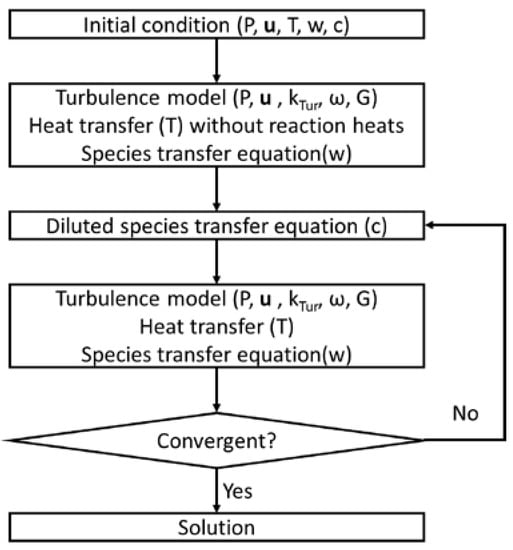
Figure 2.
Computing sequence diagram.
3. Results and Discussion
In this study, different amounts of oxygen impurity were added to the nitrogen gas source, with a mix of 10−4 O2, 10−3 O2, and 10−2 O2. Then, the temperature characteristics were discussed through comparisons with experimental data. Further, the individual species distribution on the surface below the quartz tube was determined.
3.1. Temperature Profile
3.1.1. Temperature Profile inside the Quartz Tube
Figure 3 shows the temperature contour of the inlet N2 with 10−3 O2. The temperature at the nozzle exit was approximately 700 °C, and that at the downstream surface was 500 °C. Because the quartz tube not only prevents excited species from reacting with outside air but also isolates the dissipated heat, the temperature inside the tube was approximately 500 °C.
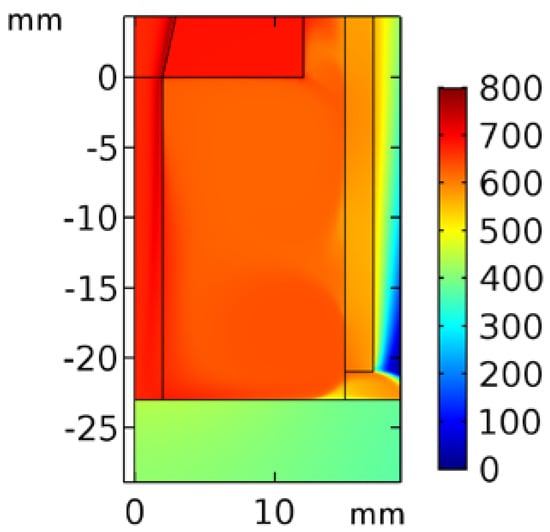
Figure 3.
Temperature contour of inlet N2 with 10−3 O2 in the quartz tube region.
3.1.2. Comparison with Experimental Data
To validate the simulated results, an experiment was performed with a nitrogen DC pulse APPJ with a quartz tube design [6,7] and the same dimensions and inlet gas setting (N2 with 10−3 O2) as those in the computing model, and the temperature was measured at the plasma equipment. In Figure 4, the inlet gas was supplied from the top of the nozzle exit and excited by electron and heat inside the nozzle. Then, the plasma flowed from the nozzle to the working plate inside the quartz tube, passed through the gap under the quartz tube, and finally mixed with outside air.
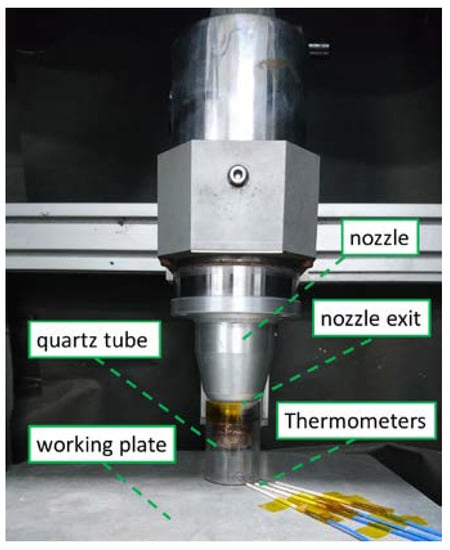
Figure 4.
Experimental measurement setup for temperature measurement.
The input voltage was 269 V, and the cycle time was 40 μs with 7 μs on. A K-type thermometer and NI9211 DAQ was used along with Labview data capture software for measuring the temperature. The typical and maximum errors for the K-type thermometer when used with the NI-9211, which account for gain errors, offset errors, differential and integral nonlinearity, quantization errors, noise errors, and isothermal errors, were in the range of 1–1.6 °C and 2–3 °C in the measured temperature range of 0–800 °C. The thermometers were placed on the surface at equal distances, as shown in Figure 4. One set of probes was directly exposed to the air to measure the plasma temperature, and silver glue was applied to another set of probes to obtain the treated surface temperature.
Then, the data on the computing model were divided into two parts: the temperature at FT in Figure 1 on the solid surface and the temperature 0.025 mm above the surface, which mimics the plasma thermal characteristic in air.
The simulated and experimental temperature measurement results were plotted using MATLAB R2022b, as shown in Figure 5. In the experiment, the temperature below the exit (r = 0 mm) was 643 °C in air and 500 °C on the surface, and these temperatures respectively decreased to 538 °C and 417 °C at a radius of 9 mm. However, the simulated temperature profiles were slightly lower than the experimental result below the exit and were slightly overestimated on the surface at a radius of 9 mm. This might be because of the error arising from model domain simplification. For instance, we ignored the heat capacities of some materials and assumed the downstream surface material (FGWV in Figure 1) to be limited to an only 300 mm radius plate even though the radius is approximately 100 cm in reality.
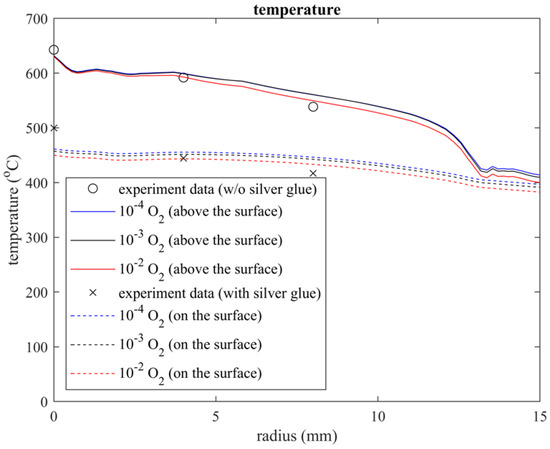
Figure 5.
Temperature profile above and on the surface under the quartz tube region, in which the substrate is treated by the plasma.
Both the simulated and experimental temperature profiles agreed with a previous experimental study when different impurities were added to the inlet gas [21,22]. The temperature of 10−2 O2 is slightly lower than that of 10−4 O2; this could be attributed to the endothermic reaction with abundant atomic O, O2, and O3 in the quartz tube. Thus, the temperature difference remained within 9 °C, and it could be neglected under the plasma working conditions.
Furthermore, the temperature plot of the simulation data above the surface exhibited a jump at approximately 12.77 mm, where a vortex separation point is also seen in Figure 3. This point could be considered a demarcation between the plasma jet and the incorporation of air from the gap under the quartz tube.
3.2. Species Distribution
To clarify the plasma characteristics, a line probe was set on the surface at FT in Figure 1 to simulate the substrate position that would be treated by the various species.
3.2.1. Distribution of Major Molecules (N2, O2)
Figure 6 shows the nitrogen and oxygen distribution on the surface at different radii with the given inlet gas impurities. Below the exit (r = 0 mm), the nitrogen concentration was around 85 mole/m3, and the oxygen concentrations with inlet gas conditions of 10−4 O2, 10−3 O2, and 10−2 O2 were 0.013 mole/m3, 0.085 mole/m3, and 0.76 mole/m3, respectively. At a distance from the center, the oxygen concentration increased because of the air intruding from the bottom of the quartz tube; at the same time, the nitrogen concentration decreased because nitrogen was oxidized to nitrogen oxide (NOx).
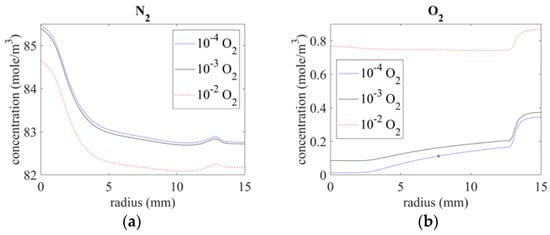
Figure 6.
Species distribution of (a) N2 and (b) O2 on the surface.
3.2.2. N-series Species Distribution (N2(A), N2(B), N2(C), N2(a), N)
The distribution of N-series excited state molecules on the surface is shown in Figure 7. The excited molecules created from the nozzle were clearly dissipated along the downstream. As shown in Figure 7a–e, the concentrations of N2(A), N2(B), N2(C), N2(a), and N were 10−7, 10−12, 10−14, 10−12, and 10−4 mole/m3 below the exit, and they decreased with increasing distance from the center.
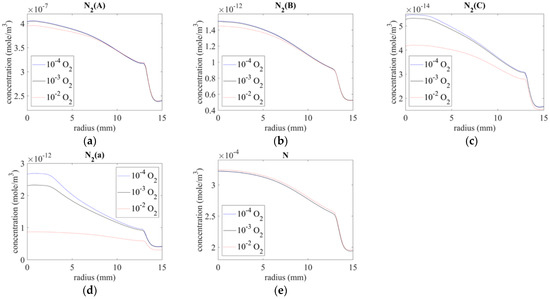
Figure 7.
Species distribution on the surface of (a) N2(A), (b) N2(B), (c) N2(C), (d) N2(a), and (e) N.
Further, the concentrations of N2(A), N2(B), N2(C), and N2(a) decreased with increasing oxygen at the inlet, possibly owing to the lower N2 concentration from the plasma source. By contrast, the concentration of N was only slightly higher for the case of 10−2 O2.
3.2.3. Distribution of O-Series and NOx Components (O, O3, N2O, NO, NO2, and NO3)
Figure 8 shows the concentration of the O-series and NOx components. The inlet gas impurities significantly influence these components. Because oxygen is one of the major reactants with these components, an increase in the amount of oxygen mixed with the inlet gas results in the production of a higher concentration of O-series and NOx from the nozzle.
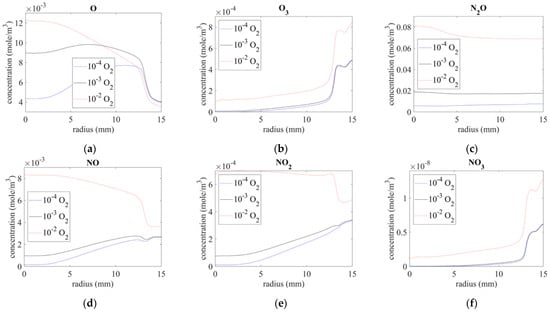
Figure 8.
Species distribution on surface of (a) O, (b) O3, (c) N2O, (d) NO, (e) NO2, and (f) NO3.
Atomic O is a highly active chemical, and it rapidly reaches a stable concentration at atmospheric pressure in combination with intruding surrounding air, as illustrated in Figure 8a. N-series excited components and N2 react with oxygen from the gap under the quartz tube in the downstream and produce O3, NO, NO2, and NO3. Therefore, O3 and NO3 increased by almost ten times below the exit, as shown in Figure 8b,f, respectively, and the same could be seen for NO and NO2 with impurities of 10−4 O2 and 10−3 O2, as shown in Figure 8d,e, respectively. An impurity of 10−2 O2 seemed to cause saturation for NO and NO2 such that the concentration decreased along the radius. By contrast, N2O was relatively stable and exhibited little variation when mixed with downstream air, as shown in Figure 8c.
4. Discussion & Conclusions
In this study, a simulated model that incorporated the fluid properties, heat transfer, and species transport characteristics was developed. The temperature and species performance on the treated surface were discussed under the addition of different amounts of oxygen impurity. We compared the experimental and simulated temperature profiles and obviously they fit well. Additionally, we found that the temperature slightly dropped when more oxygen was added, which agrees with previous experimental studies [21,22]. With regard to the species concentration, N-related species decreased whereas O- and NOx-related species increased when more oxygen impurities were added to the inlet nitrogen, and these results agree with previous studies [21,22]. The influence of the inlet gas impurity should be considered when the effect and uniformity of the excited species on the substrate could affect the product performance.
Author Contributions
Conceptualization, J.-Z.C.; methodology, J.-S.T.; software, J.-S.T.; validation, J.-S.T.; formal analysis, J.-S.T.; investigation, J.-S.T. and J.-Z.C.; resources, J.-Z.C.; data curation, J.-S.T.; writing—original draft preparation, J.-S.T.; writing—review and editing, J.-Z.C.; visualization, J.-S.T.; supervision, J.-Z.C.; project administration, J.-Z.C.; funding acquisition, J.-Z.C. All authors have read and agreed to the published version of the manuscript.
Funding
National Science and Technology Council in Taiwan (NSTC 111-2221-E-002-088-MY3 and NSTC 111-3116-F-002-005).
Institutional Review Board Statement
Not applicable.
Informed Consent Statement
Not applicable.
Data Availability Statement
Not applicable.
Acknowledgments
The authors would like to thank Chih-Hung Chen at the Graduate Institute of Applied Mechanics, National Taiwan University, for technical support with the CFD software; Jui-Hsuan Tsai at the Graduate Institute of Applied Mechanics, National Taiwan University, for assistance with the experimental measurement; and Cheng-Che Hsu at the Department of Chemical Engineering, National Taiwan University, for the fruitful discussions on this research. This work is supported by the National Science and Technology Council in Taiwan under grant nos. NSTC 111-2221-E-002-088-MY3 and NSTC 111-3116-F-002-005.
Conflicts of Interest
The authors declare no conflict of interest.
References
- Schutze, A.; Jeong, J.Y.; Babayan, S.E.; Jaeyoung, P.; Selwyn, G.S.; Hicks, R.F. The atmospheric-pressure plasma jet: A review and comparison to other plasma sources. IEEE Trans. Plasma Sci. 1998, 26, 1685–1694. [Google Scholar] [CrossRef]
- Tendero, C.; Tixier, C.; Tristant, P.; Desmaison, J.; Leprince, P. Atmospheric pressure plasmas: A review. Spectrochim Acta B 2006, 61, 2–30. [Google Scholar] [CrossRef]
- Winter, J.; Brandenburg, R.; Weltmann, K.D. Atmospheric pressure plasma jets: An overview of devices and new directions. Plasma Sources Sci. Technol. 2015, 24, 064001. [Google Scholar] [CrossRef]
- Yáñez-Pacios, A.; Martín-Martínez, J. Comparative Adhesion, Ageing Resistance, and Surface Properties of Wood Plastic Composite Treated with Low Pressure Plasma and Atmospheric Pressure Plasma Jet. Polymers 2018, 10, 643. [Google Scholar] [CrossRef] [PubMed]
- Kong, J.; Du, D.; Song, A.; Zhang, F.; Huang, W. Surface Physical and Chemical Modification of Pure Iron by Using Atmospheric Pressure Plasma Treatment. Materials 2020, 13, 4775. [Google Scholar] [CrossRef] [PubMed]
- Tsai, J.-H.; Cheng, I.C.; Hsu, C.-C.; Chen, J.-Z. DC-pulse atmospheric-pressure plasma jet and dielectric barrier discharge surface treatments on fluorine-doped tin oxide for perovskite solar cell application. J. Phys. D Appl. Phys. 2018, 51, 025502. [Google Scholar] [CrossRef]
- Cheng, P.-Y.; Lu, N.-H.; Lu, Y.-S.; Chen, C.-H.; Lee, Y.-L.; Chen, J.-Z. Surface Modification of FeCoNiCr Medium-Entropy Alloy (MEA) Using Octadecyltrichlorosilane and Atmospheric-Pressure Plasma Jet. Polymers 2020, 12, 788. [Google Scholar] [CrossRef]
- Stryczewska, H.D.; Boiko, O. Applications of Plasma Produced with Electrical Discharges in Gases for Agriculture and Biomedicine. Appl. Sci. 2022, 12, 4405. [Google Scholar] [CrossRef]
- Zhou, Y.; Yan, Y.; Shi, M.; Liu, Y. Effect of an Atmospheric Pressure Plasma Jet on the Structure and Physicochemical Properties of Waxy and Normal Maize Starch. Polymers 2018, 11, 8. [Google Scholar] [CrossRef]
- Cordaro, L.; De Masi, G.; Fassina, A.; Gareri, C.; Pimazzoni, A.; Desideri, D.; Indolfi, C.; Martines, E. The Role of Thermal Effects in Plasma Medical Applications: Biological and Calorimetric Analysis. Appl. Sci. 2019, 9, 5560. [Google Scholar] [CrossRef]
- Domonkos, M.; Tichá, P.; Trejbal, J.; Demo, P. Applications of Cold Atmospheric Pressure Plasma Technology in Medicine, Agriculture and Food Industry. Appl. Sci. 2021, 11, 4809. [Google Scholar] [CrossRef]
- Greb, A.; Niemi, K.; O’Connell, D.; Ennis, G.J.; Macgearailt, N.; Gans, T. Improved fluid simulations of radio-frequency plasmas using energy dependent ion mobilities. Phys. Plasmas 2013, 20, 053502. [Google Scholar] [CrossRef]
- Naidis, G.V.; Babaeva, N.Y. Modeling of streamer dynamics in helium plasma jets driven by modulated voltage pulses. Phys. Plasmas 2019, 26, 094501. [Google Scholar] [CrossRef]
- Tochikubo, F.; Shirai, N.; Uchida, S. Simulation of Atmospheric Pressure Direct Current Glow Discharge along a Miniature Helium Flow in Nitrogen. Appl. Phys. Express 2011, 4, 056001. [Google Scholar] [CrossRef]
- Logothetis, D.K.; Papadopoulos, P.K.; Svarnas, P.; Vafeas, P. Numerical simulation of the interaction between helium jet flow and an atmospheric-pressure “plasma jet”. Comput. Fluids 2016, 140, 11–18. [Google Scholar] [CrossRef]
- Passaras, D.N. Simulation of Atmospheric Pressure Plasma Jets with a Global Model. Master’s Thesis, National and Kapodistrian University of Athens, Zografou, Greece, 2016. [Google Scholar]
- Tsai, J.-H.; Hsu, C.-M.; Hsu, C.-C. Numerical Simulation of Downstream Kinetics of an Atmospheric Pressure Nitrogen Plasma Jet Using Laminar, Modified Laminar, and Turbulent Models. Plasma Chem. Plasma Process. 2013, 33, 1121–1135. [Google Scholar] [CrossRef]
- Lin, K.M.; Hu, M.H.; Hung, C.T.; Wu, J.S.; Hwang, F.N.; Chen, Y.S.; Cheng, G. A parallel hybrid numerical algorithm for simulating gas flow and gas discharge of an atmospheric-pressure plasma jet. Comput. Phys. Commun. 2012, 183, 2550–2560. [Google Scholar] [CrossRef]
- Kuzenov, V.V.; Ryzhkov, S.V.; Starostin, A.V. Pulsed Jets for Dense Plasma Generation in an External Magnetic Field. Russian Phys. J. 2020, 62, 2041–2045. [Google Scholar] [CrossRef]
- Kuzenov, V.V.; Ryzhkov, S.V. Evaluation of the possibility of ignition of a hydrogen-oxygen mixture by erosive flame of the impulse laser. Laser Phys. 2019, 29, 096001. [Google Scholar] [CrossRef]
- Asghar, A.H.; Galaly, A.R. The Effect of Oxygen Admixture with Argon Discharges on the Impact Parameters of Atmospheric Pressure Plasma Jet Characteristics. Appl. Sci. 2021, 11, 6870. [Google Scholar] [CrossRef]
- Komin, O.V.; Pelipasov, O.V. Effect of O2 in plasma gas on parameters of nitrogen MIP-OES. J. Anal. Atomic Spectrom. 2022, 37, 1573–1577. [Google Scholar] [CrossRef]
- Krumpolec, R.; Jurmanová, J.; Zemánek, M.; Kelar, J.; Kováčik, D.; Černák, M. Selective Plasma Etching of Polymer-Metal Mesh Foil in Large-Area Hydrogen Atmospheric Pressure Plasma. Appl. Sci. 2020, 10, 7356. [Google Scholar] [CrossRef]
- Tochikubo, F.; Uchida, S.; Yasui, H.; Sato, K. Numerical Simulation of NO Oxidation in Dielectric Barrier Discharge with Microdischarge Formation. Jpn. J. Appl. Phys. 2009, 48, 076507. [Google Scholar] [CrossRef]
- Cheng, K.-W. Fluid Modeling of Parallel-Plate Nitrogen-based Dielectric Barrier Discharge Driven by a Realistic Distorted Sinusoidal AC Power Source. Master’s Thesis, National Chiao Tung University, Hsinchu, Taiwan, 2012. [Google Scholar]
- Sakiyama, Y.; Graves, D.B.; Chang, H.-W.; Shimizu, T.; Morfill, G.E. Plasma chemistry model of surface microdischarge in humid air and dynamics of reactive neutral species. J. Phys. D Appl. Phys. 2012, 45, 425201. [Google Scholar] [CrossRef]
- Nikiforov, A.Y.; Sarani, A.; Leys, C. The influence of water vapor content on electrical and spectral properties of an atmospheric pressure plasma jet. Plasma Sources Sci. Technol. 2011, 20, 015014. [Google Scholar] [CrossRef]
- Lin, K.-M. Development of Parallel Hybrid Simulation of Gas Discharge and Gas Flow and Its Application in the Modeling of Atmospheric-Pressure Helium Dielectric Barrier Discharge Jet Considering Impurities. Master’s Thesis, National Chiao Tung University, Hsinchu, Taiwan, 2012. [Google Scholar]
- Murakami, T.; Niemi, K.; Gans, T.; O’Connell, D.; Graham, W.G. Chemical kinetics and reactive species in atmospheric pressure helium-oxygen plasmas with humid-air impurities. Plasma Sources Sci. Technol. 2013, 22, 015003. [Google Scholar] [CrossRef]
- Schröter, S.; Gibson, A.R.; Kushner, M.J.; Gans, T.; O’Connell, D. Numerical study of the influence of surface reaction probabilities on reactive species in an rf atmospheric pressure plasma containing humidity. Plasma Phys. Control. Fusion 2018, 60, 014035. [Google Scholar] [CrossRef]
- Itikawa, Y. Cross sections for electron collisions with nitrogen molecules. J. Phys. Chem. Ref. Data 2006, 35, 31–53. [Google Scholar] [CrossRef]
- Tsai, I.H.; Hsu, C.C. Numerical Simulation of Downstream Kinetics of an Atmospheric-Pressure Nitrogen Plasma Jet. IEEE Trans. Plasma Sci. 2010, 38, 3387–3392. [Google Scholar] [CrossRef]
- Moravej, M.; Yang, X.; Barankin, M.; Penelon, J.; Babayan, S.E.; Hicks, R.F. Properties of an atmospheric pressure radio-frequency argon and nitrogen plasma. Plasma Sources Sci. Technol. 2006, 15, 204–210. [Google Scholar] [CrossRef]
- Capitelli, M.; Ferreira, C.M.; Gordiets, B.F.; Osipov, A.I. Plasma Kinetics in Atmospheric Gases; Springer: Berlin/Heidelberg, Germany, 2000; p. 300. [Google Scholar]
- Babayan, S.E.; Ding, G.; Nowling, G.R.; Yang, X.; Hicks, R.F. Characterization of the active species in the afterglow of a nitrogen and helium atmospheric-pressure plasma. Plasma Chem. Plasma Process. 2002, 22, 255–269. [Google Scholar] [CrossRef]
- Kossyi, I.A.; Kostinsky, A.Y.; Matveyev, A.A.; Silakov, V.P. Kinetic scheme of the non-equilibrium discharge in nitrogen-oxygen mixtures. Plasma Sources Sci. Technol. 1992, 1, 207–220. [Google Scholar] [CrossRef]
- Piper, L.G. State-to-state N2(A 3Σ+u) energy-pooling reactions. I. The formation of N2(C 3Πu) and the Herman infrared system. J. Chem. Phys. 1988, 88, 231–239. [Google Scholar] [CrossRef]
- Uhm, H.S.; Ki, S.H.; Baik, K.Y.; Choi, E.H. Influence of oxygen on generation of reactive chemicals from nitrogen plasma jet. Sci. Rep. 2018, 8, 9318. [Google Scholar] [CrossRef] [PubMed]
- Herron, J.T. Evaluated Chemical Kinetics Data for Reactions of N(2D), N(2P), and N2(A3Σu+) in the Gas Phase. J. Phys. Chem. Ref. Data 1999, 28, 1453–1483. [Google Scholar] [CrossRef]


Disclaimer/Publisher’s Note: The statements, opinions and data contained in all publications are solely those of the individual author(s) and contributor(s) and not of MDPI and/or the editor(s). MDPI and/or the editor(s) disclaim responsibility for any injury to people or property resulting from any ideas, methods, instructions or products referred to in the content. |
© 2023 by the authors. Licensee MDPI, Basel, Switzerland. This article is an open access article distributed under the terms and conditions of the Creative Commons Attribution (CC BY) license (https://creativecommons.org/licenses/by/4.0/).