Article

Localized Damage Analysis of Cement Mortar Using X-ray Computed Tomography In Situ Compressive Loading and Digital Volume Correlation

1
College of Science, Inner Mongolia University of Technology, Hohhot 010051, China
2
Art Design College, Inner Mongolia Technical College of Construction, Hohhot 010070, China
3
School of Civil Engineering, Inner Mongolia University of Technology, Hohhot 010051, China
*
Author to whom correspondence should be addressed.
Appl. Sci. 2023, 13(6), 3842; https://doi.org/10.3390/app13063842
Submission received: 11 February 2023 / Revised: 5 March 2023 / Accepted: 15 March 2023 / Published: 17 March 2023

Abstract

:
In this study, X-ray computed tomography (X-ray CT) in situ compressive loading was used, in combination with digital volume correlation (DVC), to analyze the localized damage behavior of cement mortar, the cracking process, microstructural changes, and strain distribution. By using X-ray CT, it was possible to identify the three-dimensional structure and two-dimensional internal morphology of compressed cement mortar. The development of localized damage was significantly influenced by the unhydrated cement. Cracks in the material did not always expand with an increasing load, and the formation of new cracks made old ones become extruded. After conducting a DVC calculation, it was found that the loading procedure contained bias. The bias during loading and the non-homogeneity of the material can cause uneven strain distribution. The maximum principal strains are all tensile, causing tensile damage. To reflect the damage inside the specimen, the gray value of the CT image and the damage index determined by the maximum primary strain were used. A localization factor was introduced to characterize the damage failure process in three dimensions. The internal localization damage of the material occurred earlier than that on the surface, and the damage develops from the inside out, according to the results of the CT image’s gray value, damage index, and localization factor. The damage develops from the inside out, which may be caused by the phenomenon of a compression load or bias pressure. In order to reach a reliable conclusion, more research is required.

1. Introduction

The most significant failure characteristic of concrete materials is the generation and expansion of cracks, accompanied by the deformation and localization of damaged areas [1]. Therefore, the crack evolution process, deformation development, and damage localization are key research hotspots. Various methods, such as scanning electron microscopy (SEM) [2], optical microscopy (OM) [3], digital image correlation (DIC) [4], and acoustic emission (AE) [5], have been used to investigate the generation and propagation of cracks in concrete. However, these traditional methods can only be used to analyze the surface failure, and it is very difficult to investigate and visualize the interior failure mode of concrete.
In recent years, X-ray computed tomography (X-ray CT) has been widely used to analyze the failure of cement-based materials. X-ray CT is superior to traditional methods for observing crack development in materials. It has been used to not only observe the generation and propagation of internal cracks, but also to detect crack shape [6,7]. With the development of CT and loading equipment, the research of in situ tests is gradually attracting scholars’ attention. Real-time observation through in situ scanning is of great significance for the application of cement-based materials in practical engineering. The fracture behavior of concrete under uniaxial compressive loading has been analyzed by some scholars through X-ray CT, including the qualitative analysis of crack morphology and distribution and the quantitative analysis of crack volume and width [8,9]. The variation in the CT image gray value [10] or building numerical models based on CT images has been used to analyze the damage evolution of concrete [11,12]. However, due to the errors in the selection of average gray values or in building models, the accuracy of the characterization of internal damage to materials still needs to be improved.
The deformation of material is a significant indication of damage during force application. It is difficult to measure strain with a strain gauge during an in situ loading test due to the limitations of the CT loading device. In addition, the traditional strain measurement method can only obtain the strain in a specific area, not the full-field strain in the material. Digital volume correlation (DVC) is an ideal tool to solve this problem. DVC is an extension of DIC, and their working principles are the same. DVC combined with X-ray CT can measure the internal displacement field, and the three-dimensional distribution of the strain can be obtained through a calculation [13,14]. The unique advantages of this method have attracted the attention of many scholars. Some of them used X-ray CT combined with DVC to characterize the fracture evolution of concrete, and we compared the results with the finite element simulation (established based on CT images) [15,16]. The results show that the pattern of fracture evolution obtained by the two methods is consistent. Studies on concrete materials mainly focus on the optimization of the DVC calculation accuracy or the description of strain cloud diagrams [17,18,19,20]. The quantitative analysis of the strain and a further analysis of material internal damage based on the strain remain to be studied.
In this paper, X-ray CT combined with the DVC method was used to characterize the localized damage of cement mortar under uniaxial compression. X-ray CT was used to obtain 2D and 3D crack distribution and the width of the cracks so as to analyze the crack evolution of the specimen under different loads. DVC was employed to obtain the strain field under different stress states and analyze the strain distribution inside the specimen. The gray value and damage index of CT images were used to characterize the damage degree of cement mortar. In order to analyze the effect of localization damage on specimen failure, the localization factor was used to characterize damage to the high-amplitude strain region in the 3D scale.

2. Materials and Methods

2.1. Sample Preparation

Cement mortar specimens were prepared according to the JGJ/T 98-2010 standard, “Specification for mix proportion design of masonry mortar”. Standard sand, P.O.32.5 cement, and water were used as raw materials in a mass ratio of 4.8:1.2:1. The specimens of 70.7 mm × 70.7 mm × 70.7 mm were made to obtain compressive strength, and the specimens of 10 mm × 10 mm × 10 mm were made under the same conditions to conduct an X-ray in situ loading test. The fresh mortar was first shaped in cubic molds then demolded after 24 h at room temperature, and finally cured in a standard curing room for 28 days. The compressive strength of cement mortar is 30.5 MPa.

2.2. X-ray CT In Situ Loading Test

The in situ loading test was conducted with an X-ray CT machine (The Xradia 610 Versa, ZEISS, Germany) and a loading machine (The Deben, Mechanical Operation V1.0, UK). The cement mortar specimen was placed in the center of the loading equipment platform, which was fixed on the X-ray CT apparatus (Figure 1). The platform on which the specimen was placed could move upward. The loading of the sample was finished with the lifting of the loading platform. The specimen could be rotated 360° along with the loading device; therefore, images of the specimen from different angles could be obtained during CT scanning.
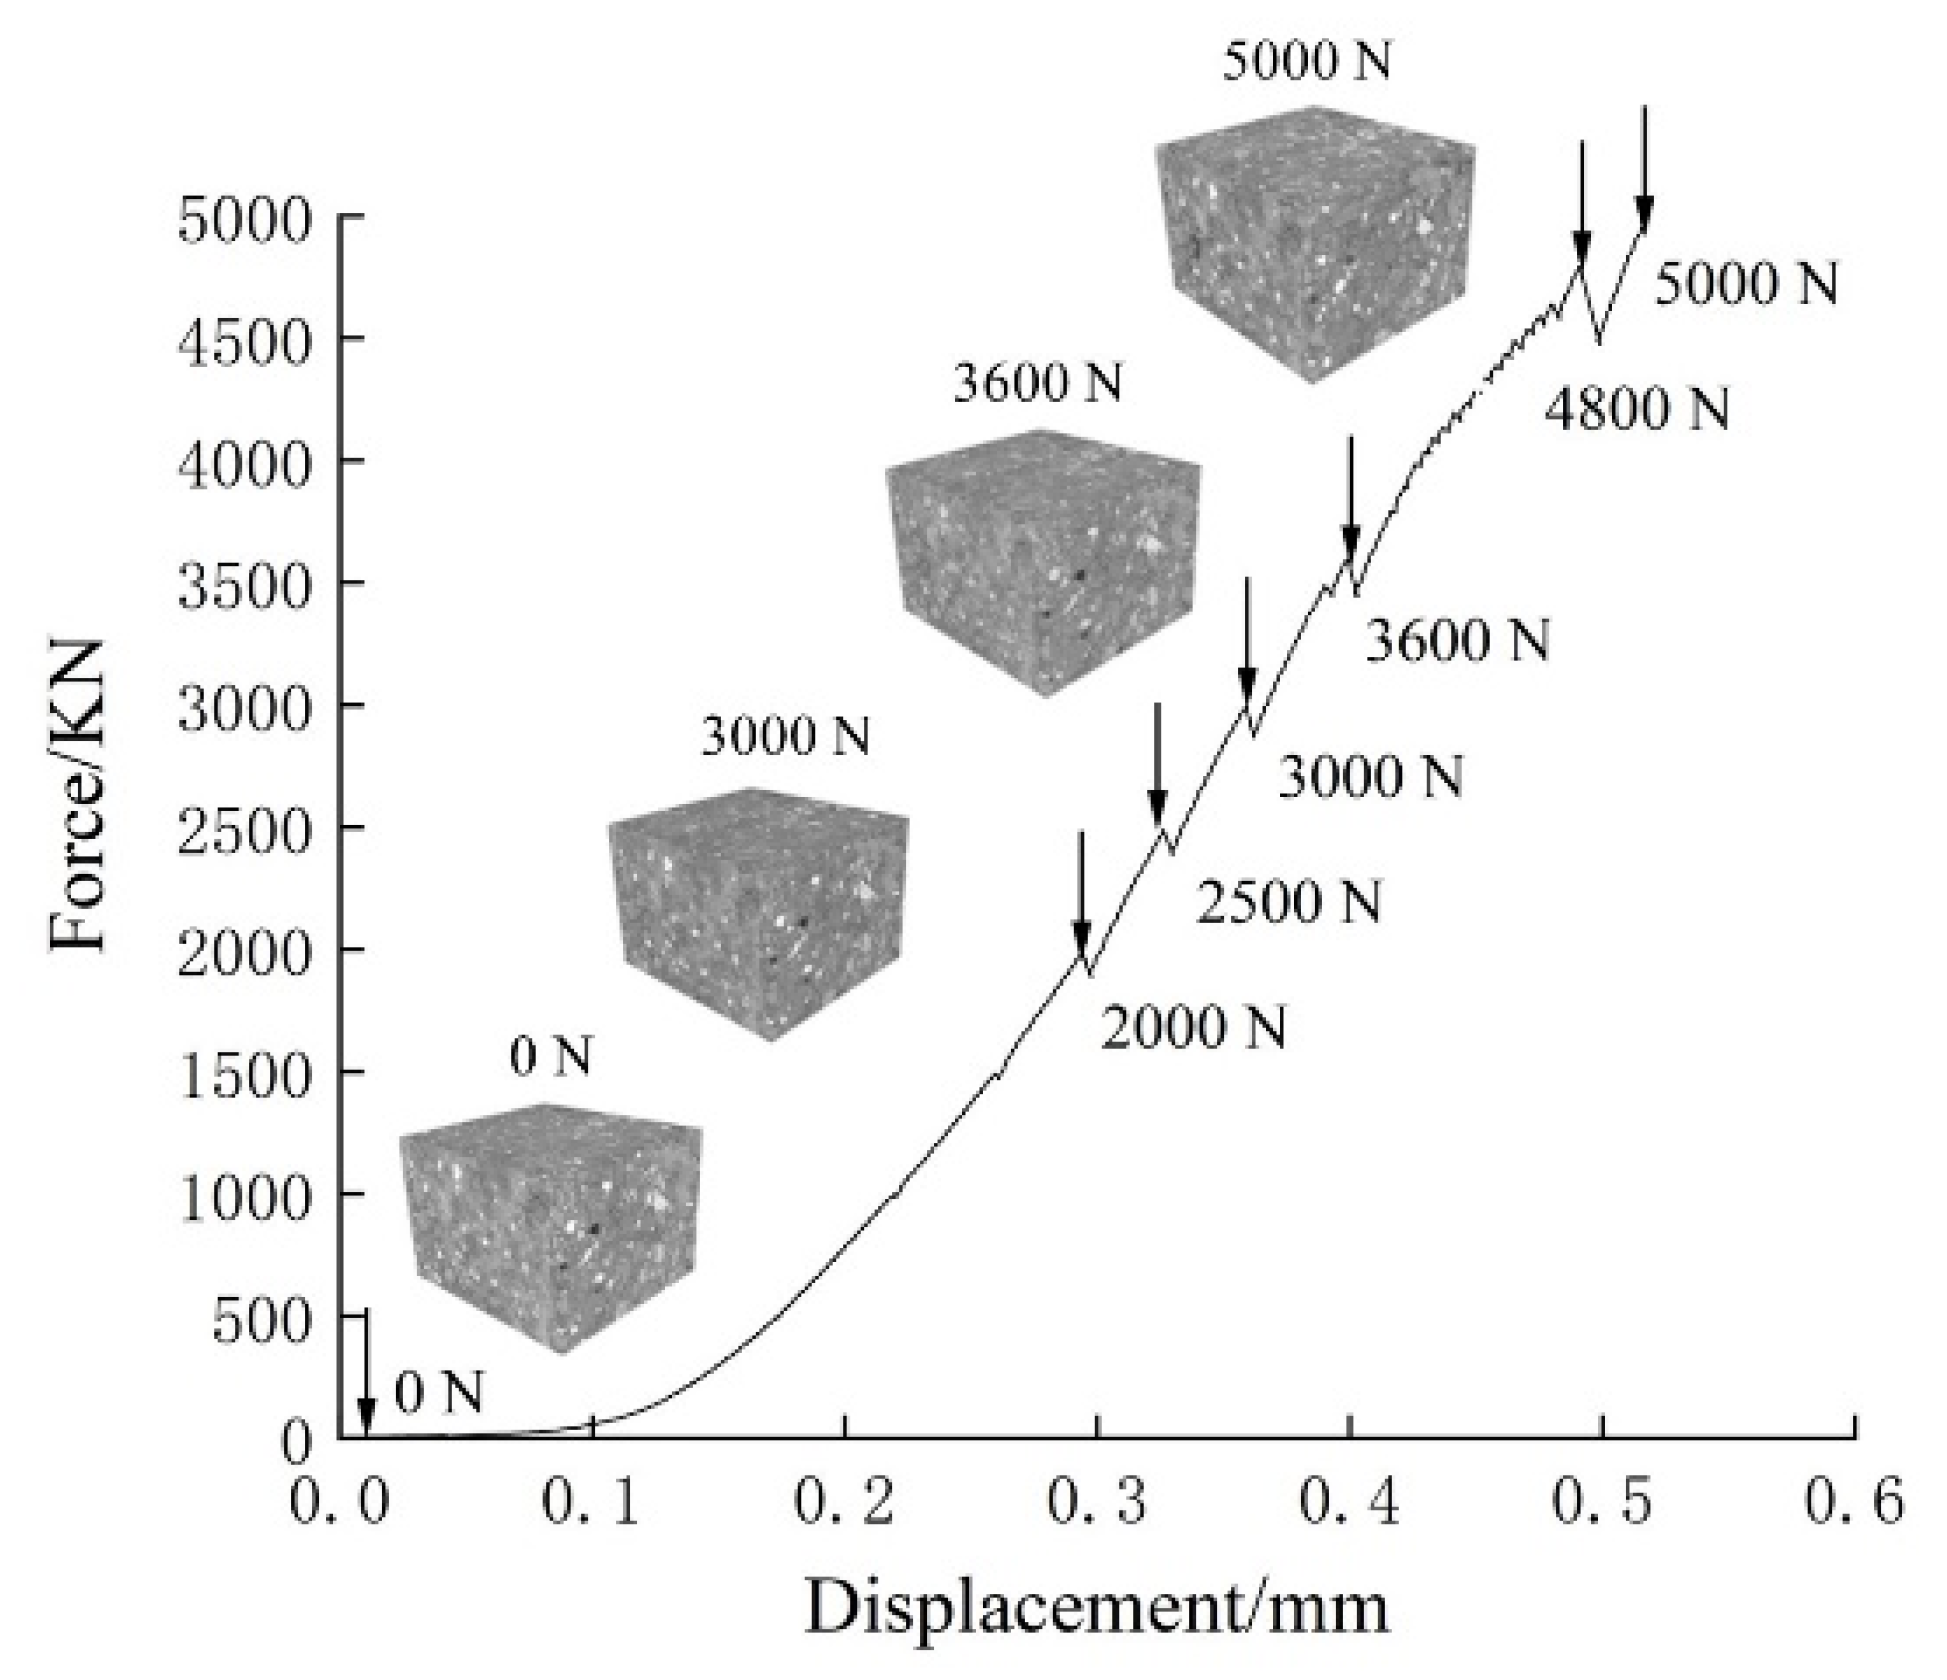
In situ scanning was conducted under loads of 0 N, 2000 N, 2500 N, 3000 N, 3600 N, 4800 N, and 5000 N to figure out how the internal cracks changed under different pressures and keep the sample from being damaged by too much pressure. The scanning parameters are listed in Table 1. The first scan was conducted without loading, followed by loading to 2000 N, stopping loading, and the second scan. Similarly, the specimen was reloaded to 5000 N and the last scan was conducted. The details of the loading process are presented in Figure 2. It can be seen from Figure 2 that the curve drops significantly at the scanning point. The rotation of the turntable causes force relaxation when the load stopped. When conducting in situ compression or tensile tests, the scanning time should be shortened to reduce the relaxation effect [21].

2.3. X-ray CT Image Processing

2.3.1. Raw Image Processing

Figure 3a shows the original image slice that correlates with the image of the 0 N scanning stage. It is obvious that there was a circle surrounding the specimen. This happened due to the scanning of the air within the X-ray range; thus, this circular artifact was formed. Hence, the image was cropped to obtain the specimen shape (Figure 3b). In order to reduce the effect of noise on the image quality, a filter was used to make the image clearer (Figure 3c). The filter type is median. Subsequently, 2D images were processed by Dragonfly software to generate a 3D image (Figure 3d), and the real specimen shape was obtained based on this 3D image.

2.3.2. Phase Segmentation

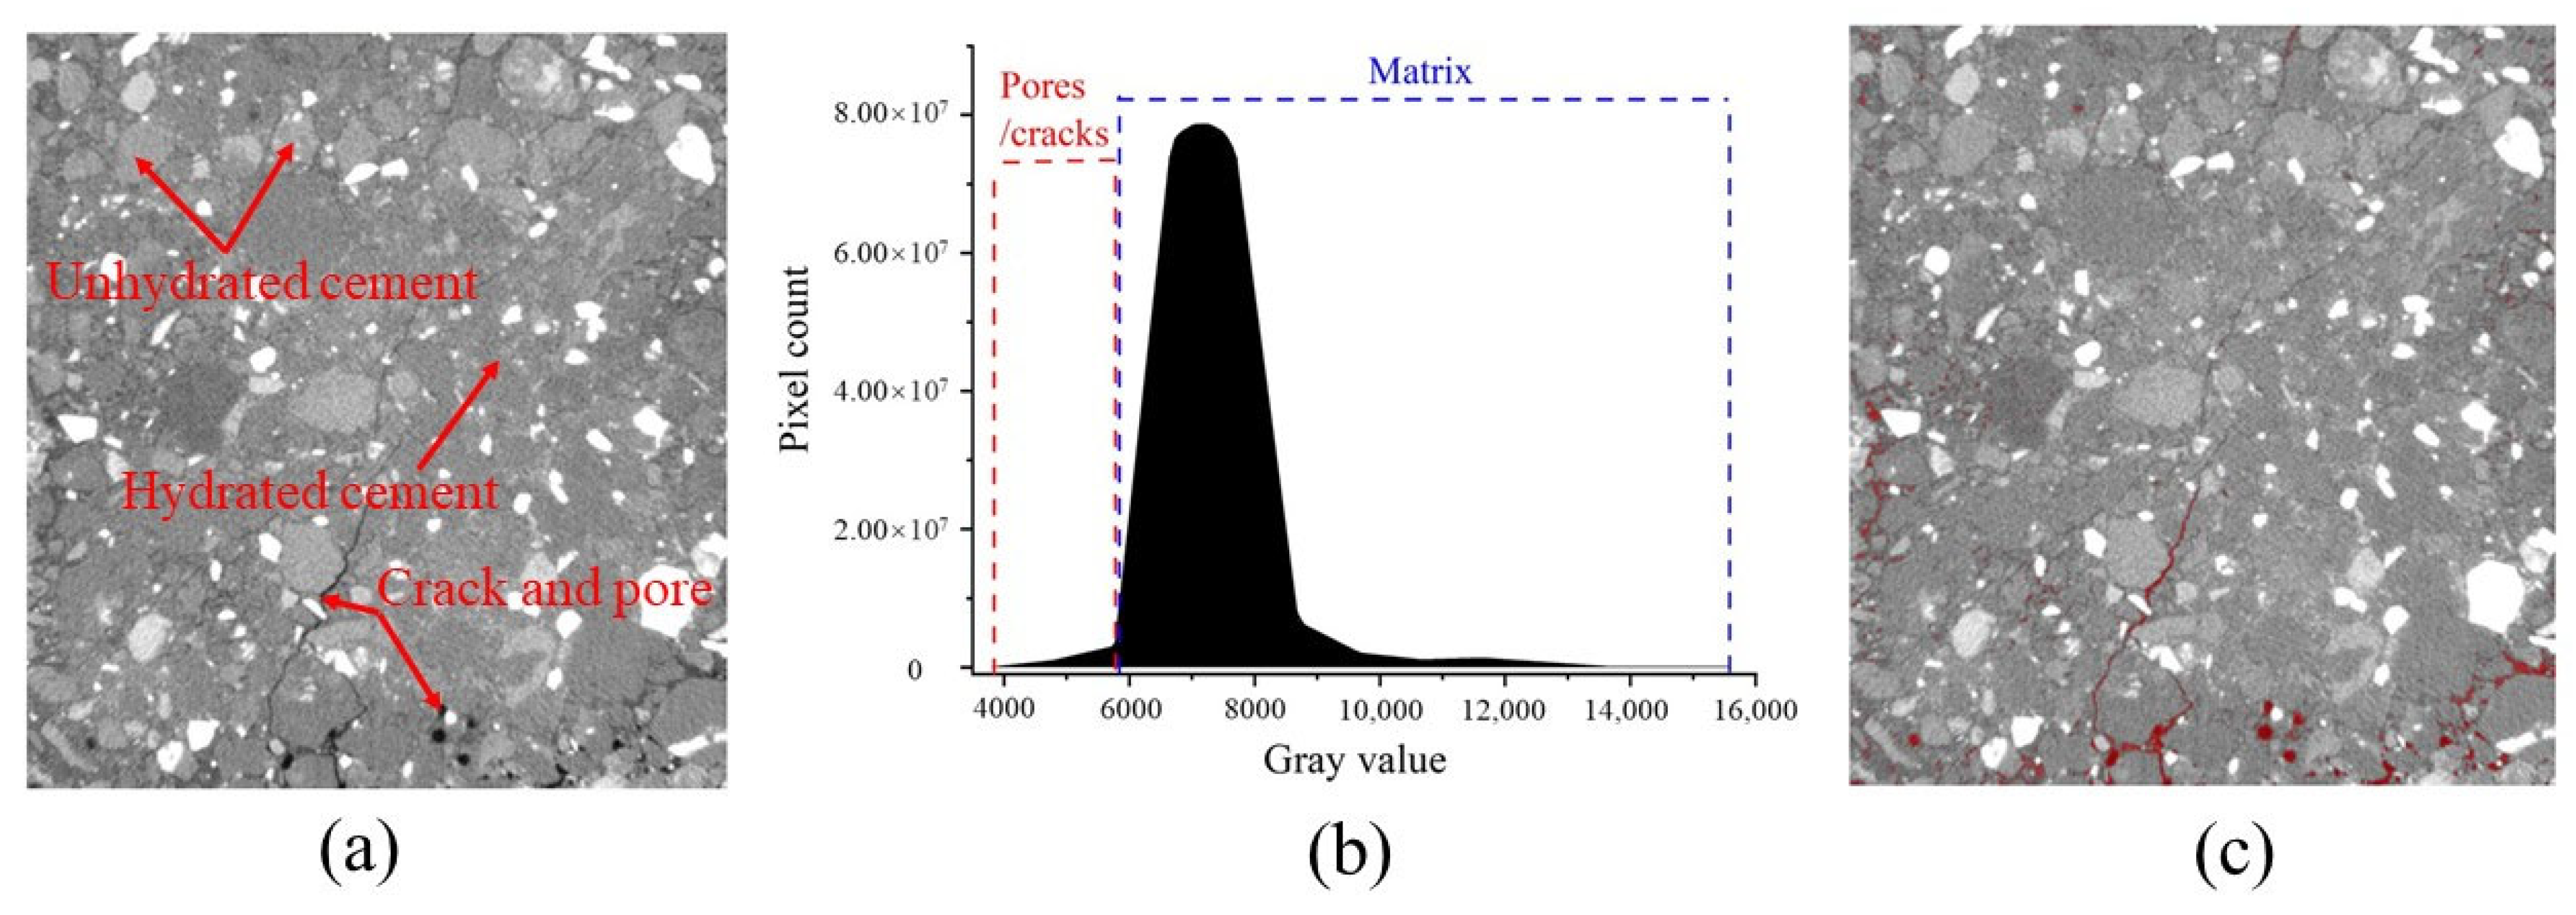
In order to analyze the crack characteristics of cement mortar under pressure, the cement matrix and cracks were segmented according to gray values. Gray values are the values of each pixel in an image, and they are closely related to the X-ray attenuation coefficient [22]. The darker parts of an image have a higher gray value, which means they are more dense (cement matrix). On the contrary, the darker part of an image has a smaller gray value, suggesting a lower density (pores and cracks) [23]. The CT image processing software could process 16-bit images. Each pixel had a gray value range of 0–65,535. In Figure 4a, the light color represents the points with a higher density (cement matrix), and the dark color indicates the points with a lower density (cracks and pores). Block-like substances were detected in the cement matrix due to inadequate cement hydration. It can also be observed from Figure 4a that cement hydration was nonuniform, and the unhydrated cement was scattered and distributed in the cement matrix. The detailed analysis process is introduced in Section 3.1. It is necessary to select an appropriate gray threshold when using the threshold segmentation method to segment the cement matrix and cracks (pores). Taking a specimen under 3000 N as an example, the gray value distribution is shown in Figure 4b. It can be seen from the figure that the gray value of the specimen ranges from 3780 to 15,600, which is due to the high density of the whole specimen. There is a significant inflection point at the position of 5890. The gray value higher than this point shows an obvious upward trend. Combined with the image, it can be determined that the gray value higher than this value is the cement matrix, and the lower value is the crack (pore). The cement matrix and cracks were successfully distinguished based on this value (Figure 4c).

2.4. Digital Volume Correlation

DVC is a measuring tool for detecting the internal displacement field of material based on volume images. Its basic principle is to take the volume image before deformation as the reference image and the volume image after deformation as the target image. The 3D displacement vector is calculated by tracking the position of each point in the reference image after deformation. In order to accurately track the displacement of a certain point P (x, y, z), it is necessary to take a small cube (sub-volume) centered on this point. The displacement components u, v, and w of the sub-volume center point can be determined by tracking the selected position P (x′, y′, z′) of the deformed sub-volume in the target image.
The subset-based local DVC method selected in this text is the spatial domain algorithm. In order to obtain the displacement of sub-voxel precision, the non-linear iterative algorithm is usually adopted. The non-linear problem gradually converges from the initial deformation vector to the local optimal extremum (the deformation vector that makes the reference and the deformation sub-volume match best) through this algorithm. An iterative optimization algorithm (IC-GN algorithm) is used to optimize the optimization function (ZNSSD) to obtain sub-pixel displacement.
The most important parameters that affect the calculation accuracy of displacement are the subset size and shape function [24]. The subset size, also known as the sub-volume size, has a direct impact on the precision of the DVC measurements [25]. The larger the subset size is, the greater the consumption of calculation resources and time; thus, the deformation at the smaller scale can be ignored. When a small subset size is selected, the calculation time decreases and errors occur; therefore, the subset size cannot be too large or too small. The subsets of 8 × 8 × 8 voxel, 16 × 16 × 16 voxel, and 32 × 32 × 32 voxel were selected for calculation in [26]. The results showed that as the subset size increased, the mean error and standard deviation dropped, and the DVC computation results were more precise and accurate. The calculation inaccuracy was considerable when the subset size was 8 × 8 × 8 voxel. The increased size of the subset will have an impact on the measurement outcomes. The subset’s size should be chosen to be as minimal as possible while maintaining accuracy. The subset size selected in this paper is 31 × 31 × 31 voxel. The shape function should be able to accurately describe the local deformation of the target subset, including the zero-order function, the first-order function, and the second-order function [27]. The more commonly used first-order function is selected in this text, as shown in Equation (1):
[ U 1 ( Δ x , Δ y , Δ z ) V 1 ( Δ x , Δ y , Δ z ) W 1 ( Δ x , Δ y , Δ z ) ] = [ u v w ] + [ u x u y u z v x v y v z w x w y w z ] . [ Δ x Δ y Δ z ]
where Δx, Δy, and Δz, respectively, represent the distance from point (x, y, z) to the center point (x0, y0, z0) of the reference image subset in X, Y, and Z directions; u, v, and w are the displacement of the subset center in X, Y, and Z directions; and ux, uy, uz, vx, vy, vz, wx, wy, and wz are the displacement gradient of the subset, which is also called sub-voxel precision displacement. The accuracy of the sub-voxel displacement measurement is better than 0.01 voxel.

3. Results and Discussion

3.1. Crack Evolution Process

3.1.1. Three-Dimensional Distribution of Cracks

Figure 5 displays the 3D distributions of cracks at different loading stages. The vertical direction is the z-axis direction, that is, the loading direction. Figure 5a reveals the existence of original pores and microcracks on the mortar surface without loading. Microcracks were distributed around the pores and corners of the cement mortar (marked by red circles). Cracks did not expand significantly under 3000 N load (Figure 5b). Under 3600 N load, new cracks (marked by blue circles) were distributed at the corners of the specimen and on the surface with crazing shapes (Figure 5c). When the load reached 5000 N, cracks significantly expanded. In comparison to the 3600 N loading state, cracks further expanded (marked by blue circles) and reached the mortar surface through pores (marked by a yellow circle) (Figure 5d).

3.1.2. Two-Dimensional Analysis of Cracks

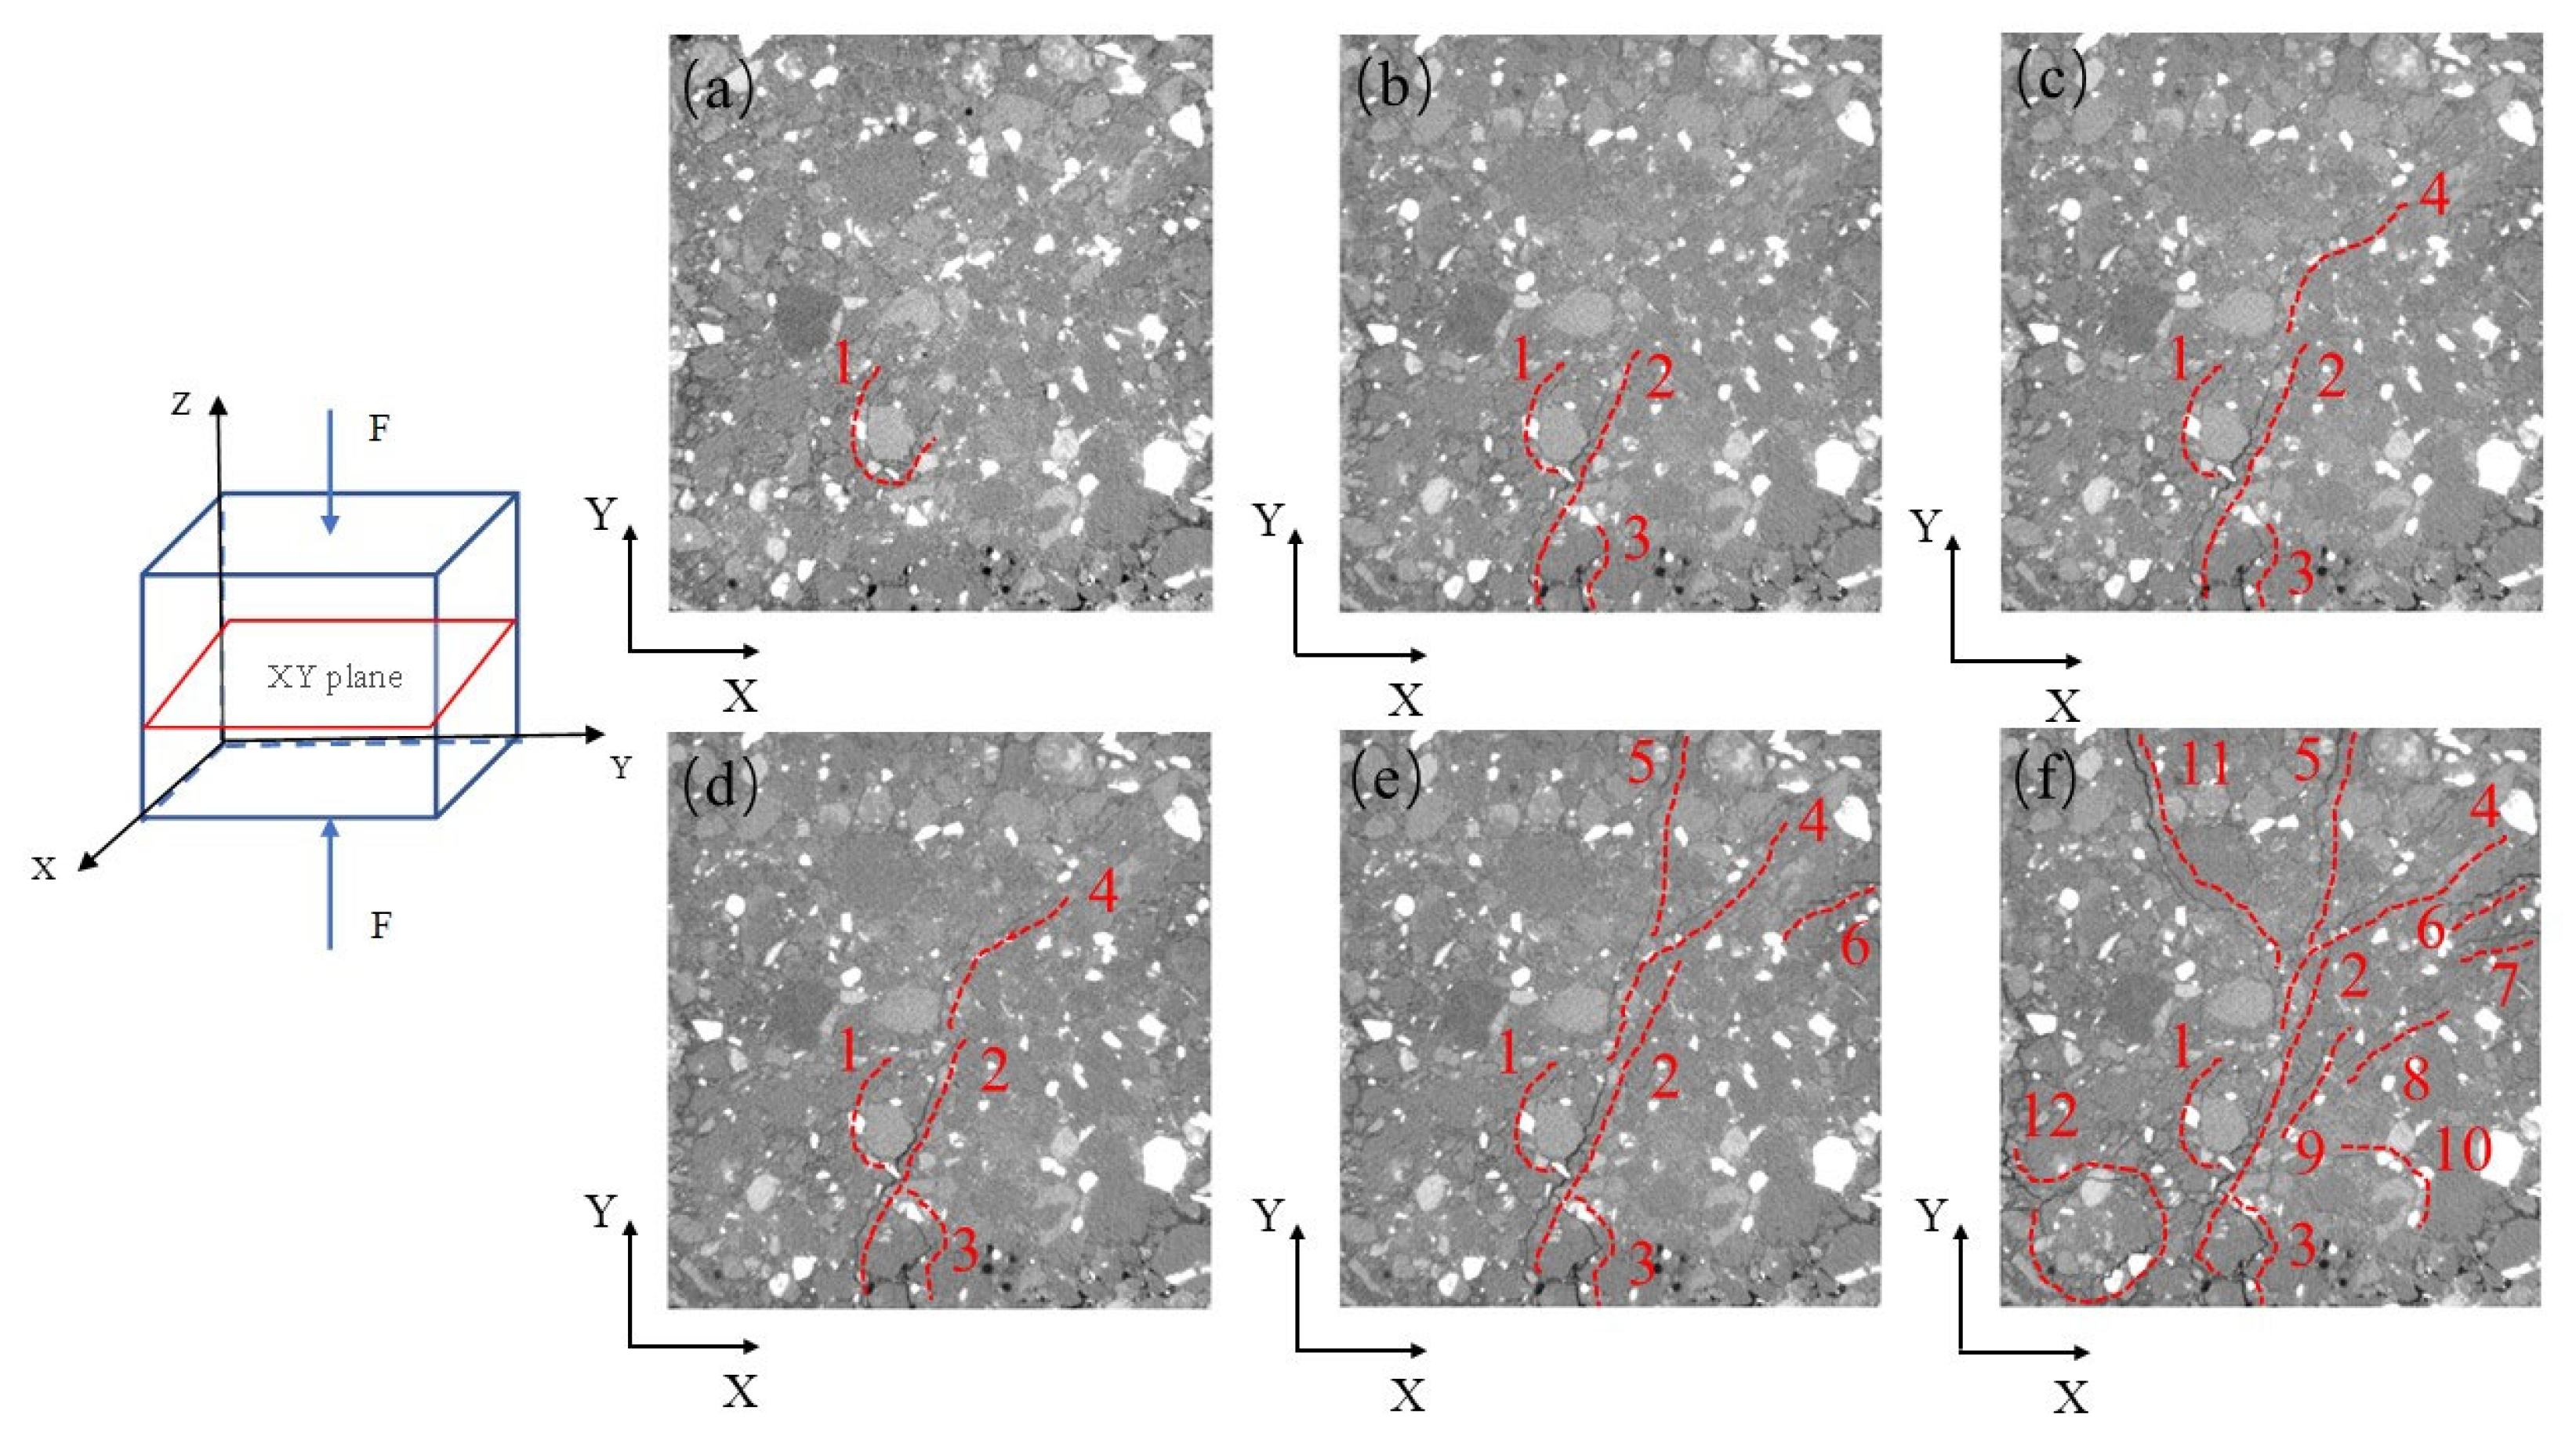
Figure 6 shows 2D crack distributions along the loading direction (Z-axis) on the XY plane (perpendicular to the loading direction) at different loading stages (cracks are marked with red dotted lines and numbers). Original pores and microcracks were distributed inside cement mortar (Figure 6a), and there were original microcracks at the edge of the unhydrated cement (position 1). New cracks appeared around the original pores and cracks under 2000 N load (positions 2 and 3 in Figure 6b), indicating that the boundary of unhydrated cement was the weakest area; thus, pores and initial defects around it caused localized fractures easily. With the increase in the load, the original cracks continued to expand and gradually formed joint cracks, and other new cracks appeared. When the load reached its maximum value of 5000 N, internal cracks presented a crazing distribution. These cracks increased in scale and had a complex shape and mode (Figure 6c–f). Comparing 3D and 2D crack images under the same loading condition, it is worth mentioning that no significant damage occurred on the mortar surface; however, the inside fracture was very obvious.

3.1.3. Analysis of Crack Evolution

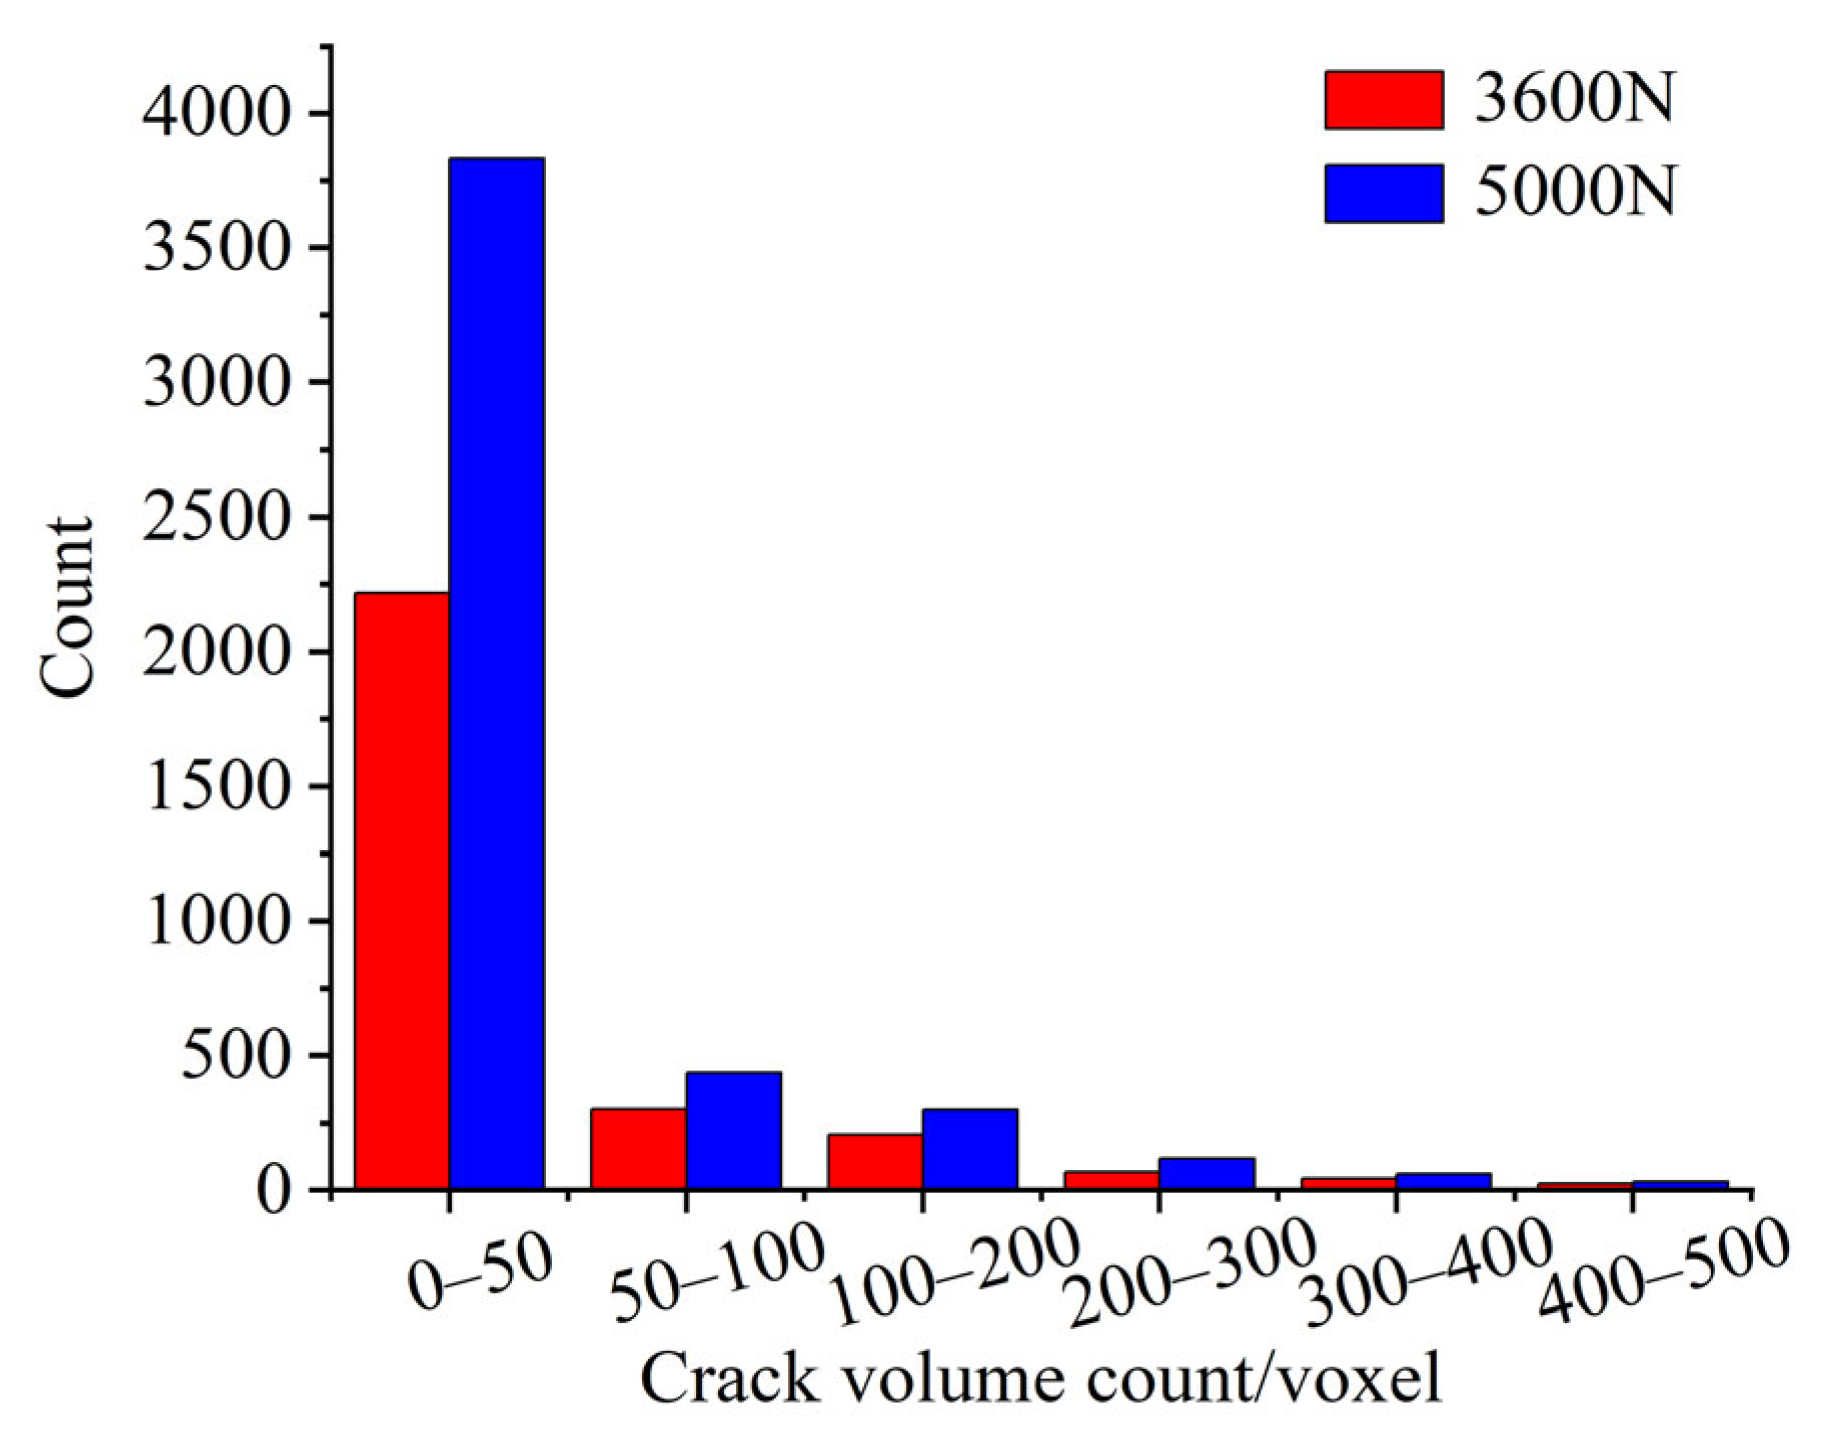
In order to directly reflect the process of crack generation and expansion of the cement mortar specimen under load, the stages of 3600 N and 5000 N with obvious cracks were selected for analysis. Image analysis software was used to obtain the voxel number of the crack, as shown in Figure 7. As can be seen from the figure, with the increase in the load, the number of cracks in different voxel ranges increases, especially in the range of 0–50 voxel. The number of cracks in this range under different loads is significantly higher than that in other voxel ranges, indicating that there are many microcracks in the specimen. When the load increased to 5000 N, there were no more large cracks but many small cracks.
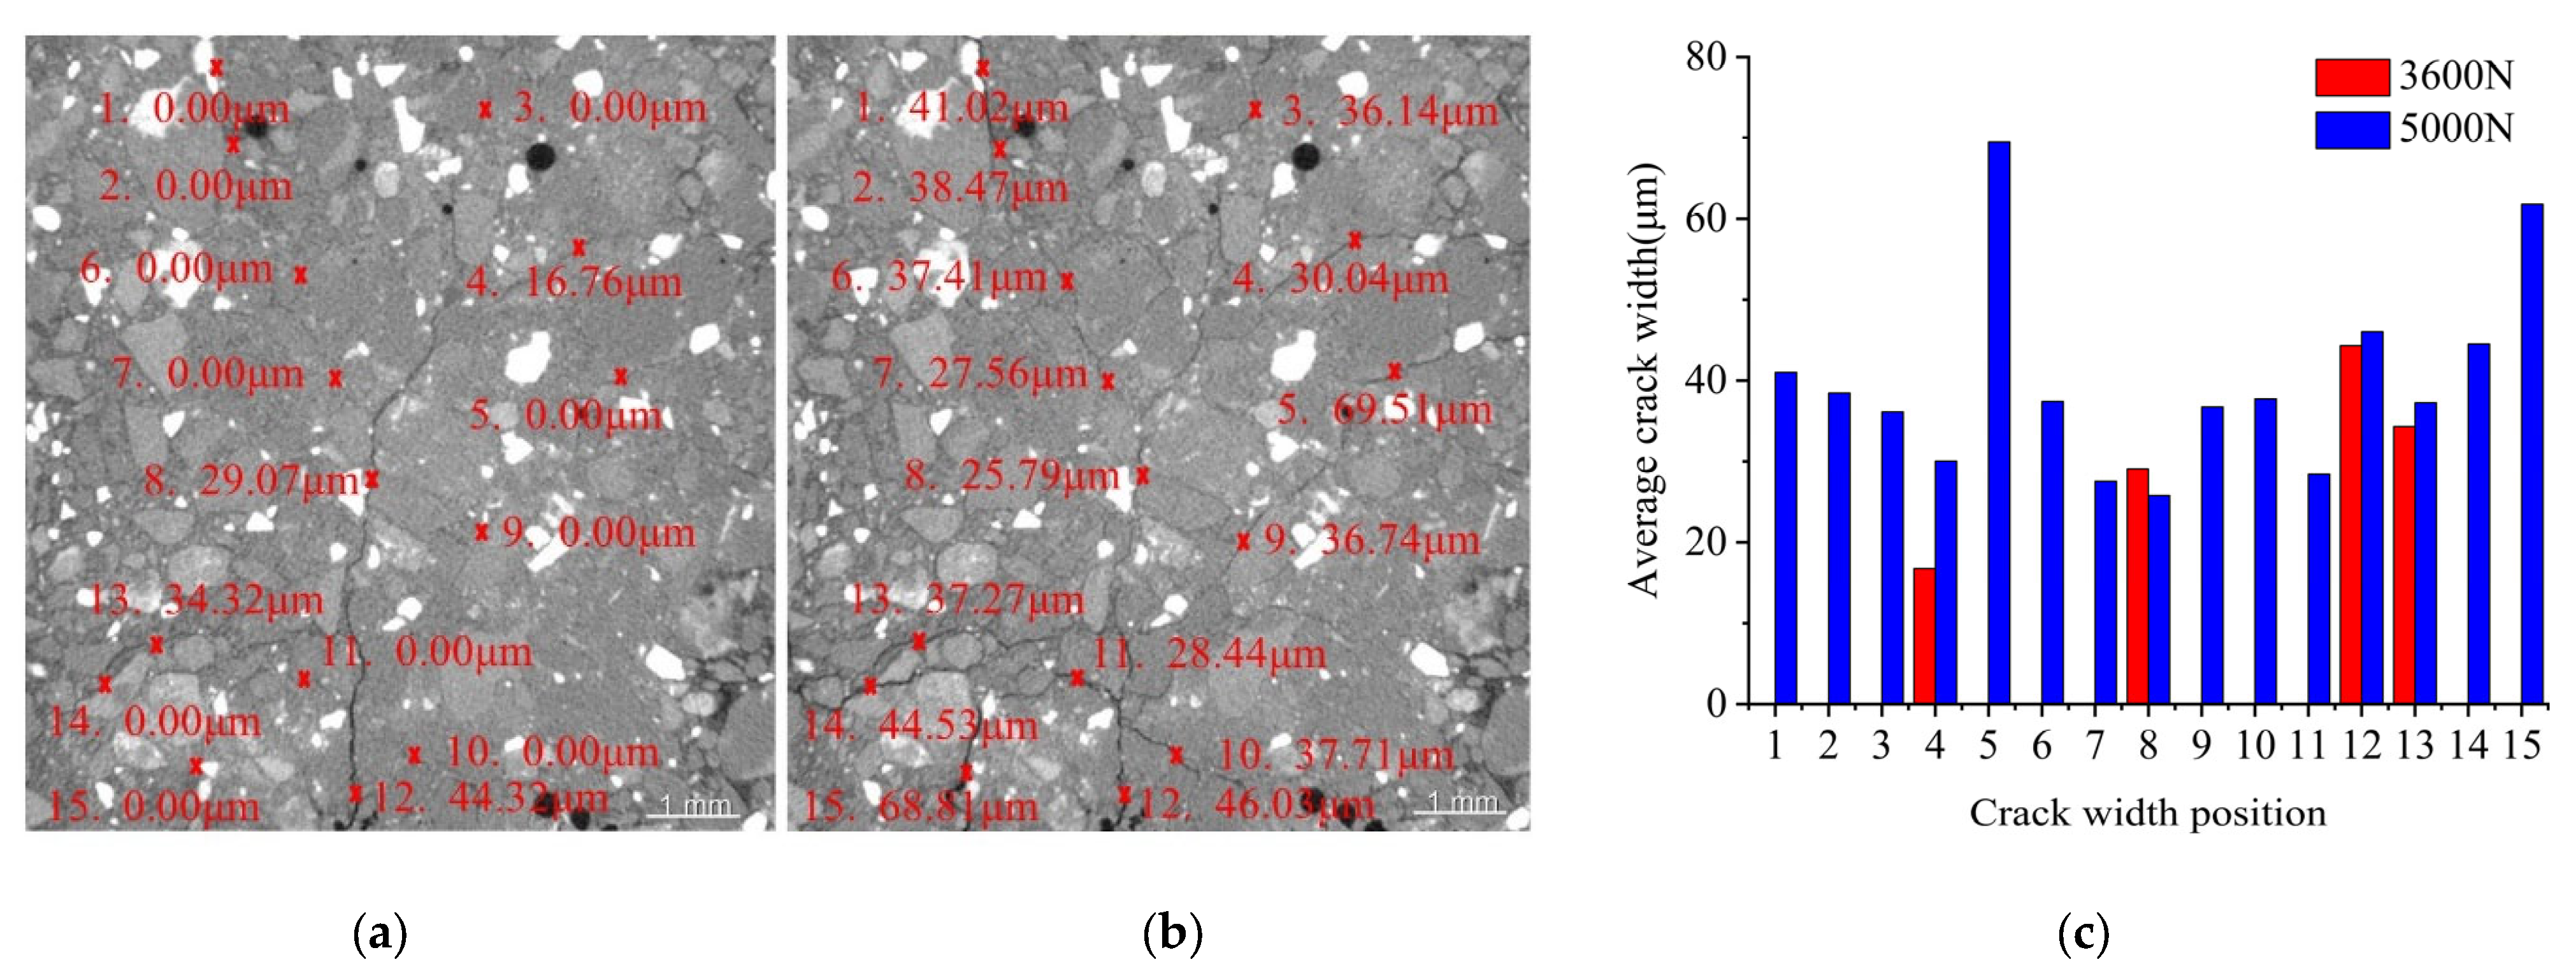
XY plane image slices with cracks under 3600 N and 5000 N were compared. Fifteen cracks were selected from the image slice under 5000 N to measure the average crack width, and the same measurement was performed at the corresponding position on the image slice under 3600 N (Figure 8a,b). The crack width at positions 1–15 under different loads is presented in Figure 8c. It is noticeable that a few cracks were distributed inside the mortar under 3600 N, and they mainly appeared at positions 4, 8, 12, and 13. When the load increased to 5000 N, cracks appeared at all selected positions. Crack widths under 5000 N were higher than those under 3600 N, except for position eight, indicating that new cracks were generated, and original cracks continued to expand with the increase in the load. The crack width at position eight under 5000 N was lower than that under 3600 N because the formation of new cracks around position eight compressed the existing cracks and produced a closure effect [28].

3.2. DVC Analysis

3.2.1. Three-Dimensional Strain Field

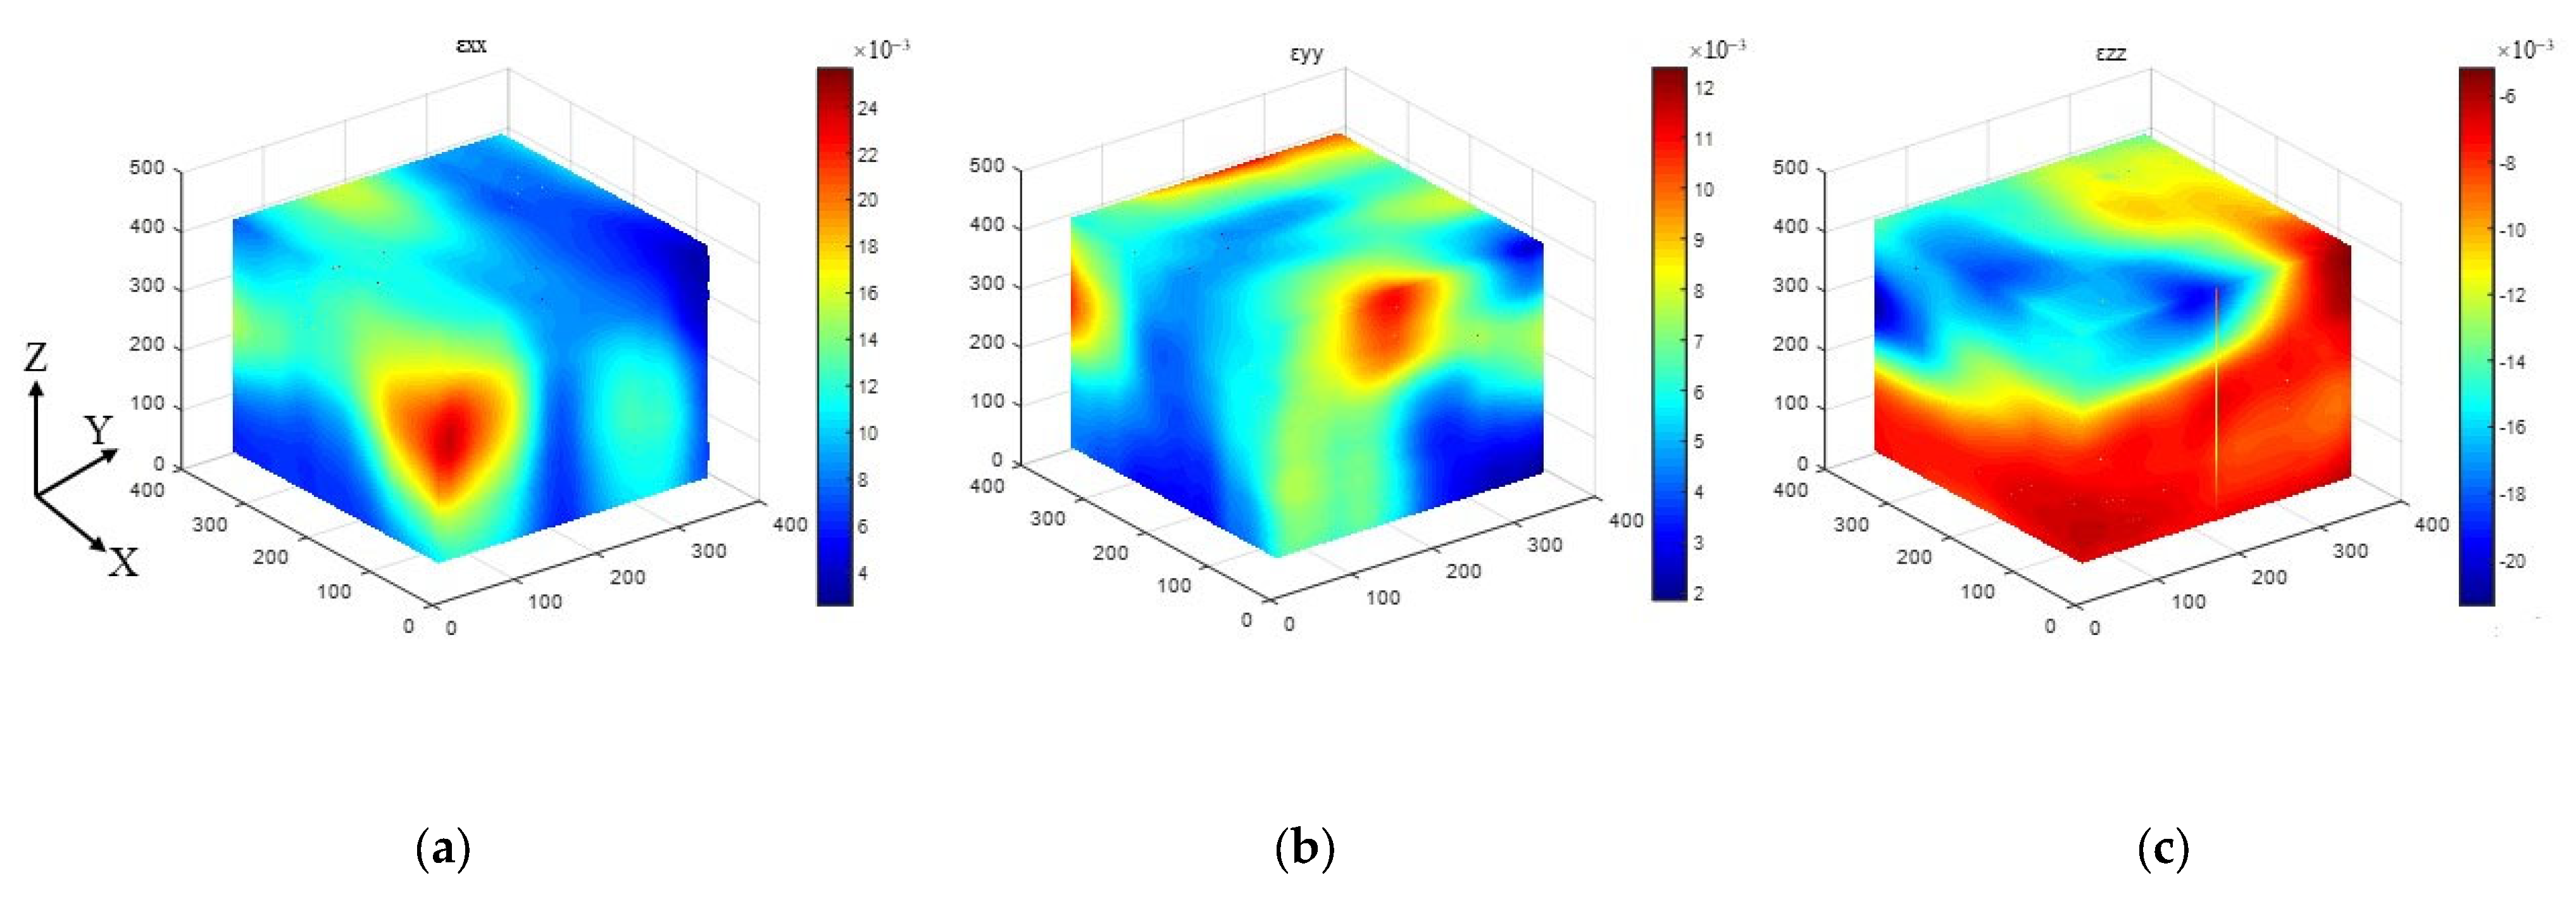
Six volumetric strain components (three principal strain components, εxx, εyy, and εzz, and three shear strain components, εxy, εxz, and εyz) were calculated based on displacement fields. Strain fields under 30 MPa are exhibited in Figure 9. The strain values of εxx and εyy along the X- and Y-directions are positive (Figure 9a,b), indicating that the mortar expanded and produced a tensile strain in these directions. It should be noted that the values of εxx and εyy greatly differ from each other, and the strain along the X-direction is about 3–4 times that in the Y-direction. An eccentric compression occurred during in situ loading, and the heterogeneous internal structure of the mortar caused different responses to stress. The values of εzz along the loading direction (Z-direction) are all negative (Figure 9c), indicating that the mortar produced compressive strain in this direction. Moreover, the color gradient changes greatly, implying that the eccentric compression occurred during loading.
Figure 10 presents the strain fields under 50 MPa; the values of the three principal strain components are all higher than 30 MPa. The values of εxx and εyy greatly increase, and the strain distribution is more uneven (Figure 10a,b). The difference between strain values along the X- and Y-directions decreases, and the strain in the X-direction is about twice that in the Y-direction. It might happen because, with the increased load, pores in the cement matrix were compacted, improving the stability of the internal structure. The red area of component εzz in the strain map expands observably (Figure 10c). The red area accounts for about two-thirds of the mortar volume and became darker, indicating the increase in the strain.
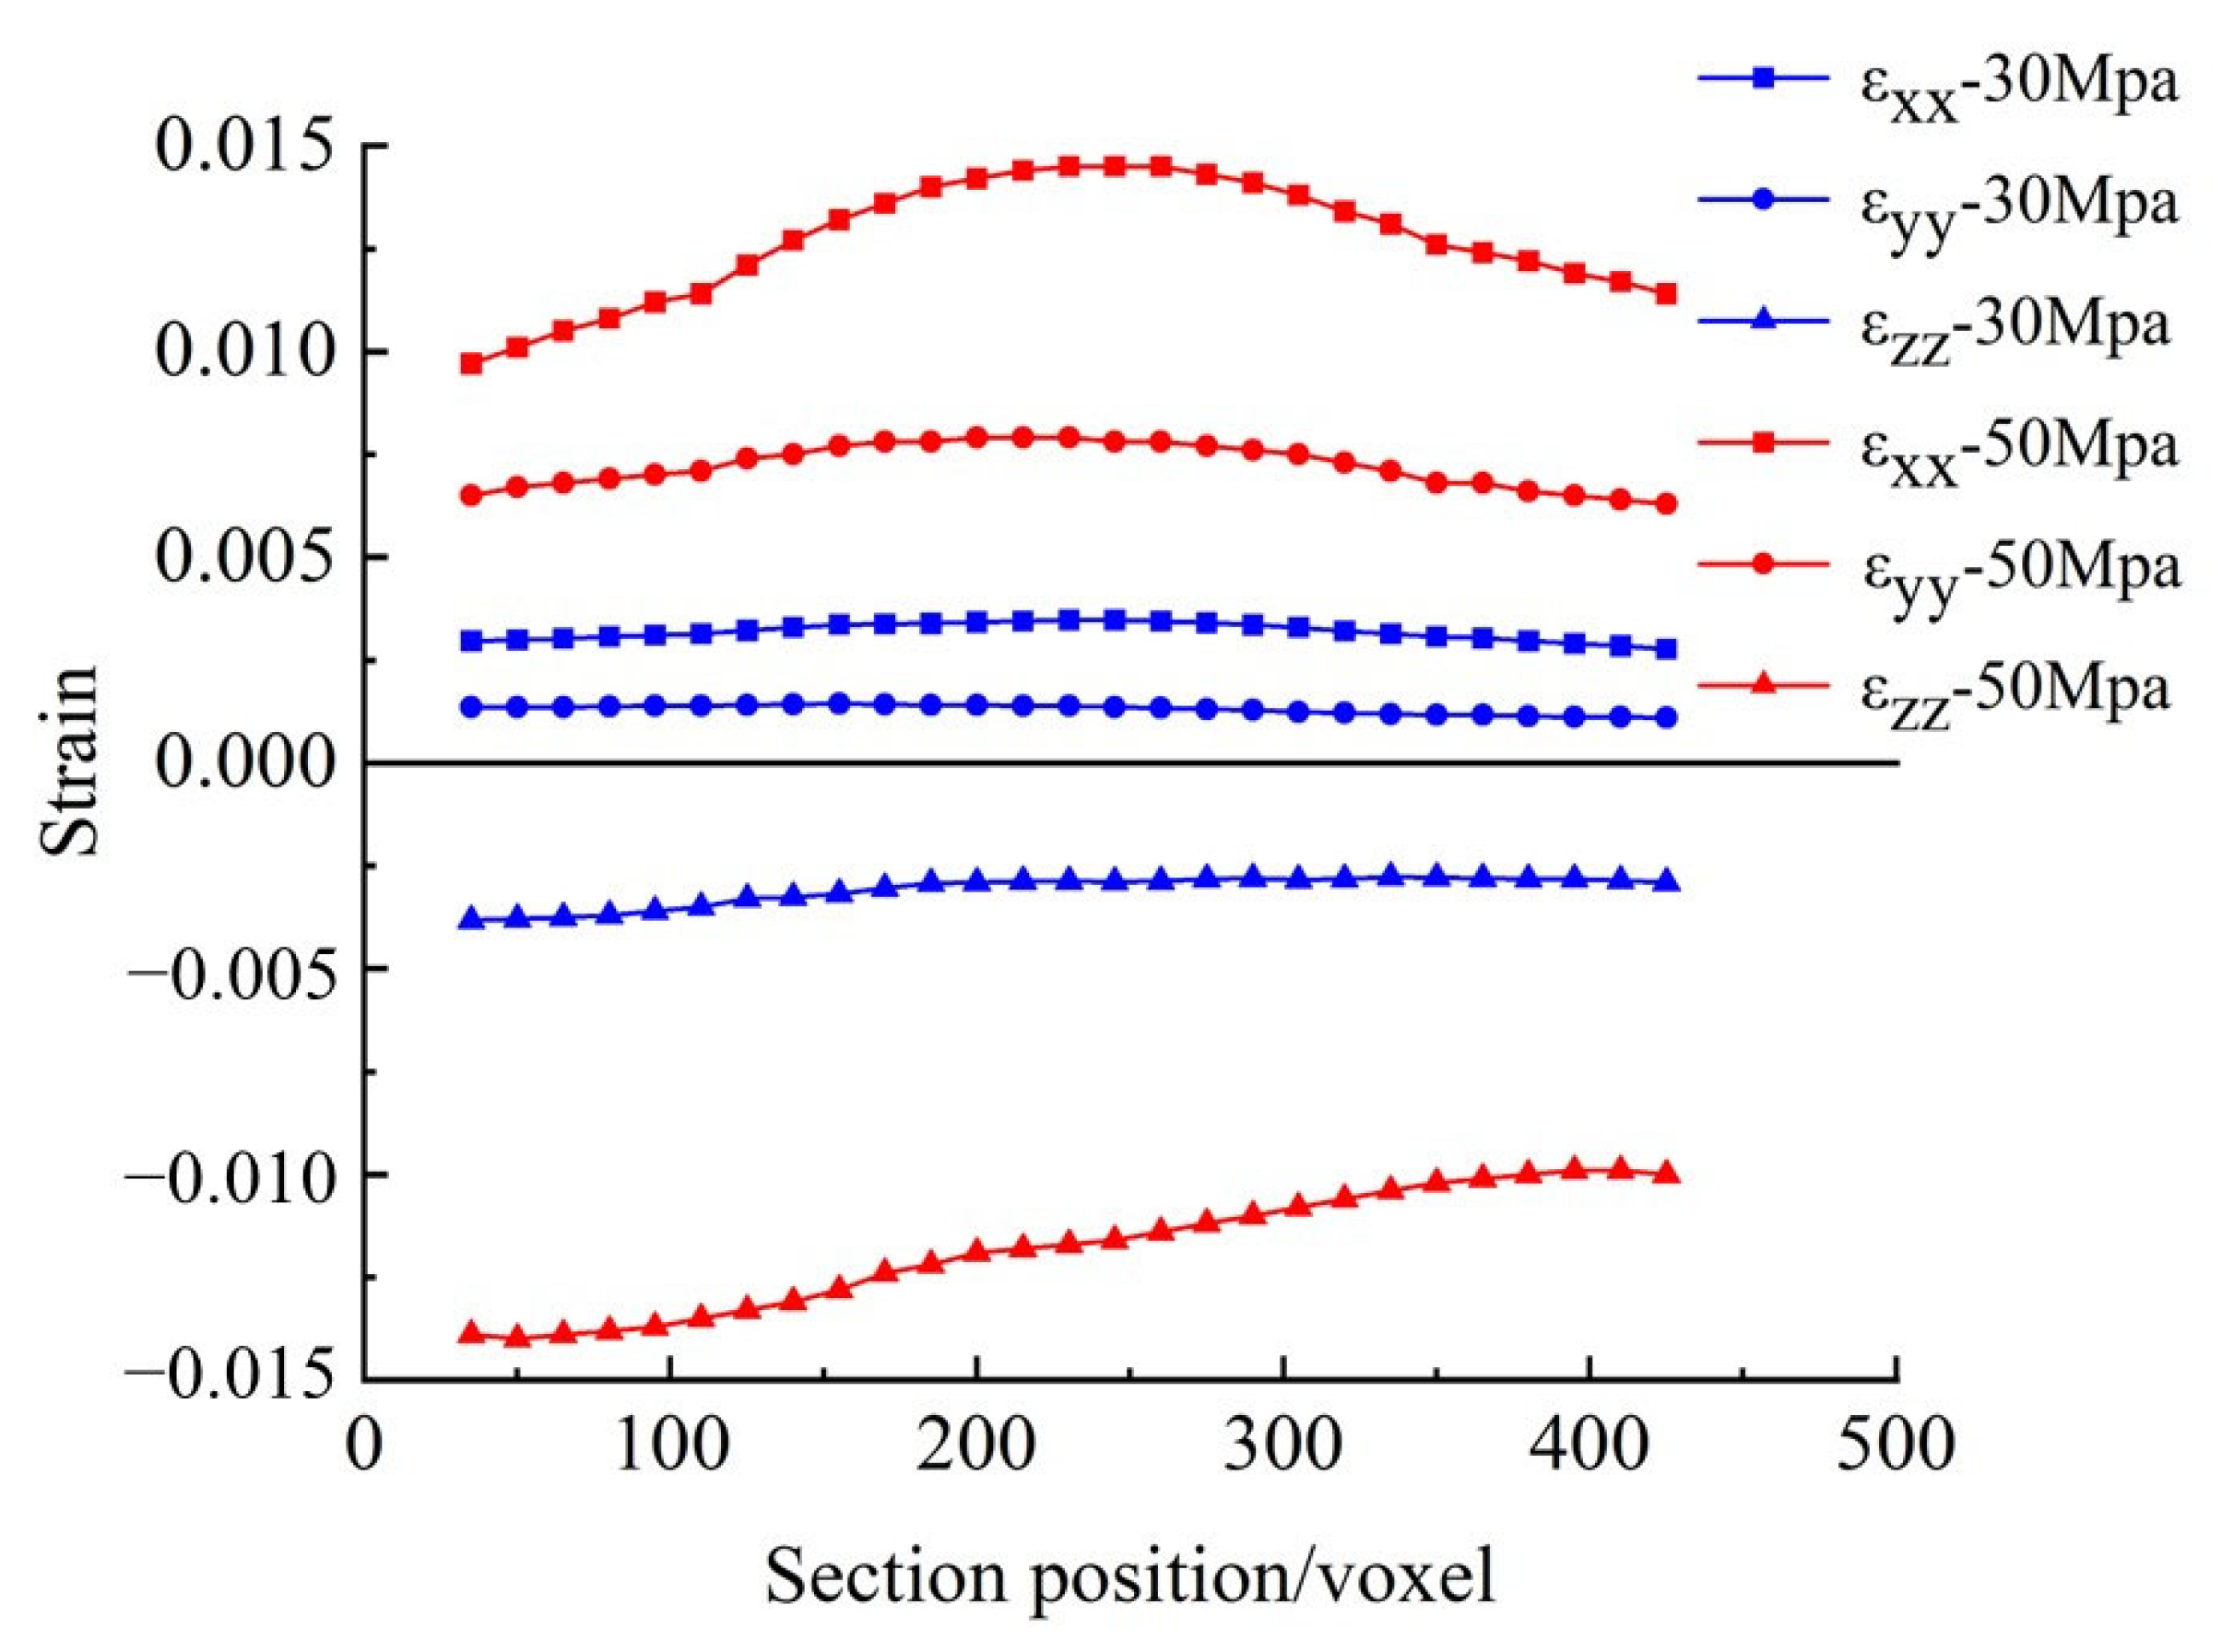
The sections along the z-axis were selected, and the strain distributions at different sections were analyzed according to the three principal strain components εxx, εyy, and εzz, as shown in Figure 11. The strain components εxx and εyy under different stresses are mainly positive, indicating that the specimen expands and produces tensile strain in both X- and Y-directions. The strain distribution curves of εxx and εyy do not coincide, and with the increase in stress, the distance between the two curves became further and further. The curves of εxx and εyy are close to the horizontal line under 30 MPa, indicating that the strain develops evenly along two directions. When the stress increases to 50 MPa, the curve along the X-direction shows an obvious fluctuation, and the strain develops unevenly. The values of εzz along the loading direction are all negative, indicating that the specimen produces compressive strain in this direction. It can be seen from the figure that the εzz curves under different stresses are not tending to a horizontal line, and the deformation of each section is not consistent. With the increase in stress, the strain heterogeneity becomes more obvious, which further indicates that the stress distribution is not uniform and that eccentric compression occurred in the loading process.

3.2.2. Maximum Principal Strain

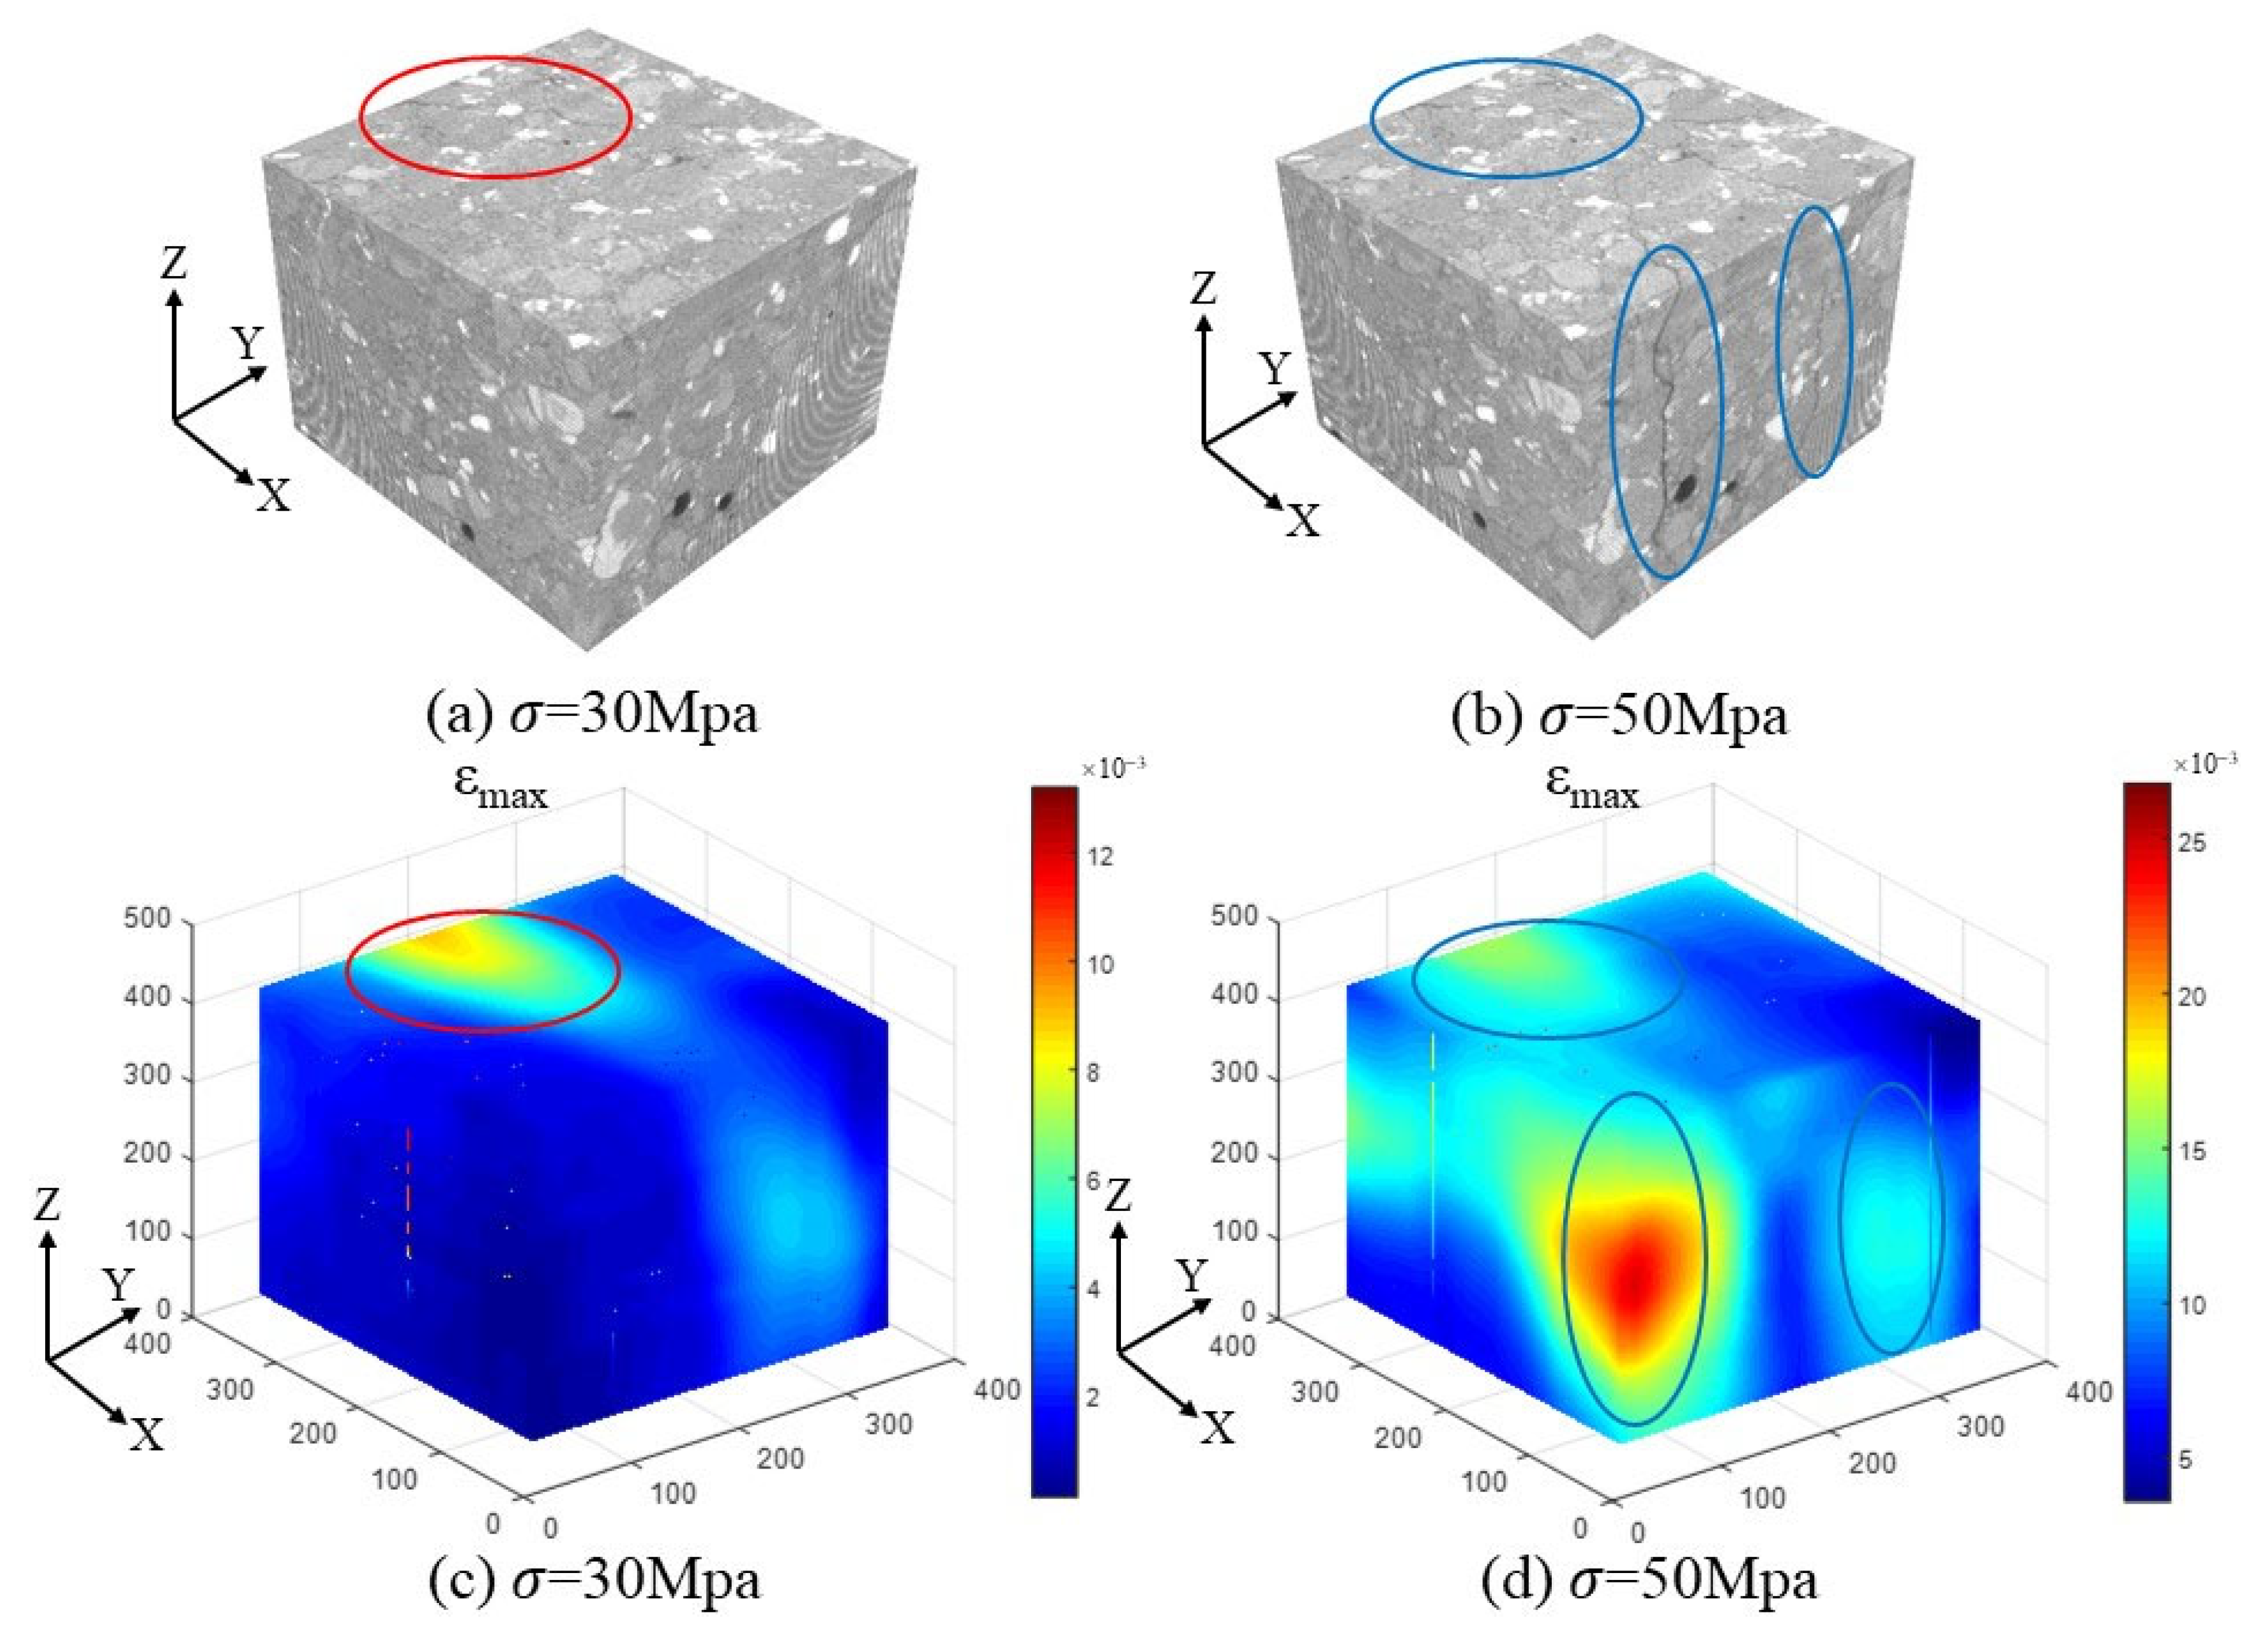
The 3D original CT images taken under different stress levels are shown in Figure 12a,b. The distribution of the maximum principal strain calculated by DVC is shown in Figure 12c,d. The strain values are all positive, indicating that the maximum principal strain inside the specimen is tensile strain. The small cracks appeared on the upper surface of the specimen under 30 MPa (marked in a red circle in Figure 12a), and no significant changes were observed in other positions. The strain map (Figure 12c) shows that the overall strain distribution is relatively uniform, but the obvious yellow concentration area of the strain appears at the edge of the upper surface (marked in a red circle in Figure 12c). When the stress increased to 50 MPa, multiple obvious cracks appeared (marked in a blue circle in Figure 12b). The localized strain area responded to low stress, continued to develop under high stress (marked in a blue circle in Figure 12d), and the strain localization area increased significantly and distributed randomly. To sum up, the specimen will eventually generate macroscopic cracks along with larger tensile deformation; the position of the cracks is consistent with strain localization.
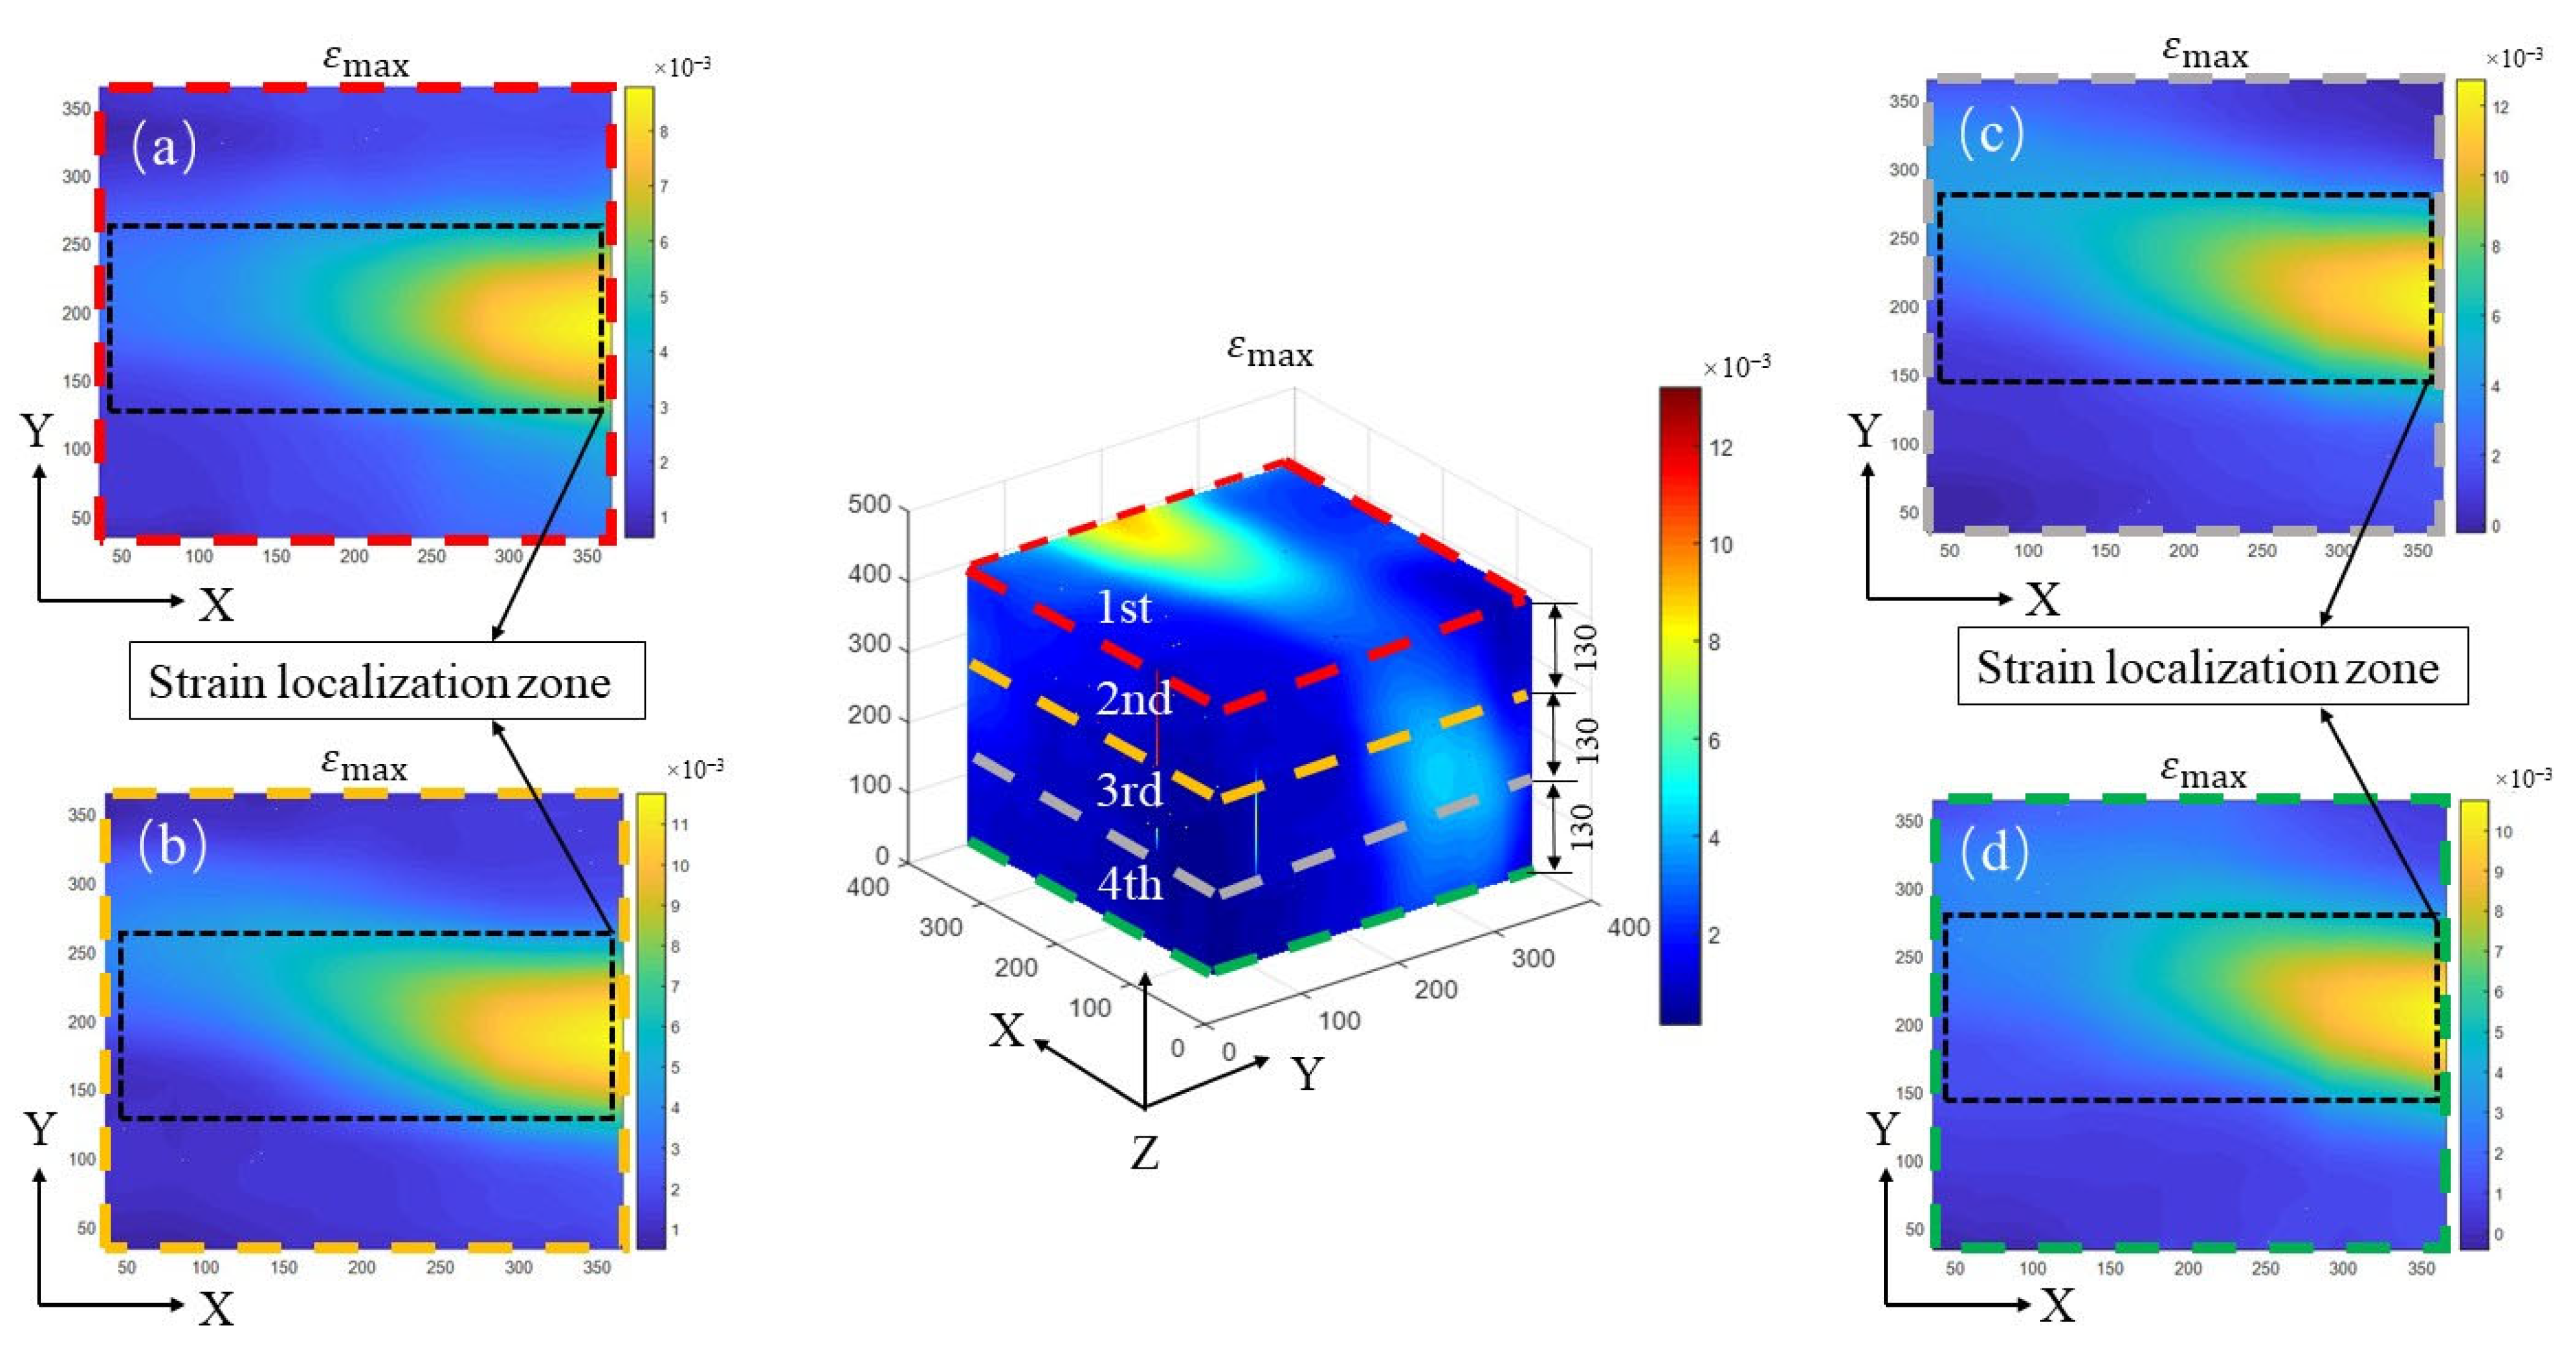
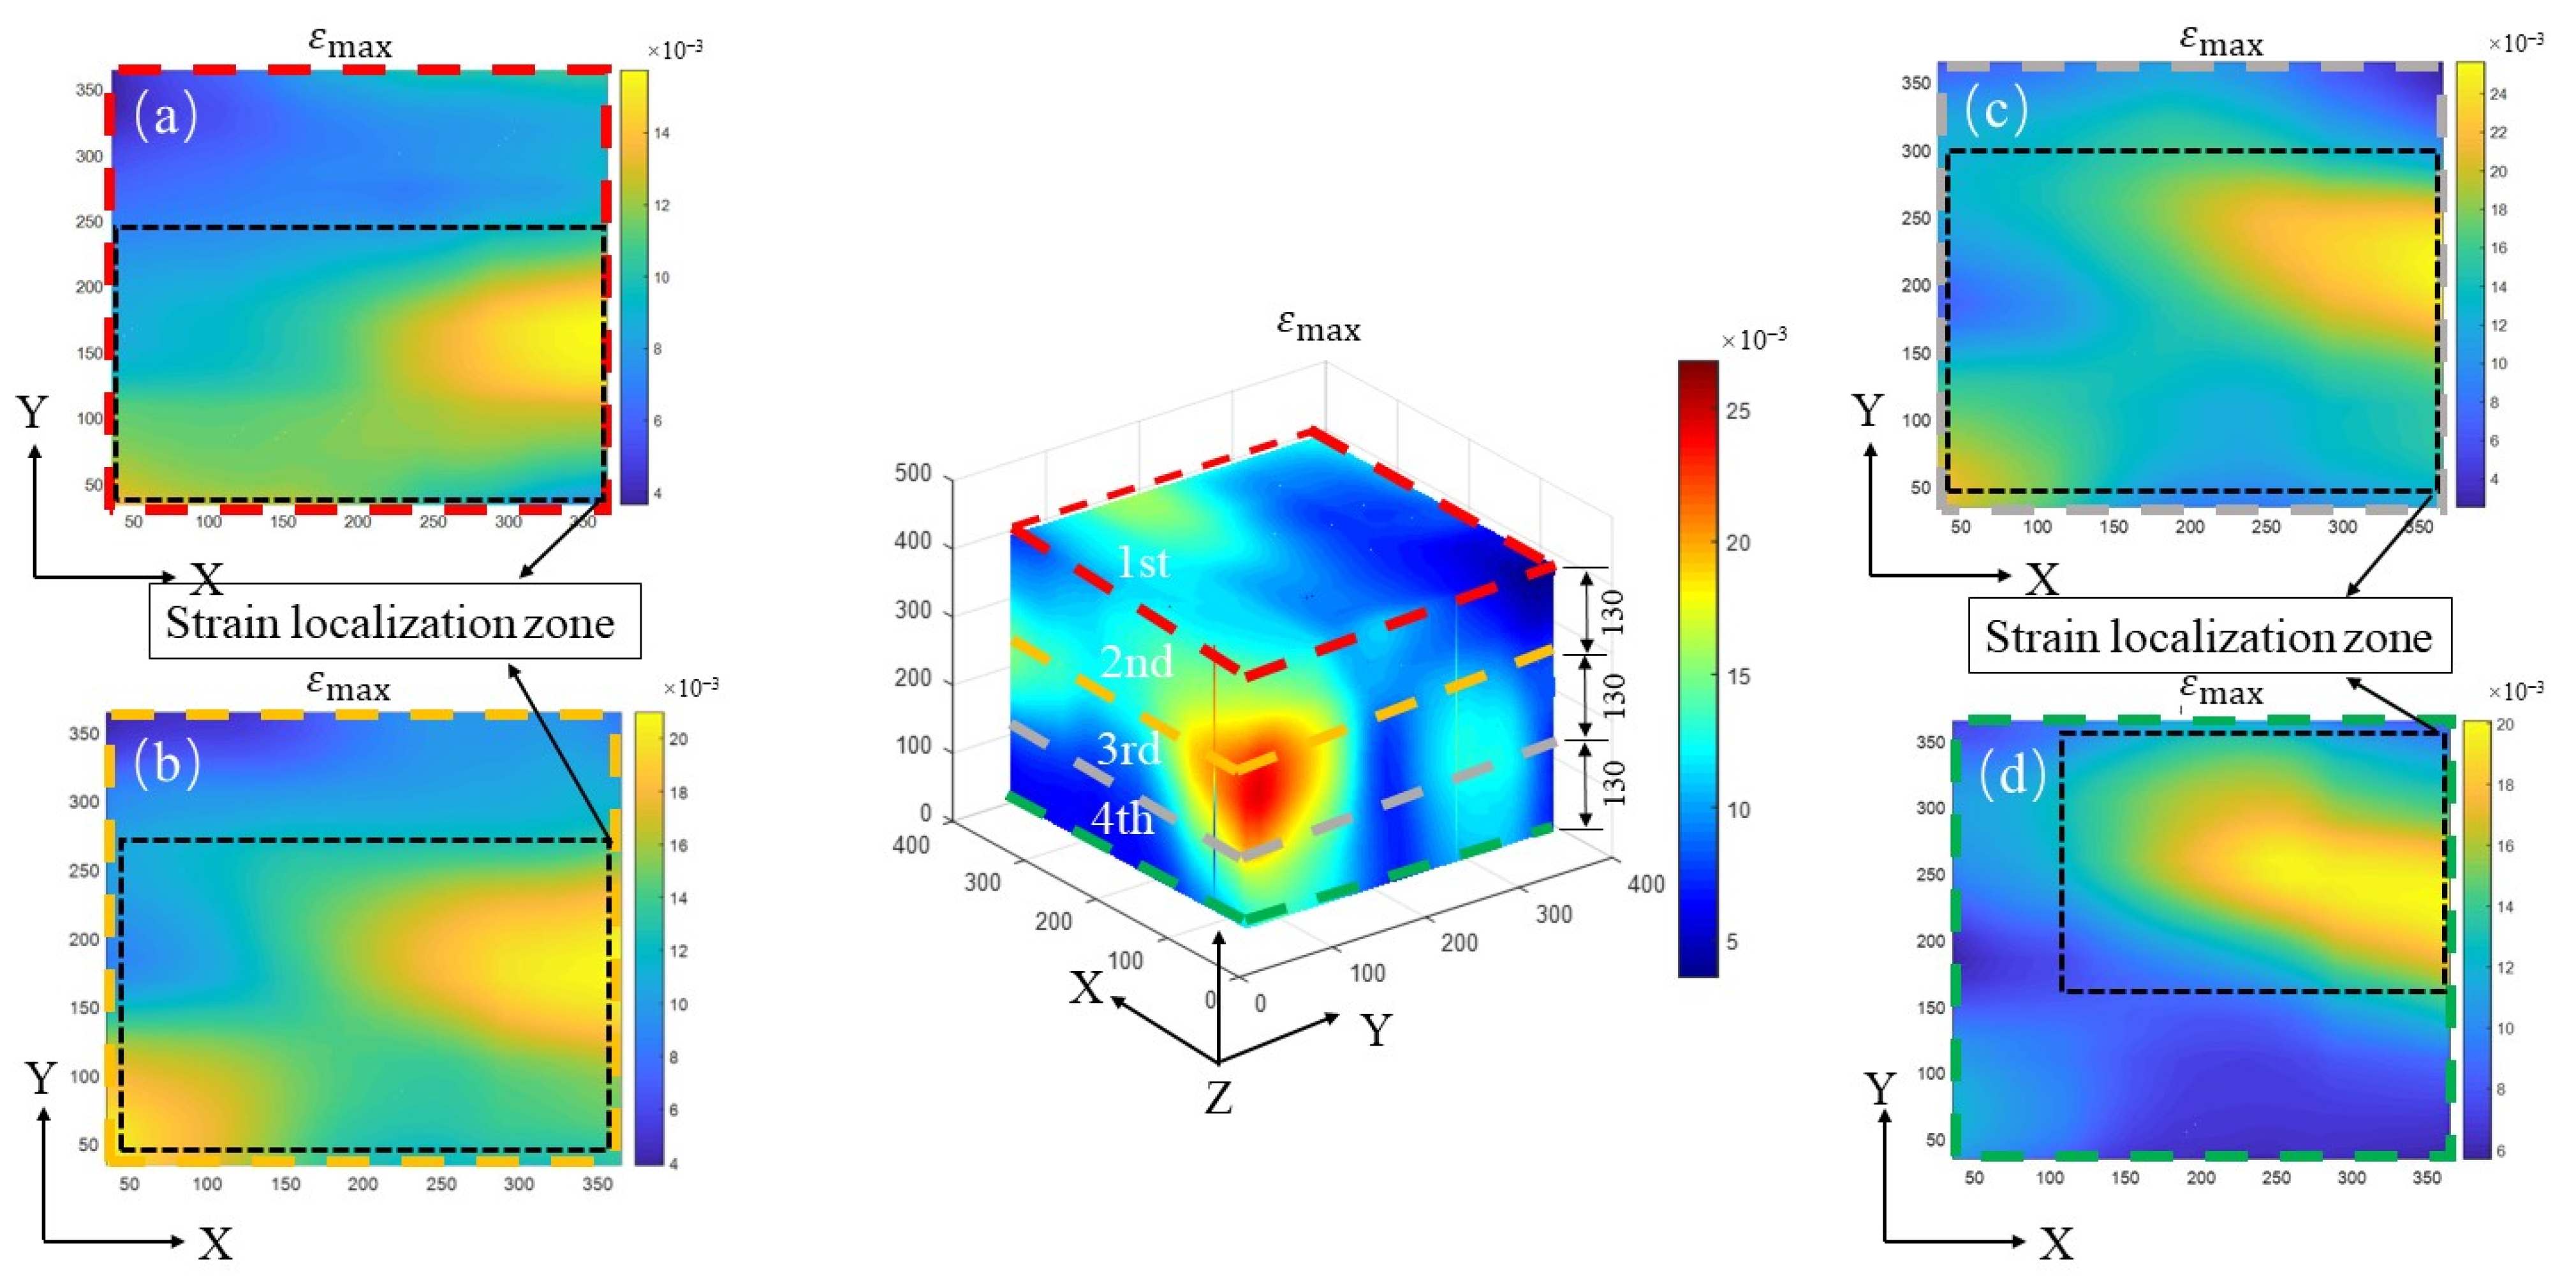
The distribution of the 2D maximum principal strain at different section positions along the Z-direction under 30 MPa and 50 MPa are shown in Figure 13 and Figure 14. Figure 13a–d show that obvious strain localization zones appear inside the specimen, but the strain localization positions of different sections are not completely consistent, and the development direction and strain values of the localization zones are significantly different. From top to bottom along the Z-axis, as shown in Figure 14a–d, the strain localization zone gradually moves upward from the middle position, and the maximum principal strain value near the middle section (Figure 13 and Figure 14b,c) is higher than the upper and lower surfaces. This phenomenon may be caused by the different response to stress, due to the heterogeneous internal structure of cement-based materials. Comparing Figure 14 with Figure 13, the existing strain localization zones in the specimen significantly expand, the new strain concentration zones appear, and the maximum principal strain values all increase.

3.2.3. Damage Estimate

It is evident from the analysis of Section 3.2.1 that the crack distribution area and the maximum principal strain calculated by DVC have a good correlation. So, the evaluation of internal damage is based on the relationship between the amount of damage and the maximum principal strain inside the specimen. According to the literature [29], the damage index is defined as Equation (2):
D = i E m a x A i | E m a x > 0 i A i
where D is the damage index; Emax is the maximum principal strain of the sub-volume, and the region is defined by a step size of 15 voxel; and Ai|Emax > 0 refers to the positive maximum principal strain area.
The variation in the CT image gray value can also be used as a basis for evaluating the damage. As described in Section 2.3.2, the gray value will change with the variation in the material density. As cracks form in the specimen under stress, the gray value decreases. The gray values of CT images used for DVC calculation range from 0 to 255.
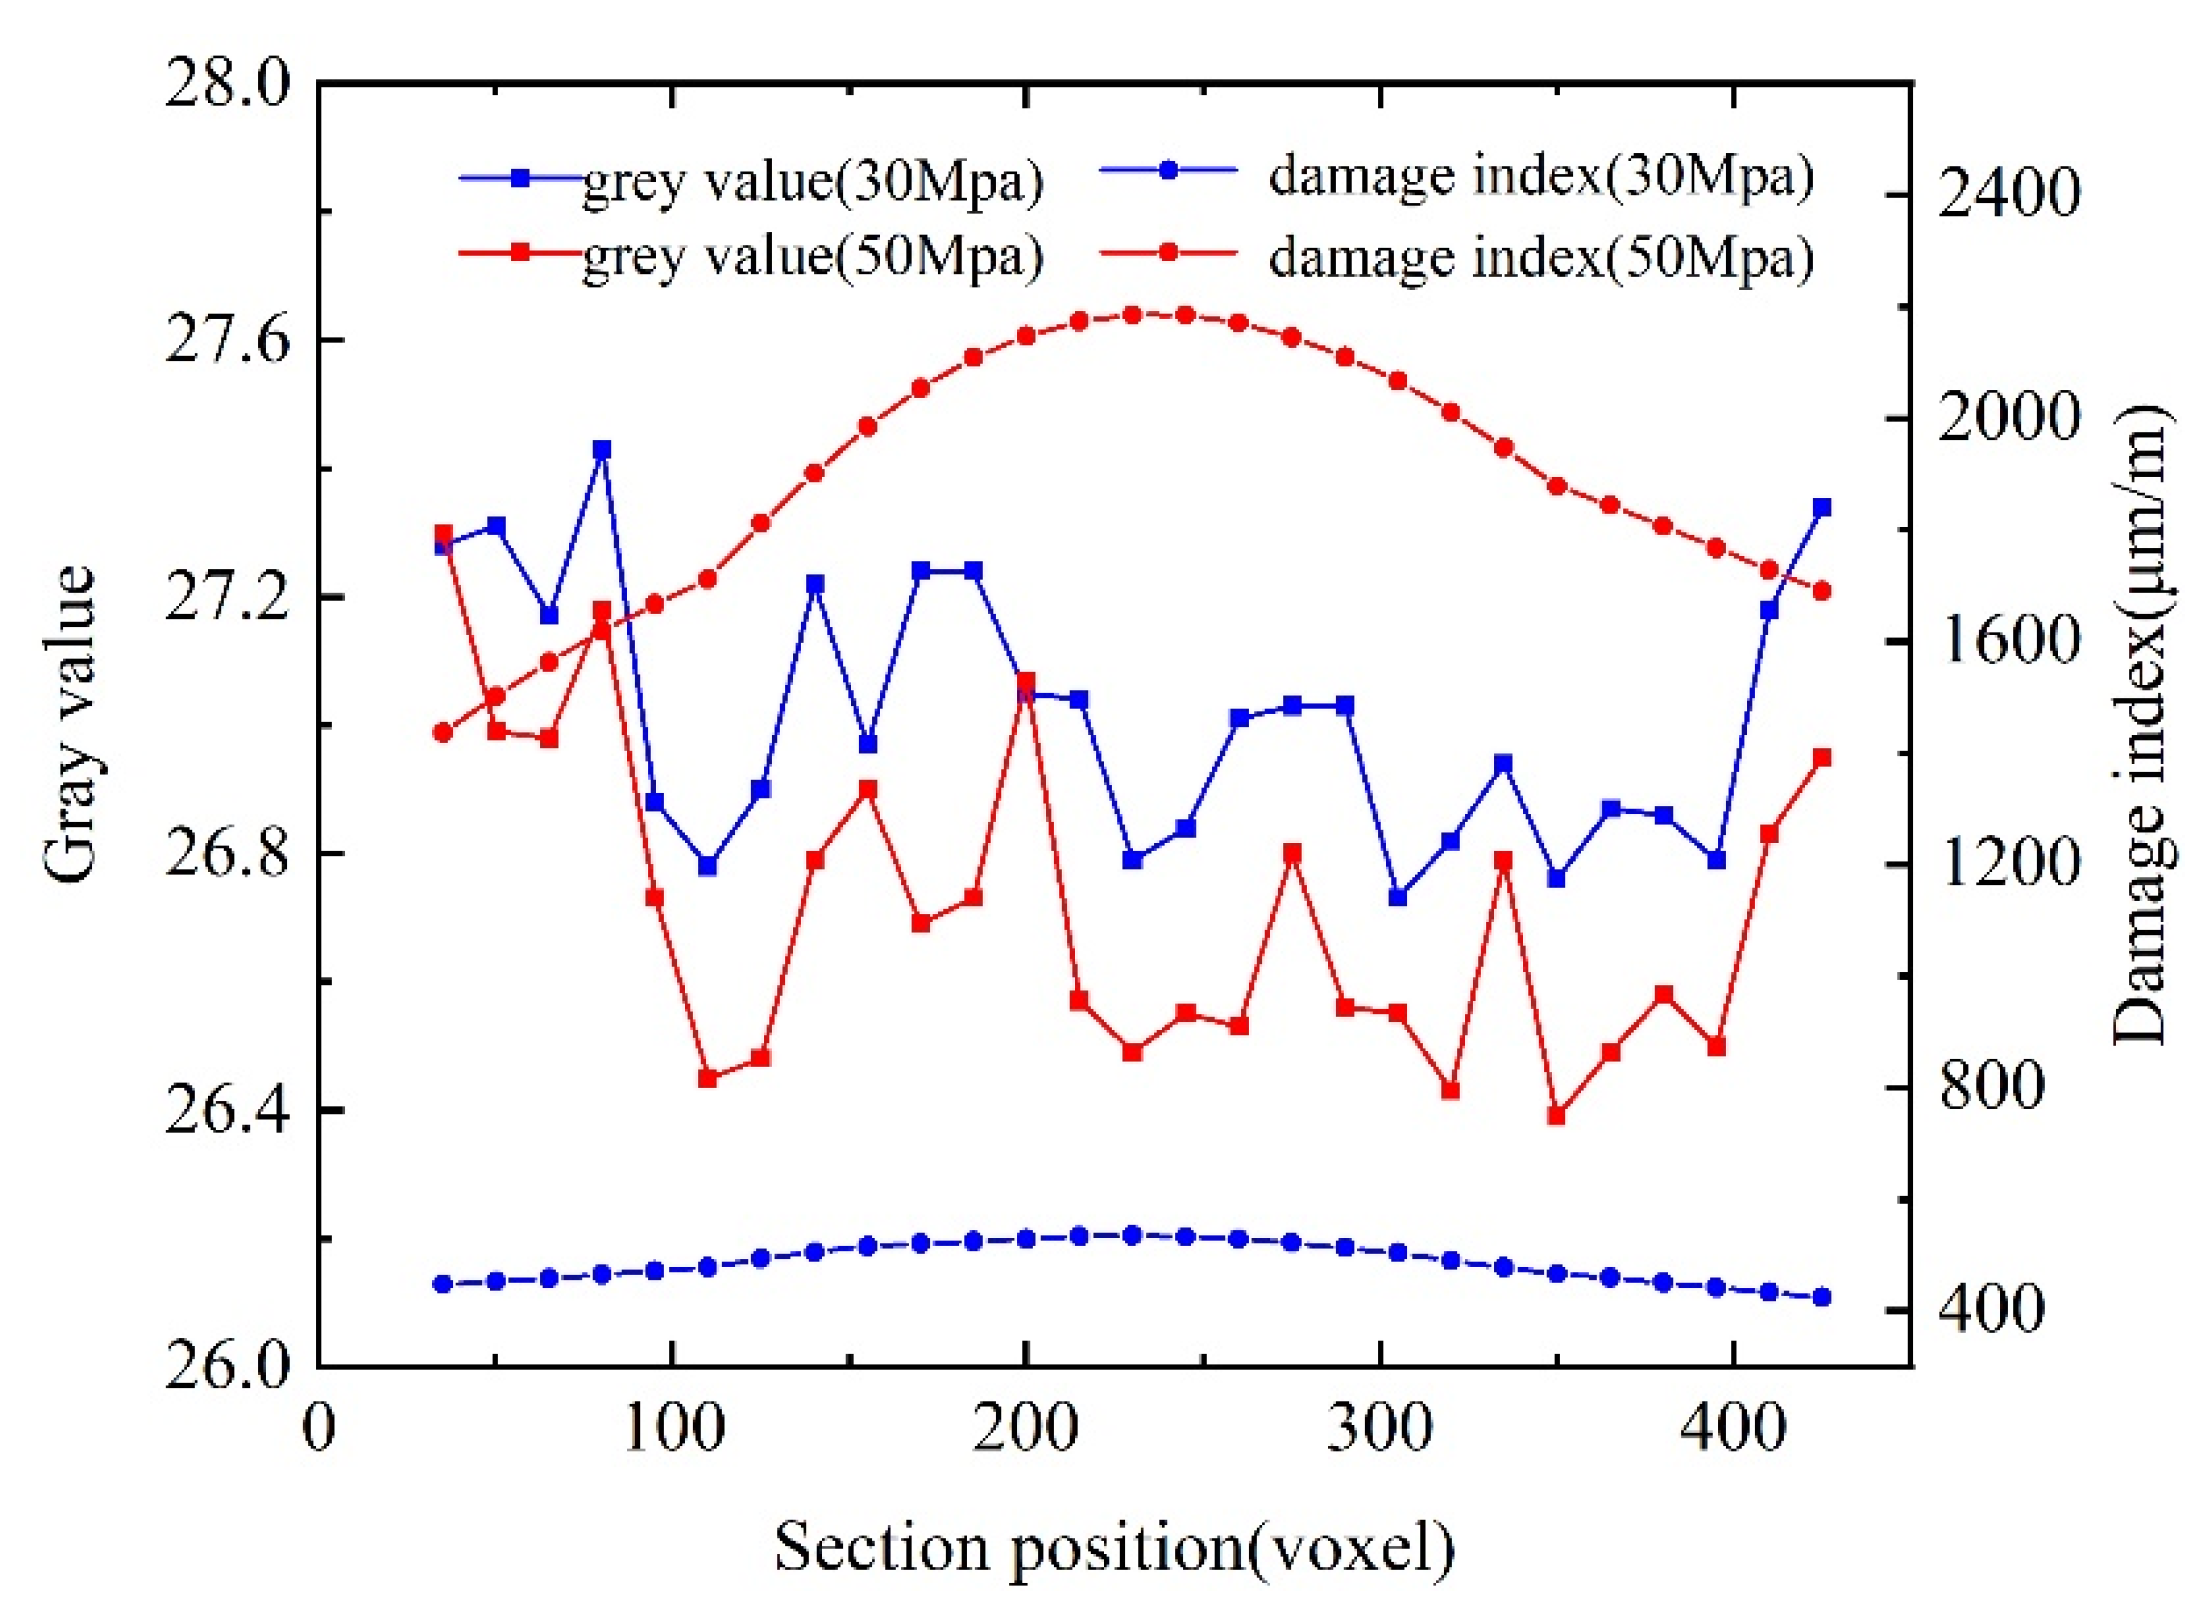
The gray value and damage index at different sections of the specimen are shown in Figure 15. It can be seen from the figure that gray values under different stresses are serrated, which is caused by the uneven distribution of materials with different densities inside the specimen. The gray value and damage index under 50 MPa are significantly lower than 30 Mpa, which indicates that the specimen density decreased, and small cracks began to form as the stress increased. It is worth mentioning that the gray value and damage index of the middle position of the specimen differ greatly under different stress states, while those of the two ends differ little, indicating that the localized damage of the central position is more serious.

3.2.4. Localization Factor

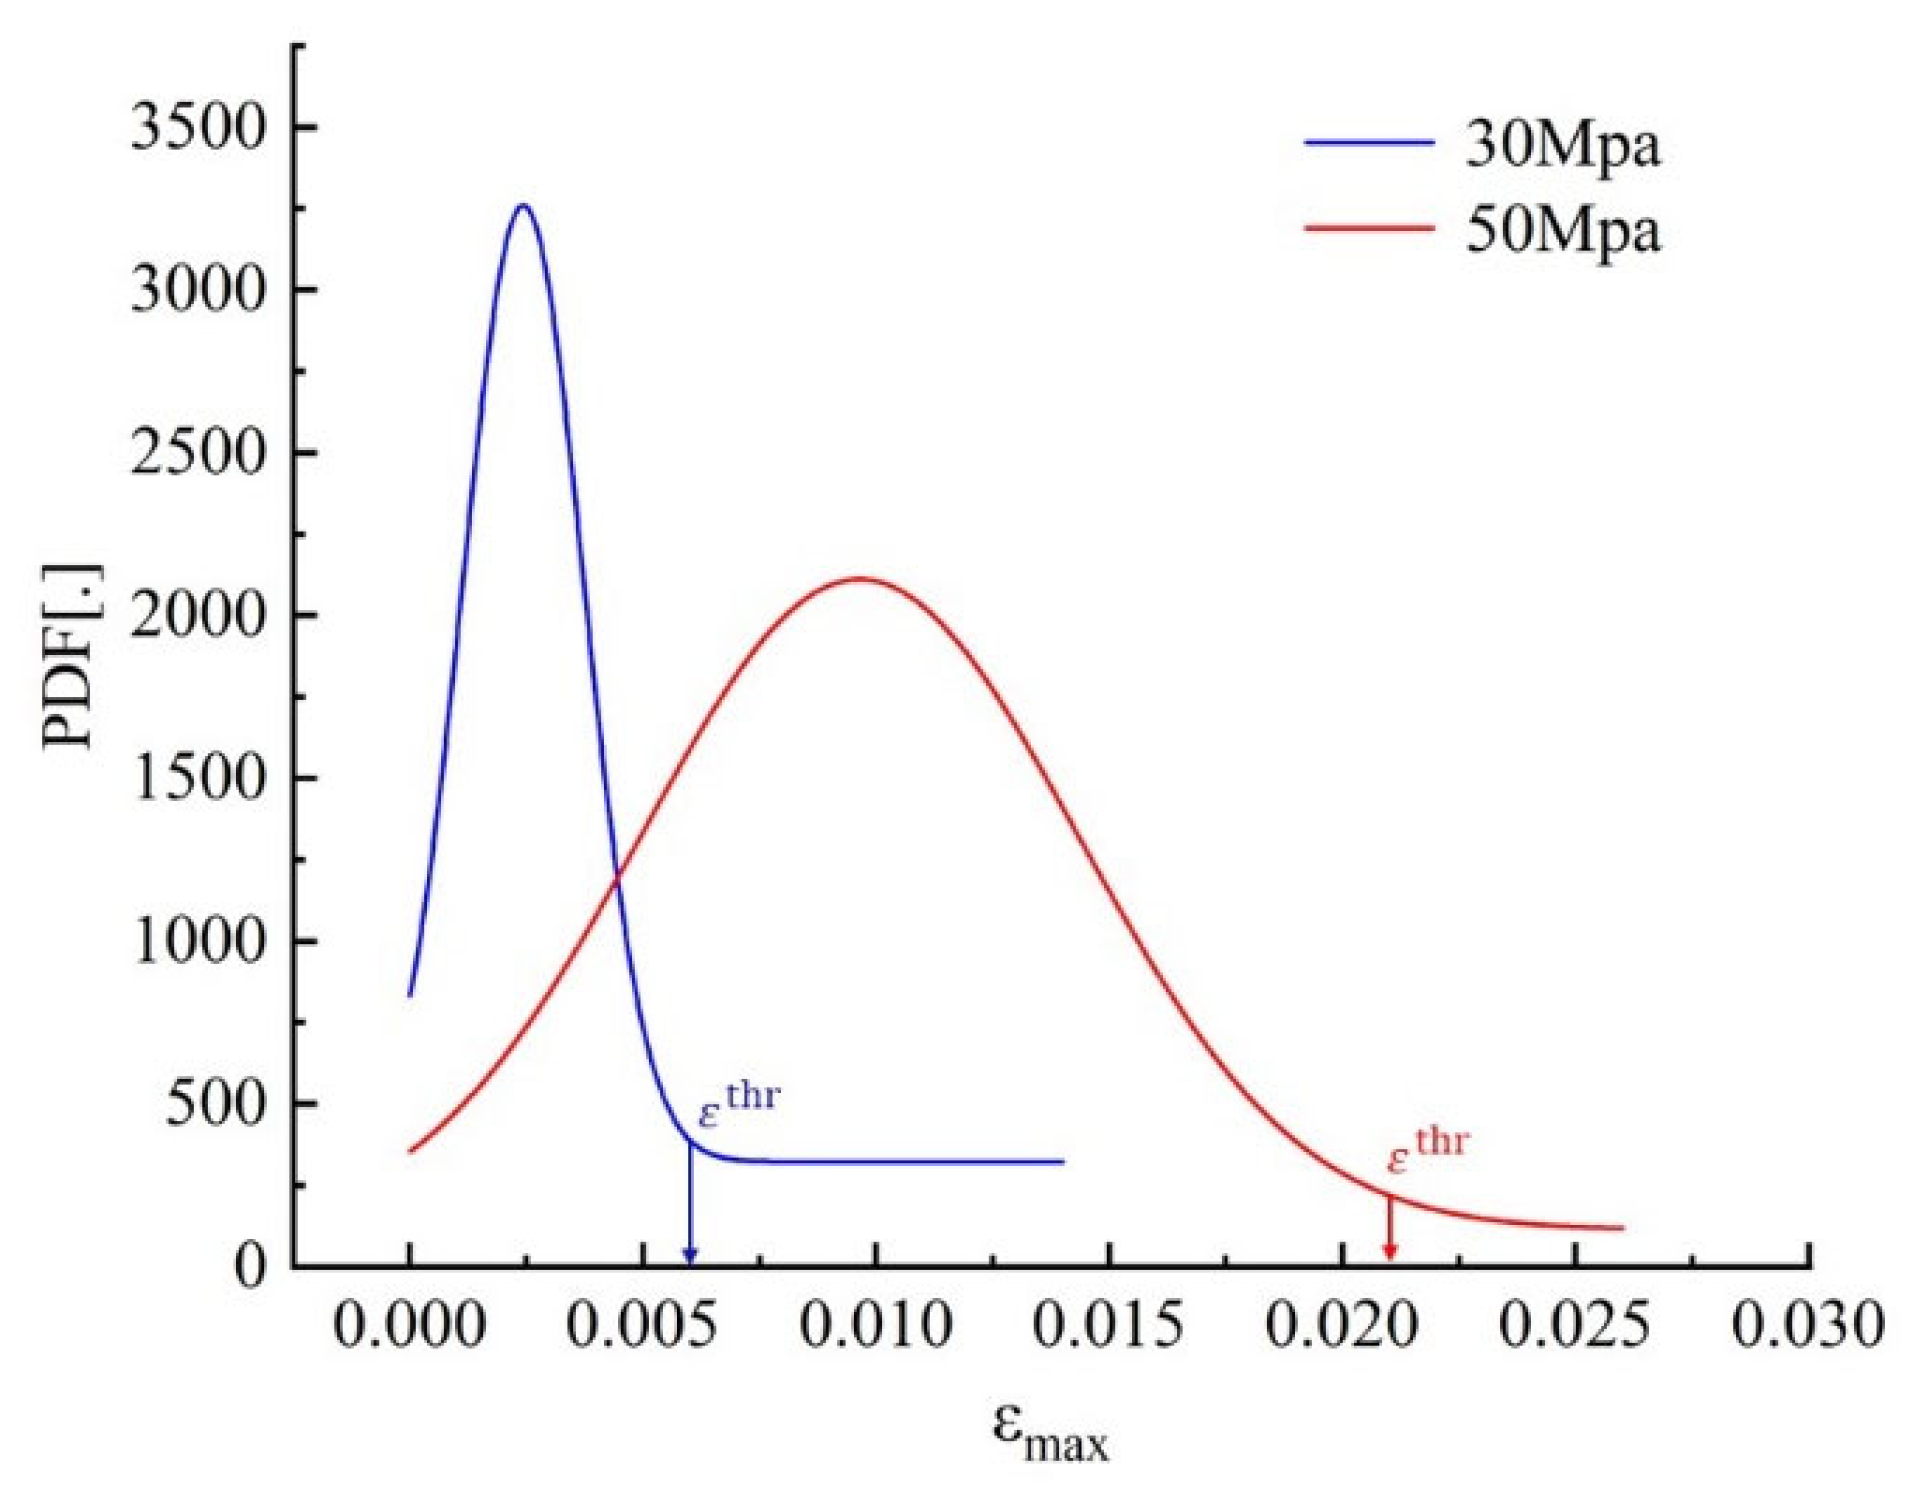
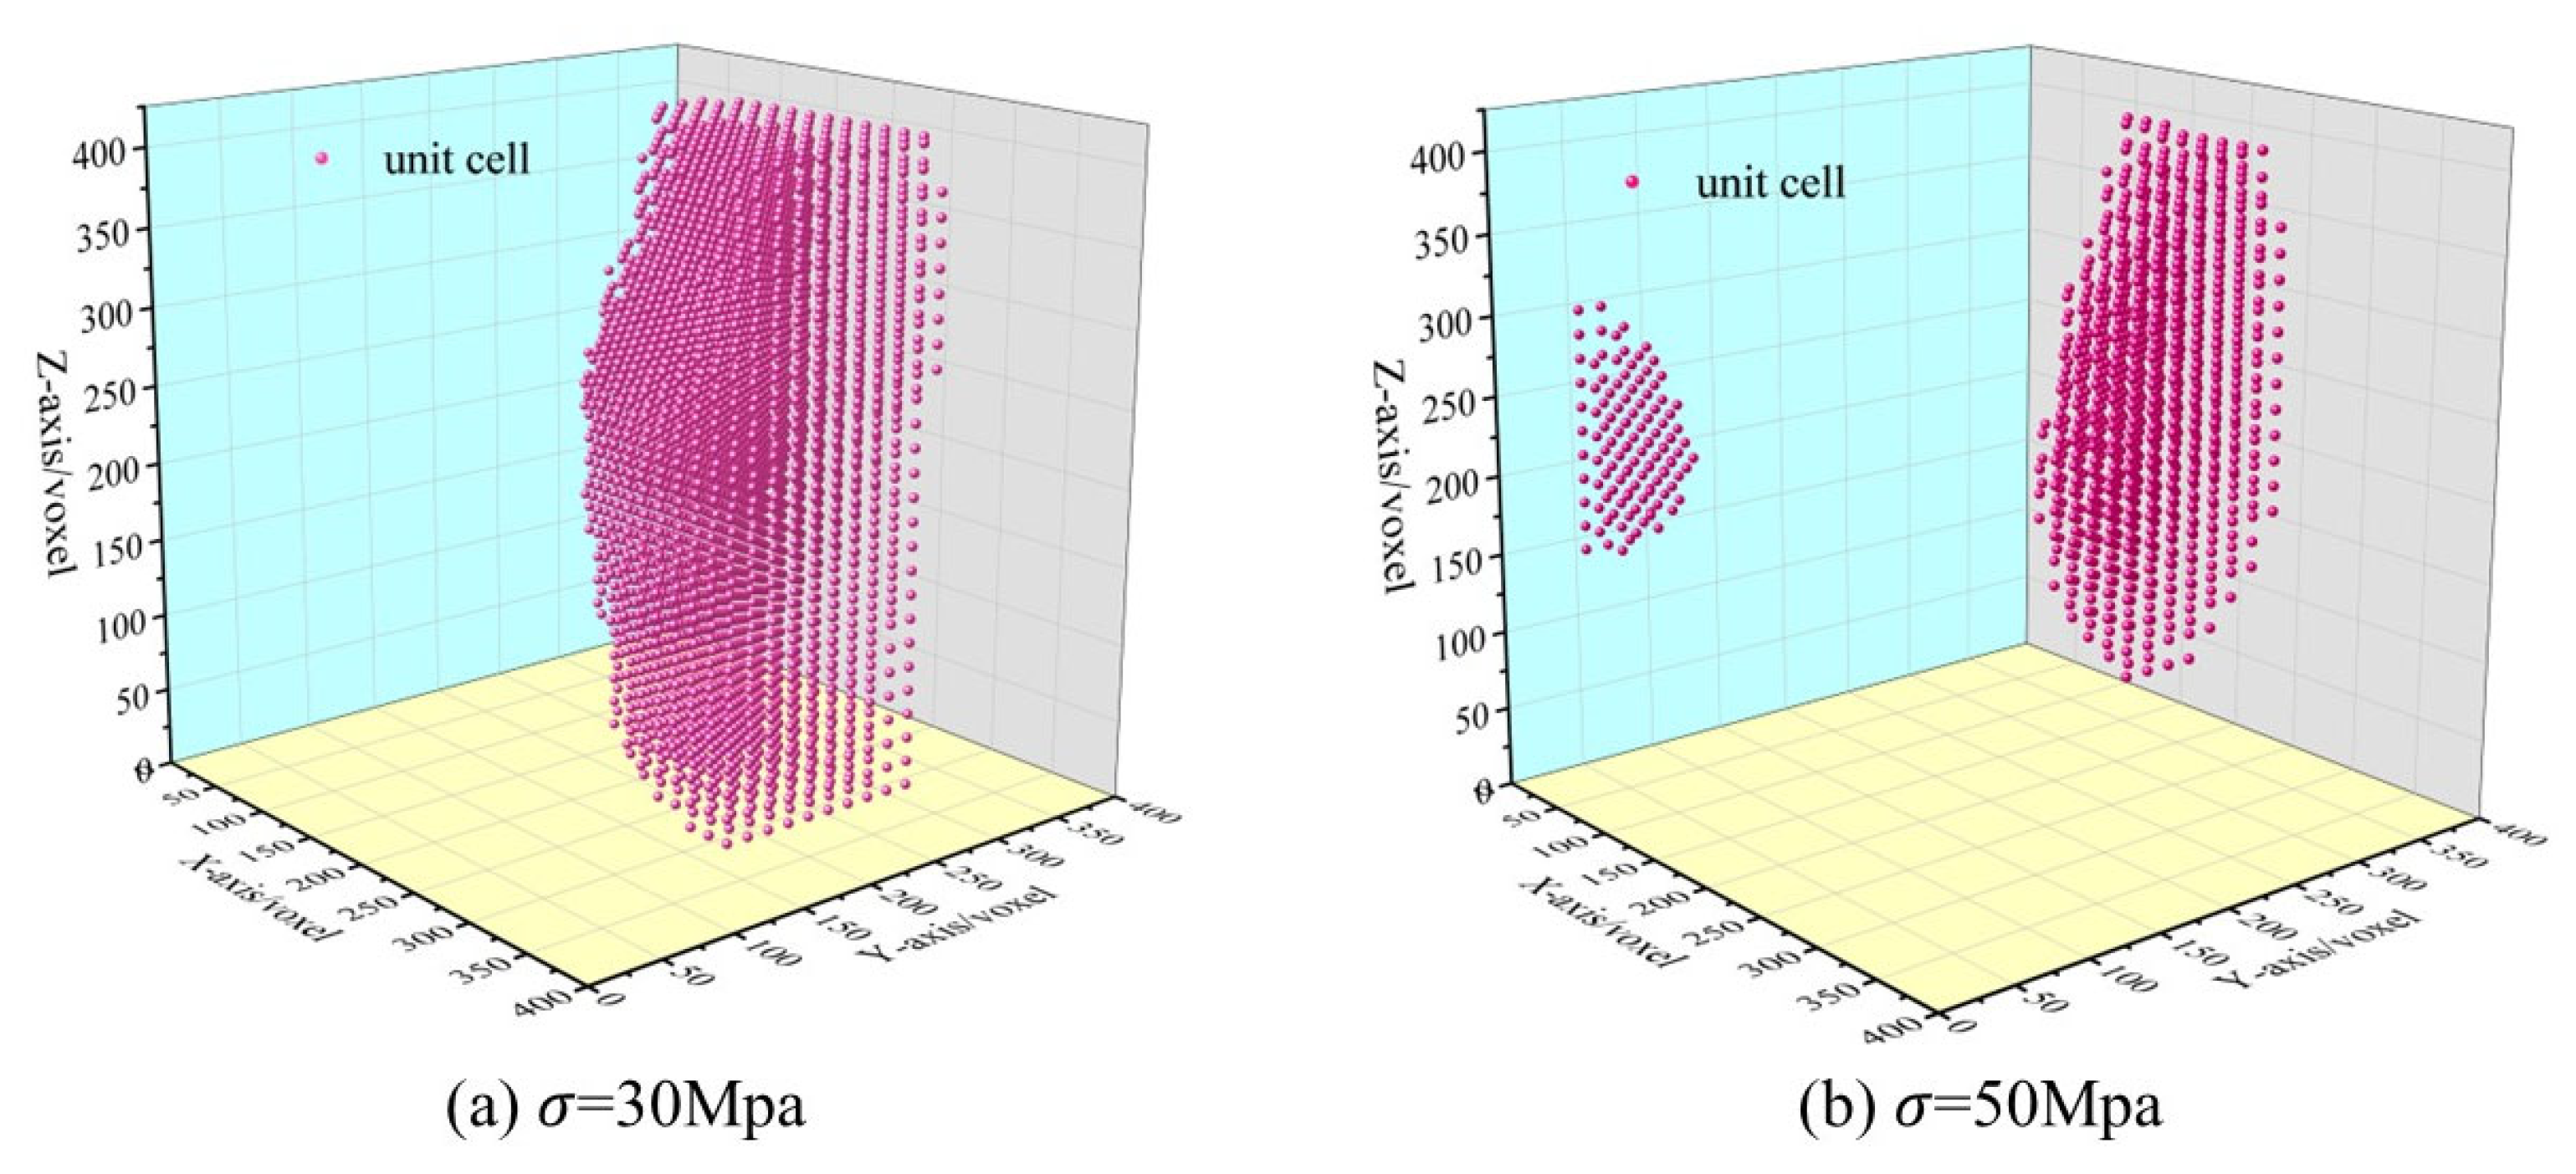
It can be summarized from the analysis in Section 3.2.2 that the internal damage of the specimen is ultimately caused by the large maximum principal strain. Therefore, the distribution range of the maximum principal strain of all units is analyzed by the probability density function, as shown in Figure 16. The maximum principal strain has a narrow distribution range under 30 MPa, and the strain values concentrate in the range of 0–0.006, indicating that most areas inside the specimen are in the stage of small deformation. When the stress increases to 50 MPa, the distribution range of the maximum principal strain becomes wide and presents a normal distribution, indicating that the deformation of the specimen develops further. These arbitrary values of the specimen were selected to correspond to approximately 90% of the cumulative distributions as the strain threshold [30]. εthr = 0.006 and εthr = 0.021 were selected as the strain thresholds under 30 MPa and 50 MPa, respectively. Strains with εmax > εthr will be referred to as “high-magnitude strains”. It can be seen from Figure 16 that the number of high-amplitude strains under different stress states is small; however, these strains are the main impact factor in forming strain localization.
Figure 17 presents the space distributions of high-magnitude strains under different stress stages. When the stress is 30 MPa, there are many units with high-amplitude strain, and their distribution is relatively uniform, as shown in Figure 17a. With the increase in stress, the number of high-amplitude strain units decreases. The positions of some units are roughly the same as those at 30 MPa; otherwise, high-amplitude strain units also appear within the range of 150–300 voxels near the z-axis, as shown in Figure 17b, indicating that prominent localized damage occurred in the specimen at this time. This phenomenon corresponds to the failure process of the specimen. The high-amplitude strain is mainly caused by cracks inside the specimen. Therefore, the spatial distribution of the high-amplitude strain unit can reflect the failure process of the specimen under uniaxial compression.
The coordinate position of high-amplitude strain units was analyzed, and a correlation coefficient [31,32] was introduced as Equation (3):
C x y z = | i = 1 n ( x i x ¯ ) ( y i y ¯ ) ( z i z ¯ ) | i n ( x i x ¯ ) 2 i n ( y i y ¯ ) 2 i n ( z i z ¯ ) 2
where x ¯ , y ¯ , and z ¯ are the average coordinate values in the X-, Y-, and Z-directions, respectively; n is the number of units.
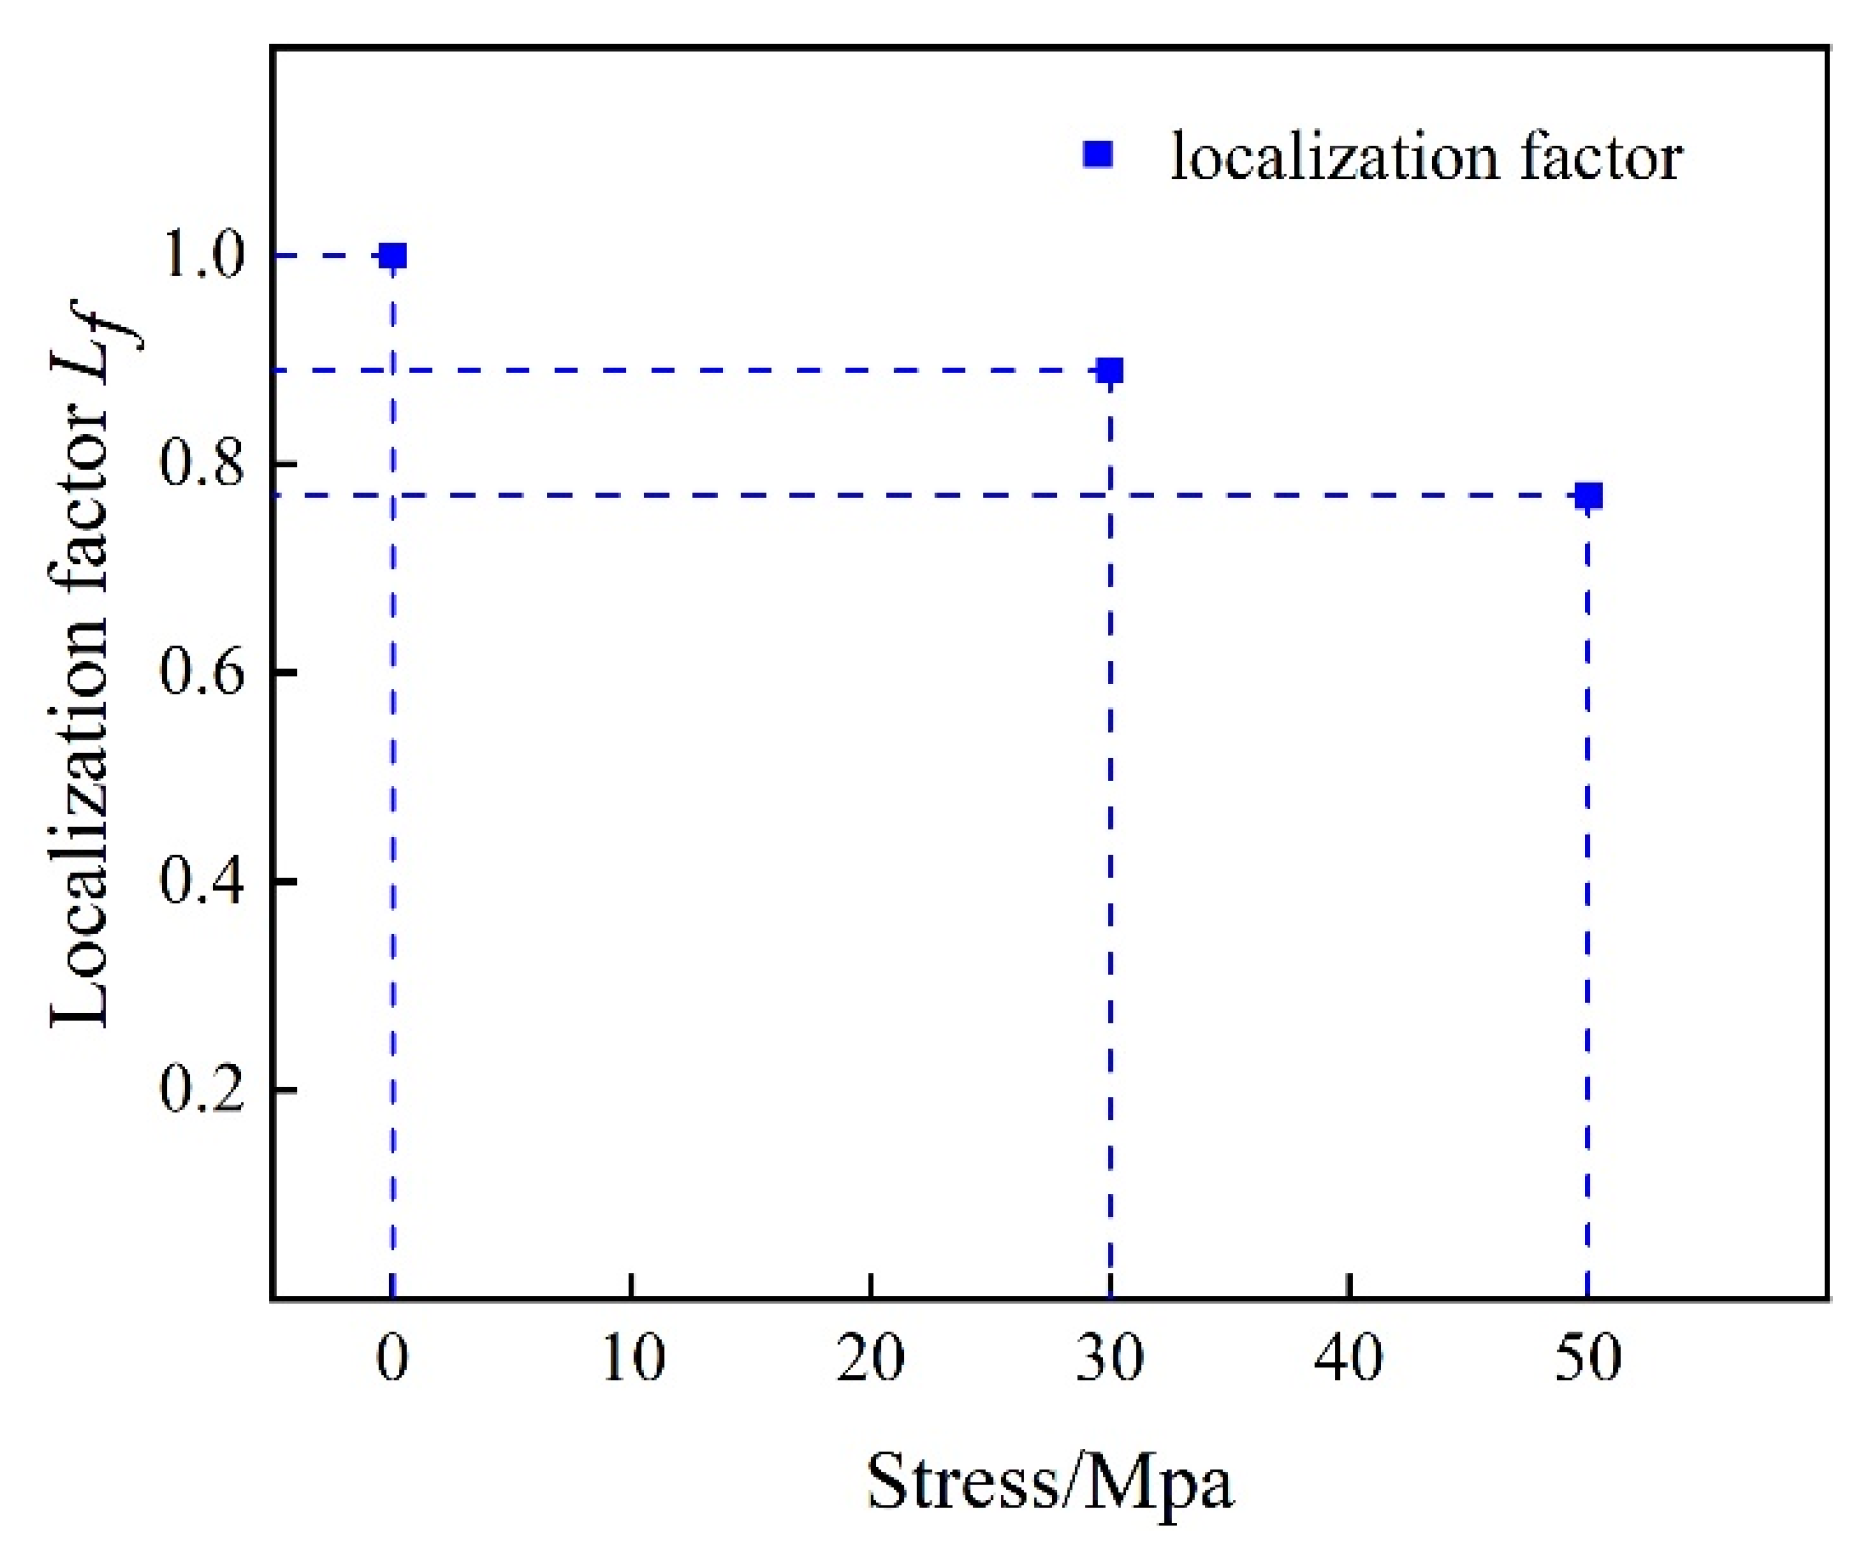
The localization factor was defined as Equation (4):
L f = 1 C x y z
The values of the correlation coefficient and the localization factor ranged within [0, 1]; however, they were inversely proportional. Hence, the larger value of L f , the smaller value of C x y z , and the more dispersed the space distribution of the high-amplitude strain units are, indicating that the damage of the cement mortar was relatively small; otherwise, the smaller the value of L f , the larger the value of C x y z , and the more concentrated the space distribution of the strain units, implying greater damage.
Figure 18 shows how the localization factor changes at different stages of stress. The value of L f was 1 under 0 MPa, indicating that no damage occurred in the mortar at this time. When the stress increased to 30 MPa, the value of L f decreased to 0.89, suggesting that the mortar began to fracture. The value of L f dropped to 0.77 when the stress reached the maximum value, indicating that significant damage occurred, and this failure process is consistent with the results of Figure 17. The value of L f did not approach 0 when the stress reached 50 MPa because the specimen had not completely failed at this time and still had a bearing capacity (Figure 2). The result of L f is in agreement with the experimental phenomenon.

4. Conclusions

In this study, X-ray CT in situ compressive loading in combination with DVC was used to analyze the localized damage behavior of cement mortar. Some valuable observations or findings can be summarized as follows:
(1)
The unhydrated cement in the cement matrix had a significant effect on localized fracture, and cracks expanded along the boundary of the unhydrated cement under compressive loading. Hence, during the use of cement mortar, special attention should be paid to sufficient cement hydration.
(2)
No obvious cracks were observed on the surface of the cement mortar, but the damage inside the specimen was very apparent, and the large damage localization area was also distributed in the material during the compression process, which fully indicated that the internal failure in the material occurred earlier than the surface. However, the damage develops from the inside out, which may be caused by the phenomenon of compression load or bias pressure. Further tests are needed to obtain an accurate conclusion. Cracks inside the cement mortar did not always expand with the increase in the load, and new cracks compressed the original cracks and reduced the width of individual cracks.
(3)
The 3D strain field showed that the cement mortar specimen did not have a uniform distribution of the strain. It is due to the heterogeneity of cement-based materials and the eccentric compression that occurred during loading that this occurred. It should be noted that further testing is needed on samples with parallel planes (without an eccentric effect), which can be referred to as the overall behavior of the material. The maximum principal strain of the specimen was entirely tensile strain, which led to tensile deformation. The increased tensile deformation finally resulted in macrofractures as well. The site of the macroscopic fracture matches the localization of the maximum principal strain. With the increase in stress, the localized region in the specimen expanded and was distributed randomly.
(4)
The gray value of the CT image and the damage index defined by the maximum principal strain could reflect the damage inside the specimen. The damage in the center position was obviously higher than that at the edge of the specimen, indicating that the failure of the specimen was caused by internal damage. The localization factor could effectively reflect the dispersion of the high-magnitude strain element, and the results were consistent with the damage law. The analysis of the gray value, damage index, and localization factor all showed that the failure of the specimen was caused by the internal localized damage. It shows that the study of the internal damage is of great significance to the engineering application of concrete.
(5)
Through X-ray CT in situ loading scanning and DVC calculation, the damage distribution inside the material can be defined, and the direction of damage development can be determined, which can provide a reference for the study of the macroscopic mechanical behavior of cement mortar materials. During the use of cement mortar, we should not only take surface damage as the criterion of failure but also pay attention to the damage inside the material.

Author Contributions

Conceptualization, Y.Z. and Y.X.; formal analysis, N.L.; funding acquisition, Y.Z.; project administration, Y.X. and X.H.; supervision, X.H.; writing—original draft, N.L.; writing—review and editing, N.L. All authors have read and agreed to the published version of the manuscript.

Funding

This research was funded by the National Natural Science Foundation of China (12162025, 11762015), Natural Science Foundation of Inner Mongolia (2021LHMS05010, 2020LH05008), and Scientific Research Project of Universities in Inner Mongolia (NJZY21365).

Institutional Review Board Statement

Not applicable.

Informed Consent Statement

Not applicable.

Data Availability Statement

Not applicable.

Acknowledgments

The authors would like to acknowledge Bing Pan (Beihang University) for his help of DVC calculation and constructive comments.

Conflicts of Interest

The authors declare no conflict of interest.

References

  1. Paliwal, B.; Ramesh, K. An interacting micro-crack damage model for failure of brittle materials under compression. J. Mech. Phys. Solids 2008, 56, 896–923. [Google Scholar] [CrossRef]
  2. Nemati, K.M. Fracture analysis of concrete using scanning electron microscopy. Scanning 1997, 19, 426–430. [Google Scholar] [CrossRef]
  3. Litorowicz, A. Identification and quantification of cracks in concrete by optical fluorescent microscopy. Cem. Concr. Res. 2006, 36, 1508–1515. [Google Scholar] [CrossRef]
  4. Li, D.; Huang, P.; Chen, Z.; Yao, G.; Guo, X.; Zheng, X.; Yang, Y. Experimental study on fracture and fatigue crack propagation processes in concrete based on DIC technology. Eng. Fract. Mech. 2020, 235, 107166. [Google Scholar] [CrossRef]
  5. Alam, S.; Loukili, A.; Grondin, F.; Rozière, E. Use of the digital image correlation and acoustic emission technique to study the effect of structural size on cracking of reinforced concrete. Eng. Fract. Mech. 2015, 143, 17–31. [Google Scholar] [CrossRef]
  6. Li, N.; Zhao, Y.R. Research Progress of Concrete Internal Damage Based on X-ray CT Technology. Mater. Rev. 2021, 35, 21169–21177. [Google Scholar]
  7. Wang, Y.; Li, C.; Hou, Z.; Yi, X.; Wei, X. In Vivo X-ray Computed Tomography Investigations of Crack Damage Evolution of Cemented Waste Rock Backfills (CWRB) under Uniaxial Deformation. Minerals 2018, 8, 539. [Google Scholar] [CrossRef] [Green Version]
  8. Lei, G.; Han, J.; Dang, F. Using X-Ray CT Scanning to Study the Failure Mechanism of Concrete under Static and Dynamic Loadings. Adv. Mater. Sci. Eng. 2018, 2018, 3019158. [Google Scholar] [CrossRef] [Green Version]
  9. Hong, S.; Liu, P.; Zhang, J.; Xing, F.; Dong, B. Visual & quantitative identification of cracking in mortar subjected to loads using X-ray computed tomography method. Cem. Concr. Compos. 2019, 100, 15–24. [Google Scholar] [CrossRef]
  10. Tian, W.; Han, N. Analysis on meso-damage processes in concrete by X-ray computed tomographic scanning techniques based on divisional zones. Measurement 2019, 140, 382–387. [Google Scholar] [CrossRef]
  11. Yang, Z.-J.; Li, B.-B.; Wu, J.-Y. X-ray computed tomography images based phase-field modeling of mesoscopic failure in concrete. Eng. Fract. Mech. 2019, 208, 151–170. [Google Scholar] [CrossRef]
  12. Wang, H.N.; Wang, C.H.; You, Z.P.; Yang, X.; Huang, Z.H. Characterising the asphalt concrete fracture performance from X-ray CT Imaging and finite element modelling. Int. J. Pavement Eng. 2018, 19, 307–318. [Google Scholar] [CrossRef]
  13. Bay, B.; Smith, T.S.; Fyhrie, D.P.; Saad, M. Digital volume correlation: Three-dimensional strain mapping using X-ray tomography. Exp. Mech. 1999, 39, 217–226. [Google Scholar] [CrossRef]
  14. Xu, F. Quantitative characterization of deformation and damage process by digital volume correlation: A review. Theor. Appl. Mech. Lett. 2018, 8, 83–96. [Google Scholar] [CrossRef]
  15. Yang, Z.; Ren, W.; Sharma, R.; McDonald, S.; Mostafavi, M.; Vertyagina, Y.; Marrow, T. In-situ X-ray computed tomography characterisation of 3D fracture evolution and image-based numerical homogenisation of concrete. Cem. Concr. Compos. 2017, 75, 74–83. [Google Scholar] [CrossRef] [Green Version]
  16. Huang, Y.; Yang, Z.; Ren, W.; Liu, G.; Zhang, C. 3D meso-scale fracture modelling and validation of concrete based on in-situ X-ray Computed Tomography images using damage plasticity model. Int. J. Solids Struct. 2015, 67–68, 340–352. [Google Scholar] [CrossRef]
  17. Wan, K.; Li, G.; Wang, S.; Pang, C. 3D full field study of drying shrinkage of foam concrete. Cem. Concr. Compos. 2017, 82, 217–226. [Google Scholar] [CrossRef]
  18. Mao, L.; Yuan, Z.; Yang, M.; Liu, H.; Chiang, F.-P. 3D strain evolution in concrete using in situ X-ray computed tomography testing and digital volumetric speckle photography. Measurement 2019, 133, 456–467. [Google Scholar] [CrossRef]
  19. Bennai, F.; El Hachem, C.; Abahri, K.; Belarbi, R. Microscopic hydric characterization of hemp concrete by X-ray microtomography and digital volume correlation. Constr. Build. Mater. 2018, 188, 983–994. [Google Scholar] [CrossRef]
  20. Lorenzoni, R.; Curosu, I.; Léonard, F.; Paciornik, S.; Mechtcherine, V.; Silva, F.A.; Bruno, G. Combined mechanical and 3D-microstructural analysis of strain-hardening cement-based composites (SHCC) by in-situ X-ray microtomography. Cem. Concr. Res. 2020, 136, 106139. [Google Scholar] [CrossRef]
  21. Kaczmarczyk, G.P.; Cała, M. Possible Application of Computed Tomography for Numerical Simulation of the Damage Mechanism of Cementitious Materials—A Method Review. Buildings 2023, 13, 587. [Google Scholar] [CrossRef]
  22. Recep, B. Monitoring macro voids in mortar by X-ray computed tomography. Nucl. Instrum. Methods Phys. Res. Sect. A 2008, 59, 459–466. [Google Scholar] [CrossRef]
  23. Gao, J.; Sha, A.; Wang, Z.; Hu, L.; Yun, D.; Liu, Z.; Huang, Y. Characterization of carbon fiber distribution in cement-based composites by Computed Tomography. Constr. Build. Mater. 2018, 177, 134–147. [Google Scholar] [CrossRef]
  24. Gates, M.; Gonzalez, J.; Lambros, J.; Heath, M. Subset Refinement for Digital Volume Correlation: Numerical and Experimental Applications. Exp. Mech. 2015, 55, 245–259. [Google Scholar] [CrossRef]
  25. Hong, S.; Liu, P.; Zhang, J.; Kuang, C.; Dong, B.; Luo, Q.; Liu, W. Interior fracture analysis of rubber-cement composites based on X-ray computed tomography and digital volume correlation. Constr. Build. Mater. 2020, 259, 119833. [Google Scholar] [CrossRef]
  26. Mao, L.T.; Chiang, F.P.; Yuan, Z.X. Three-Dimensional Displacement Measurement in Solid Using Digital Volumetric Speckle Photography Based on Computer Tomography. Acta Opt. Sin. 2015, 35, 312001. [Google Scholar] [CrossRef]
  27. Pan, B.; Wang, B. Some recent advances in digital volume correlation. Opt. Lasers Eng. 2020, 135, 106189. [Google Scholar] [CrossRef]
  28. Zhou, Q.; Lu, C.; Wang, W.; Wei, S.; Lu, C.; Hao, M. Effect of fly ash and sustained uniaxial compressive loading on chloride diffusion in concrete. J. Build. Eng. 2020, 31, 101394. [Google Scholar] [CrossRef]
  29. Maruyama, I.; Sasano, H. Strain and crack distribution in concrete during drying. Mater. Struct. 2014, 47, 517–532. [Google Scholar] [CrossRef]
  30. Chen, Y.; Shi, Y.; Chateau, C.; Marrow, J. In situ X-ray tomography characterisation of 3D deformation of C/C-SiC composites loaded under tension. Compos. Part A Appl. Sci. Manuf. 2021, 145, 106390. [Google Scholar] [CrossRef]
  31. Zhang, H.; Huang, G.; Song, H.; Kang, Y. Experimental characterization of strain localization in rock. Geophys. J. Int. 2013, 194, 1554–1558. [Google Scholar] [CrossRef] [Green Version]
  32. Zhao, Y.-R.; Wang, L.; Lei, Z.-K.; Han, X.-F.; Shi, J.-N. Study on bending damage and failure of basalt fiber reinforced concrete under freeze-thaw cycles. Constr. Build. Mater. 2018, 163, 460–470. [Google Scholar] [CrossRef]
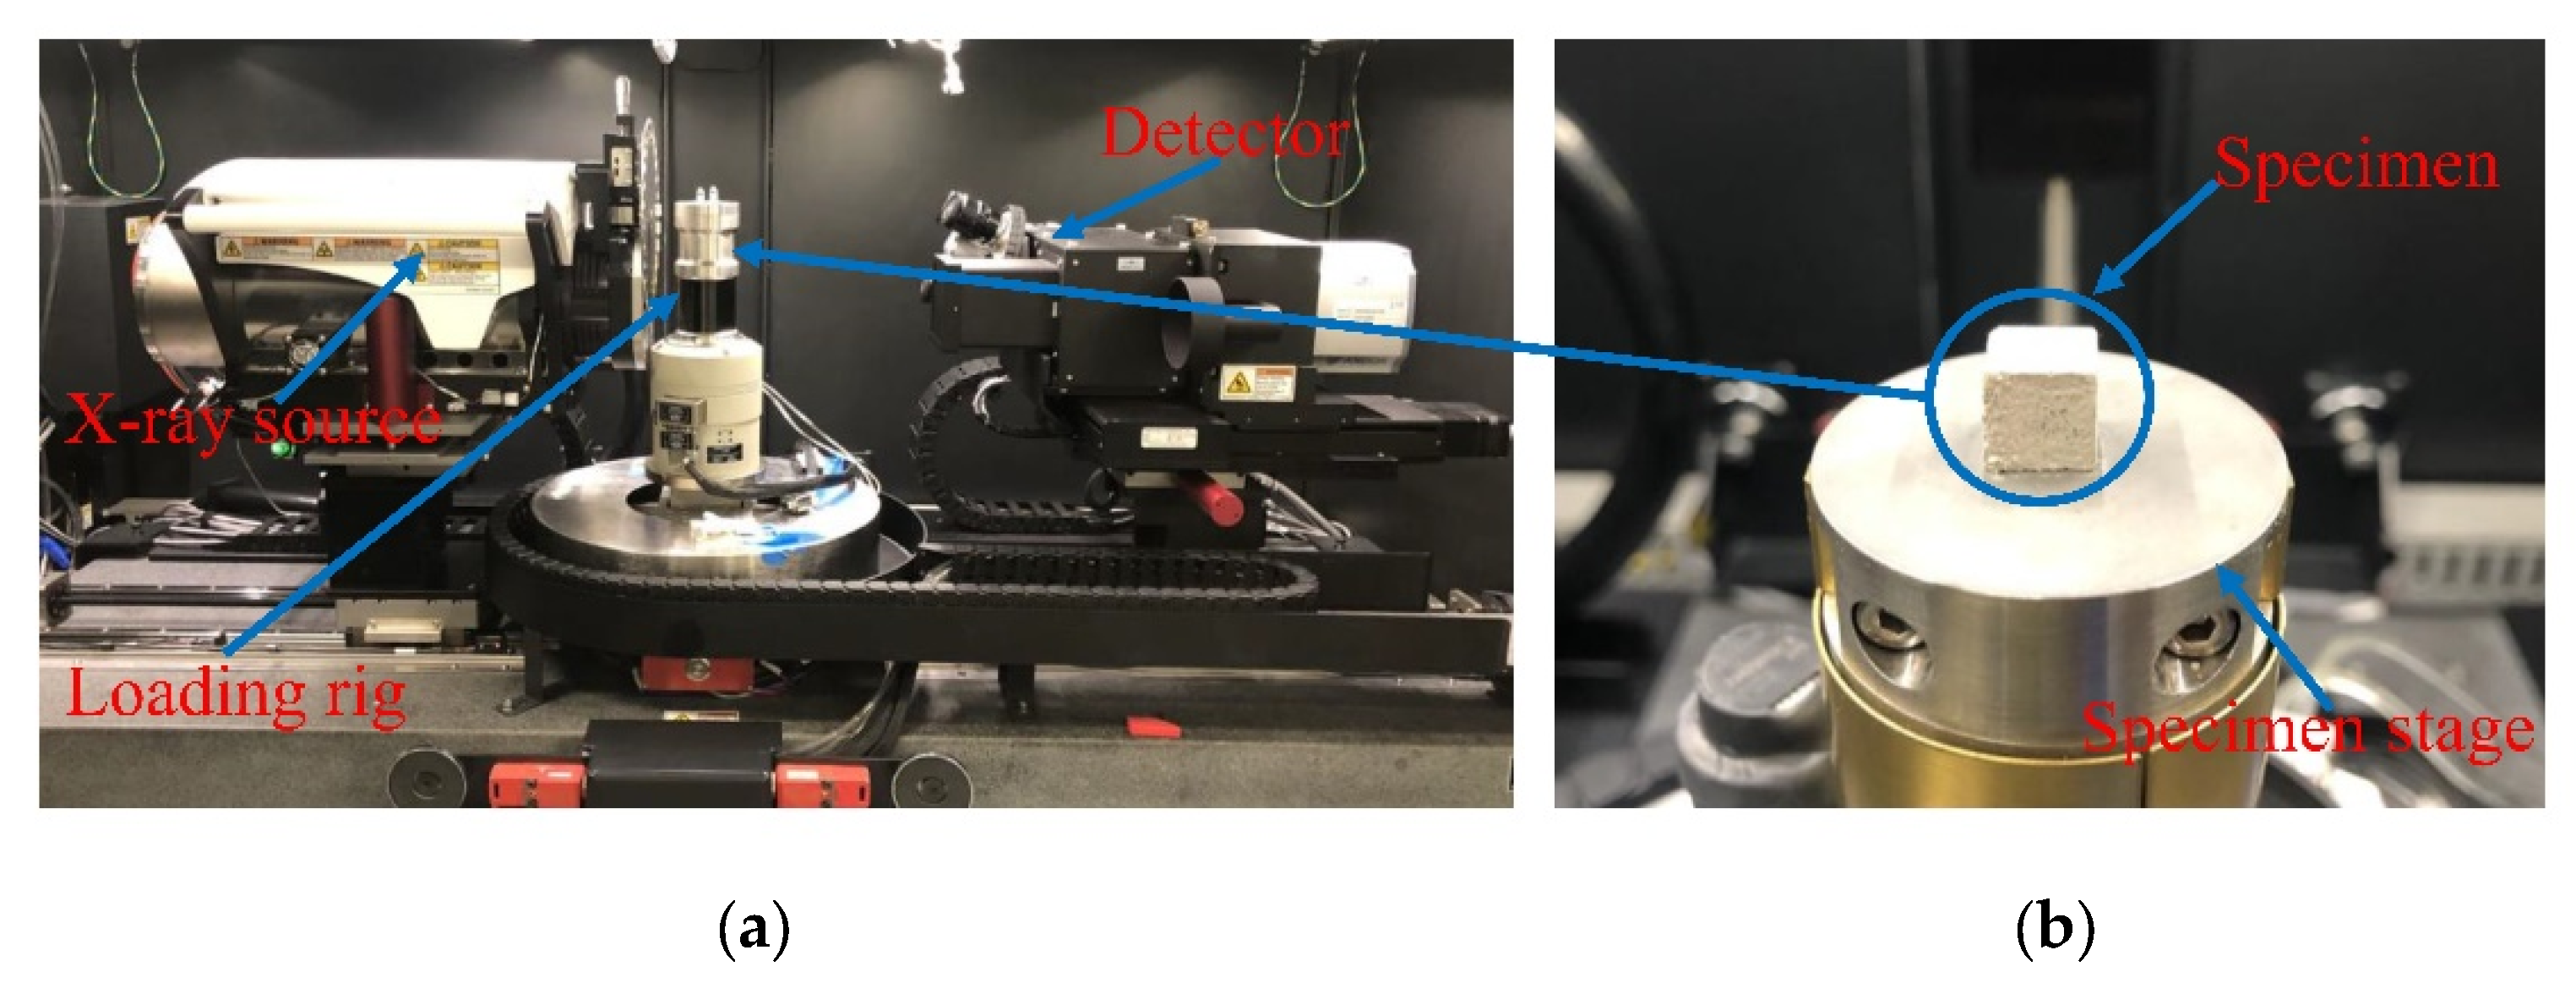
Figure 1. Test device: (a) deben fixed on the X-ray CT apparatus; (b) the specimen placed on the loading rig.
Applsci 13 03842 g001
Figure 2. Force-displacement curve.
Applsci 13 03842 g002
Figure 3. Raw image processing: (a) original image; (b) cropped image; (c) image after adding filter; (d) 3D image.
Applsci 13 03842 g003
Figure 4. Distinction between the cement matrix and cracks (pores): (a) original picture; (b) gray value distribution; (c) distribution of cracks (pores; marked by red).
Applsci 13 03842 g004
Figure 5. Three-dimensional crack distributions under different loads.
Applsci 13 03842 g005
Figure 6. Two-dimensional crack distributions in the central section (XY plane) of cement mortar at different loading stages. (a) F = 0 N; (b) F = 2000 N; (c) F = 2500 N; (d) F=3000N; (e) F = 3600 N; (f) F = 5000 N.
Applsci 13 03842 g006
Figure 7. Crack volume count distribution of sample.
Applsci 13 03842 g007
Figure 8. Analysis diagram of average crack widths under different loads: (a) 2D crack distribution under 3600 N; (b) 2D fracture distribution under 5000 N; (c) average crack widths under different loads.
Applsci 13 03842 g008
Figure 9. Strain fields of cement mortar under 30 MPa. (a) εxx, σ = 30 MPa; (b) εyy, σ = 30 MPa; (c) εzz, σ = 30 MPa.
Applsci 13 03842 g009
Figure 10. Strain fields of cement mortar under 50 MPa. (a) εxx, σ = 50 MPa; (b) εyy, σ = 50 MPa; (c) εzz, σ = 50 MPa.
Applsci 13 03842 g010
Figure 11. Strain distribution of different section position.
Applsci 13 03842 g011
Figure 12. DVC computing 3D image and distribution of principal strain under different stress stages.
Applsci 13 03842 g012
Figure 13. Principal strain map of different sections under 30 MPa. (a) the first section; (b) the second section; (c) the third section; (d) the fourth section.
Applsci 13 03842 g013
Figure 14. Principal strain map of different sections under 50 MPa. (a) the first section; (b) the second section; (c) the third section; (d) the fourth section.
Applsci 13 03842 g014
Figure 15. Gray value and damage index of different section position.
Applsci 13 03842 g015
Figure 16. Probability density functions of the maximum principal strains εmax.
Applsci 13 03842 g016
Figure 17. Space distribution of high-magnitude strains units under different stress stages.
Applsci 13 03842 g017
Figure 18. Localization factor under different stress stages.
Applsci 13 03842 g018
Table 1. Parameters of the X-ray CT test.
Voltage
(KV)
Power
(W)
Displacement
Rate (mm/min)
Integration Time (ms)Image Matrix Size
(Pixel)
Resolution
(μm)
100140.15001024 × 102414.3
Disclaimer/Publisher’s Note: The statements, opinions and data contained in all publications are solely those of the individual author(s) and contributor(s) and not of MDPI and/or the editor(s). MDPI and/or the editor(s) disclaim responsibility for any injury to people or property resulting from any ideas, methods, instructions or products referred to in the content.