Article

Quality Assessment of Banana Ripening Stages by Combining Analytical Methods and Image Analysis

by
Vassilia J. Sinanoglou
1,*,
Thalia Tsiaka
1,*,
Konstantinos Aouant
1,
Elizabeth Mouka
1,
Georgia Ladika
1,
Eftichia Kritsi
1,
Spyros J. Konteles
1,
Alexandros-George Ioannou
1,
Panagiotis Zoumpoulakis
1,
Irini F. Strati
1 and
Dionisis Cavouras
2
1
Laboratory of Chemistry, Analysis & Design of Food Processes, Department of Food Science and Technology, University of West Attica, Agiou Spyridonos, 12243 Egaleo, Greece
2
Department of Biomedical Engineering, University of West Attica, Agiou Spyridonos, 12243 Egaleo, Greece
*
Authors to whom correspondence should be addressed.
Appl. Sci. 2023, 13(6), 3533; https://doi.org/10.3390/app13063533
Submission received: 14 February 2023 / Revised: 7 March 2023 / Accepted: 8 March 2023 / Published: 10 March 2023
(This article belongs to the Special Issue Innovative Technologies in Food Detection)

Abstract

:
Currently, the evaluation of fruit ripening progress in relation to physicochemical and texture-quality parameters has become an increasingly important issue, particularly when considering consumer acceptance. Therefore, the purpose of the present study was the application of rapid, nondestructive, and conventional methods to assess the quality of banana peels and flesh in terms of ripening and during storage in controlled temperatures and humidity. For this purpose, we implemented various analytical techniques, such as attenuated total reflection-Fourier transform infrared (ATR-FTIR) spectroscopy for texture, colorimetrics, and physicochemical features, along with image-analysis methods and discriminant as well as statistical analysis. Image-analysis outcomes showed that storage provoked significant degradation of banana peels based on the increased image-texture dissimilarity and the loss of the structural order of the texture. In addition, the computed features were sufficient to discriminate four ripening stages with high accuracy. Moreover, the results revealed that storage led to significant changes in the color parameters and dramatic decreases in the texture attributes of banana flesh. The combination of image and chemical analyses pinpointed that storage caused water migration to the flesh and significant starch decomposition, which was then converted into soluble sugars. The redness and yellowness of the peel; the flesh moisture content; the texture attributes; Brix; and the storage time were all strongly interrelated. The combination of these techniques, coupled with statistical tools, to monitor the physicochemical and organoleptic quality of bananas during storage could be further applied for assessing the quality of other fruits and vegetables under similar conditions.

1. Introduction

The banana, a tropical fruit of the family Musaceae, belongs to the genus Musa, which is subdivided into Rhodochlamys, Eumusa, Callimusa, and Australimusa sub-families, based on the number of chromosomes [1]. More widespread is the Eumusa species and, specifically, the edible varieties Musa acuminate and Musa balbisiana [2]. Edible bananas are hybrid products of two wild diploid species, Musa balbisiana Colla and Musa acuminate Colla [2].
The duration of banana cultivation depends on its variety and the climatic conditions when the fruit is harvested at 8–13 months, having a mature green-colored peel [1]. The banana is considered a source rich in minerals, carbohydrates, dietary fibers, vitamins, and phenolic compounds, though its composition is based on the variety, growth stage and maturity [3]. In the first stages of the banana ripening progress, many of the typical biochemical, physicochemical, and organoleptic changes are, in general, positively characterized and accepted by consumers. As maturation proceeds and, in particular, when dark spots progressively appear on banana peel due to the enzymatic activity of the polyphenol and catechol oxidases, bananas gradually cease to meet the requirements for consumer acceptance and retail sale [4]. Therefore, the development and implementation of integrated tools and workflows for monitoring the progress of the banana ripening and reaching a desirable quality in terms of its organoleptic and physicochemical characteristics, especially by evaluating the fruit defects via non-destructive methods, is of utmost importance for marketability.
Therefore, several studies [5,6,7,8,9,10,11,12,13,14,15,16] have been published regarding the assessment of the banana ripening progress that implemented various analytical methods and techniques, such as non-destructive and cost-efficient image-processing techniques (i.e., camera-based approaches) for peel color differentiation, electrical properties measurements, spectroscopic methods, scanning electron microscopy, texture analysis of peel and flesh, peel color measurement, starch-and-sugar content evaluation, and vitamins, organic acids, and chlorophyll determination. However, the application of a single or even a few of these methods and techniques has only provided information regarding specific characteristics of the fruit. For example, spectroscopic methods have yielded results for the bioactive content of the bananas while texture analysis has focused on the organoleptic attributes of the fruit, without examining its chemical composition. Furthermore, by simultaneously evaluating the various complementary results of several methods, including image analysis, physicochemical methods, and powerful statistical tools, such as discriminant analysis, could provide useful insights into the ripening progress of bananas.
Therefore, the current research focused on the organoleptic and physicochemical properties of the bananas by evaluating the effect of storage time and conditions on banana shelf life. The main objective of this study was the assessment of the ripening progress of Cavendish bananas during storage, through the combined implementation of physicochemical, spectroscopic, and image-analysis methods, as well as the application of statistical tools. Specifically, water activity, moisture content, total soluble solids content, color parameters, texture attributes, and titratable acidity (%) were measured. Moreover, attenuated total reflection-Fourier transform infrared (ATR-FTIR) spectroscopy and image-analysis were also applied, and the comprehensive results from all methods were then comparatively studied in terms of ripening in controlled temperature and humidity during storage. In addition, this study focused on evaluating the implementation of a combined platform that could be transformed into an important tool for monitoring the physicochemical and organoleptic quality of vegetables and fruits during storage and classifying them according to their ripening stages, based on both the plant byproducts (peel) and the edible parts (flesh).

2. Materials and Methods
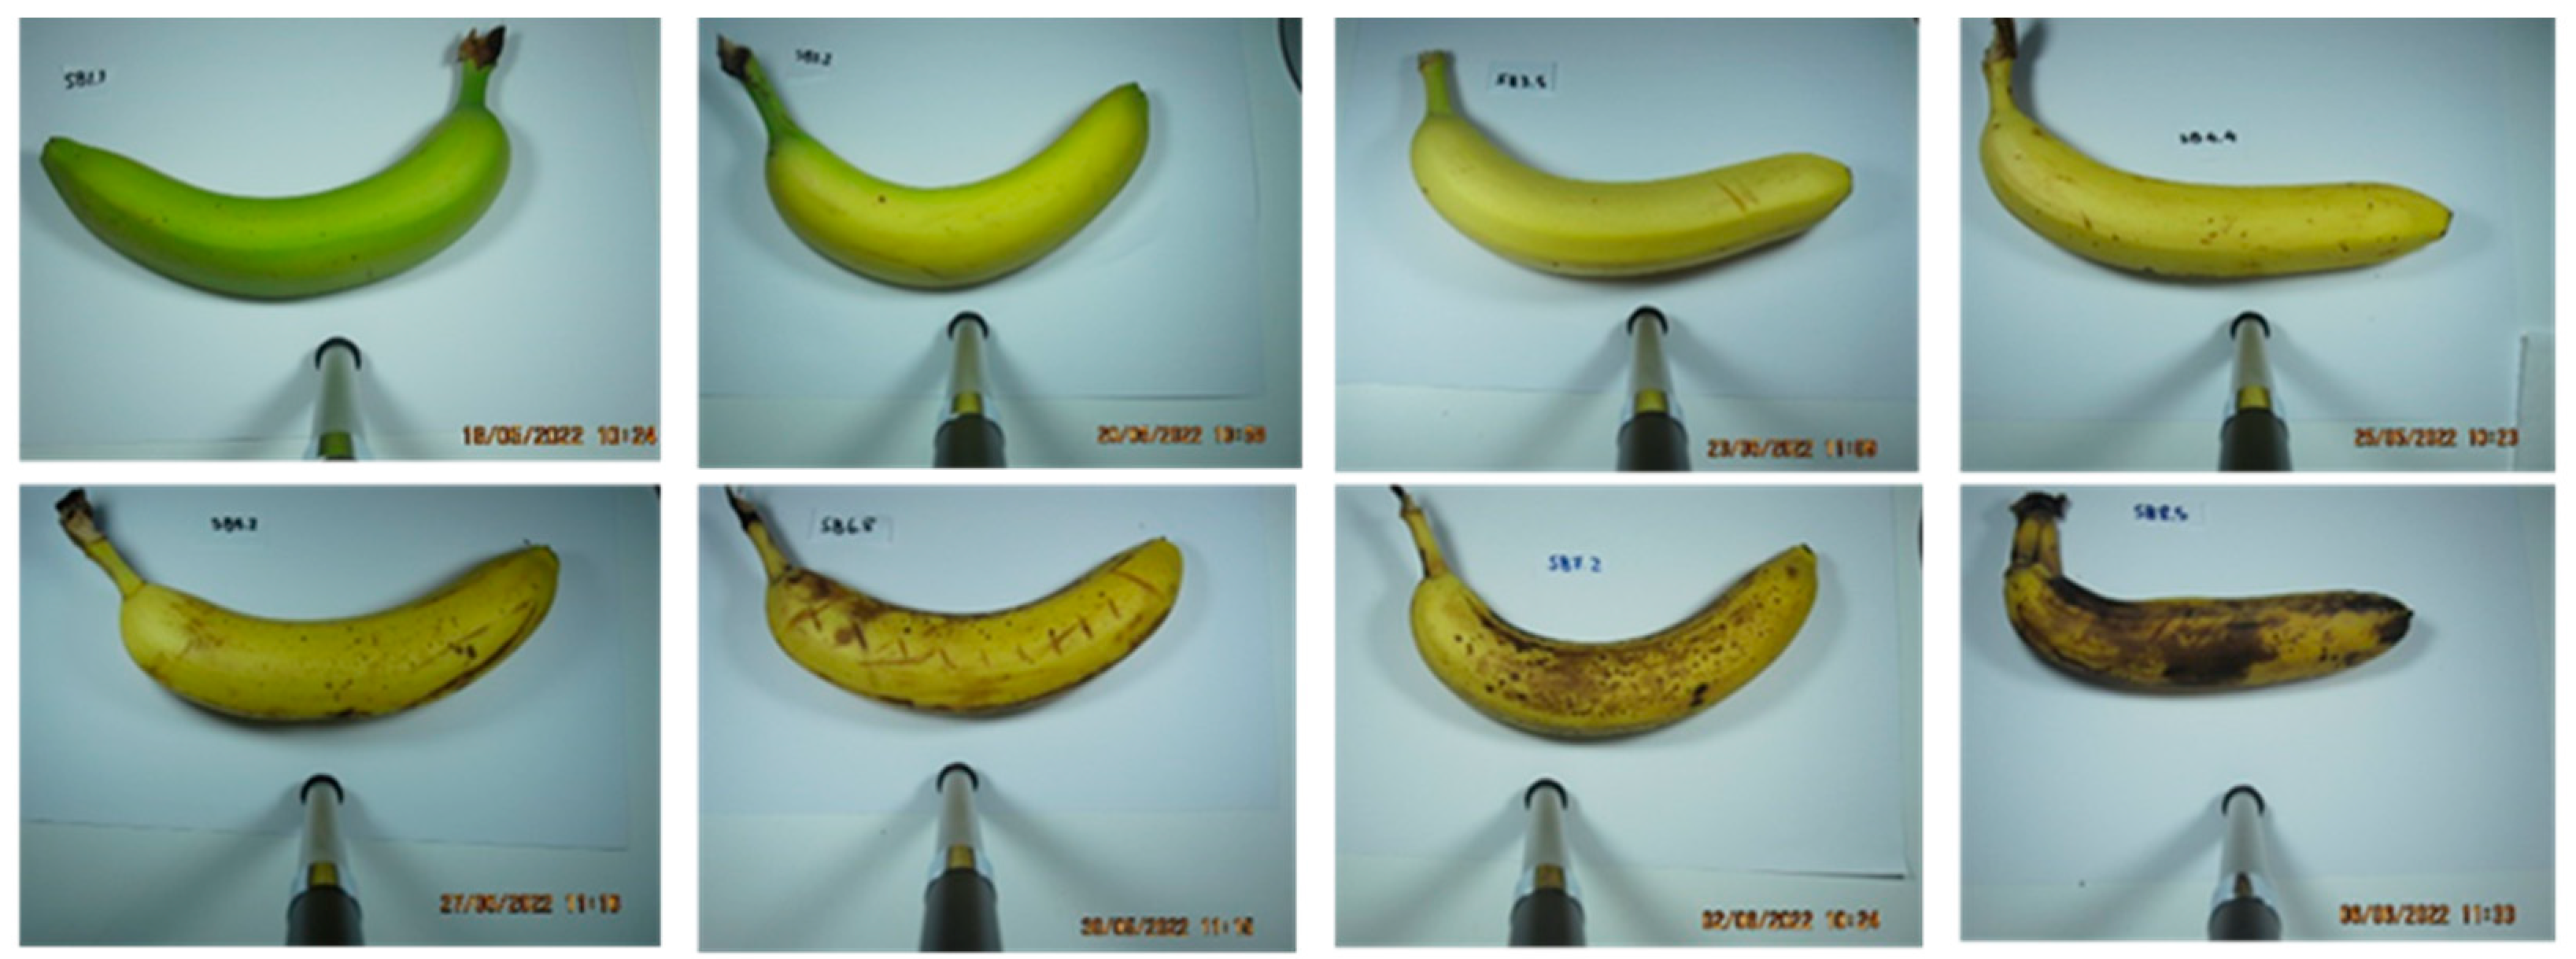
2.1. Banana Samples

The banana samples, belonging to the Cavendish variety (Musa acuminate) and transported from Ecuador, were provided by the Pefanis Company (https://www.pefanis.com.gr/en/ (accessed on 7 March 2023)), located in Athens, Greece. Green bananas were placed in a ripening room with a controlled atmosphere, which was in the facilities of the company, to activate their maturation artificially from day 0. The next day (day 1), 12 hands of the bananas, with seven or eight fingers per hand, no visual defects, and at the green stage of ripening, were randomly selected, stored in the ripening room, and then transported to the laboratory. All the experiments for the evaluation of the banana ripening stages were conducted by placing the banana samples in a controlled temperature oven at 18.0 ± 0.5 °C and 60 ± 2% relative humidity. All the analyses were performed over a total period of twenty-one (21) days to investigate fruit ripening at 2, 4, 7, 9, 11, 14, 17, and 21 days of ripening. For this purpose, the banana samples were selected randomly from the hands, in eight biological replicates, for all the measurements.

2.2. Physicochemical Measurements during Banana Ripening

An aw-meter, acquired from AquaLab Dew Point Water Activity Meter 4TE, METERGroup, Inc., Pullman, WA, USA, was used to measure water activity of the banana-flesh samples [17].
The moisture contents of the banana-flesh samples were measured using an electronic moisture analyser (Kern MLS 50-3, KERN & SOHN GmbH, Balingen, Germany). Each banana-flesh sample (0.2–0.4 g) was placed on a sample pan. An internal halogen dryer heated the samples, which resulted in moisture vaporization. During the drying process, the instrument continuously determined the sample mass and displayed the moisture loss. The percentages of the moisture contents were calculated based on the weight differences before and after drying. The maximum temperature was maintained at 120 °C for all measurements [17].
The measurements of total soluble solids (TSS) were conducted with a hand-held refractometer (Kern Optics Analogue Brix Refractometer, ORA 80BB, KERN & SOHN GmbH, Balingen, Germany). The samples of the banana flesh were homogenized in a blender and the produced pureed samples were placed on the prism of a refractometer. The TSS were obtained as °Brix, as provided by a direct reading of the refractometer [17].
The color values L* (lightnessh* (hue angle in degrees), a* (redness/greenness) and b* (yellowness/blueness) were determined by using a tristimulus chromatometer (model CR-400, Minolta, Tokyo, Japan), which had been calibrated according to Giannakourou et al., 2023. Measurements were taken at the surfaces of the banana flesh slices [17].
The texture measurements of the banana-flesh samples were conducted using a texture analyzer, the TA-XTplusC by Stable Micro Systems (Godalming, U.K.), as described by Giannakourou et al., 2023. Adhesiveness, firmness, cohesiveness, springiness, and chewiness were the evaluated texture characteristics [18].
The method defined by the AOAC was performed for the determination of titratable acidity (%) [19], which was expressed as g of malic acid/100 g of the banana.
An iodine test was used to determine the presence of starch in the banana flesh during ripening. The surfaces of the banana flesh slices, with 1.5 cm thickness, were immersed in a starch–iodine (1% potassium iodide and 0.25% iodine) staining solution for 5 s [20]. A blue–black color resulted if starch amylose was present. The starch distribution in the slices was then estimated by image analysis.
Each measurement was carried out for eight replicates.

2.3. Fourier Transform Infrared Spectroscopy with Attenuated Total Reflectance (ATR-FTIR)

The FTIR spectra of the banana-flesh samples were acquired at ambient temperature using an attenuated total reflectance (ATR) spectrometer (Shimadzu, IRAffinity-1S FTIR Spectrometer, Kyoto, Japan). Data extraction as well as data processing and analysis were performed using LabSolutions IR software, according to Ioannou et al., 2022 [21].

2.4. Image Acquisition

The goal of this procedure was to assess differences in the banana textures during ripening. For this purpose, the samples of (a) banana peels and (b) banana flesh after iodine testing were photographed with a Sony DSCW800/B digital camera (Sony Europe Limited, Edinburgh, UK), which was performed at 15 cm from the banana sample surface and under appropriate lighting conditions. The images of the banana samples were obtained at a lens aperture of f = 4.6 and a resolution of 1280 × 720 pixels, and they were saved in JPEG format. In order to quantify the textural properties of the surfaces of the banana samples, eighteen (18) textural features from each image were calculated. The colored and grayscale versions of the images were used to compute the textural features and to estimate the textural changes that occurred during banana ripening. Three (3) features, namely L*, a* and b*, were calculated from the colored version of the images. Four (4) features, namely mean value, standard deviation (std), skewness, and kurtosis were calculated based on the histogram first-order statistics of the grayscale images. Six (6) features, namely contrast (con), dissimilarity (dis), energy, homogeneity, correlation, and angular second moment (ASM), were produced based on the co-occurrence matrix second-order statistics of the grayscale images. Five (5) features, including short-run emphasis (SRE), run-length non-uniformity (RLN), long-run emphasis (LRE), gray-level non-uniformity (GLN), and run percentage (RP) were produced from the run-length matrix second-order statistics of the grayscale images [22].

2.5. Discriminant Analysis

A discriminant analysis was conducted to investigate the banana peel alteration over 21 days of ripening and assess the ripening days according to the banana-peel texture. First, all bananas were photographed on the predetermined measurement days (ripening days 2, 4, 7, 9, 11, 14, 17, 21). Using a specially designed software, six grayscale rectangular regions-of-interest (ROIs) from the photographed peel of each banana, three of each banana-side, were selected. Second, from each ROI, 15 textural features were generated, the mean feature values from the 6 banana ROIs were computed, and 15 feature values that had been consistent across a 15-long feature-vector were selected to represent each banana. Second, eight classes were formed, corresponding to eight measurement days, and each class contained the feature-vectors of eight bananas photographed on each measurement day. These classes were used in both the discriminant and statistical analyses.
For the discriminant analysis, machine-learning (ML) classifiers were employed. A classifier is an algorithm that, when suitably designed, could assign the banana ROIs to a predetermined class (or ripening day). Ten different ML-classifiers were tested on our data. The classifiers were included in the Python programming language library scikit-learn [https://scikit-learn.org/ (accessed on 7 March 2023)] and were the following: classification and regression decision tree, k-nearest neighbor, linear discriminant analysis, logistic regression, multi-layer perceptron, naïve Bayesian, nearest centroid, perceptron, random forest, and support vector machines. The accuracy of a classifier in assigning the banana ROIs to the correct ripening day was assessed by evaluating labelled ROIs in the banana peel images. For this, an ML-system was constructed by choosing one classifier, selecting a sub-set of the 15 features, and using a precision evaluation method (leave-one-out, LOO). The ML-system’s design precision was tested by employing a different classifier each time, normalizing the features to a zero mean and a unit standard deviation, and using all possible feature combinations. As a result, the ML-system design that could provide the highest precision was determined. For dimensionality reduction, each feature combination was compacted into two principal component analysis (PCA) components, PCA1 and PCA2, which were then input into the ML system. PCA-based two-dimensional scatter plots with class-separating surfaces were produced for displaying the results of the discriminant analysis [21].

2.6. Statistical Analysis

A non-parametric Mann–Whitney–Wilcoxon test for the two classes was implemented for the statistical analysis of the results on different ripening days, and it was performed using the Python scipy.stats library (https://docs.scipy.org/doc/scipy/tutorial/stats.html (accessed on 7 March 2023)). The Python pandas library (https://pandas.pydata.org/docs/reference/api/pandas.DataFrame.corr.html (accessed on 7 March 2023)) was applied to compute the pairwise correlation matrix between the physicochemical parameters. Moreover, the analysis of the FTIR results was performed at a significance level of 95% (p < 0.05) using a one-way ANOVA and a post hoc analysis in SPSS (IBM SPSS Statistics, version 29.0, Chicago, IL, USA) for Windows.

3. Results and Discussion

3.1. Classification of the Banana According to Ripening Process of Peel and Flesh Using Textural Image Analysis

Image analysis provided a non-invasive and rapid method for evaluating the quality and ripeness of the bananas. The gradual differentiation in the peel appearance and color of the banana samples during 21 days of storage, as captured by image analysis, is illustrated in Figure 1.
Machine-learning methods were employed on the computed features arising from the colored images of the banana peel, as well as from the grayscale images of the banana peel and of flesh after iodine testing, in order to examine variations in image texture during fruit ripening.
Concerning the banana peel (Figure 2), statistically significant changes related to ripening were noted in the following features: lightness (L*), parameter a* (green to red), parameter b* (blue to yellow), mean, standard deviation, contrast, dissimilarity, energy, homogeneity, ASM, SRE, LRE, and RLN.
Regarding the colored images of the banana peel, significant changes were observed in all extracted features. Specifically, during peel storage, the lightness and b* parameters showed a significant (p < 0.05) decreases, whereas the a* parameter had a significant (p < 0.05) increase (Figure 2, Table S1). Based on these results, it appeared that as ripening progressed, the banana peels increased in redness, converted from yellow to dark blue, and lost their luminosity. These findings were in accordance with the results of Mendoza and Aguilera [23], who had also reported that these changes were due to the breakdown of chlorophyll, leading to the development of brown spots.
Regarding the grayscale version of the images of the banana peels, the increases in the standard deviation (the variation of the image gray levels from the mean value), contrast (the amount of local intensity variations in the image), dissimilarity (the image-texture variation), short-run emphasis (small structures of equal gray levels), and run-length non-uniformity (the non-uniformity of the structures in the image) values (Figure 2) indicated an uneven distribution among the gray levels of the image structures, potentially due to the appearance of smaller dark areas and spots on the banana peel during the storage period, resulting in an increase in gray-level inequality and the non-uniformity of the structures in the images. The gradual development of dark areas and spots on the banana peels during ripening are shown in Figure 1. Interestingly, the box plot of the run-length non-uniformity feature during the storage period tended to classify the banana peel samples according to three degrees of increasing ripeness: the interval up to day 4, the interval between days 7 and 11, and the interval between days 14 and 21. The decrease in the mean (the mean value of the intensities of all image pixels), energy (image gray-level homogeneity), homogeneity (image gray-level homogeneity), angular second moment (homogeneity of the original image), and long-run emphasis (large structures of equal gray level) values (Figure 2) indicated an increase in image dissimilarity and the loss of the texture structural order that was probably due to the appearance of darker spots and areas on the banana peel during the storage period. Based on the above findings, Mendoza and Aguilera [23] reported that the extracted features from the bananas’ images could be directly or indirectly related to the ripening process. Furthermore, Santoyo-Mora et al. [24] reported that as the brown spots had extended all over the banana peel, the peel homogeneity had decreased.
The scatter diagram (Figure 3) shows the discrimination among banana peel samples on days 2, 7, 11, and 21, with a 96.0% overall discrimination accuracy, according to the features of contrast, energy, short-run emphasis and run-length non-uniformity. The banana peel samples on day 2 (blue circles) (first cluster) occupied the center left zone of the scatter diagram, while the second cluster, which included banana peel samples from day 7 (green squares), occupied the bottom left area of the scatter diagram. The third cluster, which contained banana peel samples from day 11 (red triangles) formed a cluster surrounding the upper right zone of the scatter diagram, and finally, the fourth cluster of the banana peel samples from day 21 (pine green pentagons) formed a cluster surrounding the bottom right zone of the scatter diagram. This four-feature combination was used in the design of a high-performance machine-learning system, which could aptly classified 43 out of the 48 banana peel samples from day 2 (of these, 1 and 4 samples were wrongly assigned to days 7 and 11, respectively), 47 out of the 48 samples from day 7 (1 sample was wrongly assigned to day 21), 46 out of the 48 samples from day 11 (2 samples were wrongly assigned to day 2), and 48 out of the 48 samples from day 21 (all correctly classified). Interestingly, a similar ripening pattern in bananas, activated by the phytohormone ethylene through metabolite profiling, had been observed by Lohani et al. [25]. The latter studied banana ripening for seven days and recorded two peaks in respiration rate (ripening index). Specifically, the first peak was on the second day, followed by a downward trend until the fifth day and a new rise and peak on the sixth day. The same results were also reported by Pathak et al. [26].
After iodine testing, the banana-flesh slices switched progressively from a dark iodine stain to a lighter one (Figure 4) from the center of the slices and outwards during the 21-day storage period. Simultaneously, a significant increase in ripening was observed in the feature mean, which expressed the mean value of the intensities of all the image pixels (Table 1, Figure S1) derived from the grayscale images of the iodine-stained banana flesh. Specifically, during the 21-day storage period, the intensity of the image pixels presented a significant (p < 0.05) yet gradual increase, 17.8%, in the mean rate of change, which was directly related to the destruction of the amylose–iodine complex.
This destruction was directly related to the flesh softening and sweetening during ripening and was ascribed to the activity of the cell-wall enzymes, including the hydrolases as well as to the starch-to-sugar metabolism [27].

3.2. Physicochemical Parameters of the Banana Flesh during Storage

The physicochemical parameters, including the water activity (aw), the moisture content (%), the Brix, the color, the texture, and the titratable acidity (%) of the banana-flesh samples were evaluated during the 21-day storage period, at 18.0 ± 0.5 °C. The changes in the water activity, moisture (%), Brix (TSS), and titratable acidity (%) values of the samples on days 2, 4, 7, 9, 11, 14, 17, and 21 are shown in Figure 5.
The water activity showed a statistically significant (p < 0.05) variation between days 7 and 17 of storage, whereas the moisture content (%) showed a progressive increase during the 21-day storage period, which was especially significant at day 14 of the experiment. The Brix (TSS) values exhibited a significant (p < 0.05) gradual increase until day 7 of storage, without further change until day 21 (the final day of storage). This agreed with Moreno et al. [28], who reported that commercial bananas of the Musa varieties had reached a maximum TSS value at 9 days of storage, and this had then plateaued until the end of the storage period (14 days). Furthermore, it was reported that the parallel increase in the banana-flesh moisture and TSS values during ripening were the results of the hydrolysis of the starch into soluble sugars and the moisture migration from the peel to the flesh [12,16,29,30]. Τhe titratable acidity (%), which has been associated with the content of malic, oxalic, citric, and tartaric acids [2], presented significant (p < 0.05) variations during storage, and we noted a maximum decrease at day 9 and a maximum increase at day 17. Significant variations in the titratable acidity (%) during ripening had been reported in many studies. Specifically, the malic acid had increased during ripening in [8,31], whereas the oxalic acid had decreased in [32], causing an overall and significant increase in titratable acidity [33].
The color parameters of the banana-flesh samples at days 2, 4, 7, 9, 11, 14, 17, and 21 are shown in Figure 6. The L* parameter of the banana flesh displayed a significant (p < 0.05) reduction after day 4, and then increased until the day 17, followed by a significant decrease. The a* parameter showed a significant (p < 0.05) increase up to day 9, and afterwards, decreased progressively until the final day of the storage period. The b* parameter demonstrated only insignificant fluctuations during the 21-day storage. Initially, the h parameter of the banana flesh presented a significant (p < 0.05) reduction at day 7, then it stabilized until day 14, and finally, it increased at day 17. Although many studies have referred to the changes in the color of the banana peel during ripening, there were no competent reports on the corresponding changes in the banana flesh. Therefore, the color changes of the banana flesh could be attributed to the moisture content increasing and the oxygen penetration of the flesh during the storage period. Moreover, the redness (a*) fluctuations of the banana flesh could be associated with the total carotenoid-content differentiation during ripening [34].
The texture attributes, such as firmness, springiness, adhesiveness, cohesiveness, and chewiness, of the banana flesh at days 2, 4, 7, 9, 11, 14, 17, and 21 are shown in Figure 7. The firmness of the banana flesh presented a dramatic (p < 0.05) decrease at day 4, and then it gradually (p < 0.05) decreased until day 21. These results were in accordance with other research that had also mentioned the contributions of starch hydrolysis, the enzymatic disruption of the cell wall structure, and the water migration from the banana peel to the pulp, to banana flesh softening [14,35]. Moreover, Ali et al. [36] pinpointed a 50% firmness reduction in bananas, which occurred during 3 days of ripening. Springiness (including the ratio of the distance of the height, during the second compression, to the original compression distance), which was related to flesh elasticity, exhibited a slight (p > 0.05) decrease. Adhesiveness, which was the force required to overcome the contact between the surfaces of the product and the probe, showed a dramatic (p < 0.05) decrease at day 7 and, afterwards, gradually (p < 0.05) decreased until day 21. Cohesiveness, which corresponded to the ratio of the tensile strength measurements during the first and second compressions of the area, showed a significant decrease at day 7, a fluctuation up to day 11, and afterwards, a stabilization until the final day of storage. Chewiness, which was calculated as firmness × cohesiveness × springiness and expressed the energy required to chew solid food, showed a significant (p < 0.05) decrease at day 7 of the experiment, and then, it stabilized until the end of storage period. Interestingly, the variations of most texture attributes among the daily banana samples were minimized as the storage time increased. This agreed with previous reports in the literature, as other researchers had found that the texture attributes of the banana flesh decreased dramatically as ripening progressed [12,37]. Therefore, texture is an important parameter that changes during banana ripening.

3.3. Pairwise Correlation Matrix of Pairs of Physicochemical Parameters of the Banana Flesh and the Features L*, a*, b* of the Banana Peel, during Storage

To deepen our research, we created a pairwise correlation matrix (Figure 8) to showcase the pairwise correlations of the physicochemical parameters of the banana flesh and the features L*, a*, b* of the banana peel, during storage. The most substantial finding was related to the correlations (p < 0.05) between the a* parameter of the banana peel and the moisture content, the TSS (Brix), the firmness, and the adhesiveness of the banana flesh (high positive 0.81, strong positive 0.72, high negative −0.89, and strong negative −0.74, respectively), as well as in the a*—b* and a*—L* parameters of the banana peel (high negative −1, and strong negative −0.77, respectively). Τhe negative correlation of the a* and b* parameter of the banana peel could have been a result of the degradation of the chlorophyll with the parallel increase in the carotenoid and anthocyanin contents [38]. Variations in the content of the peel carotenoids, along with the appearance of dark spots due to the activity of the polyphenol oxidases (PPOs) could have been related to the negative correlation between the a* and L* parameters [39]. Therefore, the a* parameter of the banana peel was negatively correlated with the b* parameter of the banana peel as well as the firmness and adhesiveness of the banana flesh, and it was positively correlated with the storage time, the moisture content, and the total soluble solids (Brix) of the banana flesh. Based on the above results, the image analysis of the banana peel could be used as a competent indicator for estimating the banana flesh quality. Regarding the physicochemical parameters of the banana flesh, strong negative correlations were established between the firmness and TSS (Brix) values (−0.77, p < 0.05), the firmness and the moisture content (−0.74, p < 0.05), as the decrease in firmness was ascribed to the transfer of moisture from the peel to the flesh during ripening, as well as the a* and h parameters (−0.76, p < 0.05). Moreover, high and positive correlations (p < 0.05) were determined between the springiness and the cohesiveness; the springiness and the chewiness; the chewiness and the adhesiveness; and the chewiness and the cohesiveness (i.e., 0.84, 0.94, 0.83, and 0.82, respectively), whereas the firmness only correlated strongly with the adhesiveness (0.77). The interrelations between the texture parameters, such as the chewiness and the cohesiveness or the springiness and the chewiness, could be assigned to other parameters associated with banana ripening, such as an increase in the sugars in ripe bananas.

3.4. Attenuated Total Reflection-Fourier Transform Infrared (ATR-FTIR) Spectra Interpretation

The bands of the ATR-FTIR spectra of the banana-flesh samples (Table 2, Figure S2) were obtained at a spectral range of 3300–500 cm−1. All spectra presented absorption bands typically associated with starch, carbohydrates, water, organic acids, and phenolics. Specifically, the absorption band at 3640–3530 cm−1 was appointed to the O–H stretching vibration, which is characteristic of phenolic compounds [40], while the wide band at 3300–3200 cm−1 was due to the stretching vibrations of the hydroxyl groups, which are present in water, carbohydrates, organic acids, and phenols [41,42]. Moreover, the two bands at 3400 and 3325 cm−1 were ascribed to the asymmetric (higher frequency) and symmetric N–H stretching vibrations of the primary amines, respectively [40]. The 2932 cm−1 band was assigned to the symmetrical stretching vibrations of the C(sp3)–H of the carboxylic acids, the free amino acids, and the carbohydrates [41,42], whereas the band at 1738 cm−1 corresponded to the C–O stretching vibration of the carbohydrates and the phenolics [43]. The band at 1647–1632 cm−1 was related to the bending vibrations of the water, the carbohydrates, the organic acids, and the phenolic hydroxyl groups. According to Bello-Perez et al. [44], this was directly associated to the moisture content of the banana sample. The band at 1465–1450 cm−1 was due to the scissoring vibrations of the monosaccharides, including the methylene and methyl groups [45]. Moreover, the band at 1420–1410 cm−1 was linked to the combination of the C–H rocking and O–H bending vibrations [42,46] or with the in-plane bending vibrations of C–H in amylose and amylopectin [45]. The band at 1366–1339 cm−1 was related to the O–H bending vibration of the C–OH group [42]; the band at 1261–1229 cm−1, to the C–O stretching vibration of the carbohydrates and the phenolics [47]; and the band at 1153–1149 cm−1, to the C–O and C–C stretching vibrations of the glycosidic linkage of the polysaccharides [48]. The band at 1105 cm−1 was ascribed to the C–O and C–C stretching vibrations of the polysaccharides and the pectin [49], and the band at 1076 cm−1 was related to the stretching of the C–OH bond of the starches [50]. The band at 1055–1045 cm−1 was due to the C–O bending and C–OH stretching vibrations in the structure of the carbohydrates [51], which mainly corresponded to the sucrose and fructose absorption [52]. Moreover, the band at 1000–995 cm−1 was related to the B-type crystalline structure of the starch, which was representative of the high amylose starches contained in fruits [53,54,55,56]. The band at 928 cm−1 was ascribed to the in-plane bending vibrations of C–OH and C–C in the glycosidic linkage of the amylose and the amylopectin [45,57], and the band at 865–858 cm−1 was representative of the ordered or crystalline structure of the starch [58]. The band at 770–735 cm−1 was assigned to the C–H out-of-plane bending vibrations corresponding to the ortho-substituted aromatic rings [43], whereas the band at 720 cm−1 was related to the O–H out-of-plane bending vibrations of the amylose and the amylopectin [40,45]. Moreover, the 577 and 523 cm−1 bands corresponded to the C–O–C in-plane bending vibrations of the glycosidic linkage of the amylose and the amylopectin [45].
The assessment of the ATR-FTIR spectra of the banana-flesh samples (Table 2) resulted in the findings summarized below.
The intensities of 1153–1149 cm−1, 1000–995 cm−1, and 928 cm−1, which were associated with the polysaccharides of the starch granules (amylose and amylopectin), displayed a dramatic (p < 0.05) decrease from day 7 until day 9, and then decreased (p < 0.05) progressively or fluctuated (p > 0.05), until the storage ended. Moreover, no absorption was detected at 1076 cm−1 and 865–858 cm−1, which were associated with the presence of starch after day 9 of storage. The intensities of 1055–1045 cm−1, which were related to the presence of sucrose and fructose, presented a significant gradual (p < 0.05) increase from day 7 until day 21. Obviously, during the banana ripening process, starch was gradually decomposing, leading to the accumulation of soluble sugars, such as sucrose and fructose. In accordance with these results, it has been reported that the starch content in banana flesh showed a rapid decrease as ripening progressed, until becoming undetectable [2], which has been associated with the starch decomposition through a complex mechanism [27,59].
The intensities at 1647–1632 cm−1, which were related to the moisture content, varied insignificantly until day 11; then, at day 14, they presented a significant increase before stabilizing until the final day of storage, in accordance with the moisture content (%) results and the run-length non-uniformity (the non-uniformity of the structures in the image) values. The starch conversion into sugars increased the osmotic pressure of the flesh and favored the water transfer from the peel to the flesh [28].
The intensities at 2932 cm−1, which indicated the C(sp3)–H stretching vibrations, exhibited a slight (p < 0.05) decrease at day 7, decreased drastically at day 9, and then stabilized (p > 0.05) until the day 17 to a minimum value. Possible reasons for this drastic decrease in the peak intensity could be related to the starch conversion into sugars and/or the dramatic acidity reduction at day 9 of the ripening process (Figure 5).

4. Conclusions

In the present study, attenuated total reflection-Fourier transform infrared (ATR-FTIR) spectroscopy, texture, colorimetric, physicochemical, and digital-image analysis methods were synergistically applied to pinpoint the effect of ripening on the chemical and physical characteristics of banana peels and flesh during storage in controlled temperatures. The most interesting findings are summarized below.
Concerning the banana peel, the ripening progress resulted in an increase in the peel redness, a decrease in its luminosity, peel conversion from yellow to dark blue, an increase in gray-level inequality, and the non-uniformity of image-texture structures. The combination of the computed image-texture features of the banana peel enabled a highly accurate classification of the banana samples according to 4 ripening stages (day 2, day 7, day 11, and day 21) during the storage period.
Regarding the banana flesh, day 7 and day 11 were of particular interest because from these days onwards, significant changes in the flesh composition were revealed, as reflected by the physicochemical parameters and the FTIR spectral interpretation.
Therefore, the ripening progress resulted in a consistent increase in the moisture content and the total soluble solids (Brix) until day 7 and a drastic decrease in all texture attributes mainly from day 7 onwards. Furthermore, all the FTIR spectra intensities, which were related to the presence of starch (i.e., amylose and amylopectin), displayed a dramatic decrease, or disappeared completely, from day 7 onwards, whereas the intensities related to the presence of sucrose and fructose showed a significant increase from day 7 onwards. Moreover, the intensities related to the moisture content exhibited a significant increase from day 11 onwards. In accordance with the FTIR findings, the iodine testing on the flesh slices demonstrated an increase directly related to the breakdown of starch into sugar and the consequential destruction of the amylose–iodine complex.
Based on the correlations between the peel image analysis and the flesh physicochemical parameters, the redness and yellowness of the banana peels were strongly correlated with storage time, whereas the moisture content, the texture attributes, and the total soluble solids (Brix) revealed that the alterations in the color parameters of the banana peels were positively or negatively related to the variations in the composition and texture of the banana flesh.
In conclusion, the monitoring of banana ripening using physicochemical parameters is important for ensuring consistent quality. For this purpose, various techniques such as image analysis, color analysis, texture analysis, and chemical analysis can be implemented. Assessing the variations of the aforementioned parameters during banana ripening could optimize the storage and transport of bananas. Moreover, the results of the current study highlighted an essential complementary tool for evaluating banana-ripening progress, with potential applications for other fruits and vegetables.
However, similar to other studies concerning the fruit-ripening process, there were limitations and knowledge gaps that should be considered. For example, the evaluation of the banana ripening process was strongly dependent on the type of device used for image analysis (i.e., digital cameras vs. smartphones vs. electronic noses). In addition, more bananas species (i.e., red bananas, etc.) should be included in future studies, and additional statistical tools, such as machine- and deep-learning methods, should be evaluated for classifying the ripening stages of bananas and other fruits.

Supplementary Materials

The following supporting information can be downloaded at: https://www.mdpi.com/article/10.3390/app13063533/s1, Table S1: Image analysis of color parameters (L*, a*, b*) of the banana peel samples, at storage days 2, 4, 7, 9, 11, 14, 17, and 21; Figure S1: Variations in the feature mean values of the intensities of all grayscale image pixels representing the banana flesh slices after iodine testing, at storage days 2, 4, 7, 9, 11, 14, 17, and 21; Figure S2: Overlay of ATR-FTIR spectra acquired from 4000 to 499 cm−1 of the banana flesh at storage days 2, 4, 7, 9, 11, 14, 17, and 21.

Author Contributions

Conceptualization, V.J.S., S.J.K., P.Z. and D.C.; methodology, V.J.S., T.T., E.K., P.Z., I.F.S. and D.C.; software, A.-G.I. and D.C.; validation, V.J.S., T.T., E.K., I.F.S. and D.C.; formal analysis, K.A., E.M., G.L. and A.-G.I.; investigation, T.T., K.A., E.M., G.L., E.K., S.J.K. and I.F.S.; resources, S.J.K.; data curation, K.A., E.M., G.L., A.-G.I. and D.C.; writing—original draft preparation, V.J.S. and G.L.; writing—review and editing, V.J.S., T.T., E.K., S.J.K. and I.F.S.; visualization, E.K., A.-G.I. and D.C.; supervision, P.Z.; project administration, V.J.S.; funding acquisition, V.J.S., S.J.K., P.Z., I.F.S. and D.C. All authors have read and agreed to the published version of the manuscript.

Funding

This research received no external funding.

Institutional Review Board Statement

Not applicable.

Informed Consent Statement

Not applicable.

Data Availability Statement

Not applicable.

Acknowledgments

We are grateful to the Pefanis Company for kindly providing the banana samples and related information, and to Giannakourou Maria for her valuable help with the texture analysis.

Conflicts of Interest

The authors declare no conflict of interest.

References

  1. Qamar, S.; Shaikh, A. Therapeutic Potentials and Compositional Changes of Valuable Compounds from Banana-A Review. Trends Food Sci. Technol. 2018, 79, 1–9. [Google Scholar] [CrossRef]
  2. Maduwanthi, S.D.T.; Marapana, R.A.U.J. Biochemical Changes during Ripening of Banana: A Review. Int. J. Food Sci. Nutr. 2017, 2, 166–170. [Google Scholar]
  3. Babu, M.; Suriyakala, M.; Kodiveri Muthukaliannan, G. Varietal Impact on Phytochemical Contents and Antioxidant Properties of Musa Acuminata (Banana). J. Pharm. Sci. Res. 2012, 4, 1950–1955. [Google Scholar]
  4. Yap, M.; Fernando, W.M.A.D.B.; Brennan, C.S.; Jayasena, V.; Coorey, R. The Effects of Banana Ripeness on Quality Indices for Puree Production. LWT 2017, 80, 10–18. [Google Scholar] [CrossRef]
  5. Batista-Silva, W.; Nascimento, V.L.; Medeiros, D.B.; Nunes-Nesi, A.; Ribeiro, D.M.; Zsögön, A.; Araújo, W.L. Modifications in Organic Acid Profiles During Fruit Development and Ripening: Correlation or Causation? Front. Plant Sci. 2018, 9, 1689. [Google Scholar] [CrossRef]
  6. da Luiz, L.C.; Nascimento, C.A.; Bell, M.J.V.; Batista, R.T.; Meruva, S.; Anjos, V. Use of Mid Infrared Spectroscopy to Analyze the Ripening of Brazilian Bananas. Food Sci. Technol. 2022, 42, e74221. [Google Scholar] [CrossRef]
  7. Ma, L.; Liang, C.; Cui, Y.; Du, H.; Liu, H.; Zhu, L.; Yu, Y.; Lu, C.; Benjakul, S.; Brennan, C.; et al. Prediction of Banana Maturity Based on the Sweetness and Color Values of Different Segments during Ripening. Curr. Res. Nutr. Food Sci. 2022, 5, 1808–1817. [Google Scholar] [CrossRef]
  8. Maduwanthi, S.D.T.; Marapana, R.A.U.J. Comparative Study on Aroma Volatiles, Organic Acids, and Sugars of Ambul Banana (Musa Acuminata, AAB) Treated with Induced Ripening Agents. J. Food Qual. 2019, 2019, e7653154. [Google Scholar] [CrossRef] [Green Version]
  9. Mazen, F.M.A.; Nashat, A.A. Ripeness Classification of Bananas Using an Artificial Neural Network. Arab. J. Sci. Eng. 2019, 44, 6901–6910. [Google Scholar] [CrossRef]
  10. Mutharasu, P.; Kavino, M.; Muthuvel, I.; Subramanian, K.S.; Venkatesan, K. Study on Changes in Ultrastructure of Banana Cv. Grand Naine during Ripening. J. Agric. Ecol. 2018, 6, 17–21. [Google Scholar]
  11. Phillips, K.M.; McGinty, R.C.; Couture, G.; Pehrsson, P.R.; McKillop, K.; Fukagawa, N.K. Dietary Fiber, Starch, and Sugars in Bananas at Different Stages of Ripeness in the Retail Market. PLoS ONE 2021, 16, e0253366. [Google Scholar] [CrossRef] [PubMed]
  12. Soltani, M.; Alimardani, R.; Omid, M. Evaluating Banana Ripening Status from Measuring Dielectric Properties. J. Food Eng. 2011, 105, 625–631. [Google Scholar] [CrossRef]
  13. Surya Prabha, D.; Satheesh Kumar, J. Assessment of Banana Fruit Maturity by Image Processing Technique. J. Food Sci. Technol. 2015, 52, 1316–1327. [Google Scholar] [CrossRef] [PubMed] [Green Version]
  14. Thuy, N.M.; Linh, M.N.; My, L.T.D.; Minh, V.Q.; Tai, N.V. Physico-Chemical Changes in “Xiem” Banana Cultivar (Cultivated in Vietnam)during Ripening and Storage at Different Temperatures. Food Res. 2021, 5, 229–237. [Google Scholar] [CrossRef] [PubMed]
  15. Yun, Z.; Gao, H.; Chen, X.; Duan, X.; Jiang, Y. The Role of Hydrogen Water in Delaying Ripening of Banana Fruit during Postharvest Storage. Food Chem. 2022, 373, 131590. [Google Scholar] [CrossRef]
  16. Zulkifli, N.; Hashim, N.; Abdan, K.; Hanafi, M. Evaluation of Physicochemical Properties of Musa Acuminate Cv. Berangan at Different Ripening Stages. Int. Food Res. J. 2016, 23, S97–S100. [Google Scholar]
  17. Giannakourou, M.C.; Stavropoulou, N.; Tsironi, T.; Lougovois, V.; Kyrana, V.; Konteles, S.J.; Sinanoglou, V.J. Application of Hurdle Technology for the Shelf Life Extension of European Eel (Anguilla Anguilla) Fillets. Aquac. Fish. 2023, 8, 393–402. [Google Scholar] [CrossRef]
  18. Peleg, M. The Instrumental Texture Profile Analysis Revisited. J. Texture Stud. 2019, 50, 362–368. [Google Scholar] [CrossRef]
  19. AOAC International. Aromatic intermediates and derivatives. In Official Methods of Analysis of AOAC International, 19th ed.; Latimar, G.W., Ed.; Association of Official Analytical Chemists: Washington, DC, USA, 2012; ISBN 0935584838. [Google Scholar]
  20. Dwivany, F.M.; Aprilyandi, A.N.; Suendo, V.; Sukriandi, N. Carrageenan Edible Coating Application Prolongs Cavendish Banana Shelf Life. Int. J. Food Sci. 2020, 2020, e8861610. [Google Scholar] [CrossRef]
  21. Ioannou, A.G.; Kritsi, E.; Sinanoglou, V.J.; Cavouras, D.; Tsiaka, T.; Houhoula, D.; Zoumpoulakis, P.; Strati, I.F. Highlighting the Potential of Attenuated Total Reflectance—Fourier Transform Infrared (ATR-FTIR) Spectroscopy to Characterize Honey Samples with Principal Component Analysis (PCA). Anal. Lett. 2023, 56, 789–806. [Google Scholar] [CrossRef]
  22. Sinanoglou, V.; Cavouras, D.; Xenogiannopoulos, D.; Proestos, C.; Zoumpoulakis, P. Quality Assessment of Pork and Turkey Hams Using FT-IR Spectroscopy, Colorimetric, and Image Analysis. Foods 2018, 7, 152. [Google Scholar] [CrossRef] [Green Version]
  23. Mendoza, F.; Aguilera, J.M. Application of Image Analysis for Classification of Ripening Bananas. J. Food Sci. 2004, 69, E471–E477. [Google Scholar] [CrossRef]
  24. Santoyo-Mora, M.; Sancen-Plaza, A.; Espinosa-Calderon, A.; Barranco-Gutierrez, A.I.; Prado-Olivarez, J. Nondestructive Quantification of the Ripening Process in Banana (Musa AAB Simmonds) Using Multispectral Imaging. J. Sens. 2019, 2019, e6742896. [Google Scholar] [CrossRef] [Green Version]
  25. Lohani, S.; Trivedi, P.K.; Nath, P. Changes in Activities of Cell Wall Hydrolases during Ethylene-Induced Ripening in Banana: Effect of 1-MCP, ABA and IAA. Postharvest Biol. Technol. 2004, 31, 119–126. [Google Scholar] [CrossRef]
  26. Pathak, N.; Asif, M.H.; Dhawan, P.; Srivastava, M.K.; Nath, P. Expression and Activities of Ethylene Biosynthesis Enzymes during Ripening of Banana Fruits and Effect of 1-MCP Treatment. Plant Growth Regul. 2003, 40, 11–19. [Google Scholar] [CrossRef]
  27. Cordenunsi-Lysenko, B.R.; Nascimento, J.R.O.; Castro-Alves, V.C.; Purgatto, E.; Fabi, J.P.; Peroni-Okyta, F.H.G. The Starch Is (Not) Just Another Brick in the Wall: The Primary Metabolism of Sugars During Banana Ripening. Front. Plant Sci. 2019, 10, 391. [Google Scholar] [CrossRef] [PubMed] [Green Version]
  28. Moreno, J.L.; Tran, T.; Cantero-Tubilla, B.; López-López, K.; Becerra Lopez Lavalle, L.A.; Dufour, D. Physicochemical and Physiological Changes during the Ripening of Banana (Musaceae) Fruit Grown in Colombia. Int. J. Food Sci. Technol. 2021, 56, 1171–1183. [Google Scholar] [CrossRef]
  29. Mohapatra, D.; Mishra, S.; Sutar, N. Banana and Its By-Product Utilisation: An Overview. J. Sci. Ind. Res. 2010, 69, 323–329. [Google Scholar]
  30. Ringer, T.; Blanke, M. Non-Invasive, Real Time in-Situ Techniques to Determine the Ripening Stage of Banana. J. Food Meas. Charact. 2021, 15, 4426–4437. [Google Scholar] [CrossRef]
  31. Thakur, R.; Pristijono, P.; Bowyer, M.; Singh, S.P.; Scarlett, C.J.; Stathopoulos, C.E.; Vuong, Q.V. A Starch Edible Surface Coating Delays Banana Fruit Ripening. LWT 2019, 100, 341–347. [Google Scholar] [CrossRef] [Green Version]
  32. Martínez-Esplá, A.; Serrano, M.; Martínez-Romero, D.; Valero, D.; Zapata, P.J. Oxalic Acid Preharvest Treatment Increases Antioxidant Systems and Improves Plum Quality at Harvest and during Postharvest Storage. J. Sci. Food Agric. 2019, 99, 235–243. [Google Scholar] [CrossRef] [PubMed] [Green Version]
  33. Youryon, P.; Supapvanich, S. Physicochemical Quality and Antioxidant Changes in ‘Leb Mue Nang’ Banana Fruit during Ripening. Agric. Nat. Resour. 2017, 51, 47–52. [Google Scholar] [CrossRef]
  34. Chandra, R.D.; Siswanti, C.A.; Prihastyanti, M.N.U.; Heriyanto, U.; Limantara, L.; Brotosudarmo, T.H.P. Evaluating Provitamin A Carotenoids and Polar Metabolite Compositions during the Ripening Stages of the Agung Semeru Banana (Musa paradisiaca L. AAB). Int. J. Food Sci. 2020, 2020, e8503923. [Google Scholar] [CrossRef]
  35. Thompson, A.K. Postharvest treatments. In Postharvest Technology of Fruit and Vegetables; Thompson, A.K., Ed.; Blackwell Publishing: Oxford, UK, 1996; pp. 95–124. [Google Scholar]
  36. Ali, Z.M.; Chin, L.-H.; Lazan, H. A Comparative Study on Wall Degrading Enzymes, Pectin Modifications and Softening during Ripening of Selected Tropical Fruits. Plant Sci. 2004, 167, 317–327. [Google Scholar] [CrossRef]
  37. A’Bidin, F.N.Z.; Shamsudin, R.; Basri, M.S.M.; Dom, Z.M. Mass Modelling and Effects of Fruit Position on Firmness and Adhesiveness of Banana Variety Nipah. Int. J. Food Eng. 2020, 16, 20190199. [Google Scholar] [CrossRef]
  38. Vu, H.T.; Scarlett, C.J.; Vuong, Q.V. Changes of Phytochemicals and Antioxidant Capacity of Banana Peel during the Ripening Process; with and without Ethylene Treatment. Sci. Hortic. 2019, 253, 255–262. [Google Scholar] [CrossRef]
  39. Pongprasert, N.; Srilaong, V.; Sunpapao, A. Postharvest Senescent Dark Spot Development Mechanism of Musa Acuminata (“Khai” Banana) Peel Associated with Chlorophyll Degradation and Stomata Cell Death. J. Food Biochem. 2021, 45, e13745. [Google Scholar] [CrossRef]
  40. Nandiyanto, A.B.D.; Oktiani, R.; Ragadhita, R. How to Read and Interpret FTIR Spectroscope of Organic Material. Indones. J. Sci. Technol. 2019, 4, 97–118. [Google Scholar] [CrossRef] [Green Version]
  41. Anjos, O.; Campos, M.G.; Ruiz, P.C.; Antunes, P. Application of FTIR-ATR Spectroscopy to the Quantification of Sugar in Honey. Food Chem. 2015, 169, 218–223. [Google Scholar] [CrossRef]
  42. Kozłowicz, K.; Różyło, R.; Gładyszewska, B.; Matwijczuk, A.; Gładyszewski, G.; Chocyk, D.; Samborska, K.; Piekut, J.; Smolewska, M. Identification of Sugars and Phenolic Compounds in Honey Powders with the Use of GC–MS, FTIR Spectroscopy, and X-Ray Diffraction. Sci. Rep. 2020, 10, 16269. [Google Scholar] [CrossRef]
  43. Li, Y.; Kong, D.; Wu, H. Comprehensive Chemical Analysis of the Flower Buds of Five Lonicera Species by ATR-FTIR, HPLC-DAD, and Chemometric Methods. Rev. Bras. Farmacogn. 2018, 28, 533–541. [Google Scholar] [CrossRef]
  44. Bello-Pérez, L.A.; Ottenhof, M.-A.; Agama-Acevedo, E.; Farhat, I.A. Effect of Storage Time on the Retrogradation of Banana Starch Extrudate. J. Agric. Food Chem. 2005, 53, 1081–1086. [Google Scholar] [CrossRef] [PubMed]
  45. Wiercigroch, E.; Szafraniec, E.; Czamara, K.; Pacia, M.Z.; Majzner, K.; Kochan, K.; Kaczor, A.; Baranska, M.; Malek, K. Raman and Infrared Spectroscopy of Carbohydrates: A Review. Spectrochim. Acta Part A: Mol. Biomol. Spectrosc. 2017, 185, 317–335. [Google Scholar] [CrossRef] [PubMed]
  46. Brangule, A.; Šukele, R.; Bandere, D. Herbal Medicine Characterization Perspectives Using Advanced FTIR Sample Techniques—Diffuse Reflectance (DRIFT) and Photoacoustic Spectroscopy (PAS). Front. Plant Sci. 2020, 11, 356. [Google Scholar] [CrossRef] [PubMed]
  47. Oliveira, R.N.; Mancini, M.C.; de Oliveira, F.C.S.; Passos, T.M.; Quilty, B.; da Thiré, R.M.S.M.; McGuinness, G.B. FTIR Analysis and Quantification of Phenols and Flavonoids of Five Commercially Available Plants Extracts Used in Wound Healing. Matér. Rio Jan. 2016, 21, 767–779. [Google Scholar] [CrossRef] [Green Version]
  48. Hong, T.; Yin, J.-Y.; Nie, S.-P.; Xie, M.-Y. Applications of Infrared Spectroscopy in Polysaccharide Structural Analysis: Progress, Challenge and Perspective. Food Chem. X 2021, 12, 100168. [Google Scholar] [CrossRef]
  49. Talari, A.C.S.; Martinez, M.A.G.; Movasaghi, Z.; Rehman, S.; Rehman, I.U. Advances in Fourier Transform Infrared (FTIR) Spectroscopy of Biological Tissues. Appl. Spectrosc. Rev. 2017, 52, 456–506. [Google Scholar] [CrossRef]
  50. Pelissari, F.M.; Andrade-Mahecha, M.M.; Sobral, P.J.D.A.; Menegalli, F.C. Isolation and Characterization of the Flour and Starch of Plantain Bananas (Musa Paradisiaca). Starch-Stärke 2012, 64, 382–391. [Google Scholar] [CrossRef]
  51. Kędzierska-Matysek, M.; Matwijczuk, A.; Florek, M.; Barłowska, J.; Wolanciuk, A.; Matwijczuk, A.; Chruściel, E.; Walkowiak, R.; Karcz, D.; Gładyszewska, B. Application of FTIR Spectroscopy for Analysis of the Quality of Honey. BIO Web Conf. 2018, 10, 02008. [Google Scholar] [CrossRef] [Green Version]
  52. Wang, J.; Kliks, M.M.; Jun, S.; Jackson, M.; Li, Q.X. Rapid Analysis of Glucose, Fructose, Sucrose, and Maltose in Honeys from Different Geographic Regions Using Fourier Transform Infrared Spectroscopy and Multivariate Analysis. J. Food Sci. 2010, 75, C208–C214. [Google Scholar] [CrossRef]
  53. Bello-Pérez, L.A.; De Francisco, A.; Agama-Acevedo, E.; Gutierrez-Meraz, F.; García-Suarez, F.J.L. Morphological and Molecular Studies of Banana Starch. Food Sci. Technol. Int. 2005, 11, 367–372. [Google Scholar] [CrossRef]
  54. Millan-Testa, C.E.; Mendez-Montealvo, M.G.; Ottenhof, M.-A.; Farhat, I.A.; Bello-Pérez, L.A. Determination of the Molecular and Structural Characteristics of Okenia, Mango, and Banana Starches. J. Agric. Food Chem. 2005, 53, 495–501. [Google Scholar] [CrossRef] [PubMed]
  55. Warren, F.J.; Gidley, M.J.; Flanagan, B.M. Infrared Spectroscopy as a Tool to Characterise Starch Ordered Structure—a Joint FTIR–ATR, NMR, XRD and DSC Study. Carbohydr. Polym. 2016, 139, 35–42. [Google Scholar] [CrossRef] [Green Version]
  56. Dome, K.; Podgorbunskikh, E.; Bychkov, A.; Lomovsky, O. Changes in the Crystallinity Degree of Starch Having Different Types of Crystal Structure after Mechanical Pretreatment. Polymers 2020, 12, 641. [Google Scholar] [CrossRef] [PubMed] [Green Version]
  57. Fan, D.; Ma, W.; Wang, L.; Huang, J.; Zhao, J.; Zhang, H.; Chen, W. Determination of Structural Changes in Microwaved Rice Starch Using Fourier Transform Infrared and Raman Spectroscopy. Starch-Stärke 2012, 64, 598–606. [Google Scholar] [CrossRef]
  58. Das, R.; Kayastha, A.M. Enzymatic Hydrolysis of Native Granular Starches by a New β-Amylase from Peanut (Arachis Hypogaea). Food Chem. 2019, 276, 583–590. [Google Scholar] [CrossRef]
  59. Cordenunsi, B.R.; Lajolo, F.M. Starch Breakdown during Banana Ripening: Sucrose Synthase and Sucrose Phosphate Synthase. J. Agric. Food Chem. 1995, 43, 347–351. [Google Scholar] [CrossRef]
Figure 1. Representative images of the banana peel over a period of 21 days (i.e., days 2, 4, 7, 9, 11, 14, 17, 21) during fruit storage and ripening.
Applsci 13 03533 g001
Figure 2. Variations of image analysis computed features (lightness L*, a* parameter, b* parameter, mean, standard deviation, skewness, kurtosis, contrast, dissimilarity, energy, homogeneity, correlation, angular second moment (ASM), short-run emphasis (SRE), long-run emphasis (LRE), gray-level non-uniformity (GLN), run-length non-uniformity (RLN) and run percentage (RP)) of the banana peel samples, according to storage intervals of 2, 4, 7, 9, 11, 14, 17, 21 days.
Applsci 13 03533 g002aApplsci 13 03533 g002bApplsci 13 03533 g002cApplsci 13 03533 g002d
Figure 3. Scatter diagram of the discrimination, including textural features, amongst banana peel samples from days 2, 7, 11, and 21.
Applsci 13 03533 g003
Figure 4. Colored images of the fruit ripening of the iodine-stained banana flesh during the 21-day storage period (i.e., days 2, 4, 7, 9, 11, 14, 17, 21).
Applsci 13 03533 g004
Figure 5. Water activity (aw), moisture content (%), Brix, and titratable acidity (%) of the banana-flesh samples during storage at 18.0 ± 0.5 °C.
Applsci 13 03533 g005
Figure 6. Lightness (L*), redness/greenness (a*), yellowness/blueness (b*), and hue angle (h) of the banana-flesh samples during storage at 18.0 ± 0.5 °C.
Applsci 13 03533 g006aApplsci 13 03533 g006b
Figure 7. Firmness, springiness, adhesiveness, cohesiveness, and chewiness of the banana-flesh samples during storage, at 18.0 ± 0.5 °C.
Applsci 13 03533 g007
Figure 8. Pairwise correlation matrix between physicochemical parameters of the banana flesh and the features L*, a*, b* of the banana peel, during storage.
Applsci 13 03533 g008
Table 1. Variations of the feature mean values of the intensities of all the grayscale image pixels of the iodine-stained banana flesh, on days 2, 4, 7, 9, 11, 14, 17, 21 of storage.
DaysFeature Mean Value 1
226.778 ± 6.226 a
441.498 ± 13.915 b
757.879 ± 14.781 c
979.789 ± 17.804 d
1184.432 ± 20.755 d
14107.475 ± 22.436 e
17110.277 ± 18.991 e
21130.263 ± 17.983 f
1 Results expressed as feature mean value ± standard deviation (n = 8). Different letters in the same column after each value indicate statistically significant differences (p < 0.05), according to the Wilcoxon test.
Table 2. The spectral absorbance bands (intensities) of the banana flesh at different days of storage.
Regions (cm−1)Day 2Day 4Day 7Day 9Day 11Day 14Day 17Day 21
3640–35300.008 ± 0.001 a 10.005 ± 0.001 b0.006 ± 0.001 ab0.010 ± 0.002 c0.017 ± 0.001 d0.010 ± 0.001 c0.014 ± 0.002 e0.011 ± 0.001 c
34000.005 ± 0.001 a0.005 ± 0.001 a0.004 ± 0.001 a0.004 ± 0.001 a0.004 ± 0.000 a0.009 ± 0.002 b0.010 ± 0.001 b0.009 ± 0.002 b
33250.004 ± 0.001 a0.003 ± 0.001 a0.004 ± 0.001 a0.003 ± 0.000 a0.004 ± 0.001 a0.003 ± 0.000 a0.003 ± 0.001 a0.004 ± 0.001 a
3300–32000.005 ± 0.001 a0.008 ± 0.001 b0.010 ± 0.002 bc0.011 ± 0.001 c0.012 ± 0.001 c0.011 ± 0.001 c0.010 ± 0.001 bc0.010 ± 0.001 bc
29320.049 ± 0.008 a0.048 ± 0.006 a0.032 ± 0.002 b0.003 ± 0.001 c0.004 ± 0.002 c0.003 ± 0.001 c0.002 ± 0.001 c-
17380.002 ± 0.000 a0.003 ± 0.001 ab0.003 ± 0.001 ab0.003 ± 0.000 b0.003 ± 0.001 ab0.003 ± 0.001 ab0.002 ± 0.000 a0.003 ± 0.000 b
1647–16320.167 ± 0.010 a0.165 ± 0.009 a0.172 ± 0.009 a0.180 ± 0.008 a0.186 ± 0.015 ab0.210 ± 0.015 b0.211 ± 0.022 b0.220 ± 0.017 b
1465–14500.006 ± 0.001 a0.006 ± 0.001 a0.007 ± 0.001 a0.006 ± 0.001 a0.006 ± 0.001 a0.007 ± 0.001 a0.007 ± 0.001 a0.007 ± 0.001 a
1420–14100.003 ± 0.000 a0.005 ± 0.001 b0.005 ± 0.001 b0.002 ± 0.000 c0.002 ± 0.000 c0.002 ± 0.000 c0.002 ± 0.000 c0.002 ± 0.000 c
1366–13390.012 ± 0.004 ab0.016 ± 0.001 a0.011 ± 0.002 b0.003 ± 0.001 c0.003 ± 0.001 c0.002 ± 0.000 c0.002 ± 0.000 c0.003 ± 0.001 c
1261–12290.007 ± 0.001 a0.006 ± 0.001 a0.006 ± 0.002 a0.006 ± 0.002 a0.009 ± 0.002 a0.009 ± 0.003 a0.009 ± 0.003 a0.010 ± 0.003 a
1153–11490.062 ± 0.007 a0.064 ± 0.005 a0.039 ± 0.004 b0.014 ± 0.001 c0.016 ± 0.003 c0.016 ± 0.004 c0.014 ± 0.002 c0.014 ± 0.002 c
11050.015 ± 0.002 abc0.015 ± 0.002 abc0.018 ± 0.003 a0.013 ± 0.001 bc0.016 ± 0.003 ab0.014 ± 0.003 abc0.012 ± 0.001 c0.013 ± 0.002 ab
10760.055 ± 0.007 a0.056 ± 0.005 a0.035 ± 0.005 b-----
1055–10450.016 ± 0.002 a0.016 ± 0.002 a0.021 ± 0.003 b0.036 ± 0.008 c0.040 ± 0.006 cd0.045 ± 0.004 cd0.045 ± 0.003 d0.056 ± 0.006 e
1000–9950.186 ± 0.024 a0.183 ± 0.014 a0.107 ± 0.012 b0.019 ± 0.002 c0.014 ± 0.002 d0.010 ± 0.001 e0.004 ± 0.000 f0.002 ± 0.000 g
9280.023 ± 0.003 a0.024 ± 0.002 a0.018 ± 0.003 b0.009 ± 0.001 c0.007 ± 0.001 cd0.006 ± 0.001 d0.002 ± 0.000 e-
865–8580.007 ± 0.002 a0.007 ± 0.002 a0.003 ± 0.000 b-----
770–7350.005 ± 0.001 a0.006 ± 0.001 a0.002 ± 0.000 b-----
7200.003 ± 0.001 a0.003 ± 0.001 a0.002 ± 0.000 a-----
5770.016 ± 0.002 a0.016 ± 0.004 ab0.011 ± 0.002 b0.004 ± 0.001 c----
5230.006 ± 0.001 a0.006 ± 0.001 a0.005 ± 0.001 ab0.004 ± 0.001 b0.005 ± 0.001 ab0.004 ± 0.001 b0.004 ± 0.001 b0.002 ± 0.000 c
1 Mean values of peak intensities; a–g: Different letters in the same row show statistically significant differences (p < 0.05).
Disclaimer/Publisher’s Note: The statements, opinions and data contained in all publications are solely those of the individual author(s) and contributor(s) and not of MDPI and/or the editor(s). MDPI and/or the editor(s) disclaim responsibility for any injury to people or property resulting from any ideas, methods, instructions or products referred to in the content.

