Article

Color Change, Biaxial Flexural Strength, and Fractographic Analysis of Resin-Modified CAD/CAM Ceramics Subjected to Different Surface Finishing Protocols

1
Department of Prosthetic Dental Sciences, College of Dentistry, King Saud University, Riyadh 11545, Saudi Arabia
2
Department of Restorative Dental Sciences, College of Dentistry, King Saud University, Riyadh 11545, Saudi Arabia
3
Security Forces Hospital, Ministry of Interior, Riyadh 11564, Saudi Arabia
4
Dental Health Department, College of Applied Medical Sciences, King Saud University, Riyadh 11545, Saudi Arabia
5
Department of Oral and Maxillofacial Prosthodontics, Faculty of Dentistry, King Abdulaziz University, Jeddah 21589, Saudi Arabia
*
Author to whom correspondence should be addressed.
Appl. Sci. 2023, 13(6), 3415; https://doi.org/10.3390/app13063415
Submission received: 31 January 2023 / Revised: 4 March 2023 / Accepted: 5 March 2023 / Published: 8 March 2023
(This article belongs to the Section Applied Dentistry and Oral Sciences)

Abstract

:
This in vitro study compared the color change (∆E) and biaxial flexural strength (BFS) of two resin nanoceramics (LU and CS) and two polymer-infiltrated ceramic networks (VE and CU) after different surface finishing protocols. A total of 192 discs (12 × 1.2 mm2) were prepared from the materials (n = 48) and then polished with 1200-grit silicon carbide paper, followed by roughening with a 30 µm grit diamond bur. According to the surface finishing applied, the discs from each material category were categorized into four groups: control group (no finishing), polishing (MP), glazing (OG), or a combination of MP and additional polishing (MP+PP). Following surface finishing, all the discs were immersed in a coffee beverage to simulate one year of clinical use. A spectrophotometer and universal testing machine were used to measure the ∆E and BFS, respectively. Fractographic analysis was performed using scanning electron microscopy images. Multivariate analysis of variance was used for the statistical analysis, followed by one-way ANOVA and post hoc Dunnett’s test (a = 0.05). The ∆E and BFS were significantly impacted by material type and surface finishing (p ≤ 0.05). Irrespective of the materials and finishing, untreated LU and OG-treated VE specimens demonstrated the highest (2.98 ± 0.36) and lowest (1.21 ± 0.33) color changes. Regarding BFS, untreated CU and OG-treated CS specimens demonstrated the lowest (121.88 ± 2.08 MPa) and highest (174.17 ± 3.83 MPa) values. Surface finishing using glazing resulted in the highest BFS and lowest ∆E compared to other surface finishing protocols for the tested materials. VE demonstrated the least color changes, and CS showed the highest BFS following surface finishing of the materials tested. Surface finishing is material dependent; thus, it is critical to use the best surface finishing protocol in a clinical setting.

1. Introduction

One of the tremendous advancements in the fast-evolving dental field is computer-aided design and computer-aided manufacturing (CAD/CAM) technology, which has significantly improved the provided dental care [1,2]. Digital technology will help to provide treatment in a more efficient way than conventional methods in terms of time, effort, and cost-effectiveness [3,4,5]. Recent breakthroughs in the CAD–CAM systems have made them more user-friendly and less costly with more precise outcomes [4,6]. Clinicians should be aware of the advantages and disadvantages of different dental restorative materials as CAD/CAM technology and digital dentistry have become more widespread in routine dental practice [1].
Ceramics is one of the materials used in dentistry as a restorative material. Ceramic restorative materials are categorized as glass-matrix, polycrystalline, or resin-modified ceramics, depending on their formulations [7]. Resin-modified ceramic materials are further subdivided into resin composites comprising glass particles incorporated in a polymer matrix (e.g., Lava Ultimate, LU and Cerasmart, CS) and porous interconnecting feldspathic porcelain infiltrated by a polymer (Vita Enamic, VE) [7]. A recently introduced resin-modified ceramic for the CAD/CAM technique is Crystal Ultra (CU), which has a higher polymer content than VE. The manufacturer of CU (https://crystalultra.com, accessed on 18 August 2022) claims that it is the strongest, lightest, and most durable elastic resin-modified ceramic available in the market as of today. Resin-modified ceramics incorporate the advantageous properties of ceramics, mainly the color stability, strength, and elasticity comparable to human enamel, with low abrasiveness, elasticity simulating human dentin, and repairability benefits of resin composite [8,9,10,11,12,13].
During try-in of the restoration, there might be some adjustments required, either in occlusal or interproximal, which are performed with a rotary diamond bur. This process removes the superficial glaze, thereby affecting the surface properties of the restoration [14]. Consequently, the aesthetics of the restoration, color scale, and color stability are affected [15,16]. In addition, decreased flexural strength and increased wear of the opposing tooth might accompany increased surface roughness [17,18].To guarantee the long-term success of dental prosthesis, the surface-modified restoration needs to be polished using the best available technique [19,20]. Resin-modified ceramics materials’ manufacturers recommend finishing and polishing using diamond-impregnated rubber points and a soft Robinson brush (#9). Another way to restore the smoothness of the surface is with a light-cured glazing product [6].
The aspect of color is very important in aesthetic dentistry. That said, the important characteristic that could be affected after adjusting the restoration clinically, followed by repolishing or reglazing, is color stability (∆E) [21]. The restoration adjustment impacts the ∆E because of the direct relationship between color change and surface roughness; a rougher surface will have more staining than a smoother surface [21]. Accordingly, the most suitable method should be followed to regain the smoothness of the surface and to have less color change. There are many factors that have a role in the ∆E; one of them is the nature of the material itself. The objective color measurement in dentistry is performed either by spectrophotometers or colorimeters. A spectrophotometer, however, offers more accurate readings since it allows wavelength-by-wavelength spectrum measurement of the object’s transmission and reflection characteristics [22,23]. Similarly, the clinical adjustment and repolishing or reglazing of the restoration also affects flexural strength. Flexural strength is the limit that can be tolerated by the material without deformation when subjected to bending force [24]. It is a crucial feature of a material, and the required limit depends on its clinical application and the amount of the applied masticatory force [25]. It is well-documented that adjusting the restorations followed by repolishing or reglazing might influence the flexural strength of the zirconia restorations negatively [26,27]. However, the data regarding the effect of surface finishing of resin-modified ceramics is limited or unavailable. The three-point and the biaxial tests are the most common methods to measure flexural strength; however, the biaxial test is the test of choice of many researchers since it does not cause the problem of edge fracture [24]. The international standards organization (ISO-6872) recommends the piston-on-three-balls test for determining the flexural strength of dental ceramics [28].
The usage of resin-modified ceramics for clinical use (crowns, bridges, and veneers) has significantly increased in recent years, and at the same time, many new products have entered the dental market. However, there is little to no information available on the impact of various surface finishing protocols on the color changes and flexural strength of these newer ceramics. This study compared four resin-modified CAD/CAM ceramic materials’ color changes and flexural strength following various surface finishing protocols. The first null hypothesis is that the studied CAD/CAM materials do not significantly differ in color change after various surface finishing protocols. The second null hypothesis is that the studied CAD/CAM materials do not significantly differ in flexural strength after various surface finishing protocols.

2. Materials and Methods

In this study, Lava Ultimate (LU), Vita Enamic (VE), Cerasmart (CS), and Crystal Ultra (CU) CAD/CAM ceramics were tested (Table 1). All the tested materials are highly translucent (HT) and were A2 shade or an equivalent for the purpose of standardization of the specimens for color stability test. The sample size was calculated per previous studies [1,29,30]. Accordingly, a total of 192 (12 × 1.2 mm2) discs with 48 specimens (n = 48) for each material group were prepared.

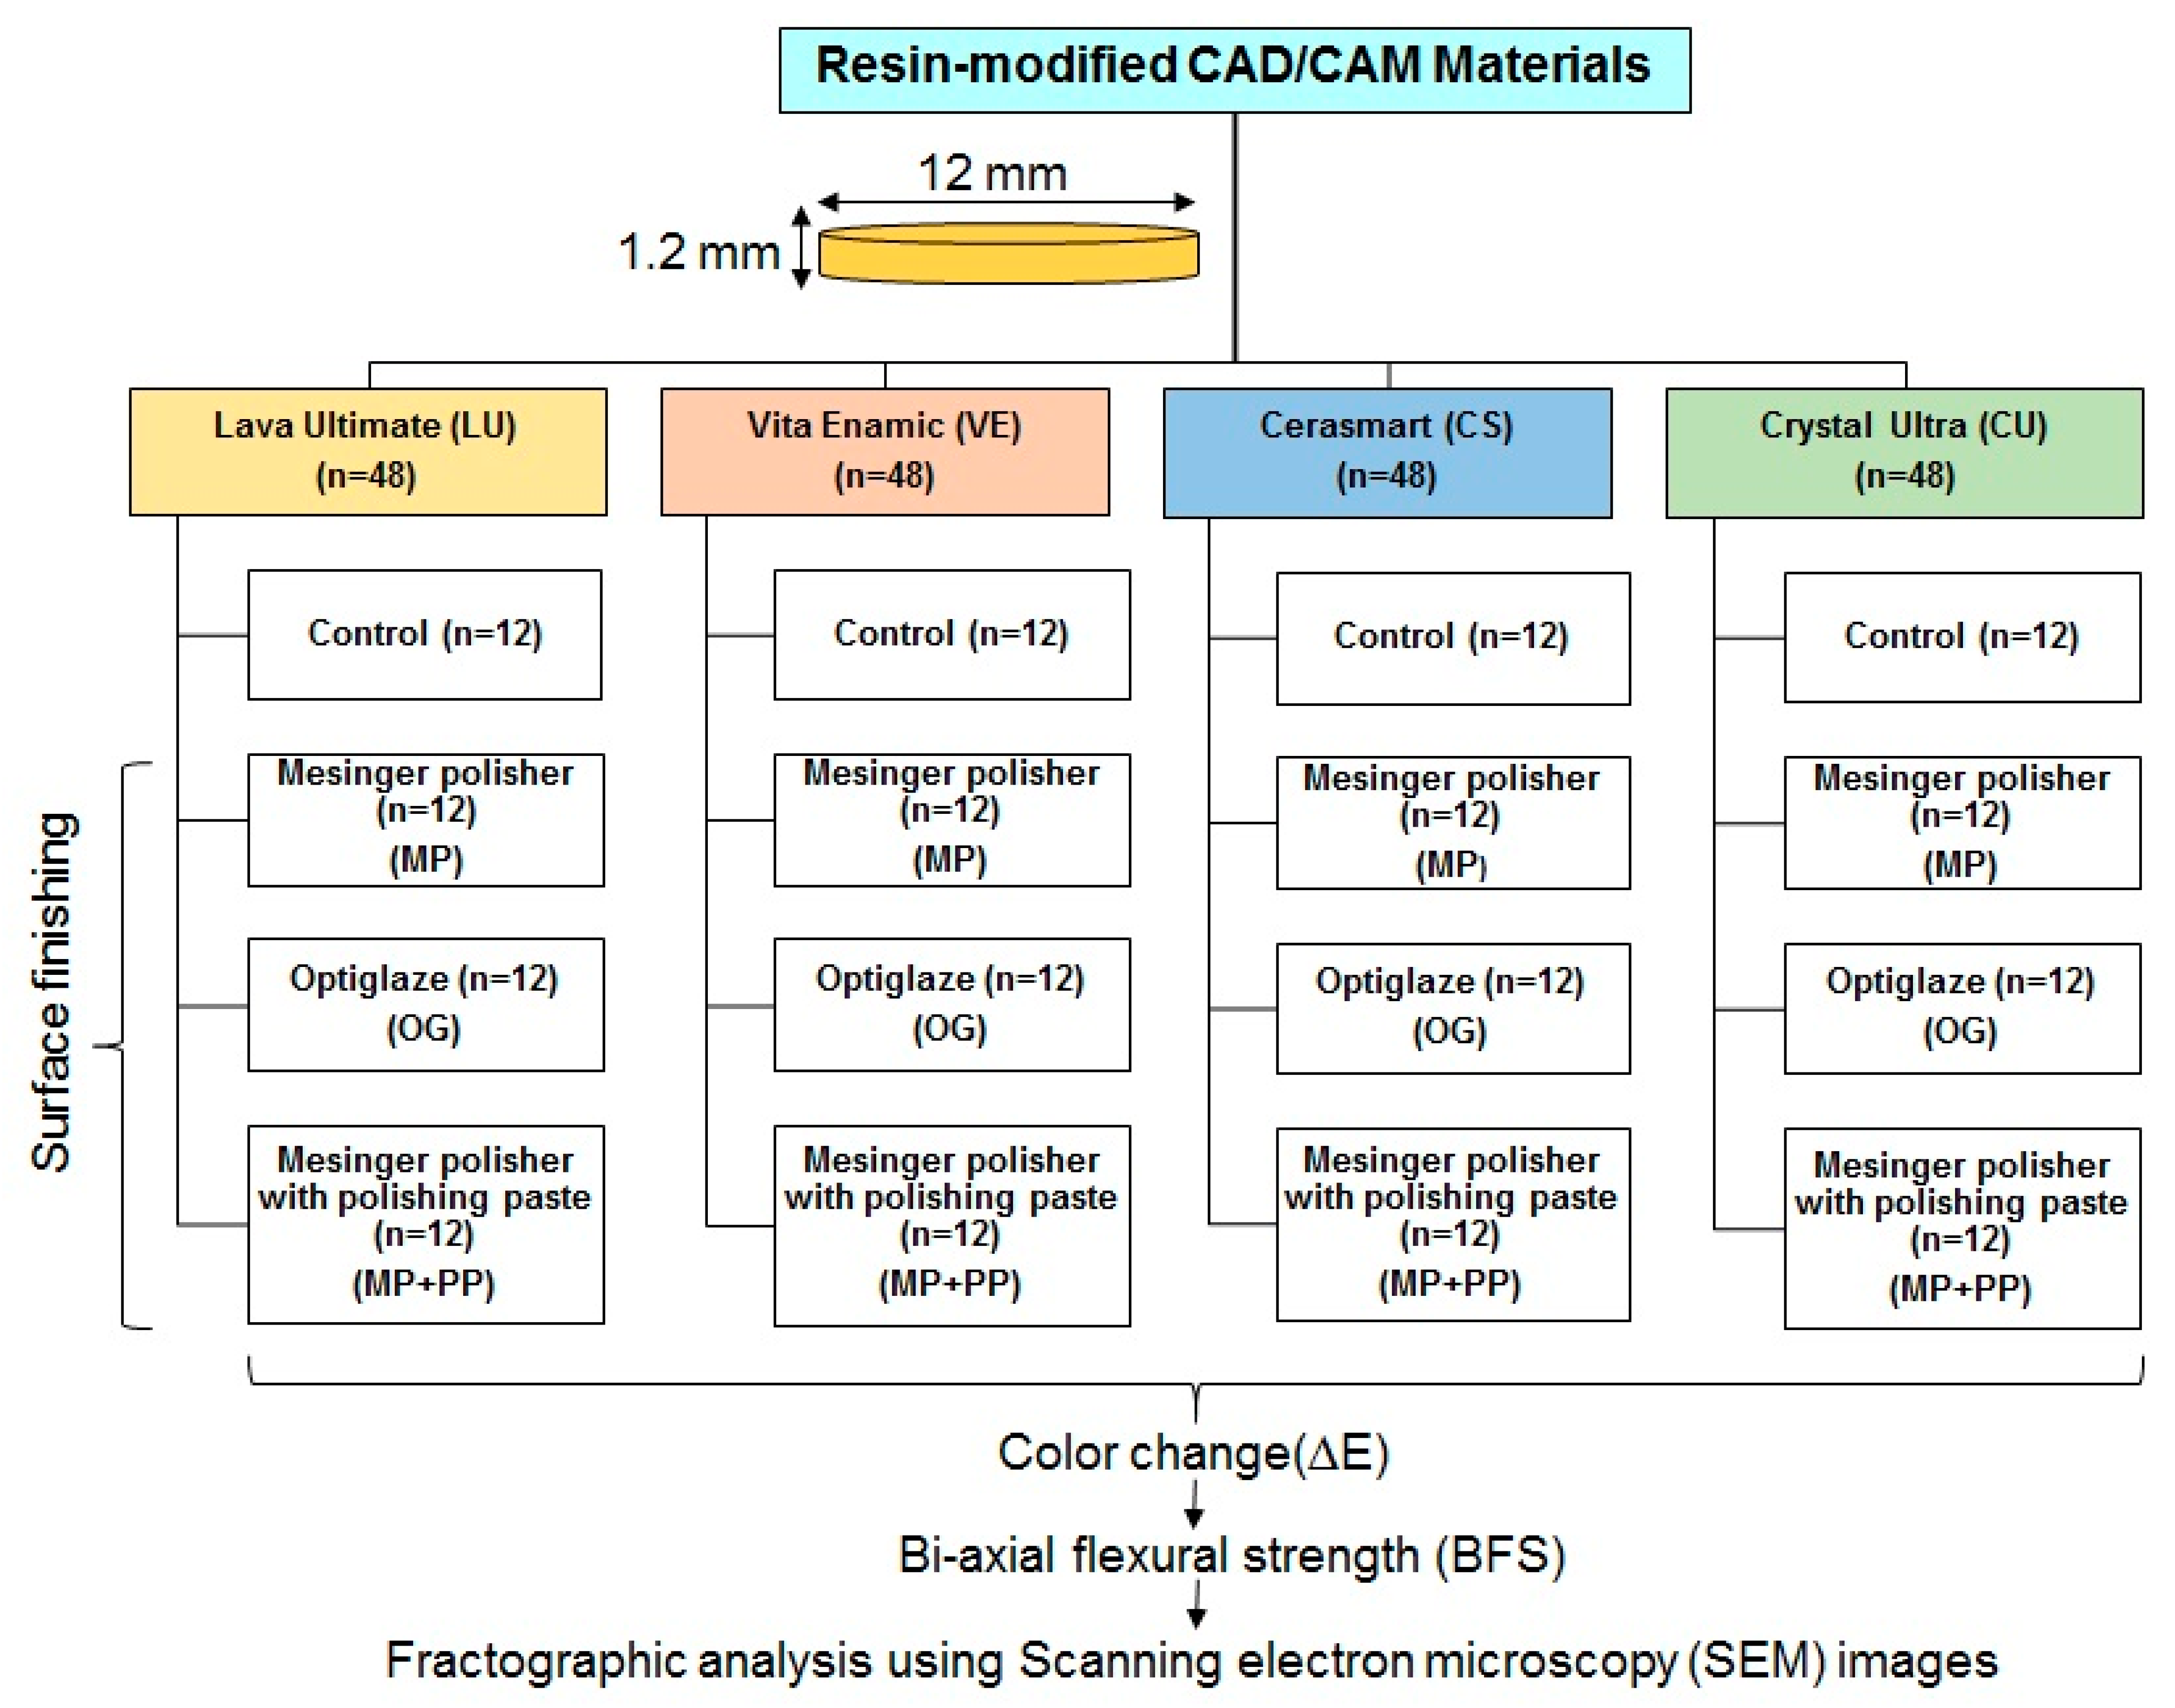
2.1. Specimen Preparation and Surface Finishing Protocol

The CAD/CAM blanks were milled into 12 mm cylindrical blocks using the Ceramill Motion 2 equipment (Amann Girrbach, Koblach, Austria), followed by slicing 1.20 mm circular discs from the cylindrical blocks with an IsoMet 1000 automated precision saw (Buehler, Bluff, IL, USA). The specimens were polished using 300-grit to 1200-grit silicon carbide sheets (Struers, Copenhagen, Denmark) at 300 rpm for 30 s under water coolant [31]. To validate that all specimens were constrained to a consistent thickness of 1.2 mm, a digital micrometer (Mitutoyo, Aurora, IL, USA) was utilized. All the discs were then cleaned for 10 min in an ultrasonic bath (L and R Manufacturing, Inc., Kearny, NJ, USA) and air-dried for 40 s [32]. To replicate the clinical circumstances of intra-oral adjustment, the disc surface was altered using diamond rotary bur (30 µm grit, Komet, Rock Hill, SC, USA) in a single direction for 30 s under water coolant [33,34]. Next, using the simple randomization procedure, the discs from each material category were allotted into four groups at random (Research Randomizer, v. 4.0, available at http://www.randomizer.org/, accessed on 2 November 2022). Figure 1 presents the flow chart illustrating the group allocation and study procedure.
One of the four groups, the control group, received no surface finishing. Following the manufacturer’s instructions, the other three groups were polished using polishing kits that were readily available commercially (Table 2).
The specimen surface of the MP group was treated with a Luster Meisinger polishing kit in two steps; the surface was initially smoothened with #9507U polisher at 7000–10,000 rpm, followed by polishing at 3000–10,000 rpm with #9786 polisher. The specimens in the OG group underwent light polymerization of the surface for 40 s (Bluephase G2 LED, Ivoclar Vivadent, Schaan, Liechtenstein) after receiving a homogeneous coating of light-polymerized glazing agent applied with a microbrush. The specimens in the MP+PP group were first polished similarly to those in the MP group, and then they were polished additionally using polishing paste containing 2 μm and 4 μm abrasive grains (SHOFU Dental GmbH, Ratingen, Germany) and soft Robinson brush (#9, Abbott-Robinson, Key-stone Dental Group, Bosworth, UK) with handpiece speed of 9000 rpm. To ensure uniformity, all the specimens were finished and polished by a single person [M.H.] using a customized holder for the polishing handpiece (30,000 rpm, Henry Schein, Inc., Melville, NY, USA) (Figure 2).

2.2. Coffee Staining and Color Change Analysis Using Spectrophotometer

After surface finishing, the discs were subjected to coffee staining. The coffee beverage (Nescafe Classic, Nestle Middle East Manufacturing LLC., Dubai, United Arab Emirates) was prepared and stored in accordance with a previous study [35]. The discs were stored in a Petri dish filled with a sufficient quantity of the coffee beverage. The discs were submerged for 12 days, which is equal to one year of coffee intake by an individual [21]. The beverage was prepared fresh daily.
The color of the discs was measured at baseline and following surface finishing and coffee immersion using a spectrophotometer (CM-2600d, Konica Minolta Sensing Inc., Osaka, Japan). A D65 light source illuminant and a black background with integrated geometry for the specular component were used to measure the color. The system software program used the measured spectral reflectance of each disc to calculate color changes (∆E) using the CIELab Formula (1) [29]:
Δ E = L 2 * L 1 * + a 2 * a 1 * + ( b 2 * b 1 * ) 2
where L is the disparity between light and darkness, a is the disparity in the green and red axes, and b is the disparity between the blue and yellow [29]. L1, a1, and b1 are the Lab coordinates of the baseline color, while L2, a2, and b2 are the coordinates of the post-surface finishing and coffee staining color. Each disc was measured at three equidistant areas, and the mean was calculated.

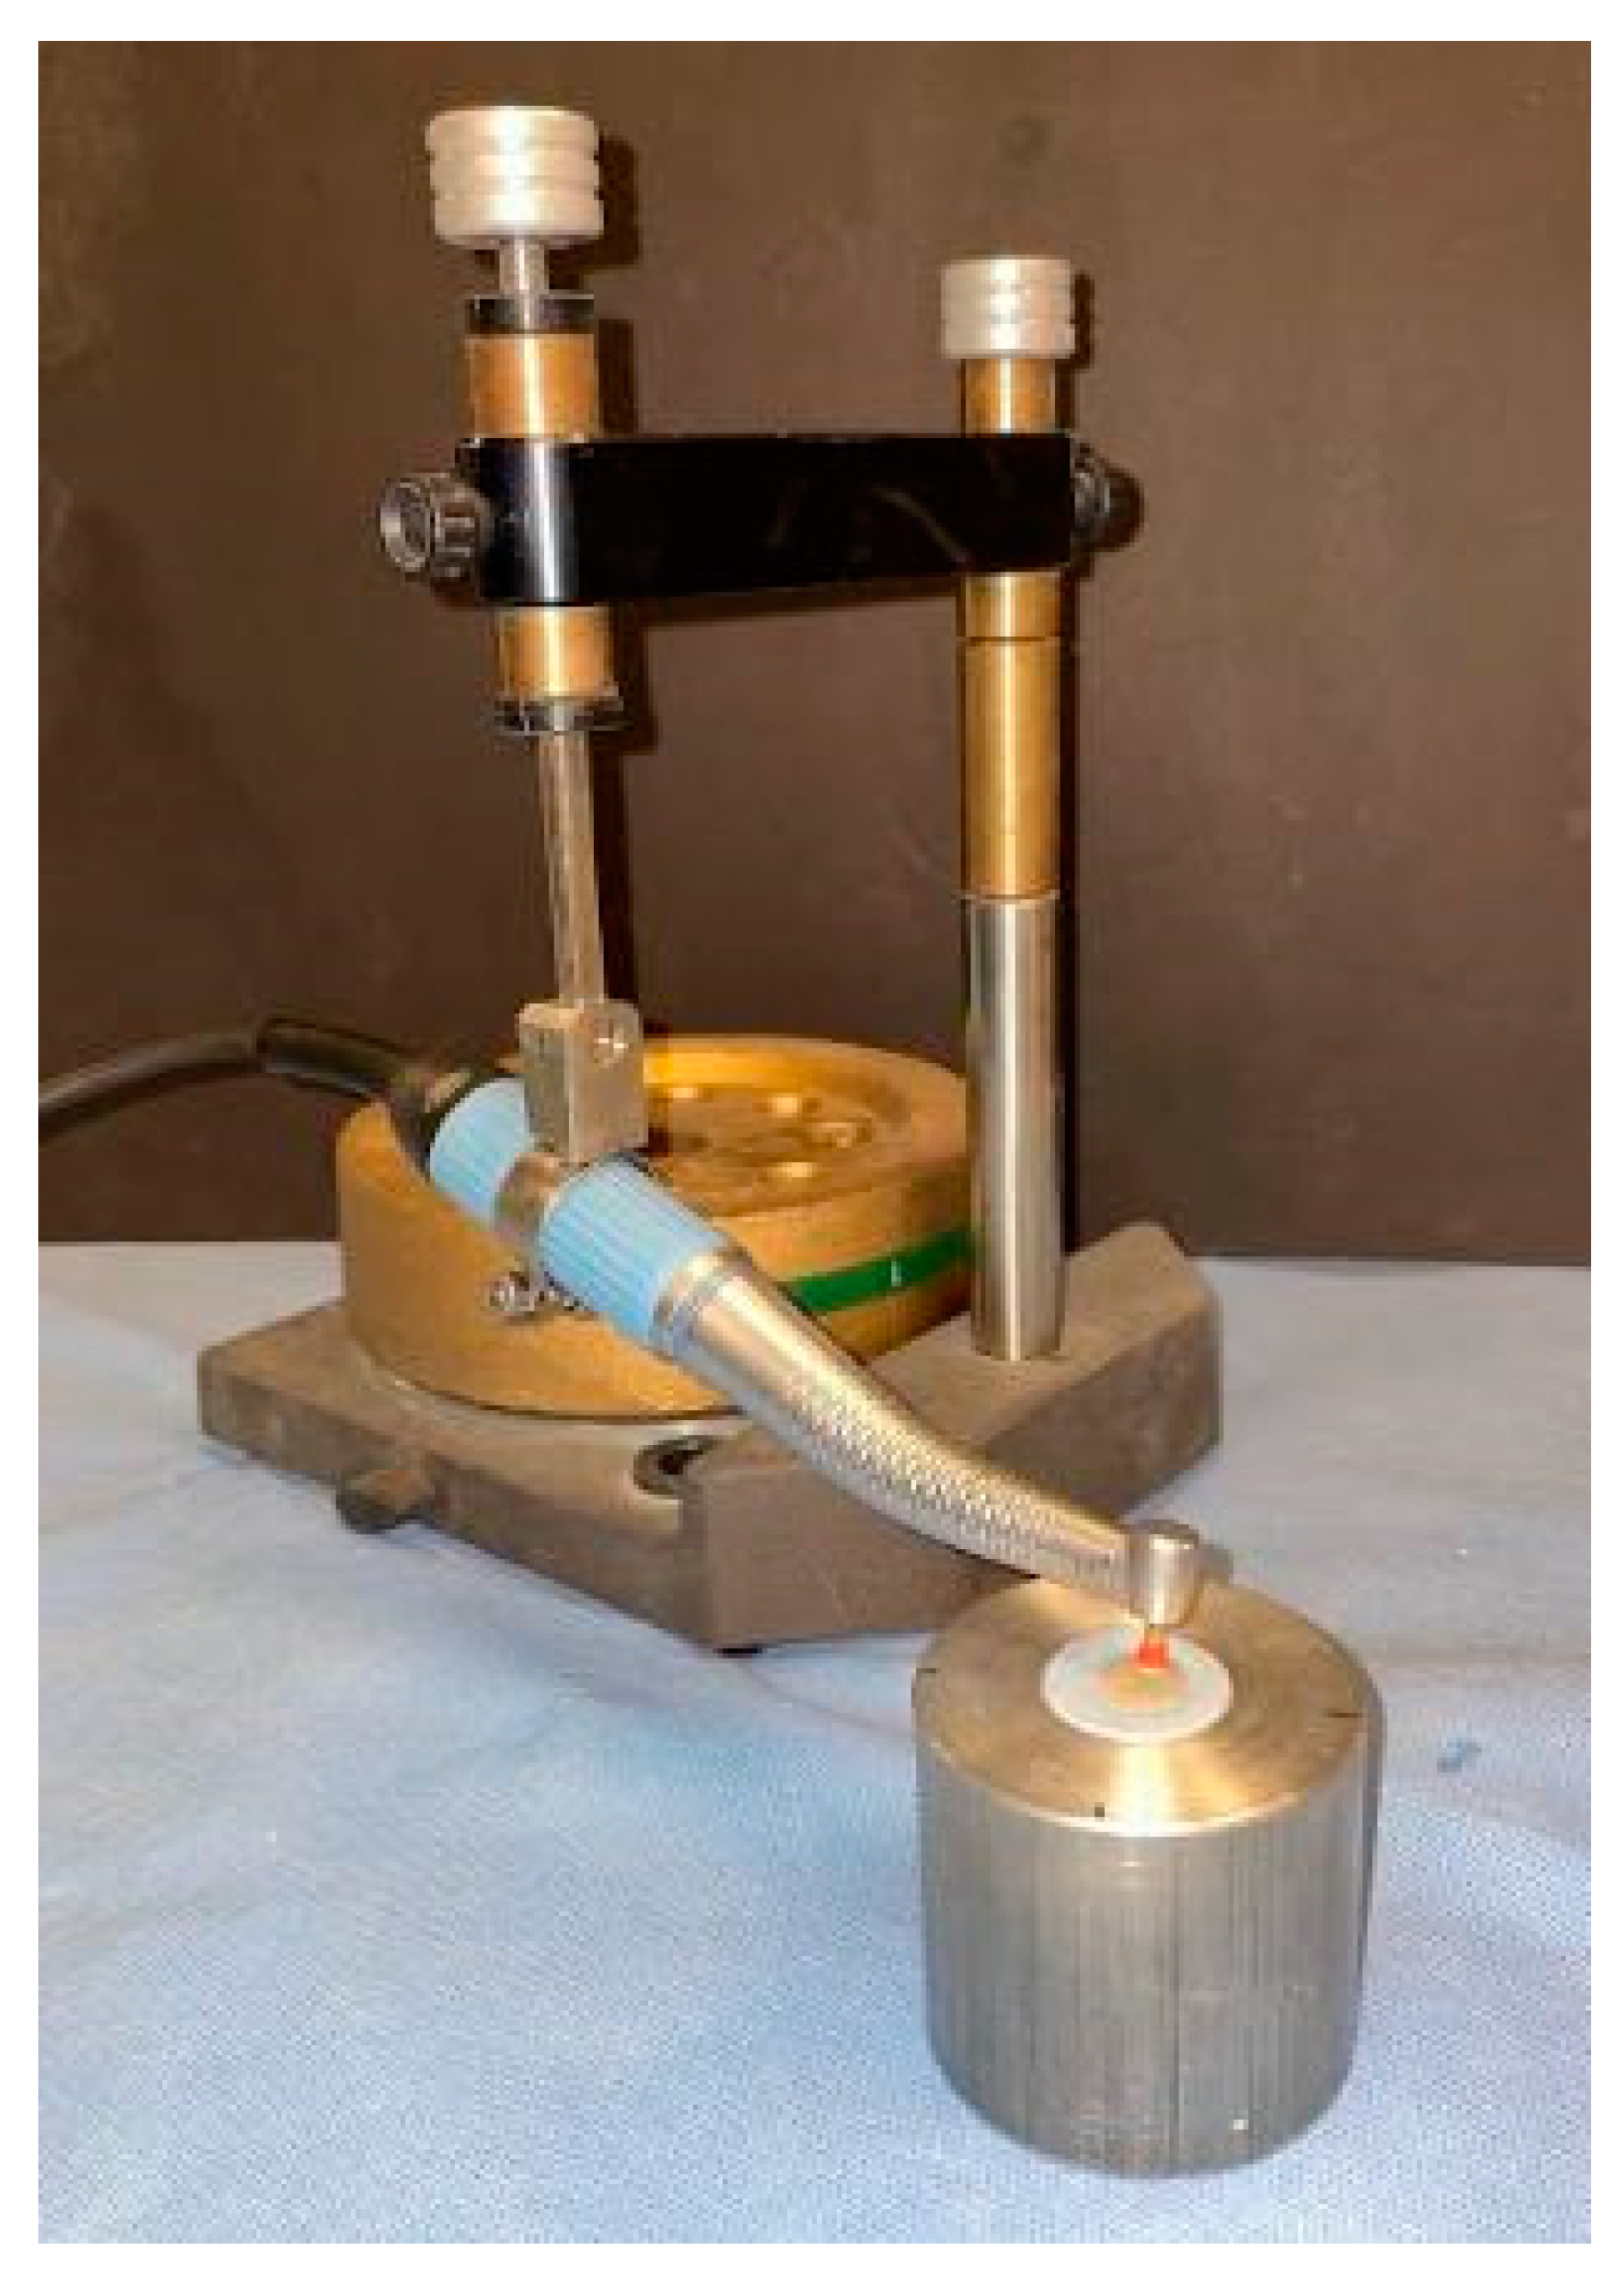
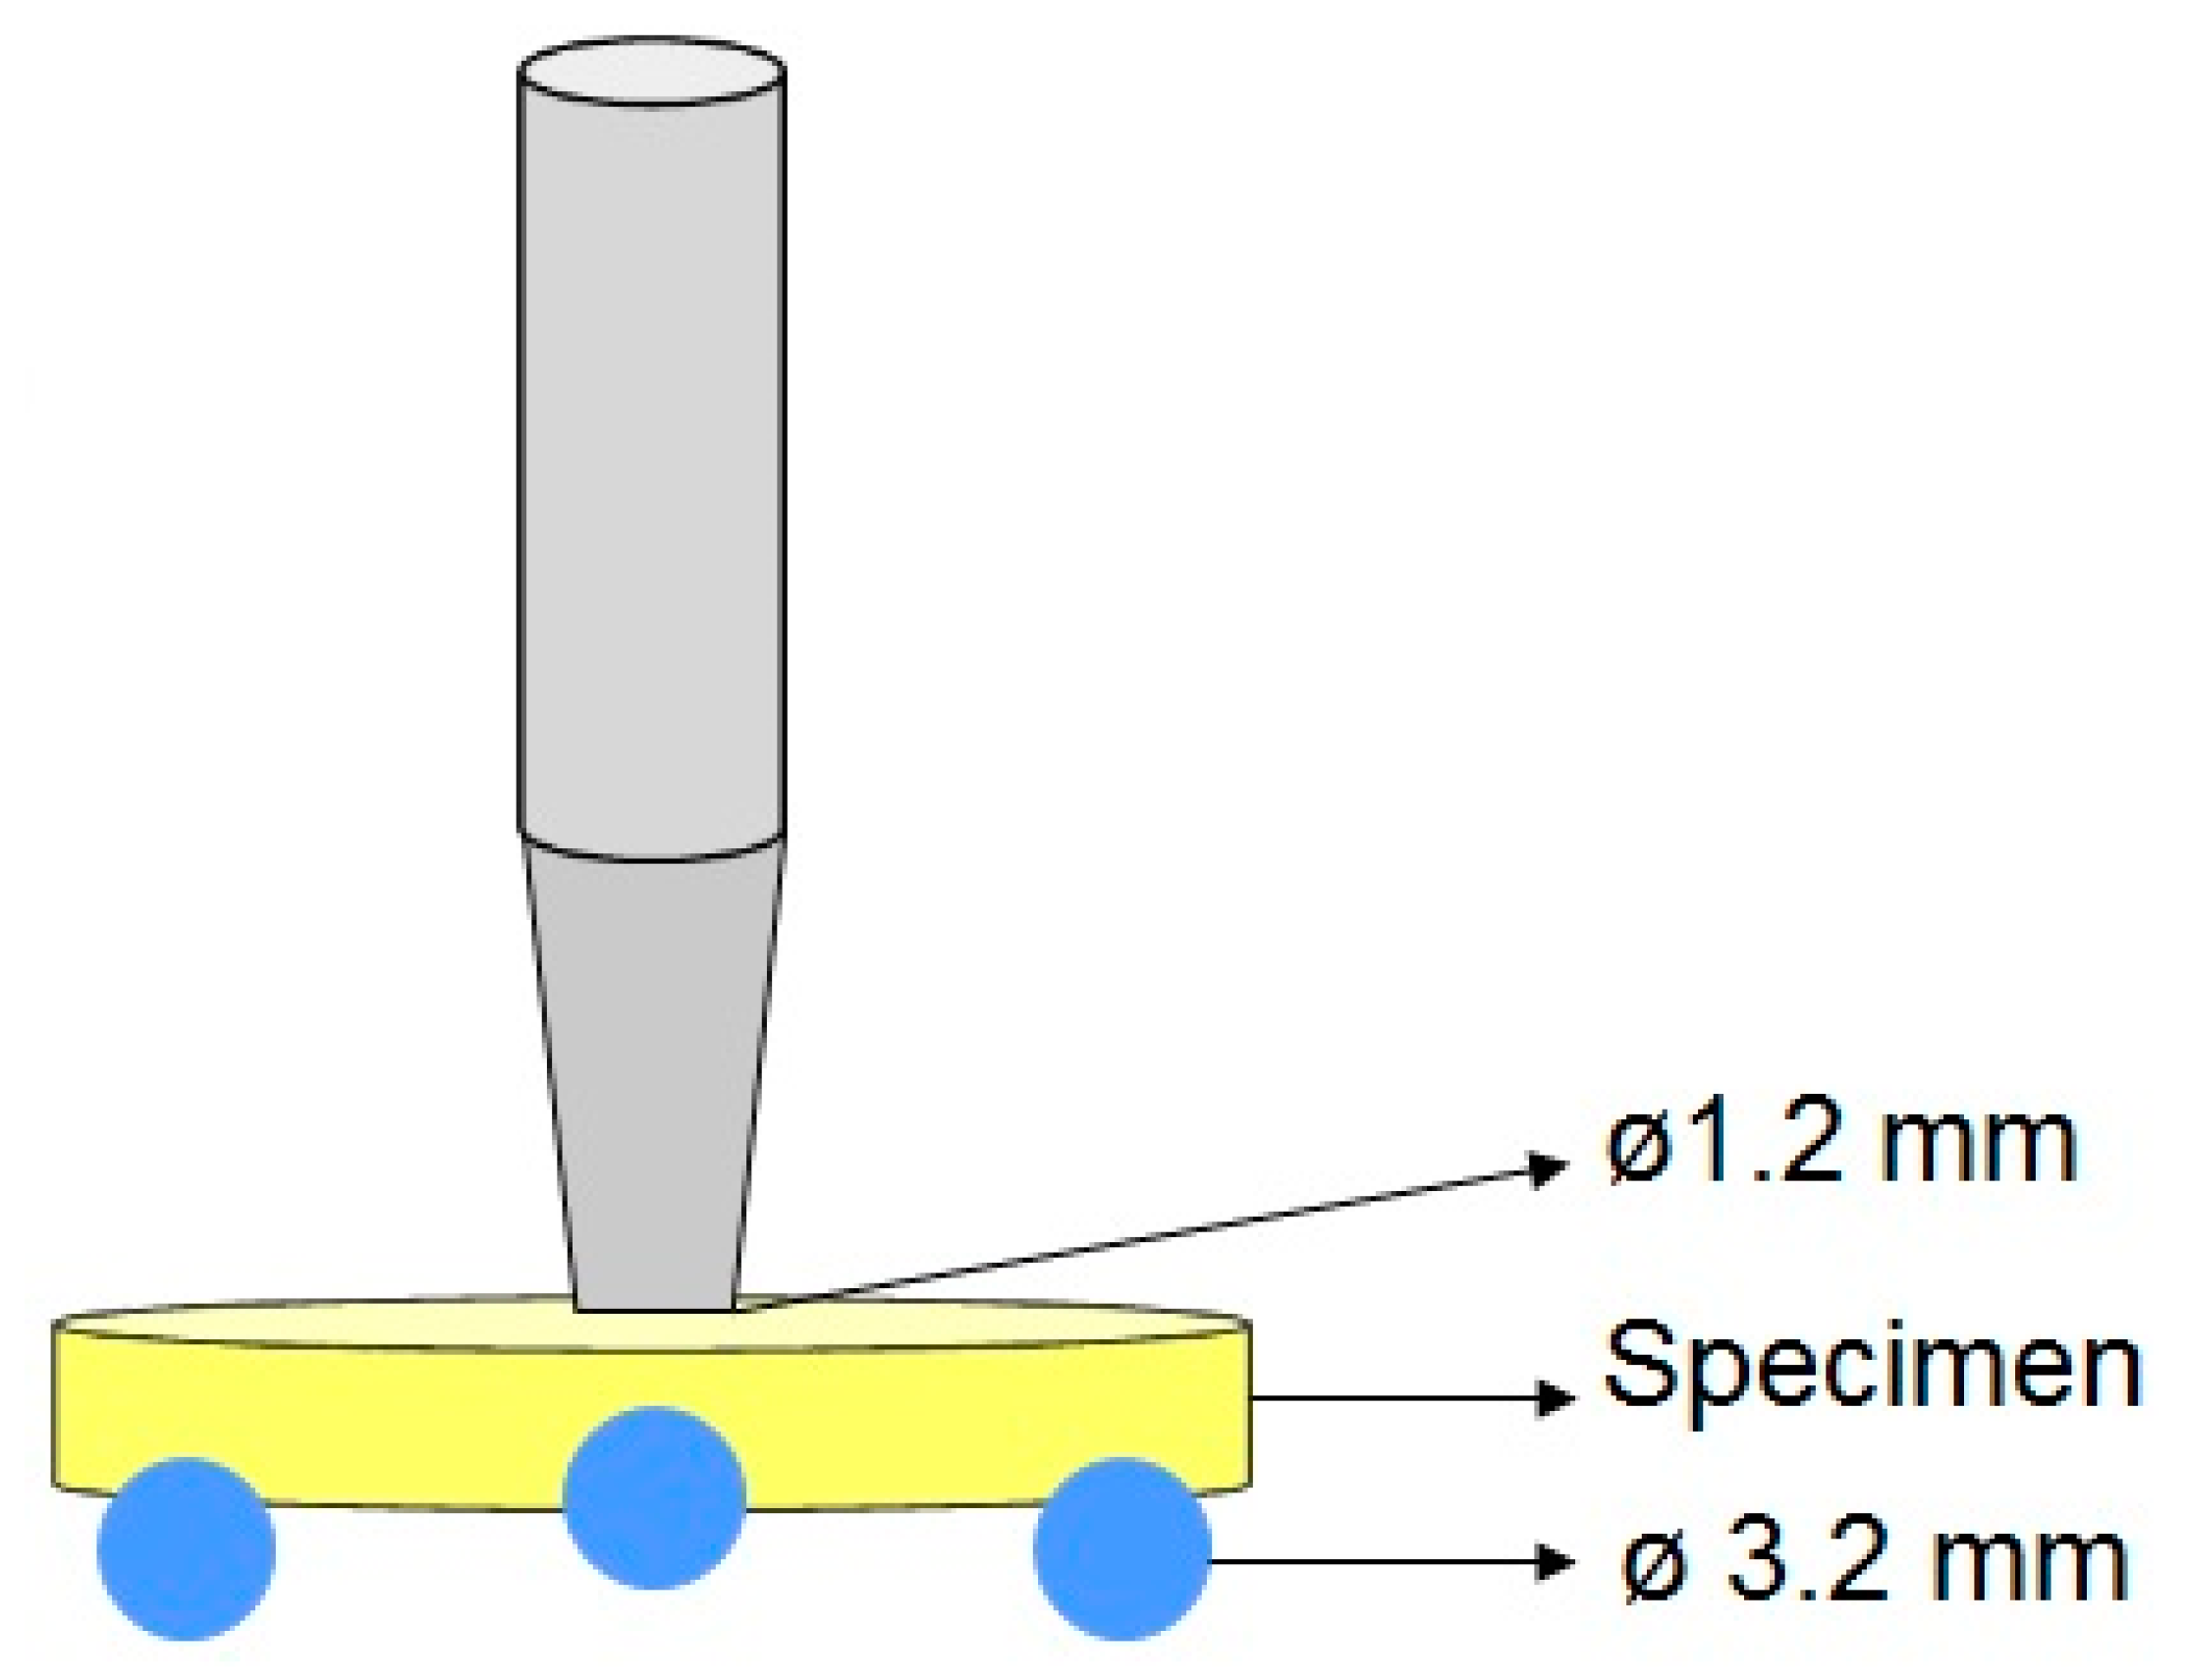
2.3. Biaxial Flexural Strength (BFS) Testing

The BFS test was performed per specification No. 6872 of ISO using Instron Machine (Instron Corp., Norwood, MA, USA) [28]. The disc was placed to receive the compressive stress exerted by the loading piston of the universal testing Instron machine. Three 3.2 mm stainless steel balls that were positioned at a 120-degree angle served as supports for the disc, and the support circle’s overall diameter was 10 mm. A 1.2 mm piston from the upper arm of the testing machine was directed towards the center of the disc at a crosshead speed of 0.5 mm/min till fracture occurred (Figure 3) [32].
The load at fracture was documented, and the BFS was determined using Formula (2):
s = 0.2387   p X Y d 2
X = 1 + v I n r 2 r 3 2 + 1 v 2 r 2 r 3 2
= 1 + v 1 + I n r 2 r 3 2 + 1 v r 1 r 3 2
where S is the maximal tensile stress in Pascals, p is the complete load initiating fracture (Newtons, N), d is the specimen thickness in mm at fracture origin, and v is Poisson’s ratio. If the value for the tested ceramic is unknown, a Poisson’s ratio of 0.25 is used; r1, r2, and r3 are the radii of the support circle, the loaded area, and the specimen, respectively (all the values are expressed in mm) [32].

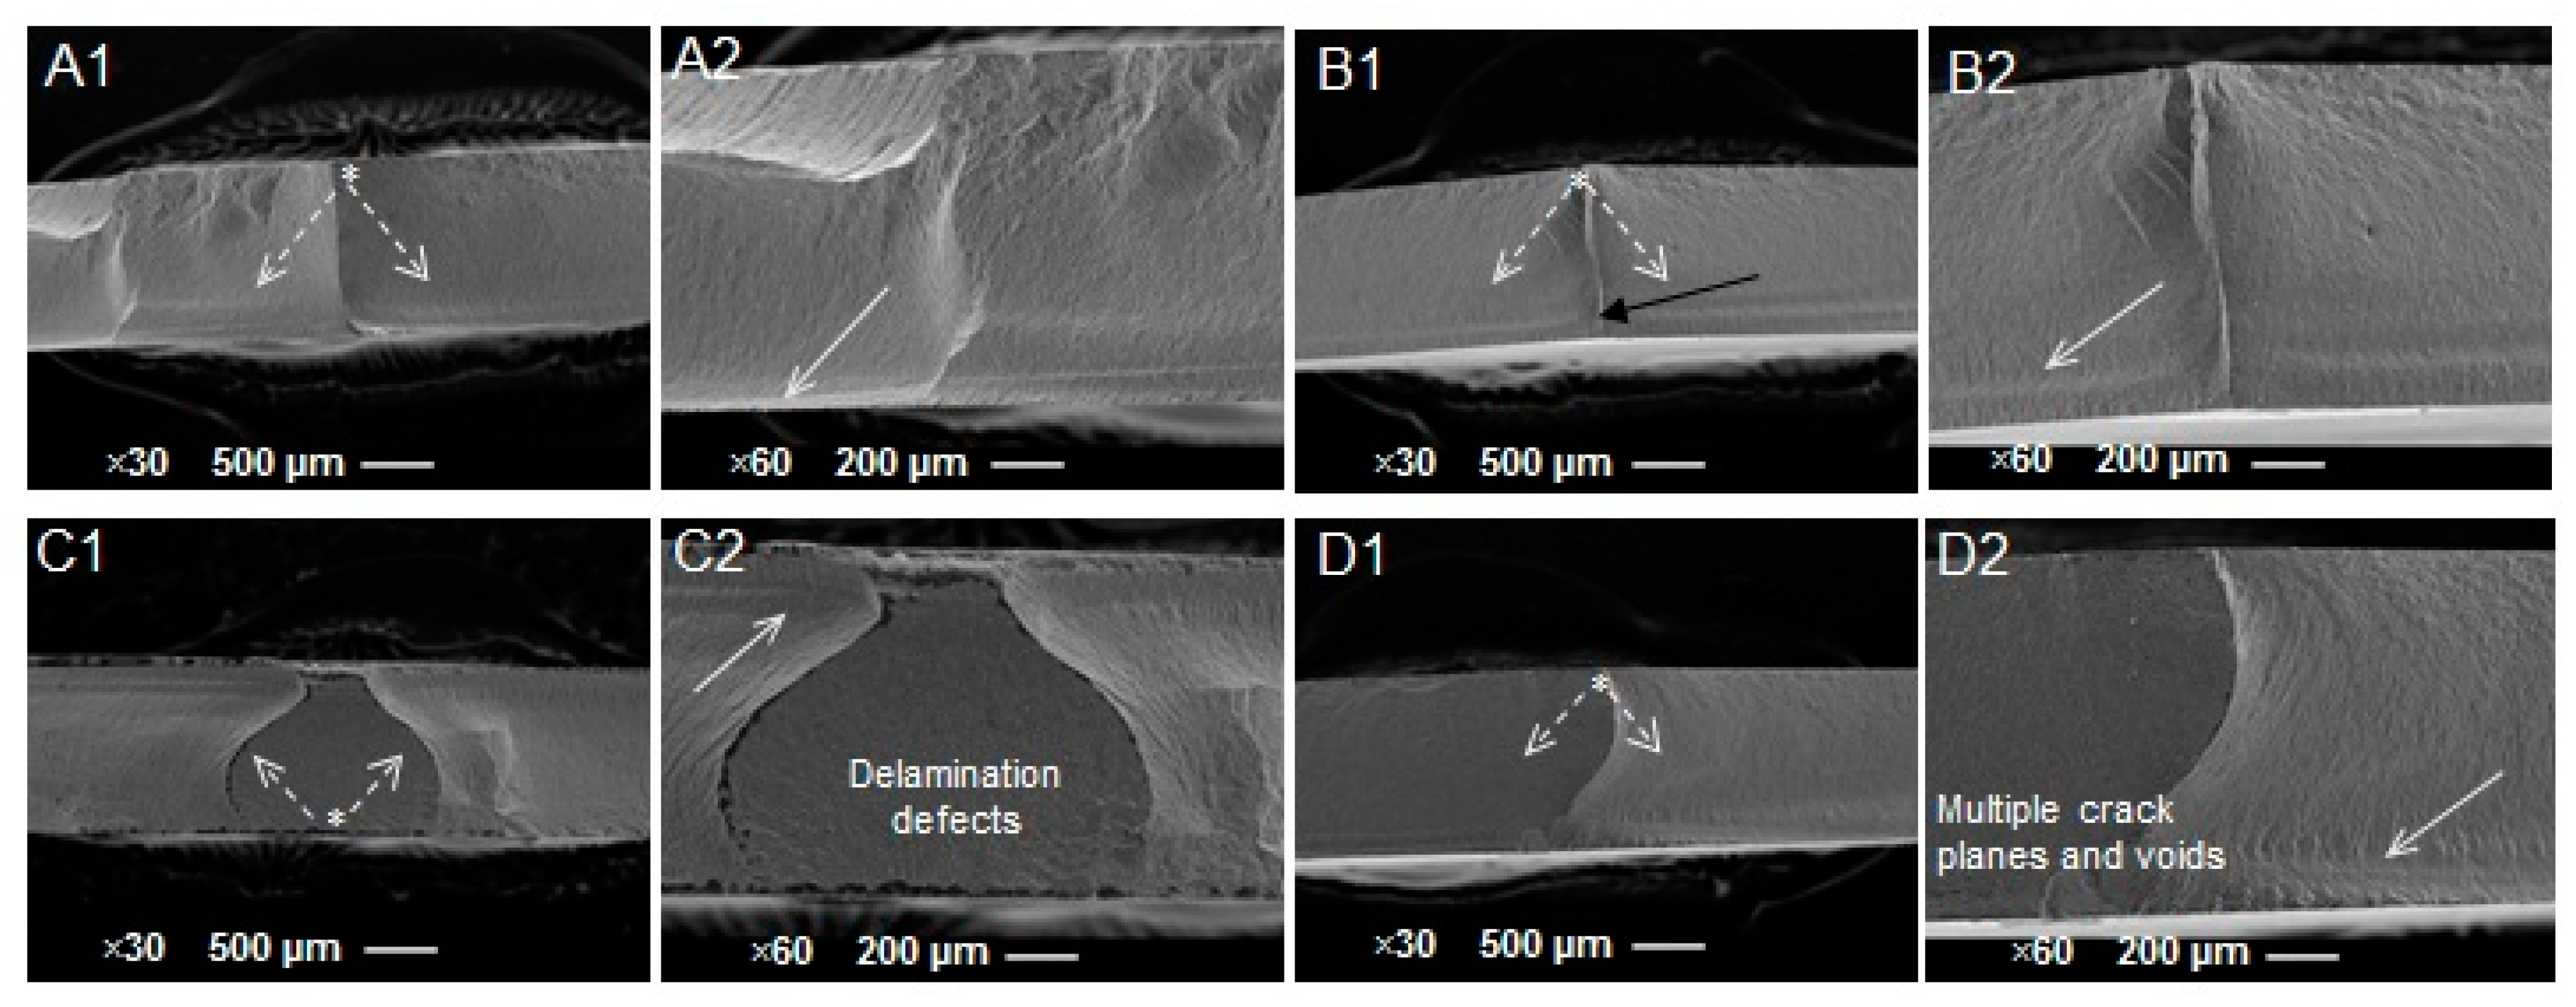
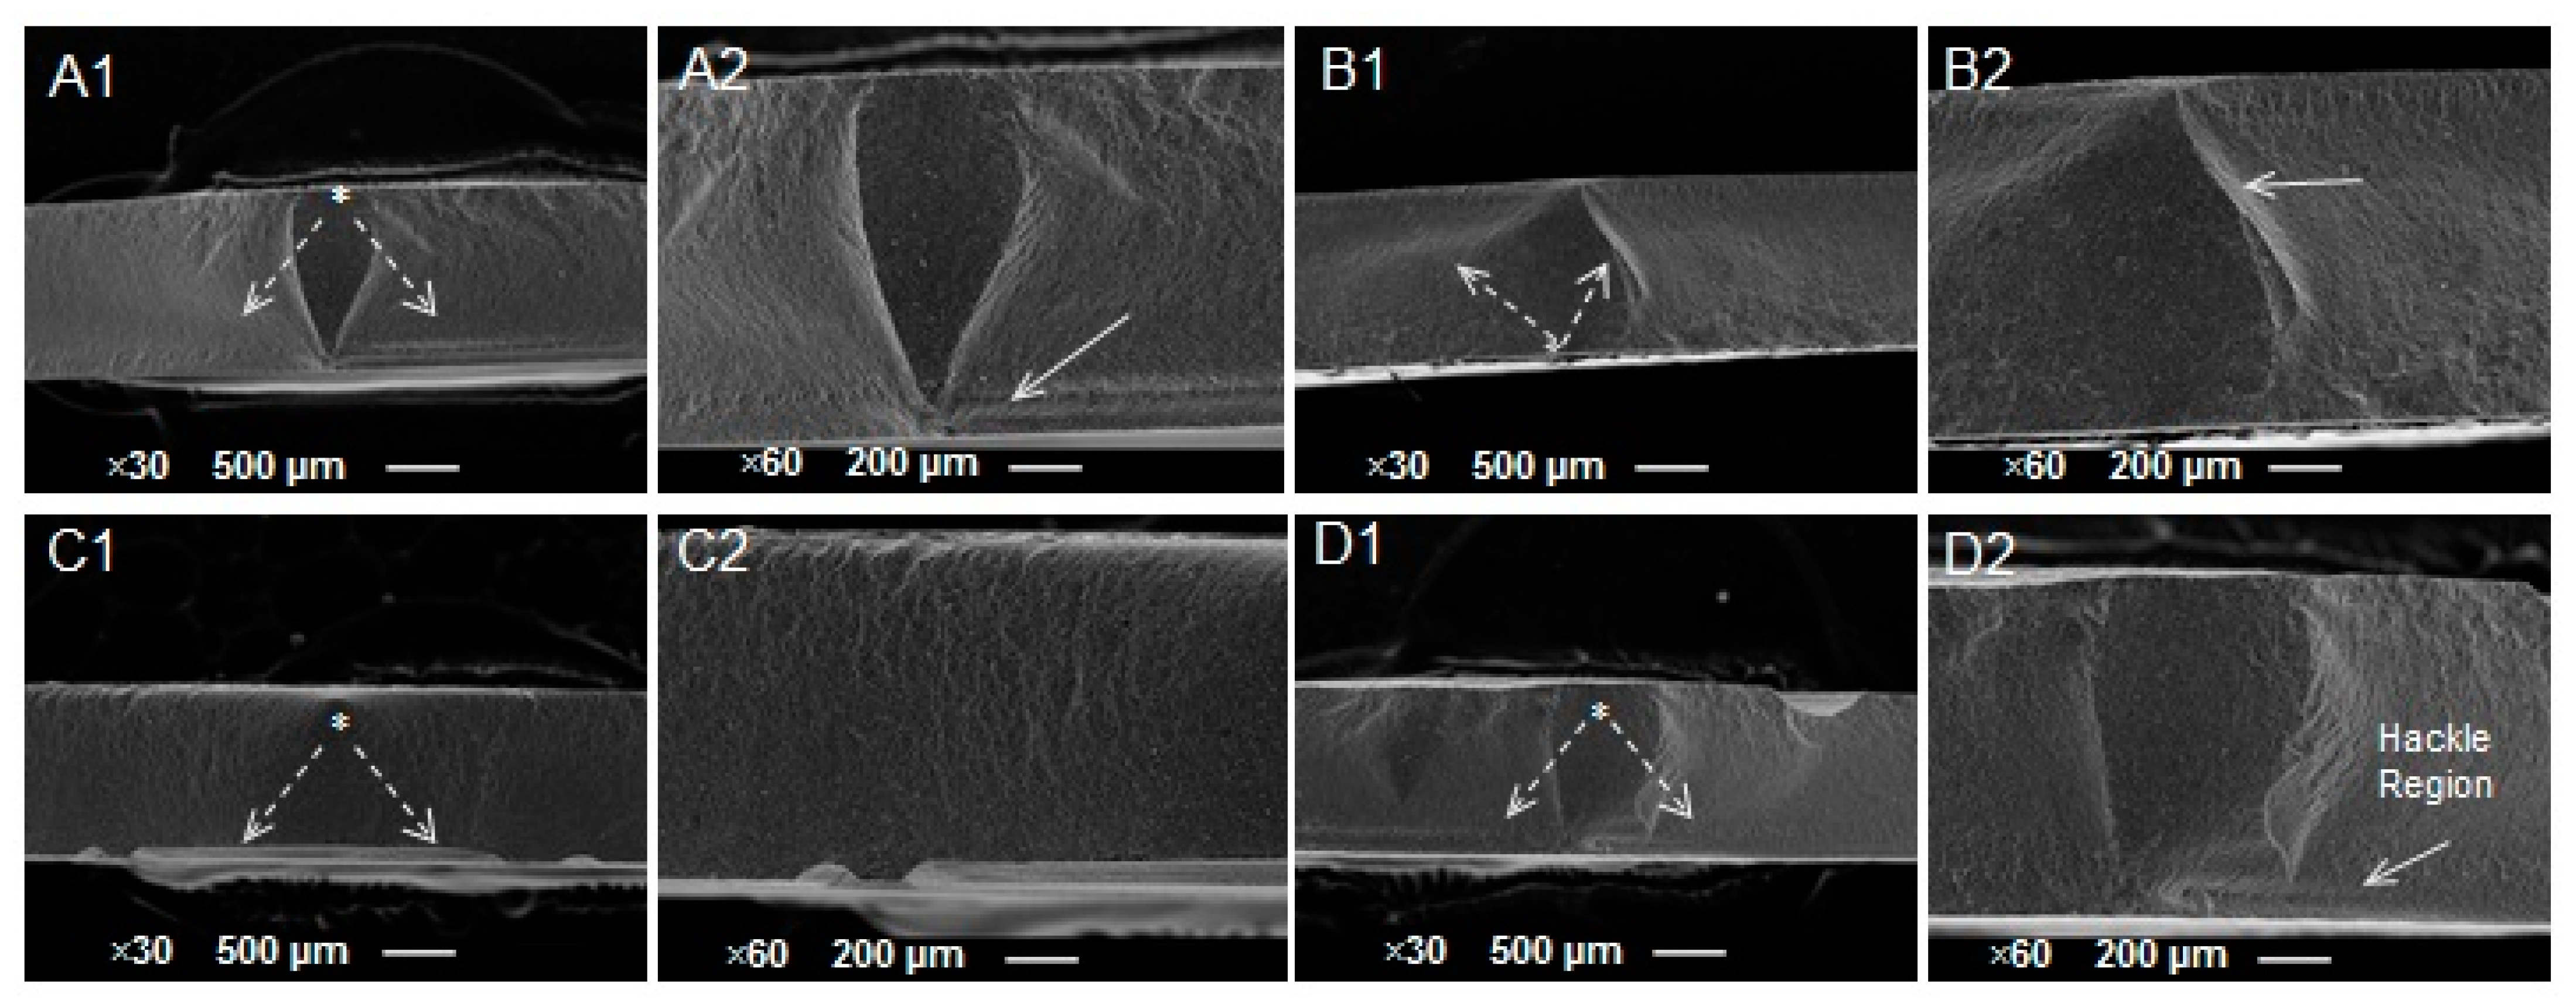
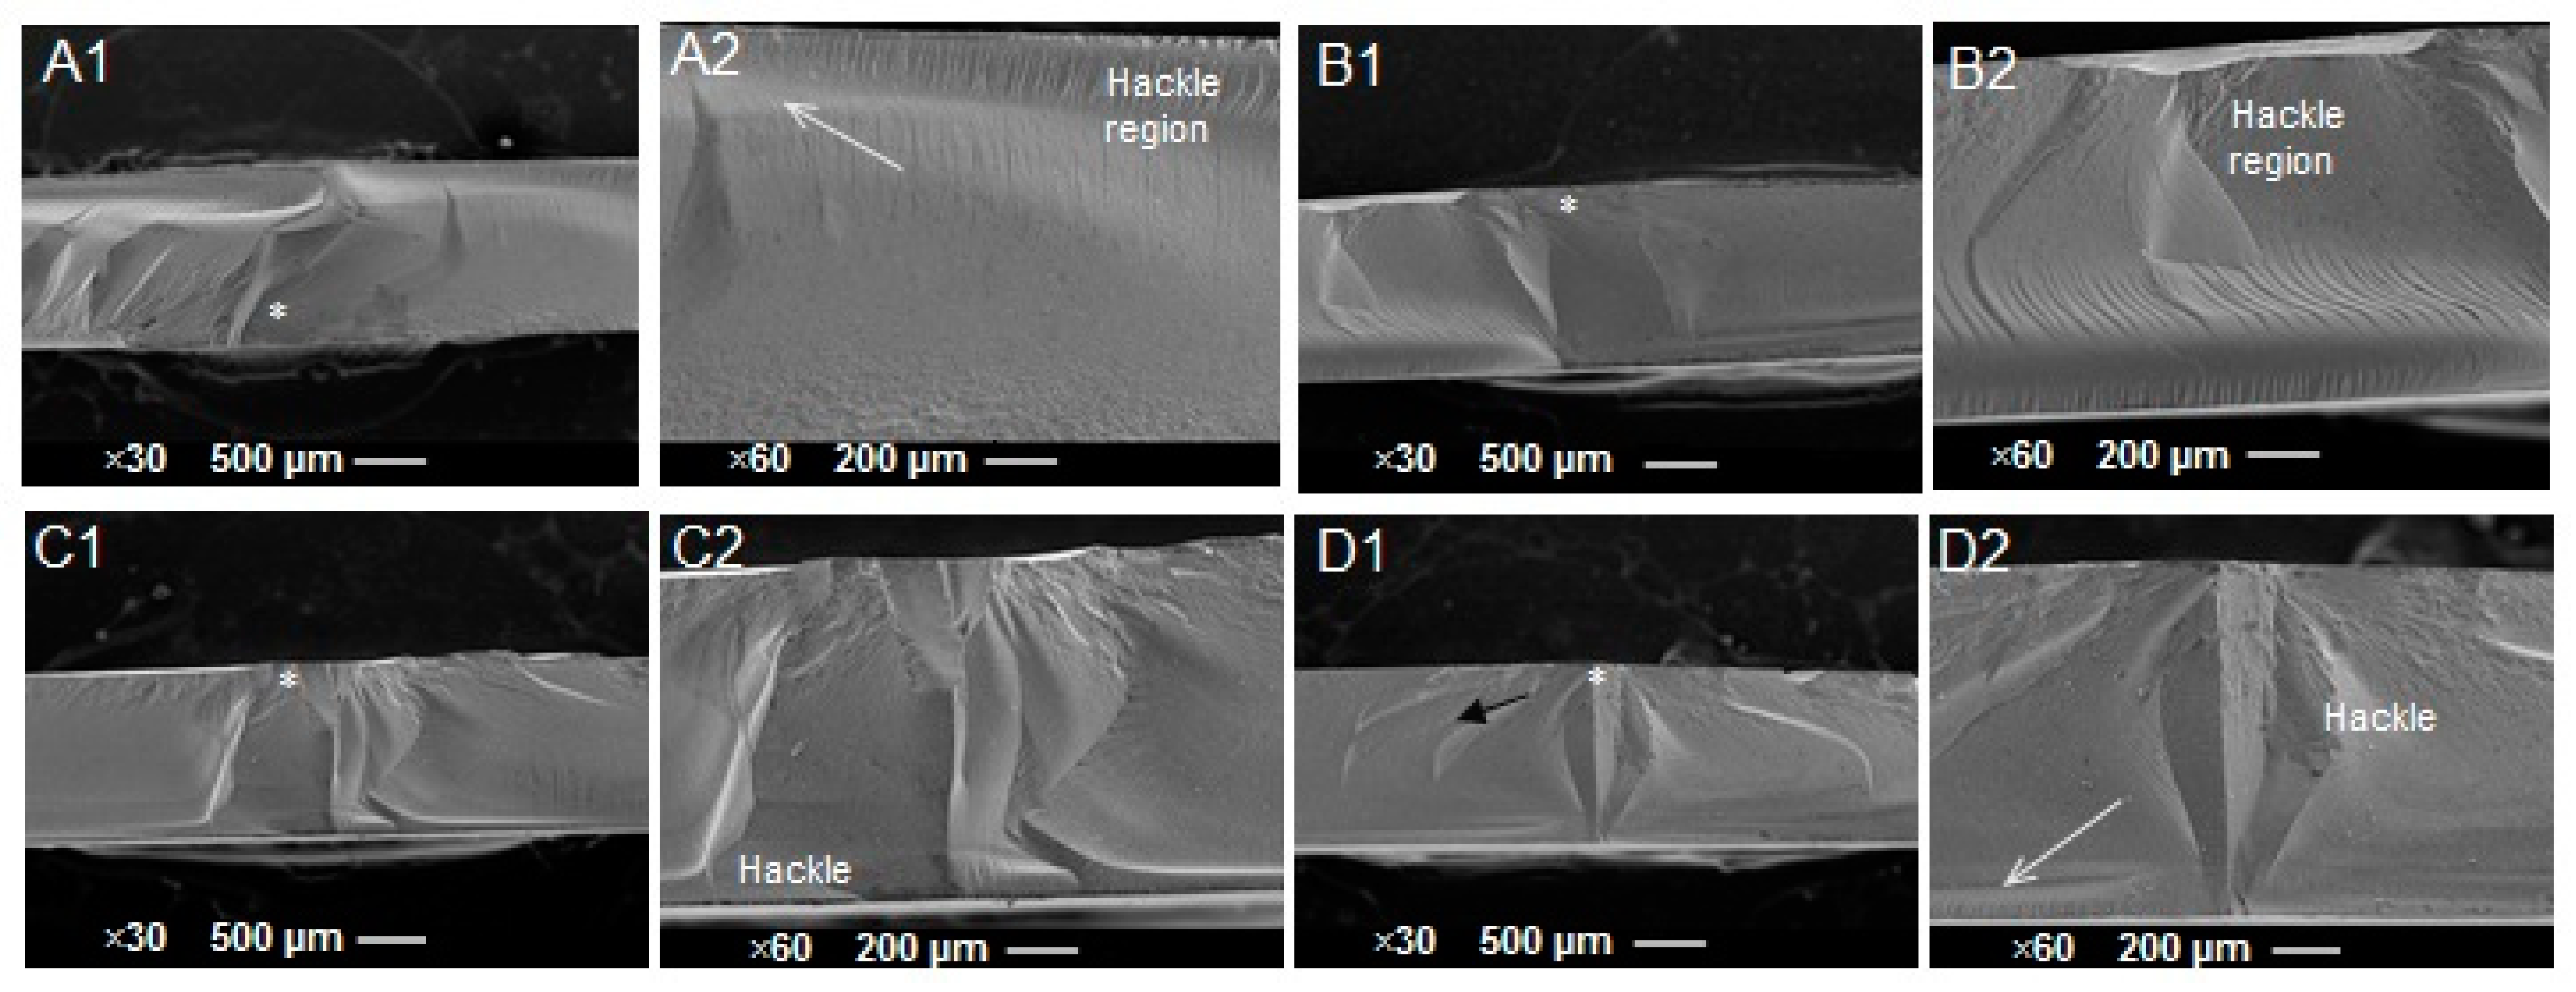
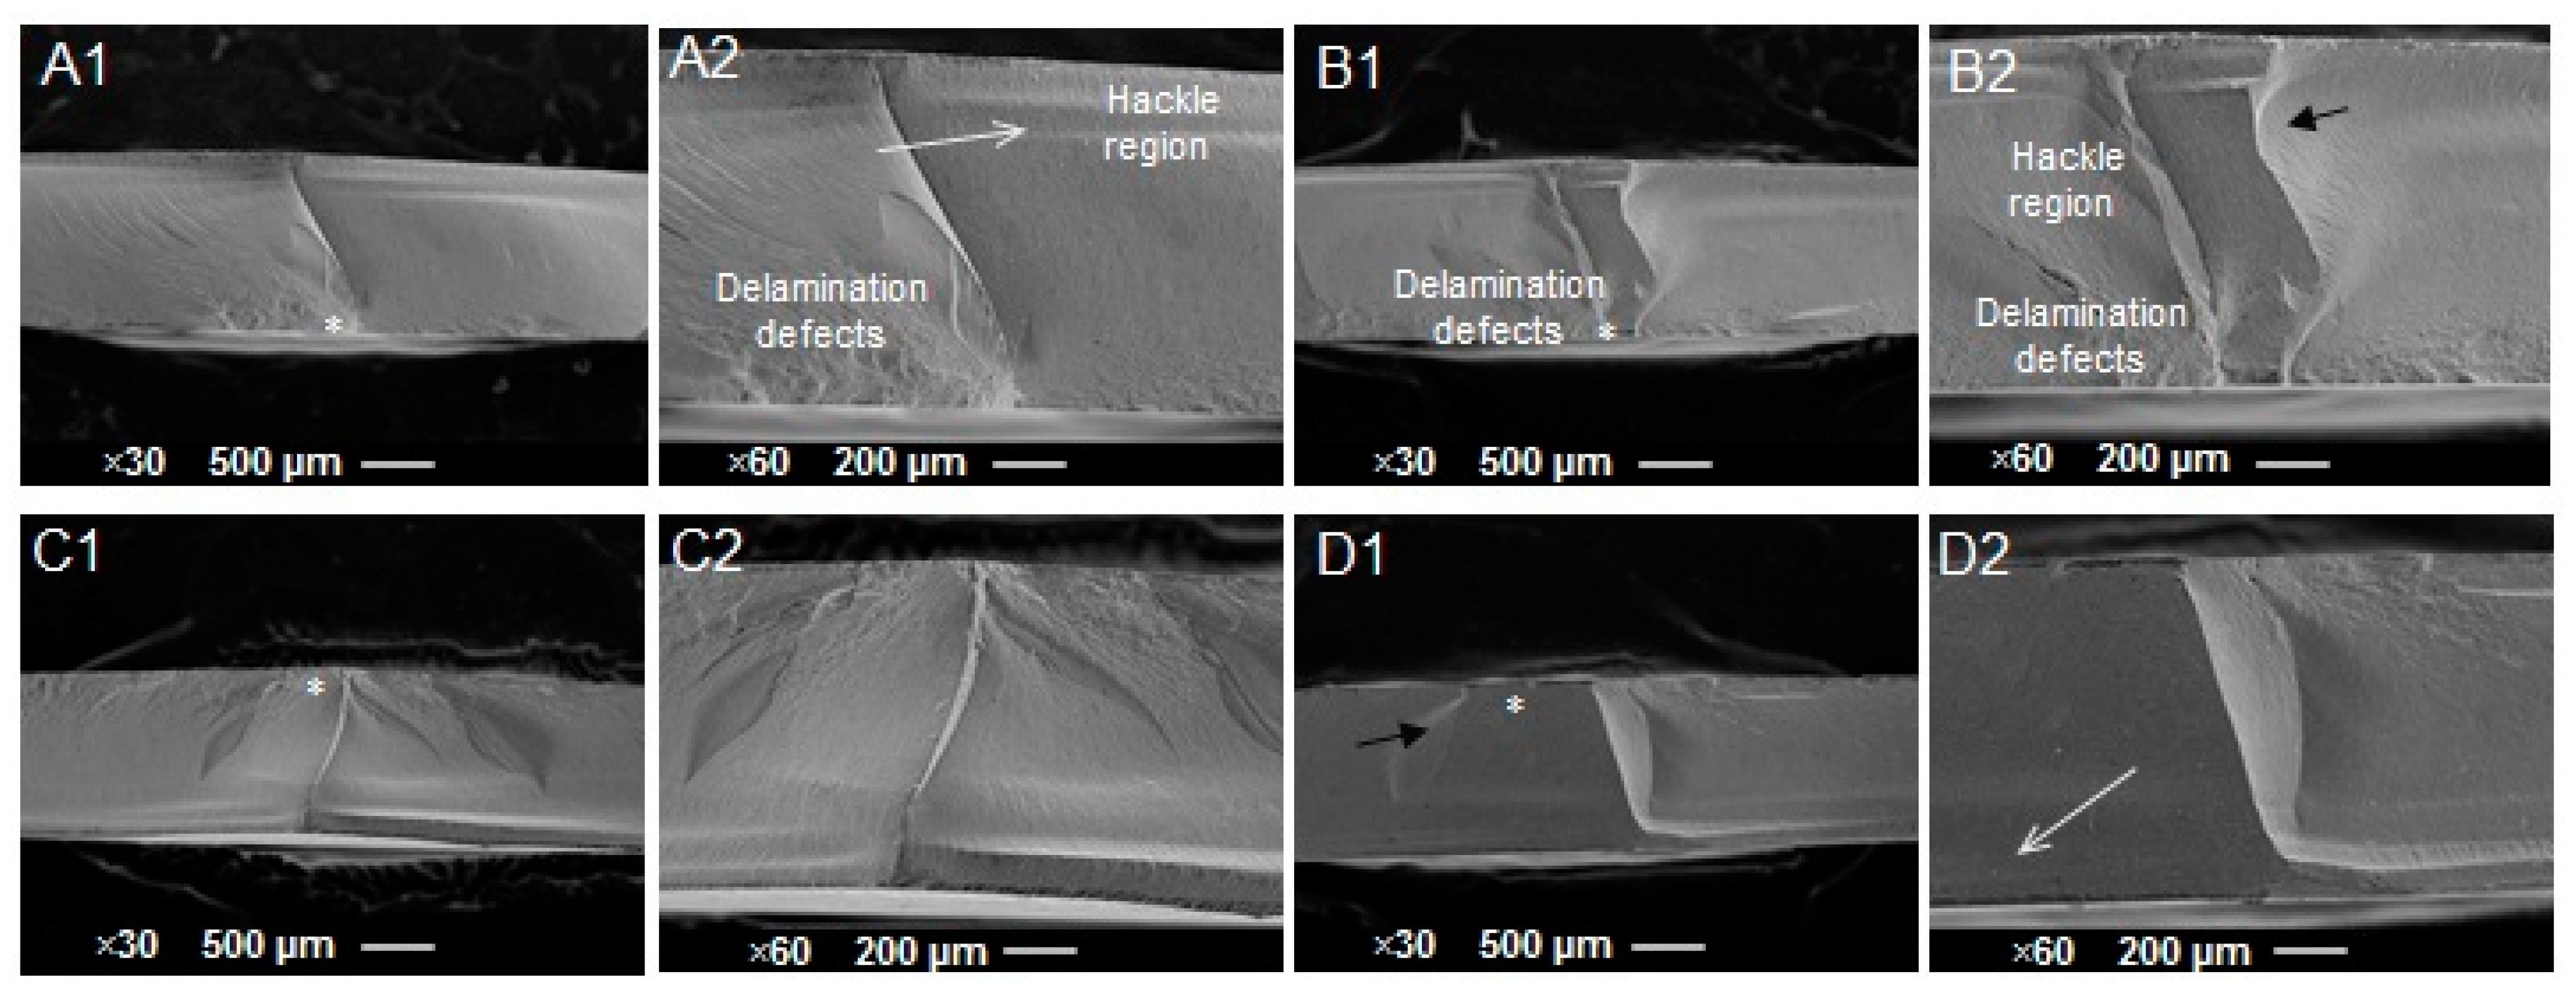
2.4. Fractographic Analysis Using Scanning Electron Microscope (SEM) Images

After the BFS test, characteristic fractured discs from the control and surface-finished groups were examined under an SEM (FE-SEM JSM 6701F, Jeol Ltd., Tokyo, Japan) under vacuum, 20 kV power, and a 10 mm working distance. The specimen was fixed onto a metal stub using dual-sided adhesive tape and gold sputter coated (−10 nm) for one minute (Quorum tech, East Sussex, UK). SEM images were analyzed to determine the origin and direction of crack propagation and mark the characteristic features that include crack arrest lines, compression curls, multiple crack planes, and delamination defects.

2.5. Statistical Analysis

Statistical package for social sciences, v. 25, was used for data analysis (IBM Corp., Armonk, NY, USA). The normality of the data was confirmed by Shapiro–Wilk test (p > 0.05). Multivariate analysis of variance (MANOVA) was applied to establish the overall significance, followed by one-way ANOVA for each dependent variable. Dunnett’s post hoc test was used for multiple comparisons (α = 0.05).

3. Results

3.1. Color Change (ΔE)

Material type, surface finishing, and their interactions had a significant impact on the ΔE (p < 0.05) (Table 3).
The mean ∆E values of the surface-finished materials are presented in Table 4. Among the materials, CS and VE demonstrated the highest (2.40 ± 0.38) and lowest (1.39 ± 0.46) ∆E values. Regarding the surface finishing, OG specimens were more color stable (1.67 ± 0.44), and control specimens were least color stable (2.39 ± 0.49).
Post hoc Dunnett’s test was used to determine the pairs with a significant difference in ∆E. Most surface finishing protocols showed insignificant differences (p > 0.05), except for the control and the surface-finished LU materials (p < 0.01) and between control and OG or MP+PP of CS (p < 0.01) (Table 5).

3.2. Biaxial Flexural Strength (BFS)

Material type, surface finishing, and their interactions had a significant impact on the BFS (p < 0.05) (Table 6).
The mean BFS values of the surface-finished materials are shown in Table 7. Among the materials, CS and CU demonstrated the highest (158.2 ± 3.44 MPa) and lowest (130.6 ± 2.53 MPa) BFS values, respectively. Regarding the effect of surface finishing on BFS values, OG specimens demonstrated high BFS (154.75 ± 3.05 MPa), and control specimens showed low BFS values (130.62 ± 2.93 MPa).
Dunnett’s post hoc test demonstrated that most surface finishing protocols resulted in significant differences in BFS from each other (p < 0.01) (Table 8). Contrarily, a non-significant difference was found between OG and MP+PP of LU, CS, and CU materials (p > 0.05). Furthermore, no significant difference was found between MP and control groups of CU (p > 0.05).

3.3. Fractographic Analysis

The LU samples fractured into four, three, two, and three fragments for the control, MP, OG, and MP+PP groups, respectively. The origin and extent of the crack’s progression were apparent in the SEM image (Figure 4(A1,B1,C1,D1)). Many features were evident, including the crack arrest line (Figure 4(B1,B2)) and compression curls (Figure 4(A2,C2,D2)). Fast fracture featured by multiple crack planes (Figure 4(A1,A2,C1,D2)) and delamination (Figure 4(C1,C2)) was also observed.
For VE, all the samples fractured into two fragments in the C and MP groups and three fragments in the OG and MP+PP groups after the BFS test. SEM images showed the crack initiation and how it propagated (Figure 5(A1,B1,C1,D1)). This material displayed fractographic fracture features, including compression curl (Figure 5(A2,D2)), crack arrest line (Figure 5(B2)), and cracks propagating on different planes that are presented as river lines (Figure 5(C2)). In addition, the hackle region indicating a change in field stress is also observed (Figure 5(D2)).
The CS specimen split into four fragments in the C, MP, and OG groups and three fragments in the MP+PP group. SEM images show the origin of the crack. Hackle regions and multiple crack planes are also evident on all the scanned specimens (Figure 6(A2,B2,C2,D2)). Multiple crack planes (Figure 6(A1,B1,C2,D2)) and compression curls (Figure 6(A2,D2)) are also observed.
The samples of the CU group fragmented into two fragments after the BFS test. This material exhibited similar fractographic features to CS, including crack origin, hackle regions, and multiple crack planes (Figure 7(A2,B2,C2,D2)). Furthermore, delamination defects (Figure 7(A2,B2)) and compression curl (Figure 7(A2,B2,D2)) can be seen.

4. Discussion

Resin-modified ceramics are considered a viable substitute for glass ceramics which perform clinically satisfactorily for prosthodontic management in areas with moderate chewing loads. Despite having similar mechanical qualities to conventional CAD–CAM ceramics, resin-modified ceramics are deemed aesthetically pleasing [36]. This study aimed to determine the influence of various surface finish protocols on the color change and BFS of resin-modified ceramics. According to the current study’s findings, the investigated resin-modified ceramic materials and surface finish protocols significantly affected the color difference (p < 0.05). Therefore, the stated first null hypothesis had to be rejected.
As it is one of the most consumed drinks worldwide and is more chromogenic than other beverages, coffee was used as a staining agent in this study. Furthermore, coffee’s pH, which ranges from 4.9 to 5.2, will expedite the discoloration process. Discoloration brought by coffee has been related to ingredients, including tannin and chlorogenic acid [35]. Color is influenced by surface finishing techniques and roughness, as previously described [21]. A human observer can detect a color change that is perceptible as a color difference. A 50% of spectators can detect a color difference if the perceptibility threshold (PT) is set at 50%. Similarly, a 50% acceptance threshold (AT) refers to a color change that 50% of spectators deem acceptable [37]. Accordingly, the reference values of the PT and AT are ΔE ≤ 1.2 and ΔE = 2.7, respectively. Any ΔE > 2.7 is considered clinically unacceptable [37].
In the current study, none of the surface-finished discs demonstrated ΔE values below the PT; however, the values were within the AT limit (ΔE = 2.7). The color changes in the control specimens of nanoceramics (LU and CS) were above the AT limit. The color change in the specimens after surface finishing with MP was 1.96 ± 0.43, and after using polishing paste MP+PP, it was reduced to 1.85 ± 0.35. The two values were statistically insignificant, and the color change was above the PT but well below the AT. This outcome demonstrates that both surface finishing was comparable in terms of color changes in the materials. In a previous study, Acar et al. [38] studied the influence of various polishing techniques on the Ra and ΔE of CS, LU, and VE. They found that the diamond paste polishing alone produced an acceptable Ra and ΔE, while the two-stage diamond-impregnated polishers resulted in increased color change, and hence they were deemed unsuitable for the tested materials.
The current study findings confirm that glazing (OG) makes the surface more stain resistant. The influence of OG, a light-polymerizing clear resin covering on ceramics, has received little attention in the literature. One study explored the ΔE of 3D-printed interim restorations following surface finishing with aluminum oxide polishers and OG [39]. After six months of immersion in different staining solutions, they discovered that OG caused the least color change [39]. This could be explained by OG’s ability to infiltrate the surface, which reduces the restoration’s surface permeability, fills in nanopores, and reduces leakage into the restoration surface [40]. Kursoglu et al. [21] investigated the relationship between the surface texture obtained by different polishing procedures and the resultant stainability of IPS ceramic discs after 12 days of immersion in a coffee. They found that glazing resulted in the smoothest and the most stable surface.
The polishability is not the sole determinant of color change, but the composition of the different materials, as well as the variations in polymer-to-filler ratio, have a significant impact on polishability and, hence, the color change. The LU and CS exhibited the highest color change, which can be attributed to both resin nanoceramic clusters and the presence of Bis-GMA, hydrophobic UDMA, and hydrophilic TEGDMA in their composition [41]. On the other hand, CU and LU are polymer-infiltrated ceramic networks that are created by first producing the ceramic network and then crosslinking the polymer with the existing ceramic network by capillary action [9]. The heat treatment to form a dense polymer network [9] could possibly explain the least color change in VE and CU materials.
The BFS test is among the common methods for determining fracture strength and predicting the forces a material can withstand [24]. The current study’s findings indicate a substantial variation in the BFS of the investigated materials following different surface finish protocols (p < 0.001). The second null hypothesis that the studied CAD/CAM materials do not significantly differ in BFS after various surface finishing protocols was rejected. The OG protocol resulted in the highest BFS. There is no study that the authors are aware of that evaluates the effect of OG surface finish on the resin-modified ceramic’s flexural strength. However, Thompson et al. [42] in their study assessed the effect of surface sealing on polymer-based provisional materials. They found that surface sealing improves the mechanical properties, including the flexural strength of the tested materials. On the contrary, Çakmak et al. [43] demonstrated that surface sealing does not affect the flexural strength of polymer-based provisional materials. Their contradicting conclusions about using the same glaze (Palaseal glaze) can be attributed to the different brands of the materials tested.
The OG (154.75 ± 3.05 MPa) and MP+PP (153.33 ± 2.78 MPa) demonstrated the highest BFS values, and there was an insignificant difference between the two protocols among the tested resin-modified ceramics, except for VE (p > 0.005). Earlier studies have demonstrated an inverse association between BFS and Ra, which implies that a smoother surface has a higher BFS [44,45,46]. Mohammadibassir et al. [27] explained the effect of polishing paste in reducing Ra and stated its ability to round the profile, making the surface more uniform and smoother. The composition of the polished material has an impact on polishability and, accordingly, the BFS. This fact can partially explain why VE demonstrated a significant difference (p < 0.005). VE has the lowest percentage of polymer (14% of its composition) compared to the other tested materials (20–30% of their composition) [41], and manual polishing using polishing paste may not smoothen the higher percentage of incorporated fillers.
When compared to OG and MP+PP, the MP resulted in a lower BFS and a higher color difference. Based on these findings, it is apparent that the MP protocol is not effective at smoothening the surface compared to other protocols. Because of the heterogenicity in the composition of the resin ceramics, using MP without subsequent polishing paste might be insufficient. This is particularly evident in the CU material, as there is no statistically significant difference between MP and control (p > 0.005).
Fractography, a useful technique for failure analysis in dentistry, is based on the evaluation of microscopic fracture surface characteristics that reveal the cause of failure and analyze the extent of the crack [47]. Descriptive fractography in the current study shows many features, including compression curls, crack arrest lines, hackles, and delamination defects. Compression curls are always present on the opposite side of the fracture origin, and it is a sign that the specimen has a bending characteristic after loading [48]. A crack arrest line is another feature that is defined by a sharp line as a result of a change in the primary tension, indicating crack propagation in a different direction [48]. There is also another feature that can help in locating the origin of the fracture, which is the hackle because it points toward it [47].
The present study had a few shortcomings, which could limit generalizing the outcome of the study. The specimens were stained on both surfaces of the disc, which does not reflect the real clinical scenario in which the restoration is exposed to solutions or beverages only on the exterior. Secondly, the intra-oral conditions such as the patient’s saliva, diet, acidic beverages [49], oral hygiene protocols [50], and dentifrices [51] that could influence the ΔE or the BFS were not considered in this study. Thirdly, various specimen thicknesses may have different effects on the ΔE or the BFS compared to a single uniform thickness used in this study.
Future research should consider patient-related aspects such as smoking, saliva, and abrasive dentifrice brushing effect on ΔE or the BFS. It is vital to investigate the color change in resin-modified ceramics in different beverages, especially acidic beverages. Furthermore, different thicknesses of the tested CAD/CAM materials should be tested with regard to ΔE and BFS.

5. Conclusions

(a)
The OG surface finishing protocol provides the least color changes and the highest BFS.
(b)
MP+PP has comparable performance to the OG protocol, and there was a statistically insignificant difference between the two protocols except for the BFS of LU.
(c)
In comparison with the OG and MP+PP protocols, the MP protocol resulted in the lowest BFS and the highest color changes.
(d)
Among the materials tested, VE demonstrated the least color changes, and CS showed the highest BFS following surface finishing.

Author Contributions

Conceptualization, M.A., N.L. and A.M.; methodology, M.A., S.A., A.A. and N.S.; software, A.M.B., A.A. and S.A.; validation, M.A. and A.M.; formal analysis, M.A. and N.L.; investigation, M.A., N.L. and S.A.; resources, N.S., A.M.B., A.A. and S.A.; data curation, M.A., N.S., N.L. and A.M.; writing—original draft preparation, M.A. and N.L.; writing—review and editing, M.A. and A.A.; supervision, N.L., A.M. and S.A.; project administration, S.A., A.A. and N.S.; funding acquisition, M.A., N.S., S.A. and A.A. All authors have read and agreed to the published version of the manuscript.

Funding

This research received no external funding.

Institutional Review Board Statement

Not applicable.

Informed Consent Statement

Not applicable.

Data Availability Statement

Data sharing is not applicable to this article.

Acknowledgments

The authors would like to thank the College of Dentistry Research Centre, King Saud University, Saudi Arabia, for the approval and support (Registration No. PR 0126).

Conflicts of Interest

The authors declare no conflict of interest.

References

  1. Alhassan, M.; Maawadh, A.; Labban, N.; Alnafaiy, S.M.; Alotaibi, H.N.; BinMahfooz, A.M. Effect of Different Surface Treatments on the Surface Roughness and Gloss of Resin-Modified CAD/CAM Ceramics. Appl. Sci. 2022, 12, 11972. [Google Scholar] [CrossRef]
  2. Miyazaki, T.; Hotta, Y.; Kunii, J.; Kuriyama, S.; Tamaki, Y. A review of dental CAD/CAM: Current status and future perspectives from 20 years of experience. Dent. Mater. J. 2009, 28, 44–56. [Google Scholar] [CrossRef] [PubMed] [Green Version]
  3. Fasbinder, D.J. Digital dentistry: Innovation for restorative treatment. Compend. Contin. Educ. Dent. 2010, 31, 2–11. [Google Scholar] [PubMed]
  4. Fasbinder, D.J. Computerized technology for restorative dentistry. Am. J. Dent. 2013, 26, 115–120. [Google Scholar] [PubMed]
  5. Joda, T.; Brägger, U. Digital vs. conventional implant prosthetic workflows: A cost/time analysis. Clin. Oral Implant. Res. 2015, 26, 1430–1435. [Google Scholar] [CrossRef]
  6. Carrabba, M.; Vichi, A.; Vultaggio, G.; Pallari, S.; Paravina, R.; Ferrari, M. Effect of Finishing and Polishing on the Surface Roughness and Gloss of Feldspathic Ceramic for Chairside CAD/CAM Systems. Oper. Dent. 2017, 42, 175–184. [Google Scholar] [CrossRef]
  7. Gracis, S.; Thompson, V.P.; Ferencz, J.L.; Silva, N.R.; Bonfante, E.A. A new classification system for all-ceramic and ceramic-like restorative materials. Int. J. Prosthodont. 2015, 28, 227–235. [Google Scholar] [CrossRef] [PubMed] [Green Version]
  8. Awada, A.; Nathanson, D. Mechanical properties of resin-ceramic CAD/CAM restorative materials. J. Prosthet. Dent. 2015, 114, 587–593. [Google Scholar] [CrossRef]
  9. Coldea, A.; Swain, M.V.; Thiel, N. Mechanical properties of polymer-infiltrated-ceramic-network materials. Dent. Mater. 2013, 29, 419–426. [Google Scholar] [CrossRef]
  10. Ruse, N.D.; Sadoun, M.J. Resin-composite blocks for dental CAD/CAM applications. J. Dent. Res. 2014, 93, 1232–1234. [Google Scholar] [CrossRef] [Green Version]
  11. Stawarczyk, B.; Liebermann, A.; Eichberger, M.; Güth, J.F. Evaluation of mechanical and optical behavior of current esthetic dental restorative CAD/CAM composites. J. Mech. Behav. Biomed. Mater. 2015, 55, 1–11. [Google Scholar] [CrossRef] [PubMed]
  12. Alghamdi, W.; Labban, N.; Maawadh, A.; Alsayed, H.; Alshehri, H.; Alrahlah, A.; Alnafaiy, S. Influence of Acidic Environment on the Hardness, Surface Roughness and Wear Ability of CAD/CAM Resin-Matrix Ceramics. Materials 2022, 15, 6146. [Google Scholar] [CrossRef]
  13. Arnetzl, G.; Arnetzl, G.V. Hybrid materials offer new perspectives. Int. J. Comput. Dent. 2015, 18, 177–186. [Google Scholar]
  14. Wright, M.D.; Masri, R.; Driscoll, C.F.; Romberg, E.; Thompson, G.A.; Runyan, D.A. Comparison of three systems for the polishing of an ultra-low fusing dental porcelain. J. Prosthet. Dent. 2004, 92, 486–490. [Google Scholar] [CrossRef] [PubMed]
  15. Herion, D.T.; Ferracane, J.L.; Covell, D.A., Jr. Porcelain surface alterations and refinishing after use of two orthodontic bonding methods. Angle Orthod. 2010, 80, 167–174. [Google Scholar] [CrossRef] [Green Version]
  16. Maciel, L.; Silva, C.; de Jesus, R.; Concílio, L.; Kano, S.; Xible, A. Influence of polishing systems on roughness and color change of two dental ceramics. J. Adv. Prosthodont. 2019, 11, 215–222. [Google Scholar] [CrossRef] [PubMed] [Green Version]
  17. Fischer, H.; Schäfer, M.; Marx, R. Effect of surface roughness on flexural strength of veneer ceramics. J. Dent. Res. 2003, 82, 972–975. [Google Scholar] [CrossRef] [PubMed]
  18. Heintze, S.D.; Cavalleri, A.; Forjanic, M.; Zellweger, G.; Rousson, V. Wear of ceramic and antagonist—A systematic evaluation of influencing factors in vitro. Dent. Mater. 2008, 24, 433–449. [Google Scholar] [CrossRef] [PubMed]
  19. Sasahara, R.M.; Ribeiro Fda, C.; Cesar, P.F.; Yoshimura, H.N. Influence of the finishing technique on surface roughness of dental porcelains with different microstructures. Oper. Dent. 2006, 31, 577–583. [Google Scholar] [CrossRef]
  20. Tholt de Vasconcellos, B.; Miranda-Júnior, W.G.; Prioli, R.; Thompson, J.; Oda, M. Surface roughness in ceramics with different finishing techniques using atomic force microscope and profilometer. Oper. Dent. 2006, 31, 442–449. [Google Scholar] [CrossRef] [Green Version]
  21. Kursoglu, P.; Karagoz Motro, P.F.; Kazazoglu, E. Correlation of surface texture with the stainability of ceramics. J. Prosthet. Dent. 2014, 112, 306–313. [Google Scholar] [CrossRef] [PubMed]
  22. Igiel, C.; Lehmann, K.M.; Ghinea, R.; Weyhrauch, M.; Hangx, Y.; Scheller, H.; Paravina, R.D. Reliability of visual and instrumental color matching. J. Esthet. Restor. Dent. 2017, 29, 303–308. [Google Scholar] [CrossRef] [PubMed]
  23. Lehmann, K.; Devigus, A.; Wentaschek, S.; Igiel, C.; Scheller, H.; Paravina, R. Comparison of visual shade matching and electronic color measurement device. Int. J. Esthet. Dent. 2017, 12, 396–404. [Google Scholar] [PubMed]
  24. Shen, C.; Rawls, H.R.; Esquivel-Upshaw, J.F. (Eds.) Phillips’ Science of Dental Materials, 13th ed.; Elsevier/Saunders: St. Louis, MO, USA, 2022. [Google Scholar]
  25. McCabe, J.; Angus, W. Applied Dental Materials, 9th ed.; Blackwell: Oxford, UK, 2008. [Google Scholar]
  26. Mohammadi-Bassir, M.; Babasafari, M.; Rezvani, M.B.; Jamshidian, M. Effect of coarse grinding, overglazing, and 2 polishing systems on the flexural strength, surface roughness, and phase transformation of yttrium-stabilized tetragonal zirconia. J. Prosthet. Dent. 2017, 118, 658–665. [Google Scholar] [CrossRef]
  27. Mohammadibassir, M.; Rezvani, M.B.; Golzari, H.; Moravej Salehi, E.; Fahimi, M.A.; Kharazi Fard, M.J. Effect of Two Polishing Systems on Surface Roughness, Topography, and Flexural Strength of a Monolithic Lithium Disilicate Ceramic. J. Prosthodont. 2019, 28, e172–e180. [Google Scholar] [CrossRef] [Green Version]
  28. Jin, J.; Takahashi, H.; Iwasaki, N. Effect of test method on flexural strength of recent dental ceramics. Dent. Mater. J. 2004, 23, 490–496. [Google Scholar] [CrossRef] [Green Version]
  29. Alfouzan, A.F.; Alnafaiy, S.M.; Alsaleh, L.S.; Bawazir, N.H.; Al-Otaibi, H.N.; Taweel, S.M.A.; Alshehri, H.A.; Labban, N. Effects of background color and thickness on the optical properties of CAD-CAM resin-matrix ceramics. J. Prosthet. Dent. 2022, 128, 497.e1–497.e9. [Google Scholar] [CrossRef]
  30. Alfouzan, A.F.; Al-Otaibi, H.N.; Labban, N.; Taweel, S.M.A.; Al-Tuwaijri, S.; AlGazlan, A.S.; Tashkandi, E.A. Influence of thickness and background on the color changes of CAD/CAM dental ceramic restorative materials. Mater. Res. Express 2020, 7, 055402. [Google Scholar] [CrossRef]
  31. Kilinc, H.; Turgut, S. Optical behaviors of esthetic CAD-CAM restorations after different surface finishing and polishing procedures and UV aging: An in vitro study. J. Prosthet. Dent. 2018, 120, 107–113. [Google Scholar] [CrossRef]
  32. Sen, N.; Us, Y.O. Mechanical and optical properties of monolithic CAD-CAM restorative materials. J. Prosthet. Dent. 2018, 119, 593–599. [Google Scholar] [CrossRef]
  33. Incesu, E.; Yanikoglu, N. Evaluation of the effect of different polishing systems on the surface roughness of dental ceramics. J. Prosthet. Dent. 2020, 124, 100–109. [Google Scholar] [CrossRef]
  34. Steiner, R.; Beier, U.S.; Heiss-Kisielewsky, I.; Engelmeier, R.; Dumfahrt, H.; Dhima, M. Adjusting dental ceramics: An in vitro evaluation of the ability of various ceramic polishing kits to mimic glazed dental ceramic surface. J. Prosthet. Dent. 2015, 113, 616–622. [Google Scholar] [CrossRef] [PubMed]
  35. Alaqeel, S. Effect of Grit-blasting on the Color Stability of Zirconia Ceramics Following Exposure to Beverages. Cureus 2020, 12, e7170. [Google Scholar] [CrossRef] [PubMed] [Green Version]
  36. Rajesh, S.; Kamalakanth, S.; Savitha, D.; Karkala, S.S.; Mallikarjuna, R.; John, F. Resin-matrix ceramics—An overview. Int. J. Recent Sci. Res. 2015, 6, 7414–7417. [Google Scholar]
  37. Paravina, R.D.; Ghinea, R.; Herrera, L.J.; Bona, A.D.; Igiel, C.; Linninger, M.; Sakai, M.; Takahashi, H.; Tashkandi, E.; Perez Mdel, M. Color difference thresholds in dentistry. J. Esthet. Restor. Dent. 2015, 27 (Suppl. S1), S1–S9. [Google Scholar] [CrossRef]
  38. Acar, B.; Egilmez, F. Effects of various polishing techniques and thermal cycling on the surface roughness and color change of polymer-based CAD/CAM materials. Am. J. Dent. 2018, 31, 91–96. [Google Scholar]
  39. Almejrad, L.; Yang, C.C.; Morton, D.; Lin, W.S. The Effects of Beverages and Surface Treatments on the Color Stability of 3D-Printed Interim Restorations. J. Prosthodont. 2022, 31, 165–170. [Google Scholar] [CrossRef]
  40. Hepdeniz, O.K.; Temel, U.B.; Ugurlu, M.; Koskan, O. The effect of surface sealants with different filler content on microleakage of Class V resin composite restorations. Eur. J. Dent. 2016, 10, 163–169. [Google Scholar] [CrossRef] [PubMed]
  41. Al Amri, M.D.; Labban, N.; Alhijji, S.; Alamri, H.; Iskandar, M.; Platt, J.A. In Vitro Evaluation of Translucency and Color Stability of CAD/CAM Polymer-Infiltrated Ceramic Materials after Accelerated Aging. J. Prosthodont. 2021, 30, 318–328. [Google Scholar] [CrossRef]
  42. Thompson, G.A.; Luo, Q. Contribution of postpolymerization conditioning and storage environments to the mechanical properties of three interim restorative materials. J. Prosthet. Dent. 2014, 112, 638–648. [Google Scholar] [CrossRef]
  43. Çakmak, G.; Yilmaz, H.; Aydoğ, Ö.; Yilmaz, B. Flexural strength of CAD-CAM and conventional interim resin materials with a surface sealant. J. Prosthet. Dent. 2020, 124, 800.e1–800.e7. [Google Scholar] [CrossRef] [PubMed]
  44. Flury, S.; Peutzfeldt, A.; Lussi, A. Influence of surface roughness on mechanical properties of two computer-aided design/computer-aided manufacturing (CAD/CAM) ceramic materials. Oper. Dent. 2012, 37, 617–624. [Google Scholar] [CrossRef] [PubMed]
  45. Lohbauer, U.; Müller, F.A.; Petschelt, A. Influence of surface roughness on mechanical strength of resin composite versus glass ceramic materials. Dent. Mater. 2008, 24, 250–256. [Google Scholar] [CrossRef] [PubMed]
  46. Nakamura, Y.; Hojo, S.; Sato, H. The effect of surface roughness on the Weibull distribution of porcelain strength. Dent. Mater. J. 2010, 29, 30–34. [Google Scholar] [CrossRef] [Green Version]
  47. Scherrer, S.S.; Lohbauer, U.; Della Bona, A.; Vichi, A.; Tholey, M.J.; Kelly, J.R.; van Noort, R.; Cesar, P.F. ADM guidance-Ceramics: Guidance to the use of fractography in failure analysis of brittle materials. Dent. Mater. 2017, 33, 599–620. [Google Scholar] [CrossRef]
  48. Quinn, G.D.; Giuseppetti, A.A.; Hoffman, K.H. Chipping fracture resistance of dental CAD/CAM restorative materials: Part I—Procedures and results. Dent. Mater. 2014, 30, e99–e111. [Google Scholar] [CrossRef] [Green Version]
  49. Poggio, C.; Dagna, A.; Chiesa, M.; Colombo, M.; Scribante, A. Surface roughness of flowable resin composites eroded by acidic and alcoholic drinks. J. Conserv. Dent. 2012, 15, 137–140. [Google Scholar] [CrossRef] [Green Version]
  50. Al Taweel, S.M.; Fouzan, A.A.; Al-Otaibi, H.N.; Labban, N.; AlShehri, H.A. Thermal-cycling, simulated brushing, and beverages induced color changes and roughness of CAD/CAM poly (methyl methacrylate) denture resins. Mater. Res. Express 2021, 8, 125401. [Google Scholar] [CrossRef]
  51. Pouryahya, R.; Ranjbar Omrani, L.; Ahmadi, E.; Rafeie, N.; Abbasi, M. Effect of charcoal-based dentifrices on surface roughness of an aged resin composite. Minerva Dent. Oral Sci. 2023, 72, 24–30. [Google Scholar] [CrossRef]
Figure 1. Flowchart showing group allocation and study procedure.
Applsci 13 03415 g001
Figure 2. Customized holder for polishing the specimen.
Applsci 13 03415 g002
Figure 3. Schematic presentation of three-ball piston setup for BFS test.
Applsci 13 03415 g003
Figure 4. SEM images of fractured surface of representative LU specimen following BFS test: (A1) control specimen shows the origin (asterisk) and extent of the crack (dotted white line); (A2) higher magnification shows compression curl (solid white arrow) as well as multiple crack planes and voids; (B1) MP specimen shows the origin and extent of the crack and crack arrest line (solid black line). (B2) Higher magnification shows compression curl as well as void at the origin of the crack left behind by the loading ball. (C1) OG specimen shows the origin and extent of the crack; (C2) higher magnification showing compression curl. The quick fracture of the specimens leads to the formation of rough surfaces featured in the multiple crack planes and delamination defects; (D1) MP+PP specimen shows the origin and extent of the crack. (D2) Multiple crack planes are shown that are also a feature of fast fracture, and compression curl is also observed (solid white line).
Applsci 13 03415 g004
Figure 5. SEM images of fractured surface of representative VE specimen following BFS test: (A1) control specimen shows the origin (asterisk) and extent of the crack (dotted white line). Multiple crack planes and voids are also shown; (A2) higher magnification shows compression curl (solid white line). (B1) MP specimen shows the origin and extent of the crack; (B2) higher magnification showing crack arrest line (solid white line); (C1) OG specimen shows the origin and extent of the crack; (C2) river lines are shown which indicates cracks propagating on different planes; (D1) MP+PP specimen shows the origin and extent of the crack; (D2) compression curl and hackle region are shown.
Applsci 13 03415 g005
Figure 6. SEM images of fractured surface of representative CS specimen following BFS test: (A1) control specimen shows the fracture origin (asterisk). Multiple crack planes and voids are also shown; (A2) higher magnification shows compression curl (solid white line) and hackle region; (B1,B2) MP specimen displaying fracture features similar to the control group; (C1) OG specimen shows the crack origin; (C2) higher magnification shows multiple fracture planes, larger voids, and more distinctive hackle regions propagating from the voids; (D1) MP+PP specimen shows the crack origin and crack arrest lines (solid black line); (D2) multiple crack planes, compression curl, and hackle region are shown.
Applsci 13 03415 g006
Figure 7. SEM images of fractured surface of representative CU specimen following BFS test: (A1) control specimen showing the origin (asterisk) of the fracture. Multiple crack planes and voids are also shown; (A2) higher magnification showing compression curl, delamination defects, and hackle region (solid white arrow); (B1,B2) MP specimen showing similar fracture features displayed in the control group in addition to distinctive multiple fracture planes and arrest lines (solid black arrow); (C1) OG specimen shows the crack origin; (C2) higher magnification shows multiple fracture plane, voids, and hackle regions; (D1) MP+PP specimen showing origin of the crack as well crack arrest lines (solid black arrow); (D2) multiple crack planes, compression curl, and hackle region are shown.
Applsci 13 03415 g007
Table 1. CAD/CAM ceramics tested.
MaterialShadeCompositionManufacturer
Lava Ultimate
Restorative
A2-HTBis-GMA, Bis-EMA, UDMA, and TEGDMA with zirconia and silica nanoparticles and silica/zirconia nanoclusters 3M ESPE, St. Paul, MN, USA
Vita Enamic2M2-HTFeldspathic ceramic containing aluminum oxide infiltrated by Bis-GMA and UDMA cross-linked polymers Vita Zahnfabrik, H. Rauter GmbH & Co., Bad Säckingen, Germany
Cerasmart A2-HTUDMA, DMA, and Bis-MEPP with
barium and silica glass nanoparticle fillers
GC America, Alsip, IL, USA
Crystal Ultra A2-C Ceramic-like inorganic silicate glass fillers infiltrated by Bis-GMA, UDMA, and BUDMA cross-linked polymers Digital Dental, Scottsdale, AZ, USA
Bis-GMA—Bisphenol-A-glycidyldimethacrylate; Bis-EMA—Ethoxylated bisphenol A dimethacrylate; UDMA—Urethane Dimethacrylate; TEGDMA—Triethyleneglycoldimethacrylate; DMA—Dimethacrylate; Bis-MEPP—Bisphenol A bis (2-hydroxyethyl ether) dimethacrylate; BUDMA—1,4-butanediol dimethacrylate.
Table 2. Surface finishing kits used in this study.
Surface Finishing KitsAbbreviationManufacturer
LUSTER Meisinger PolisherMPMeisinger, Hager & Meisinger GmbH, Neuss, Germany
OPTIGLAZE™OGGC America Inc., Alsip, IL, USA
LUSTER Meisinger Polisher + DirectDia PasteMP+PPSHOFU Dental GmbH, Ratingen, Germany
Table 3. MANOVA of ∆E.
Variation RecoursesSum of SquaresdfMean SquareFSig
Materials27.6639.2245.920.000 *
surface finishing13.6834.5622.710.000 *
Materials × surface finishing3.6190.402.000.042 *
* Statistically significant (p < 0.05).
Table 4. Mean ∆E of the materials after surface finishing protocols.
GroupLUVECSCUOverall
Control2.98 ± 0.361.75 ± 0.732.79 ± 0.232.06 ± 0.612.39 ± 0.49
MP2.05 ± 0.361.37 ± 0.462.49 ± 0.341.92 ± 0.481.96 ± 0.43
OG1.75 ± 0.381.21 ± 0.332.03 ± 0.511.69 ± 0.531.67 ± 0.44
MP+PP2.00 ± 0.341.22 ± 0.322.29 ± 0.421.88 ± 0.311.85 ± 0.35
Overall2.19 ± 0.381.39 ± 0.462.40 ± 0.381.89 ± 0.481.97 ± 0.43
Table 5. Post hoc multiple comparisons for ∆E of the materials after surface finishing.
MaterialsSurface FinishingDunnett’s Multiple Comparison
ControlMPOGMP+PP
LUControl1
MP0.000 *1
OG0.000 *0.4271
MP+PP0.000 *1.0000.4401
VEControl1
MP0.5971
OG0.1870.9091
MP+PP0.1970.9261.0001
CSControl1
MP0.1151
OG0.002 *0.1061
MP+PP0.012 *0.7490.6991
CUControl1
MP0.9871
OG0.5540.8561
MP+PP0.9231.0000.8831
* Statistically significant (p < 0.05).
Table 6. MANOVA of biaxial flexural strength (BFS).
Variation RecoursesSum of SquaresdfMean SquareFSig
Materials21,212.2337070.74825.850.000 *
surface finishing22,925.8137641.93892.570.000 *
Materials × surface finishing1480.949164.5519.210.000 *
* Statistically significant (p < 0.05).
Table 7. Mean BFS (in MPa) of the material group after different surface finishing protocols.
GroupLUVECSCUOverall
Control136.17 ± 2.37123.42 ± 3.07141.02 ± 4.19121.88 ± 2.08130.62 ± 2.93
MP139.70 ± 1.89127.48 ± 2.51145.39 ± 2.93123.73 ± 2.93134.08 ± 2.56
OG156.75 ± 2.76149.93 ± 2.59174.17 ± 3.83138.16 ± 3.03154.75 ± 3.05
MP+PP156.37 ± 4.29146.12 ± 1.94172.21 ± 2.80138.63 ± 2.09153.33 ± 2.78
Overall147.25 ± 2.83136.74 ± 2.53158.20 ± 3.44130.60 ± 2.53143.19 ± 2.83
Table 8. Post hoc multiple comparisons for BFS of the materials after surface finishing.
MaterialsSurface Finishing Dunnett’s Multiple Comparison
ControlMPOGMP+PP
LUControl1
MP0.004 *1
OG0.000 *0.000 *1
MP+PP0.000 *0.000 *1.0001
VEControl1
MP0.011 *1
OG0.000 *0.000 *1
MP+PP0.000 *0.000 *0.0031
CSControl1
MP0.044 *1
OG0.000 *0.000 *1
MP+PP0.000 *0.000 *0.6381
CUControl1
MP0.4061
OG0.000 *0.000 *1
MP+PP0.000 *0.000 *0.9981
* Statistically significant (p < 0.05).
Disclaimer/Publisher’s Note: The statements, opinions and data contained in all publications are solely those of the individual author(s) and contributor(s) and not of MDPI and/or the editor(s). MDPI and/or the editor(s) disclaim responsibility for any injury to people or property resulting from any ideas, methods, instructions or products referred to in the content.

