Abstract
This work presents a novel intelligent control system based on a Genetic Neuro-Fuzzy tool to optimize and improve the performance of a seawater reverse osmosis desalination plant (SWRO) on board a marine vessel. This investigation pays special attention to minimizing energy consumption to improve the energy efficiency of this marine installation. The system analyzes measurements of different variables—seawater pH, seawater conductivity, permeate flow rate, permeate conductivity, and total energy consumed—in order to provide the most appropriate value of permeate flow rate control and operating pressure of the high-pressure pump (HPP). This intelligent method allows the plant to achieve output values nearer to the desired setpoints set by the plant operators.
1. Introduction
The freshwater supply is one of the most important requirements in marine vessels, since it is a vital necessity for the operation of the ship itself, but also for use by the crew [1]. Freshwater can be obtained from water supplies in ports and from the desalination of seawater. This last option makes it necessary to identify certain key parameters to operate a desalination plant efficiently. In this sense, the quality and amount of water are imperative requirements, but the energy consumed is also important and essential.
In this study, the Guidelines for Drinking-water Quality (GDWQ) [2] of the World Health Organization (WHO) have been consulted to determine the water quality requirements for marine vessels. Specifically, in this work we have chosen to control only the water conductivity from the desalination process, since it is the parameter interrelated with total dissolved solids (TDS). The WHO proposes as a reference value for the palatability of water a TDS level of less than approximately 600 mg/L (938 µS/cm). It is important to note that there are no international or official standard values, but rather reference values [3].
The parameters used in this work allow this desalination plant to be used on land and on board, since it meets the criteria for on-board use. At this point, some considerations must be taken into account, since ships are isolated structures, so energy input and storage capacity are key. According to various researchers, the total water used in cruises varies widely, being highly dependent on the number of passengers, the size of the ship, and so on. For example, Garcia et al. [4] point out that a cruise ship in a Spanish base port refills an average volume of 628 m3 per mooring, while Krile [1] indicates that the average drinking water consumed on cruise ships exceeds 984 m3 per day. Therefore, having a control system to improve the efficiency of desalination plants would save energy and water. In this work, a small desalination plant inside a 20-foot shipping container is used, meaning it could easily be installed in a ship.
The water–energy relationship has been studied in recent decades [5,6], but in the case of ships there are important restrictions in terms of energy consumption, which is why scientists are introducing renewable energy into maritime transport. This remains a work in progress for this sector [7] since these energy resources have been widely applied in other fields [8].
Industry 4.0 and Artificial Intelligence (AI) have been used together for a long time. In particular, Machine Learning (ML), Genetic Neuro-Fuzzy (GNF) and Deep Learning (DL) techniques have improved different processes in seawater treatment plants, yielding higher quality control, increasing their productivity, reducing human error, improving the overall efficiency of the system, and optimizing operating and production costs [9,10,11,12,13,14,15,16]. In fact, the increased interest in this topic has been pointed out by M. Shammi [5], who indicates that the number of publications related to desalination involving artificial intelligence has increased remarkably in recent years.
In some studies, several control methods and different operational strategies for the variable operation for desalination plants have been proposed [17]. Other researchers have also applied control strategies to connect different renewable energy sources such as wind or PV energy to desalination plants [18,19]. The benefits of AI are not only in desalination, but in other water treatment technologies which have been widely studied [20].
In our work, we have opted for a control strategy based on the change in the operating pressure of the high-pressure pump. Furthermore, in this study, there are different requirements for the daily water obtained, the permeate conductivity and the total energy consumption. Therefore, the main objective is to control the desalination process under stationary management in accordance with these requirements. The method used relies on data-based learning, which means that the results will be related to the specific characteristics of the investigation.
In summary, the central purpose of this research is to develop an intelligent approach for the optimal operation of an SWRO desalination plant. A Genetic Neuro-Fuzzy training technique has been applied to improving the control possibilities of the SWRO plant. This study considers the changes involved in a marine vessel moving around the world where sea conditions are continually changing. The objective is to improve the efficiency of onboard SWRO desalination plants, considering the minimization of energy requirements and storage capacity as essential parameters for this sector.
2. Materials and Methodology
2.1. Desalination Plant and Data Collection
The data obtained to carry out this study were extracted from an experimental reverse osmosis desalination plant with a capacity of 80–100 m3/day (Figure 1) located in the facilities of the Instituto Tecnológico de Canarias (ITC), in Gran Canaria. Figure 1 shows a simplified diagram of the main elements that comprise the desalination plant. At the start of the process is the pretreatment system consisting of sand and cartridge filters (F.A. and F.C.). After that is the high-pressure pump (B.A.P. in Spanish), and finally the reverse osmosis membrane. This plant is part of the DESAL + LIVING LAB platform and is used for research purposes.
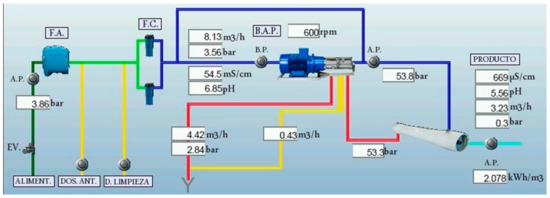
Figure 1.
Desalination plant diagram.
As seen in Figure 2, the plant is located in a 20 ft container, which makes the plant very easy to transport and apply to different environments, such as a marine vessel in this case. Since this desalination plant is used for research purposes, it has been designed with several possible configurations, allowing the researchers to obtain different recovery and energy consumption ratios. Apart from this, another fundamental element is its plug-and-play technology, which allows different experiments to be carried out quickly and efficiently. The main characteristics of the plant are described in Table 1.
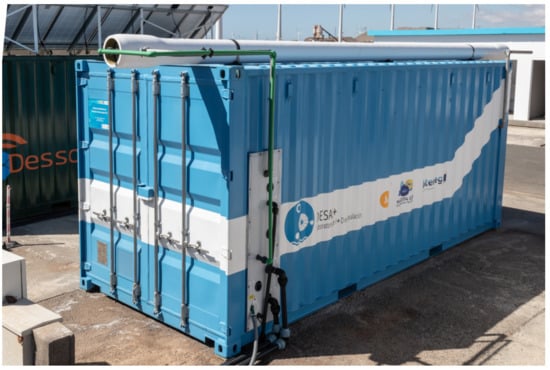
Figure 2.
Container housing the plant.

Table 1.
Main parameters of the SWRO plant used in the study.
The data used were recorded over a 24-h period, at one-minute intervals between each measurement. The variables recorded include the working speed of the high-pressure pump, pressures and flow rates at different points in the system, seawater pH and conductivity, conductivity of permeate water, general energy consumption (kWh), total specific energy consumption (kWh/m3), and finally, the conversion factor. A total of 19 variables were obtained, although only the ones shown in Table 2 were used in this study.

Table 2.
Sample of the data recorded during a 24-h measurement.
2.2. Artificial Intelligence Method
The aim of this paper is to create an intelligent structure that is able to indicate the most adequate actuator parameters in order to have the most efficient desalination operation. To achieve this, first, it is necessary to obtain a table with the best values of the parameters from Table 2 and to establish limits for the daily amount of permeate water, permeate conductivity, and total energy consumption. The first requirement involves the amount of water produced in 24 h (as per the vessel’s needs) and is obtained from the permeate flow rate. In this study, the daily water for the crew was set at between 70 to 100 m3 per day. Regarding permeate conductivity, in this case, a maximum lower than those recommended by the WHO’s GDWQ was chosen, since water could be utilized for several needs, including use by the crew; specifically, it was set to between 520 and 680 µS/cm. Finally, the total energy consumption of the plant was fixed between 6.5 and 10 kWh, since the principal objective of this research is to achieve the highest possible energy savings in a marine vessel.
Having set these requirements, a cost function was defined to obtain the remaining variables based on a weight distribution. As mentioned above, the total energy consumption is considered the priority, and was thus assigned 50% of the cost function. The daily amount of permeate water was set at 20%, and permeate conductivity at 30%. By changing these proportions of the cost function or adding new parameters, such as seawater temperature, this method can be extrapolated to different marine vessels.
At this point, the established requirements and the cost function defined generate the optimal values, reducing Table 2 from 1149 to 828 samples whose values satisfy the specified requirements.
In what follows, this subset of values that meet the specified requirements will be called the “table of optimal values”. Furthermore, it is important to note that the cost function used has weighted the term corresponding to the energy requirements at a high percentage compared to the other requirements, since energy savings is a fundamental factor to optimize the total energy consumption in a ship.
The flow chart in Figure 3 shows the steps followed up to now, where the last one, corresponding to the application of an artificial intelligence technique, specifically a Genetic-Neuro Fuzzy process, will be described below.
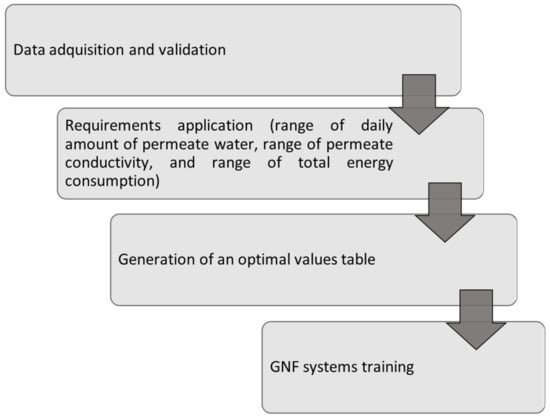
Figure 3.
Flow chart of methodology.
The last step shown in Figure 3 is to build an intelligent control system. The training-based technique chosen in this work is a Genetic Neuro-Fuzzy (GNF) system [21,22]. As shown in Figure 4, a three-layer system with a structure equivalent to the one proposed by Jang [23] has been implemented. The first layer of the system corresponds to GNF inputs and each one represents the membership functions. Equation (1) represents the outputs of this first layer.
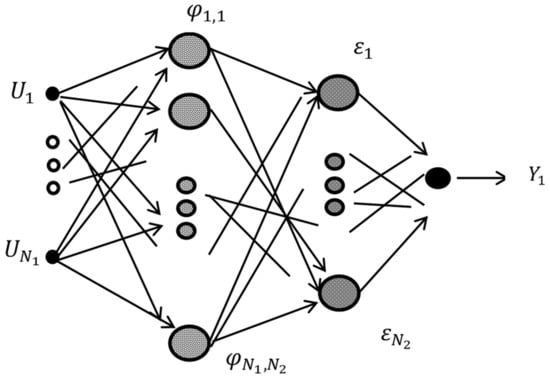
Figure 4.
Structure of the GNF system.
The input number is N1; N2 is the total number of nodes in the intermediate layer; the center of the membership function is shown as mij; σij is the width of the membership function, Ui is the i-th input, φij is the output neuron of the i-th input and the output connected to the j-th node of the intermediate layer.
Equation (2) shows the outputs for the second layer, which corresponds to the rule system. Equation (3) is the general output.
where N3 is the number of GNF outputs, and sϑjk is the estimated value of the k-th output from the j-th node.
As Equations (1)–(3) show, there is a correlation between the width and center of the membership functions, the estimated system outputs and the number of nodes of the intermediate layer. To establish these parameters, a learning process is developed in three phases, where in the first two phases the initial values for the parameters are established and the number of nodes in the hidden layer is optimized. Finally, in the third phase these values are modified to obtain better results.
In the first phase, known as the Unsupervised Learning Phase, a Kohonen’s self-organizing [24] map provides the initial values for mij and sϑjk. The inputs are shown in Equation (4).
The vector [Ui] represents the input values and [Yk] is the desired output of the GNF system.
At the end of this unsupervised learning phase, the winning node is found and the center of the membership functions (mij) is obtained, thus allowing the system outputs (sϑjk) to be estimated. This stage represents the first assignment, since these values will be improved during the ensuing learning phases.
Once N2, mij, and sϑjk are established, in the second phase a GNF is built in order to fix values for the parameters σij. Furthermore, an optimization process is also carried out with the purpose of minimizing the number of rules, that is, of reducing the number of nodes in the hidden layer. This phase uses the genetic process [21,22,25] inspired by the biology prototypical of genetic evolution. In this analogy, there is an individual with elementary data (in this case, a vector), and there are genes (in this research, vector components) that represent the hidden nodes by a Boolean parameter and the width of the membership functions. Next, a fitness function is determined by considering the variation between the real outputs and the individual one. Once this stage is concluded, adequate individual values for σij, and a satisfactory set of rules (nodes on the hidden layer) are determined.
The last phase, known as the Supervised Learning Phase, has the purpose of improving the values set for the mij, σij, and sϑjk parameters. As was pointed out previously, the system proposed in this paper is comparable to a three-layer neural network; therefore, the same equation to describe the input nodes is used as for the neurons in a radial basis neural network [26]. Additionally, the least mean squared learning algorithm is also employed. Lastly, a criterion function (Equation (5)) has to be minimized based on the difference between the outputs of the GNF (ψk) and the desired one (Yk).
Owing to the fact that the initial parameters of mij, σij, sϑjk, and N2 were set previously, in this last learning stage, these values are changed until a minimum error function is found.
In this assessment, the input vector U consists of the seawater pH, the daily amount of water produced, the permeate conductivity and the total energy consumption. It should be noted that three of these parameters have been subjected to the limits set in the requirements. In each phase, several tests are carried out to establish those parameters that yield the minimum error. Regarding the outputs, they are the feed water flow rate and the HPP outlet pressure, but it should be noted that one depends on the other, which necessitates building a learning process in cascade, as shown in Figure 5. It is important to remark that the two blocks labeled “GNF” in Figure 5 correspond to a controller unit, where the inputs are the variables indicated above and the outputs are the HPP output pressure and the feed flow rate. That is, the controller provides values for both parameters in order to satisfy the requirements for the quantity of water produced per day, permeate conductivity and total energy consumption.
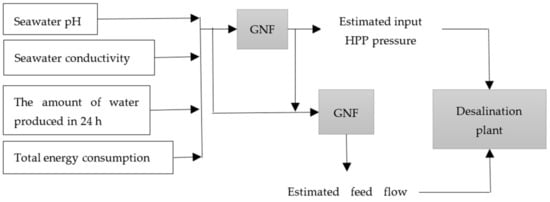
Figure 5.
Diagram of inputs and outputs to Genetic Neuro-Fuzzy.
3. Results and Discussion
All the training phases explained previously were carried out using the 70% of the data, while the rest were set aside to verify the generalization capability of the system. This means testing to see if, once the particular GNF system has been trained, it is able to provide satisfactory outputs to unknown inputs (unused data for the training procedure). By analyzing the results, it is possible to conclude that an appropriate level of generalization has been obtained.
The results of the GNF phase and the unsupervised phase are shown below for the two trained systems. Once the complete training process is concluded for each GNF, the one with the least error function is selected.
Figure 6 shows the result of the genetic algorithm phase when the HPP pressure is being processed. Note that after 20 generations, the best fitness value results are very similar to the mean, and after 50 generations, the average value between individuals is zero. This result indicates that the system has been properly trained. Particular results are shown in Table 3. The right columns present some results provided by GNF after an unsupervised phase, and they are compared with the real HPP values. As we can see, the outputs given by the trained system are quite similar to the expected values, as evidenced by the mean quadratic error of 0.047109 for the generalization. It is important to highlight that these results correspond to outputs generated when unknown inputs are provided, that is, values that have not been used for the training phases.
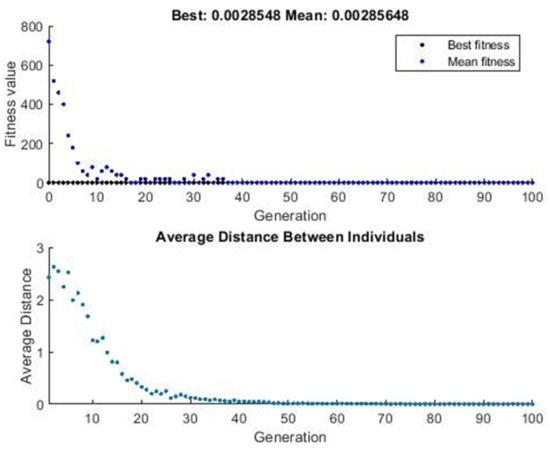
Figure 6.
Average distances between individuals for HPP pressure as performance and evolution of the fitness value.

Table 3.
Comparison of results between outputs provided by GNF system and the real ones for HPP pressure (Bar) and Feed Flow rate (m3/h).
Regarding feed flow rate, when this output is processed, a good generalization is also achieved. The evolution of the fitness value and the average distances between individuals after the Genetic phase are given in Figure 7, which shows that it is not as good as GNF for HPP pressure, although the result could be acceptable, since it improves in the next phase. After the unsupervised phase, the absolute training error is 0.018749 and the absolute generalization error is 0.022766. This is shown in the left columns of the Table, where some of the feed flow rate values provided by the GNF are presented and compared with the expected values. An analysis of these graphs and a comparison of the values obtained with the real ones allows us to confirm the success of the training process.
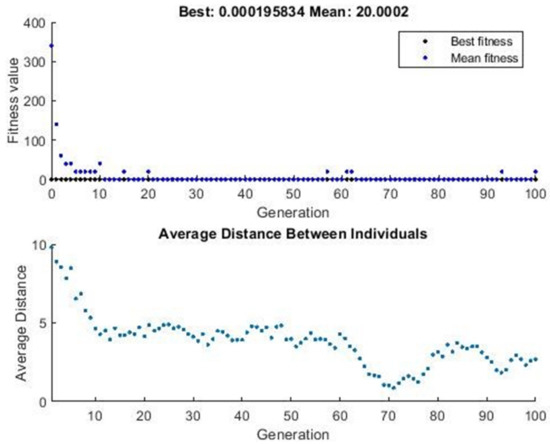
Figure 7.
Trend in fitness value and average distances between individuals for feed flow rate as output.
4. Conclusions
In this research, a cost function based on requirements for the amount of permeate water per day, permeate conductivity, and the total energy consumed by the desalination plant was applied to build a table of optimal values. Part of this table was used for Genetic Neuro-Fuzzy training. Two cascade learning processes were developed, one to provide the HPP inlet pressure to the plant and the other to provide the feed flow.
With this proposed system, it is possible to build an intelligent controller for desalination plants. In this case, it was built to provide the most efficient HPP operating pressure and the most convenient feed flow rate based on requirements determined by the amount of water produced in 24 h, permeate conductivity and total energy consumption. This approach ensures that it is maintained at the set conditions, but also that the intelligent controller will provide the most suitable values for the HPP operating pressure and for the feed flow, in terms of energy efficiency.
It is important to note that this study could be expanded by modifying these requirements. Therefore, this work could be valuable in the field of desalination since it is also applicable to different types of marine vessels, given the energy consumption restrictions considered.
In this study, the conductivity of seawater is considered an input variable; however, this research could be extended if new variables directly related to the expected consumption, such as seawater temperature, were included in the training. Note that this work is focused on improving the efficiency of desalination plants aboard ships that sail around the world through oceans with changing seawater conditions.
In conclusion, this work represents the first step towards a more complex intelligent control of the desalination process in marine vessels. The methodology considered improves the on-board desalination plant, since it considers its changing environmental conditions and aims to minimize the energy requirements. However, its limited storage capacity poses a fundamental challenge for the future of this sector.
Author Contributions
Conceptualization, J.C.-E., Á.H.L. and G.N.M.P.; methodology, J.C.-E. and G.N.M.P.; software, Á.H.L. and G.N.M.P.; validation, Á.H.L.; formal analysis, Á.H.L. and G.N.M.P.; investigation, J.C.-E., Á.H.L. and G.N.M.P.; resources, B.P.S.; data curation, B.P.S.; writing—original draft preparation, Á.H.L.; writing—review and editing, J.C.-E., Á.H.L. and G.N.M.P.; visualization, Á.H.L.; supervision, G.N.M.P.; project administration, G.N.M.P., J.C.-E. and B.P.S.; funding acquisition, G.N.M.P. and B.P.S. All authors have read and agreed to the published version of the manuscript.
Funding
This work has been co-funded by FEDER funds, INTERREG MAC 2014–2020 program, as part of the E5DES project (MAC2/1.1a/309).
Institutional Review Board Statement
Not applicable.
Informed Consent Statement
Not applicable.
Data Availability Statement
Not applicable.
Acknowledgments
The authors acknowledge the support received by FEDER funds, INTERREGMAC 2014–2020 Program of the European Union and the E5DES project [MAC2/1.1a/309]. No new data were created or analyzed in this study. Data sharing is not applicable to this article.
Conflicts of Interest
The authors declare no conflict of interest. The funders had no role in the design of the study; in the collection, analyses, or interpretation of data; in the writing of the manuscript; or in the decision to publish the results.
References
- Krile, S. Fresh Water Supply from Different Sources in the Shipping. Procedia Eng. 2016, 149, 190–196. [Google Scholar] [CrossRef]
- WHO. Guidelines for Drinking-Water Quality, 4th Edition, Incorporating the 1st Addendum. 2017. Available online: http://www.who.int/water_sanitation_health/publications/drinking-water-quality-guidelines-4-including-1st-addendum/en/ (accessed on 4 October 2022).
- World Health Organization. A Global Overview of National Regulations and Standards for Drinking-Water Quality; World Health Organization: Geneva, Switzerland, 2018. [Google Scholar]
- Garcia, C.; Mestre-Runge, C.; Morán-Tejeda, E.; Lorenzo-Lacruz, J.; Tirado, D. Impact of Cruise Activity on Freshwater Use in the Port of Palma (Mallorca, Spain). Water 2020, 12, 1088. [Google Scholar] [CrossRef]
- Shammi, M.; Mostafizur, M.R. Desalination technologies and potential mathematical modeling for sustainable water–energy nexus. Water Eng. Model. Math. Tools 2021, 251–269. [Google Scholar] [CrossRef]
- Macharia, P.; Kreuzinger, N.; Kitaka, N. Applying the Water-Energy Nexus for Water Supply—A Diagnostic Review on Energy Use for Water Provision in Africa. Water 2020, 12, 2560. [Google Scholar] [CrossRef]
- Balcombe, P.; Brierley, J.; Lewis, C.; Skatvedt, L.; Speirs, J.; Hawkes, A.; Staffell, I. How to decarbonise international shipping: Options for fuels, technologies and policies. Energy Convers. Manag. 2019, 182, 72–88. [Google Scholar] [CrossRef]
- Padrón, I.; Avila, D.; Marichal, G.N.; Rodríguez, J.A. Assessment of Hybrid Renewable Energy Systems to supplied energy to Autonomous Desalination Systems in two islands of the Canary Archipelago. Renew. Sustain. Energy Rev. 2019, 101, 221–230. [Google Scholar] [CrossRef]
- Zhong, R.Y.; Xu, X.; Klotz, E.; Newman, S.T. Intelligent Manufacturing in the Context of Industry 4.0: A Review. Engineering 2017, 3, 616–630. [Google Scholar] [CrossRef]
- Alshehri, M.; Kumar, M.; Bhardwaj, A.; Mishra, S.; Gyani, J. Deep Learning Based Approach to Classify Saline Particles in Sea Water. Water 2021, 13, 1251. [Google Scholar] [CrossRef]
- Mitchell, T. Machine Learning; McGraw Hill: New York, NY, USA, 1997; Volume 70428077. [Google Scholar]
- Hernández, A.; Castejón, C.; García-Prada, J.C.; Padrón, I.; Marichal, G.N. Wavelet Packets Transform processing and Genetic Neuro-Fuzzy classification to detect faulty bearings. Adv. Mech. Eng. 2019, 11, 1–10. [Google Scholar] [CrossRef]
- Marichal, G.N.; Ávila, D.; Hernández, Á.; Padrón, I.; Castejón, C. Feature Extraction from Indirect Monitoring in Marine Oil Separation Systems. Sensors 2018, 18, 3159. [Google Scholar] [CrossRef]
- Marichal, G.N.; del Castillo, M.L.; López, J.; Padrón, I.; Artés, M. An Artificial Intelligence Approach for Gears Diagnostics in AUVs. Sensors 2016, 16, 529. [Google Scholar] [CrossRef]
- Plasencia, G.N.M.; Camacho-Espino, J.; Prats, D.; Suárez, B.P. Machine Learning Models Applied to Manage the Operation of a Simple SWRO Desalination Plant and Its Application in Marine Vessels. Water 2021, 13, 2547. [Google Scholar] [CrossRef]
- Azad, A.; Aghaei, E.; Jalali, A.; Ahmadi, P. Multi-objective optimization of a solar chimney for power generation and water desalination using neural network. Enegry Convers. Manag. 2021, 238, 114152. [Google Scholar] [CrossRef]
- Pohl, R.; Kaltschmitt, M.; Höllander, R. Investigation of different operational strategies for the variable operation of a simple reverse osmosis unit. Desalination 2009, 249, 1280–1287. [Google Scholar] [CrossRef]
- Cabrera, P.; Carta, J.A.; González, J.; Melián, G. Wind-driven SWRO desalination prototype with and without batteries: A performance simulation using Machine Learning Models. Desalination 2018, 435, 77–96. [Google Scholar] [CrossRef]
- Avila, D.; Marichal, G.N.; Hernández, Á.; Luis, F.S. Hybrid renewable energy systems for energy supply to autonomous desalination systems on Isolated Islands. Des. Anal. Appl. Renew. Energy Syst. 2021, 23–51. [Google Scholar] [CrossRef]
- Al Aani, S.; Bonny, T.; Hasan, S.W.; Hilal, N. Can machine language and artificial intelligence revolutionize process automatio for water treatment and desalination? Desalination 2019, 458, 84–96. [Google Scholar] [CrossRef]
- Cordón, O.; Gomide, F.; Herrera, F.; Hoffmann, F.; Magdalena, L. Ten years of genetic fuzzy systems: Current framework and new trends. Fuzzy Sets Syst. 2004, 141, 5–31. [Google Scholar] [CrossRef]
- Nobre, F.S.M. Genetic-neuro-fuzzy systems: A promising fusion. IEEE Int. Conf. Fuzzy Syst. 1995, 1, 259–266. [Google Scholar] [CrossRef]
- Jang, J.S.R. ANFIS: Adaptive-Network-Based Fuzzy Inference System. IEEE Trans. Syst. Man Cybern 1993, 23, 665–685. [Google Scholar] [CrossRef]
- Kohonen, T. The Self-Organizing Map. Proc. IEEE 1990, 78, 1464–1480. [Google Scholar] [CrossRef]
- Rajasekaran, S.; Pai, G.A.V. Neural Networks, Fuzzy Logic and Genetic Algorithm: Synthesis and Applications; PHI Learning Pvt. Ltd.: New Delhi, India, 2003. [Google Scholar]
- Chen, S.; Cowan, C.F.N.; Grant, P.M. Orthogonal Least Squares Learning Algorithm for Radial. IEEE Trans. Neural Netw. 1991, 2, 302–309. Available online: https://core.ac.uk/download/pdf/1497907.pdf (accessed on 5 October 2022).
Disclaimer/Publisher’s Note: The statements, opinions and data contained in all publications are solely those of the individual author(s) and contributor(s) and not of MDPI and/or the editor(s). MDPI and/or the editor(s) disclaim responsibility for any injury to people or property resulting from any ideas, methods, instructions or products referred to in the content. |
© 2023 by the authors. Licensee MDPI, Basel, Switzerland. This article is an open access article distributed under the terms and conditions of the Creative Commons Attribution (CC BY) license (https://creativecommons.org/licenses/by/4.0/).