Article

Research on Particle Size and Energy Consumption Law of Hard Coal Crushing under Impact Load Based on SHPB Test

School of Civil Engineering and Architecture, Anhui University of Science and Technology, Huainan 232001, China
*
Author to whom correspondence should be addressed.
Appl. Sci. 2023, 13(5), 3298; https://doi.org/10.3390/app13053298
Submission received: 5 February 2023 / Revised: 22 February 2023 / Accepted: 25 February 2023 / Published: 4 March 2023
(This article belongs to the Special Issue Advances and Challenges in Rock Mechanics and Rock Engineering)

Abstract

:
To study the particle size distribution and energy variation law of hard coal under a load, an impact compression test of hard coal specimens under different impact loading conditions was carried out using a Φ50 mm diameter Separate Hopkinson Press Bar (SHPB) test system. We implemented the theory of dynamic impact energy of rock to establish the calculation expression of hard coal impact crushing energy dissipation, and we established the Weibull distribution model of a crushing body to analyze the impact velocity in relation to the particle size distribution of hard coal crushing and crushing energy consumption. The results demonstrate that due to the different original states of the specimens, the damage to the specimens under static action is in the mode of conjugate plane shear damage, single bevel shear damage, and tensile damage. The damage process of the specimen under impact load loading is divided into three stages: elastic deformation, elastic–plastic deformation, and plastic softening, while the increase in the strain rate caused the peak stress of the specimen to increase. The Weibull distribution can characterize the impact crushing size distribution of hard coal specimens very well. The parameter of coal rock crushing degree is a power function that is influenced by the impact velocity; the greater the impact velocity, the higher the coal rock crushing degree, but the characteristic index of coal rock crushing fluctuates with the increase in impact velocity. As the impact velocity increases, the incident energy and reflected energy increase linearly, while the transmitted energy increases first and then decreases. The dissipation energy of coal rock crushing also increases linearly with the impact velocity. There is no obvious regular change between the energy dissipation rate of coal rock and impact velocity during impact damage, and the dissipated energy of macroscopic crushing only accounts for 10~20% of the incident energy; most of the energy is used for damping loss and damage loss.

1. Introduction

China is the world’s largest miner and consumer of coal, mining to a depth of 1000~2000 m [1]. The continuous development and deepening of coal mines are leading to increasingly serious dynamic disasters, such as rock burst, coal explosion, and coal and gas outbursts [2,3,4,5,6,7,8]. Therefore, research into the dynamic failure mechanism of coal and rock is of great significance, helping to prevent dynamic disaster and production safety.
The SHPB test device can analyze the mechanical properties of different materials by obtaining the wave propagation patterns in different materials at high strain rates, so it is widely used to test the properties of rocks, concrete, and other materials [9,10,11]. Han et al. [12] used the SHPB test setup to investigate the dynamic mechanical properties and wave propagation patterns of composite geotechnical specimens. The results of the research can help us evaluate and improve the safety stability of rock structures. Zhai et al. [13] studied the dynamic response characteristics of concrete–granite specimens with different interfacial roughness and analyzed the rupture fragmentation pattern and the law of stress wave interfacial propagation of the specimens. Li et al. [14] investigated the dynamic mechanical properties and fracture characteristics of three types of rocks (chert, dolomite, and sandstone) under impact loading, and the results showed that the increase in strain rate led to a significant increase in dynamic yield strength, crack extension, and fragmentation of the specimens. The concept of energy can reveal the failure process of rock under external load [15,16,17,18]. Recent studies have shown that the failure process of coal rock materials can be well described by the energy concept [19,20,21,22,23,24,25,26]. Scholars have studied the fracture patterns and energy consumption rules of coal and rock [27,28,29,30,31,32,33,34,35,36]. Song et al. [37] used the true triaxial device to study the energy dissipation law of a water-saturated coal specimen. Water also induced energy absorption failure of coal specimens under three-dimensional dynamic and static loading. Wang et al. [38] researched the energy dissipation law and fractal characteristics of coal specimens under a dynamic load. There was a significant length–diameter ratio effect on the energy consumption ratio of coal specimens under dynamic loading, and the average particle size of coal fragments increased linearly with the increase in the length–diameter ratio. Wang et al. [39] studied the variation law of particle size fractal dimension and energy dissipation rate of coal under the action of axial pressure. The results showed that the fractal characteristics of coal rock fragmentation are logarithmically related to the loading rate, and the energy dissipation rate tends to first increase and then decrease with the fractal dimension. Gong et al. [40] tested the dynamic fracture toughness of a coal specimen using a straight cut groove semi-circular bending method and a Hopkinson loading device. They determined that the impact velocity and bedding dip angle both affect the fracture toughness of coal specimens, but the influence of the coal specimen midbed angle on dynamic fracture toughness reduces with the increase in the impact velocity. Zhang et al. [41] studied the energy evolution mechanism of damage deformation of confining pressure coal rock containing gas under a load. Lu et al. [42] investigated the mechanical properties and energy dissipation evolution of coal and rock under triaxial stress and found that confining pressure has a lateral binding effect on coal specimens, weakening the release rate of impact energy and reducing the degree of coal specimen fragmentation. Jiang et al. [43] believe that the coal rock fracture was caused by the combined action of energy release and energy dissipation, and the Weibull distribution can be applied to characterize the particle size distribution of coal rock fractures at different impact velocities. Zheng et al. [44] used fractal distribution and Weibull distribution to represent the distribution law of coal gangue fragmentation size and analyzed the relationship between the coal gangue crushing characteristic index (CCI), crushing degree index (CDI), and a fractal dimension with various influencing parameters. Zhang et al. [45,46] studied the energy dissipation and fracture block distribution characteristics of coal and rock specimens that were subjected to medium strain rate. The results show that an increase in strain rate leads to a rapid increase in the energy dissipation density of the specimen and a consequent increase in the fractal dimension. Feng et al. [47] quantitatively described the energy dissipation process and deformation process of coal with the energy dissipation rate. The results show that the sudden increase in energy dissipation rate indicates the fracture inside the specimen, and the energy dissipation rate is an important indicator of the local fracture and final damage of coal.
Hard coal generally refers to coal whose hardness coefficient is greater than three, while the more conservative classification considers that the hardness coefficient of soft coal is less than one and medium hard coal is from one to two, while the hardness coefficient for hard coal is higher than two [48]. When the coal hardness is high, the coal is crushed to a higher degree by the cutting machine during the coal seam mining process. Additionally, the collision of coal during transportation causes a low lump coal rate, which greatly affects the economic benefits of coal. To further investigate the impact load hard coal crushing particle size distribution and energy dissipation law, this paper uses the SHPB test system to perform impact compression tests on hard coal specimens with different impact velocities. It uses the Weibull distribution model to study the impact crushing particle size distribution law of specimens, combined with the theory of dynamic rock impact energy calculation, to analyze the hard coal specimens that are involved in the impact damage process of energy dissipation law, as well as its relationship with the impact velocity. The research results will provide a test basis for hard coal mining engineering.

2. Uniaxial Compression Test of Hard Coal

2.1. Preparation of Coal Rock Specimen

In Figure 1, the static compression test adopts the standard cylinder specimen with size of 50 mm, and a diameter and height of 100 mm. The dynamic uniaxial compression test adopted cylinder standard specimens that were 50 mm in size and 25 mm in diameter and height. These specimens are made of coal sourced from the 20,303 fully mechanized mining face of Yanghupan Coal Mine in Yulin City through coring, cutting, and grinding. During processing, the unevenness of the two end faces of the test piece was controlled to be less than 0.05 mm.

2.2. Test Equipment

A static compression test of hard coal was completed on the RMT test machine. The maximum vertical load of the press is 1000 kN; the accuracy grade is 0.5. The deformation rate that was used in the test was 0.02 mm/s. The uniaxial compressive strength of the specimen is as follows:
R c = P π r 2 × 10
where R c is uniaxial compressive strength (MPa); P is the failure load of coal specimen, kN; and r is the radius of the coal specimen, cm.
The impact test adopted the Φ50 mm SHPB test system. The test system is comprised of a loading system, a striker bar (bullet), an incident bar, a transmission bar, a dynamic strain test device, a data-processing acquisition system, and a damping device. The structure of the test device is shown in Figure 2. The impact test was performed using a Φ50 mm separated SHPB test system from Anhui University of Technology, which is composed of a loading system, impact bar (bullet), incident bar, transmission bar, damping device, and signal acquisition system, as shown in Figure 2. The length of the impact rod is 0.60 m and the lengths of the incident and transmission rods are 2.40 m and 1.20 m, respectively. The material of each rod is alloy steel with 7.8 g/cm3 density, a modulus of elasticity 210 GPa, and a longitudinal wave speed of 5190 m/s. The BX120-2AA semiconductor strain gauge was used to collect voltage signals on the incident and transmission rods; a DPO 3024 digital oscilloscope and KD6009 strain amplifier were used for data signal acquisition, supplemented by a parallel beam and a timer to test the velocity of the bullet. The equilibrium stress curve of the specimen under the impact load is shown in Figure 3.

2.3. Analysis Method

The test result analyses of SHPB are based on homogenization assumption. The DPO 3024 digital oscilloscope records the waveform of the specimen and the voltage signal corresponding to each time process during the test. The incident wave strain εi(t), the reflected wave strain εr(t) and the transmitted wave strain εt(t) of the specimen can be obtained via analysis, and the stress σ(t), strain rate ε ˙ ( t ) , and strain ε(t) of the hard coal test piece are obtained according to the three-wave method [49,50,51] as follows:
σ ( t ) = A e E e 2 A s ε t ( t ) + ε r ( t ) + ε i ( t ) ε ˙ ( t ) = C e L s ε i ( t ) ε r ( t ) ε t ( t ) ε ( t ) = C e L s 0 t ε i ( t ) ε r ( t ) ε t ( t ) d t
where Ee is the elastic modulus of the pressure bar, GPa; Ae is the cross-section area of the pressure bar in the test device, mm2; As is the sectional area of the specimen, mm2; Ce is the propagation velocity of the stress wave, m/s; and Ls is the initial height of the test piece, mm.
The energy is calculated as follows [52]:
W = A e C e E e 0 t σ 2 t d t
where W is the energy carried by the stress wave, J, and the wave velocity Ce can be expressed by the elastic modulus Ee and the density ρe of the pressure bar:
C e = E e / ρ e
Therefore, the stress wave energy equation can be simplified by the following Equation (5):
W = A e ρ e C e 0 τ σ 2 t d t
where ρeCe is the wave impedance of the pressure bar, g/cm3·m/s.
The incident energy WI, the reflected energy WR, and the transmitted energy WT on the pressure bar are, respectively, expressed in Equations (6)–(8).
W I = A e ρ e C e 0 τ σ I 2 t d t
W R = A e ρ e C e 0 τ σ R 2 t d t
W T = A e ρ e C e 0 τ σ T 2 t d t
where σI(t), σR(t), and σT(t) are the incident stress, the reflected stress, and the transmitted stress at a certain time t.
According to Equations (8)–(10), the destructive energy WS consumption of the hard coal specimen under a SHPB dynamic impact can be expressed as:
W S = W I W R W T
The energy dissipation rate N is usually used to represent the strength of coal rock energy dissipation under SHPB dynamic impact. N is calculated as follows [46]:
N = W S W I × 100 %

3. Analysis

3.1. Test Results under Static Load

The original geometric size of the specimens and the calculation results of static uniaxial compressive strength are shown in Table 1. The failure modes of several specimens are shown in Figure 4.
According to Table 1, the strength of six of the nine hard coal specimens in the uniaxial compression test were greater than 25 MPa. The average compressive strength was 28.636 MPa, the average elastic modulus was 2.875 GPa, the average Poisson’s ratio was 0.353, and the hardness coefficient was 2.9. According to the literature [48], it can be determined that the coal used in the test is hard coal.
Figure 4 shows three failure modes: X-shaped conjugate plane shear failure of 1-1#~1-3# test pieces, single-slope shear failure of 1-4# and 1-5# test pieces, and tensile failure of 1-6#~1-9# test pieces. This is mainly related to the original state of the test pieces. According to Table 1, the density and compressive strength of the 1-1#~1-5# test pieces are higher than those of the other test pieces, indicating that the integrity and compactness of the internal structure are higher. The original cracks on the surfaces of specimens 1-6# and 1-9# are clearly visible, and the generation of the original cracks will produce a weak surface. In response to the load action, the specimen will first fail along the weak surface, resulting in a form of tensile failure.

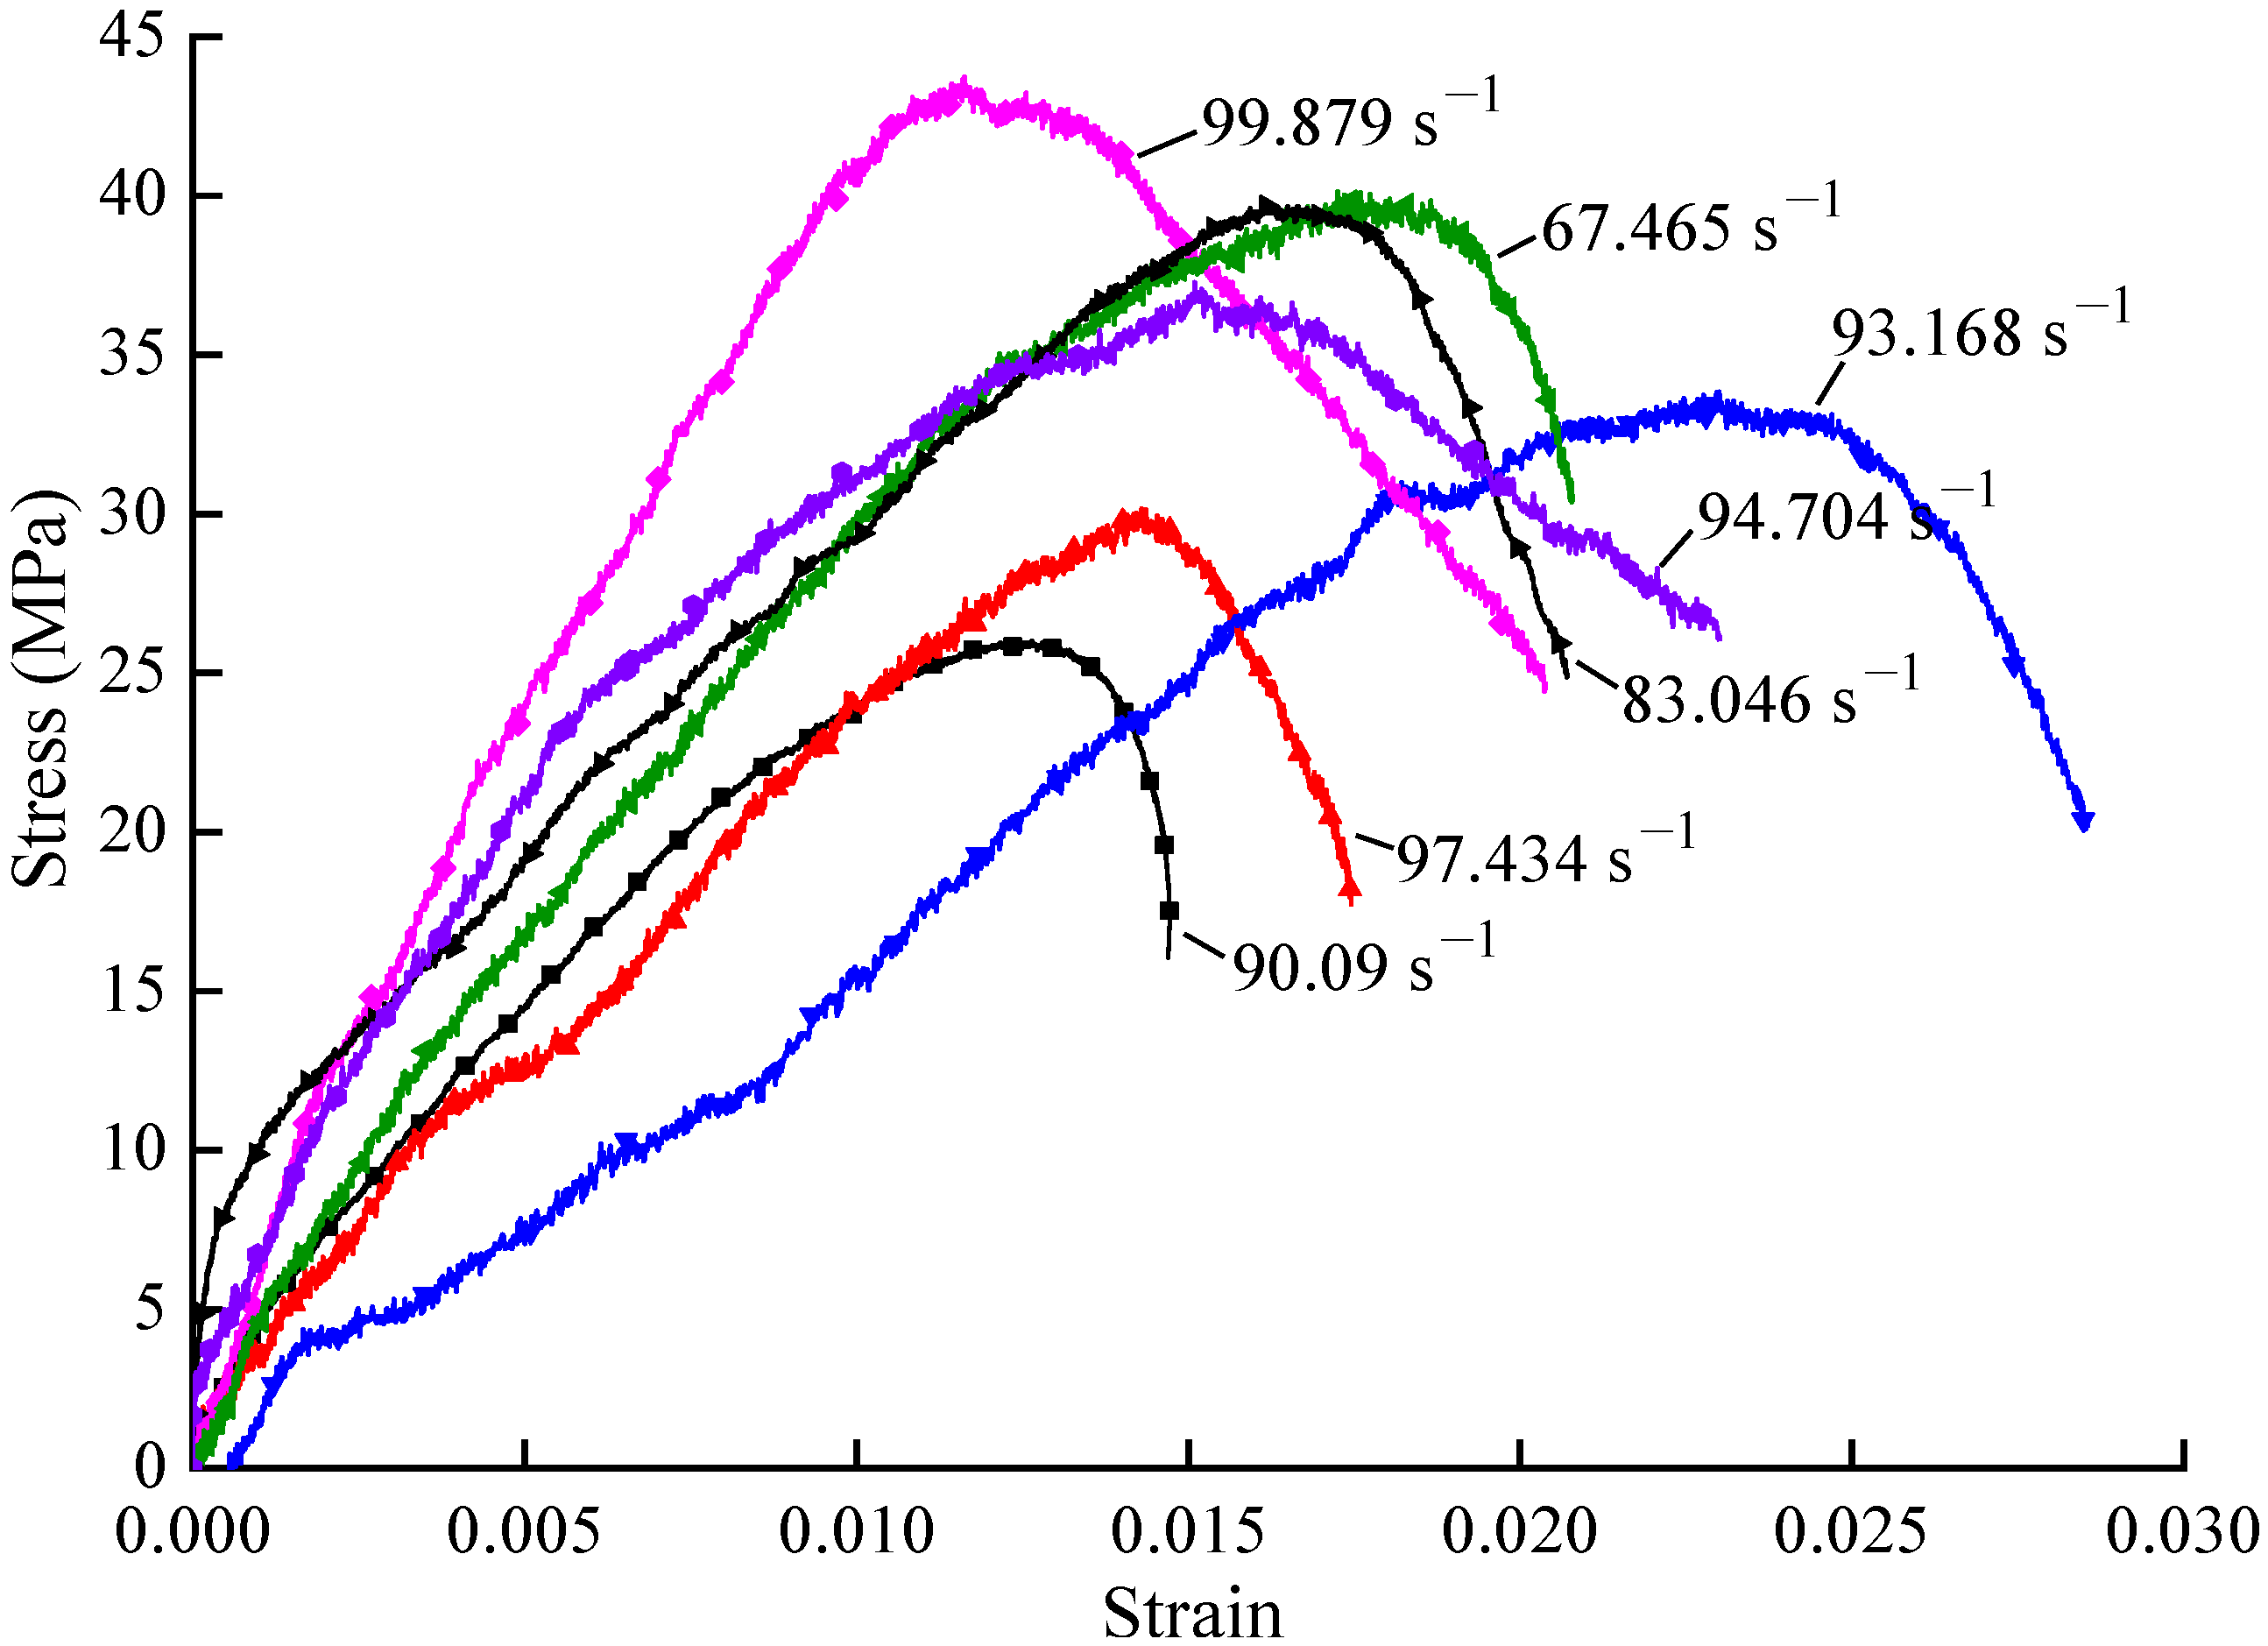
3.2. Dynamic Stress–Strain Curves

Different impact air pressures can be selected to obtain different strain rates, while the size of the impact air pressure influences the rupture and crushing morphology of the specimen. If the chosen air pressure is low, the specimen cannot be damaged in the dynamic load test, and thus the Weibull distribution model cannot be used to quantitatively characterize the degree of hard coal crushing. If the air pressure is too high, there will be little variation in the degree of fragmentation of the specimen. The test specimens were test-punched before the test, and three impact air pressures of 0.15 MPa, 0.2 MPa, and 0.3 MPa were selected to obtain different strain rates. The impact test of three specimens were tested under the same conditions. Among them, seven groups of three specimens were used to obtain valid data. The velocity that was obtained by impact bullet was 2.538~5.011 m/s. The maximum strain rate of the tested coal specimens ranged from 67.465 to 99.879 s−1, while the compressive strength ranged from 25.999 to 43.743 MPa.
The impact compression test results of hard coal are shown in Table 2. The stress–strain curve of a typical hard coal specimen is shown in Figure 5.
The stress–strain curve change process that is shown in Figure 5 can be divided into three stages. In the initial stage, the specimen and the end of the pressure bar are gradually compacted. The internal pores and cracks of the specimen are tightly closed in a very short time after close contact. The initial inelastic deformation stage is not obvious: when the curve enters the elastic deformation stage, it increases almost linearly. When the stress reaches about 80% of the peak stress, the curve grows slowly and enters the elastoplastic phase. As the stress increases, the microcracks gradually expand and form new cracks. After the peak stress, the stress decreases rapidly with the increase in the strain and enters the plastic softening stage. At this time, the crack inside the specimen is further expanded and penetrates with the main crack, eventually breaking the specimen.
The peak stress increases with the increase in the strain rate. This is because in response to an external load, when the strain rate is low, the largest internal defect of hard coal specimens will bear the stress and deformation that is attached to other defects. In this case, the specimen will only fail along its own internal defect. With a further increase in the strain rate, when the crack propagation rate in the specimen is greater than the overall stress and deformation rate of the material, other small defects and sub-defects in the material will be activated, and the force that is exerted on the material as a whole will be shared by all defects in the material and the surrounding area. In this case, the specimen exhibits stress enhancement and strain rate effect. However, based on the test results, the results of some specimens do not conform to the overall law, which may be due to the existence of a certain discrete type of different hard coal specimen. Compared with rock specimens, the overall homogeneity of coal specimens is poor, and the existence of primary cracks in some coal specimens is large. The existence of primary cracks results in specimens with weak surfaces. Under external load, specimens initially fail along the weak surface, greatly reducing their bearing capacity and strength.

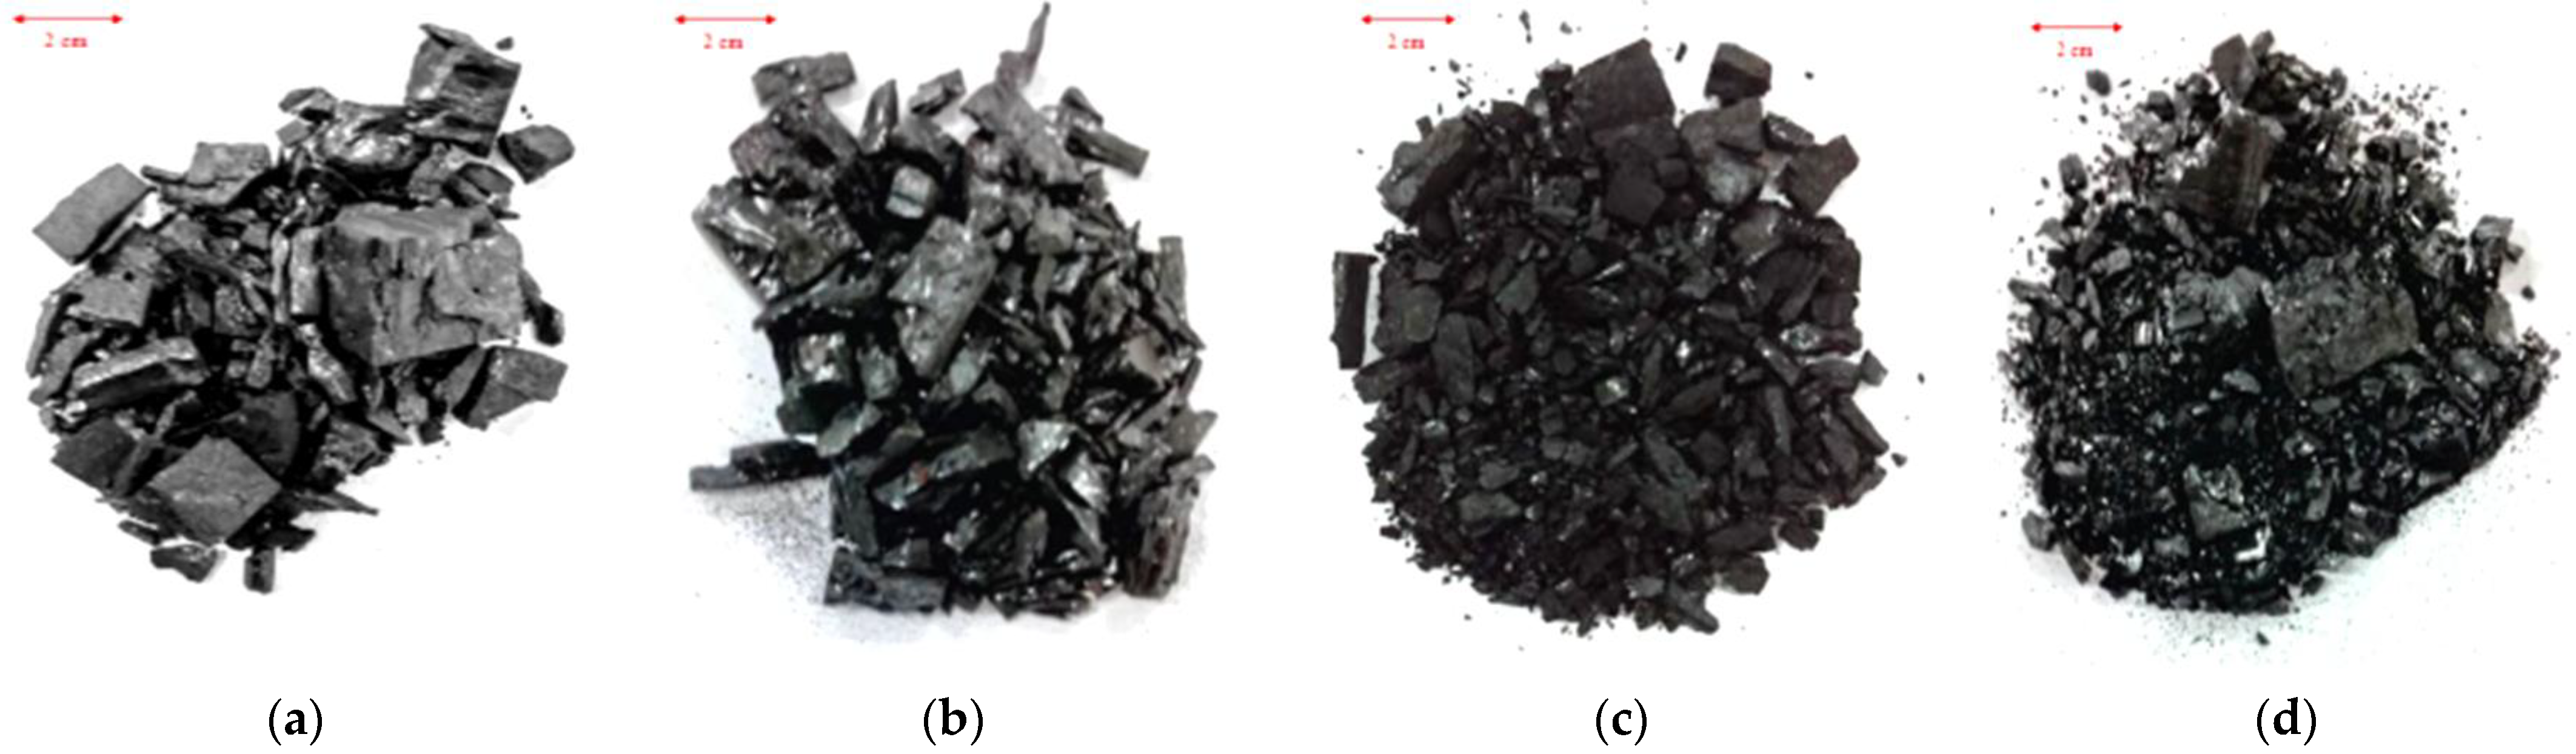
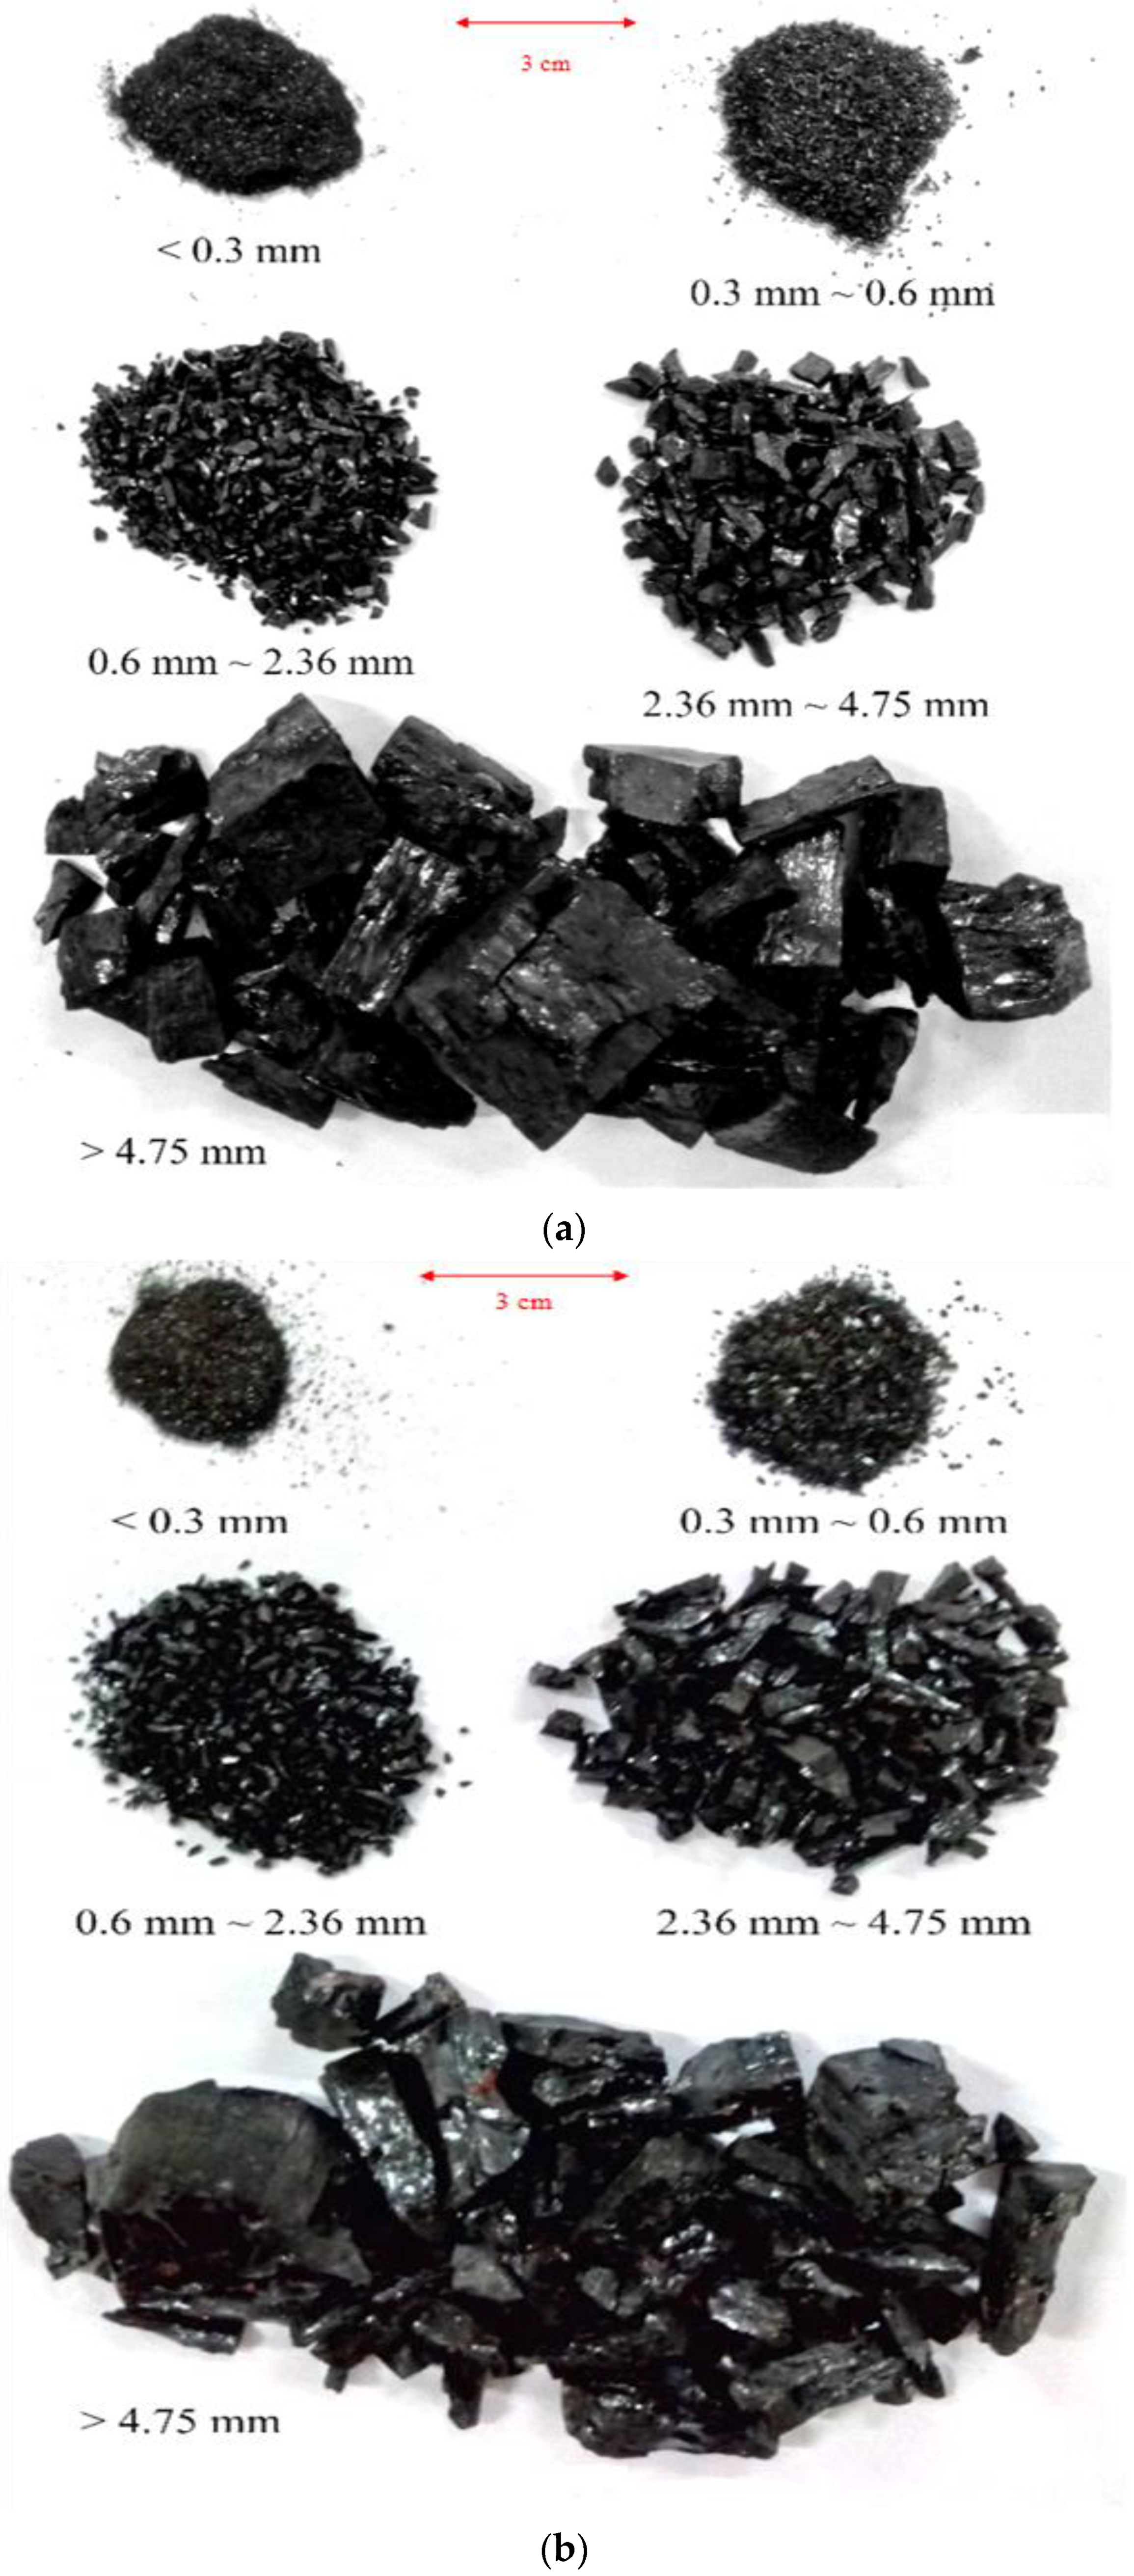
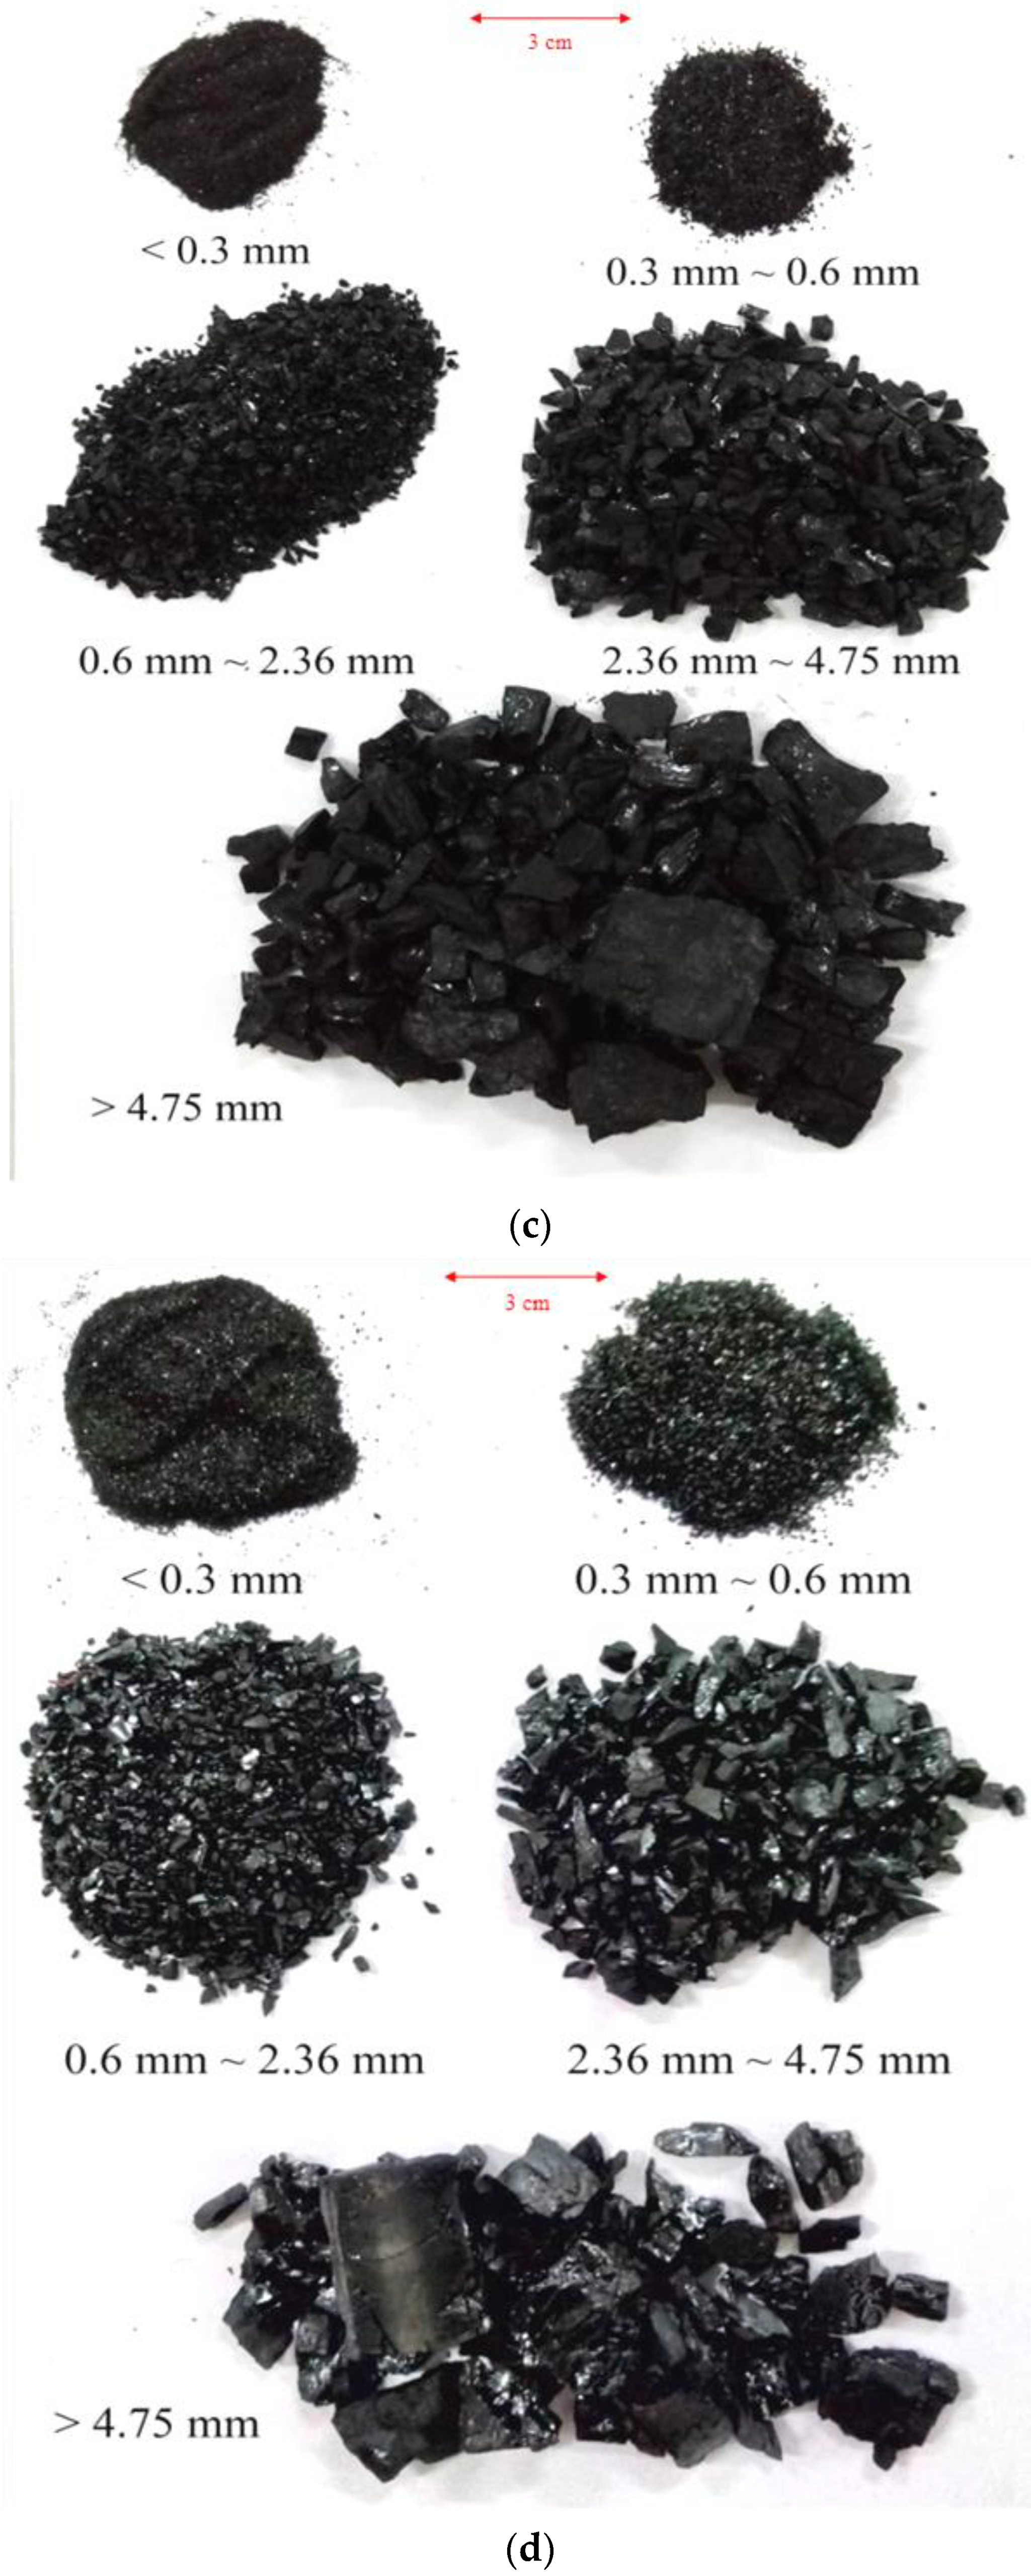
3.3. Crushing Particle Size Distribution of Hard Coal

In the 1930s, Rosin and Rammler first applied the Weibull distribution to study the particle size distribution of coal rock fragmentation, and proposed the theory of studying the fracture size of coal rock [53]. The Swedish engineer and mathematician Waloddi Weibull explained this theory in detail [54]. Researchers at home and abroad have proved that the particle size of coal rock is subject to Weibull distribution through many experimental data [43,44]. The specific Weibull distribution model is:
V = 1 exp d k d 0 m 0
where V is the mass cumulative probability, representing the ratio of the amount of broken coal that can pass through the mesh diameter, dk, after the coal rock is broken to the total amount of the specimen, and %. m0 is the coal rock crushing characteristic index (CCI), and its value is related to the particle size distribution. d0 is the coal rock crushing degree index (CDI). The larger the value, the more complex the particle breaks and the higher the non-uniformity.
The logarithmic transformation of Equation (2) is carried out to obtain the coal particle fragmentation distribution function expressed by logarithm:
F V d k = ln ln 1 / 1 V = m 0 ln d k m 0 ln d 0
where FV (dk) is the mass cumulative distribution function of the particle size of the fractured coal rock, which is no larger than the sieve diameter dk.
To study the distribution of broken hard coal particles after impact, standard sieves with different diameter sieve holes were used for classification treatment. The diameters of the sieve holes were 0.3, 0.6, 2.36, and 4.75 mm, respectively. The coal specimen fracture degree has five grades: 0~0.3, 0.3~0.6, 0.6~2.36, 2.36~4.75, and >4.75 mm. A selection of the specimen fragments before and after sieving are shown in Figure 6 and Figure 7.
When the impact velocity reaches 2.675 m·s−1, the dynamic load that is carried by the incident rod can break the specimen. At this time, the specimen can no longer maintain its integrity and the degree of breakage is relatively high; the specimen is broken into multiple fragments of uneven size, demonstrating a form of compression failure. The increase in impact pressure increases the initial impact velocity of the bullet. Likewise, the energy that is absorbed by coal specimens during the impact process also increases. Therefore, the degree of breakage of specimens in the impact process also increases significantly. By comparing the degree of breakage of specimens under four velocities, as shown in Figure 6, the increase in velocity increases the degree of breakage and the number of fragments. When the velocity reaches v = 5.011 m·s−1, the specimens demonstrate a form of crushing failure.
Figure 7 shows the morphology of broken specimens with different particle size grades after screening. When the velocity reaches 2.675 m·s−1, large particle sizes result in more fragmentation, while small particle sizes account for less fragmentation, and the size of the specimen is concentrated above 4.75 mm. The increase in speed increases the level of coal specimen breakage. The proportion of large specimens decreases significantly, while the proportion of small specimens increases significantly. When v = 2.675 m·s−1 and v = 4.024 m·s−1, the impact velocity of the specimen reaches 3.275 m·s−1 and 4.675 m·s−1, while the number of specimens with particle sizes below 0.6 mm remains consistent. However, the number of fragments increases significantly between 0.6 mm and 4.75 mm, while the quantity of fragments above 4.75 mm decreases. Under this impact velocity, the number of small fragments does not change significantly, the proportion of medium fragments increases significantly, and the number of large fragments decreases. When the impact velocity reaches v = 5.011 m·s−1, it is clear from the fragmentation degree that there is a clear increase in the number of fragments below 4.75 mm, while the number of fragments above 4.75 mm decreases significantly; this is the specimen with the smallest proportion under the four impact velocities. The main reason is that the higher the velocity, the greater the loading energy. The coal and rock specimens absorb higher energy in a very short time, which leads to the intensification of cracks and defects inside the specimens. Finally, the specimens are crushed.
The quality of the coal fragments on each sieve grade is weighed using a high-sensitivity electronic scale. The measurement data are recorded, and the mass is calculated to obtain the cumulative probability of the impact fracture quality. According to Equation (2), the cumulative probability of coal rock fracture quality is fitted using Origin 9.0 software. The fitting curve that is obtained under double logarithmic coordinates is shown in Figure 8. According to the fitting curve, the parameters of the fitting function are as follows: the coal crushing characteristic index m0, the crushing degree index d0, and the correlation coefficient R2. Analysis of the coal rock fragmentation results are shown in Table 3.
Figure 8 and Table 3 show that the double logarithm lnln [1/(1 − V)] is linearly related to lndk, and the correlation coefficient of the fitting function ranges from 0.995 to 0.999. This indicates that the Weibull distribution can satisfactorily describe the characteristics of the impact fracture particle size distribution of coal rock specimens, and the particle size distribution of coal rock specimens has very good self-similarity after fracture [55].
Figure 9 shows the relationship between the coal crushing degree index d0 and the impact velocity. The fitting function relationship is as follows.
d 0 = 141.768 v 1.916 ,   R 2 = 0.941
Figure 9 shows that the coal crushing degree index d0 reduces with the increase in velocity as a power function. This shows that the impact speed affects the fracture degree of the specimen. That is to say, the greater the impact velocity, the higher the degree of coal rock fracture. The coal crushing characteristic index m0 fluctuates with the increase in velocity, which is due to the dispersion of test results that are affected by the uneven internal structure of the coal specimen. Since actual coal mining needs to reduce the content of pulverized coal and increase the economic value of coal, it is necessary to ensure that the fragment size of crushed coal is not too small. The coal crushing degree index and the crushing characteristic index can be used to select the speed of coal rock impact crushing, so that the broken lump coal is controlled in a better area.

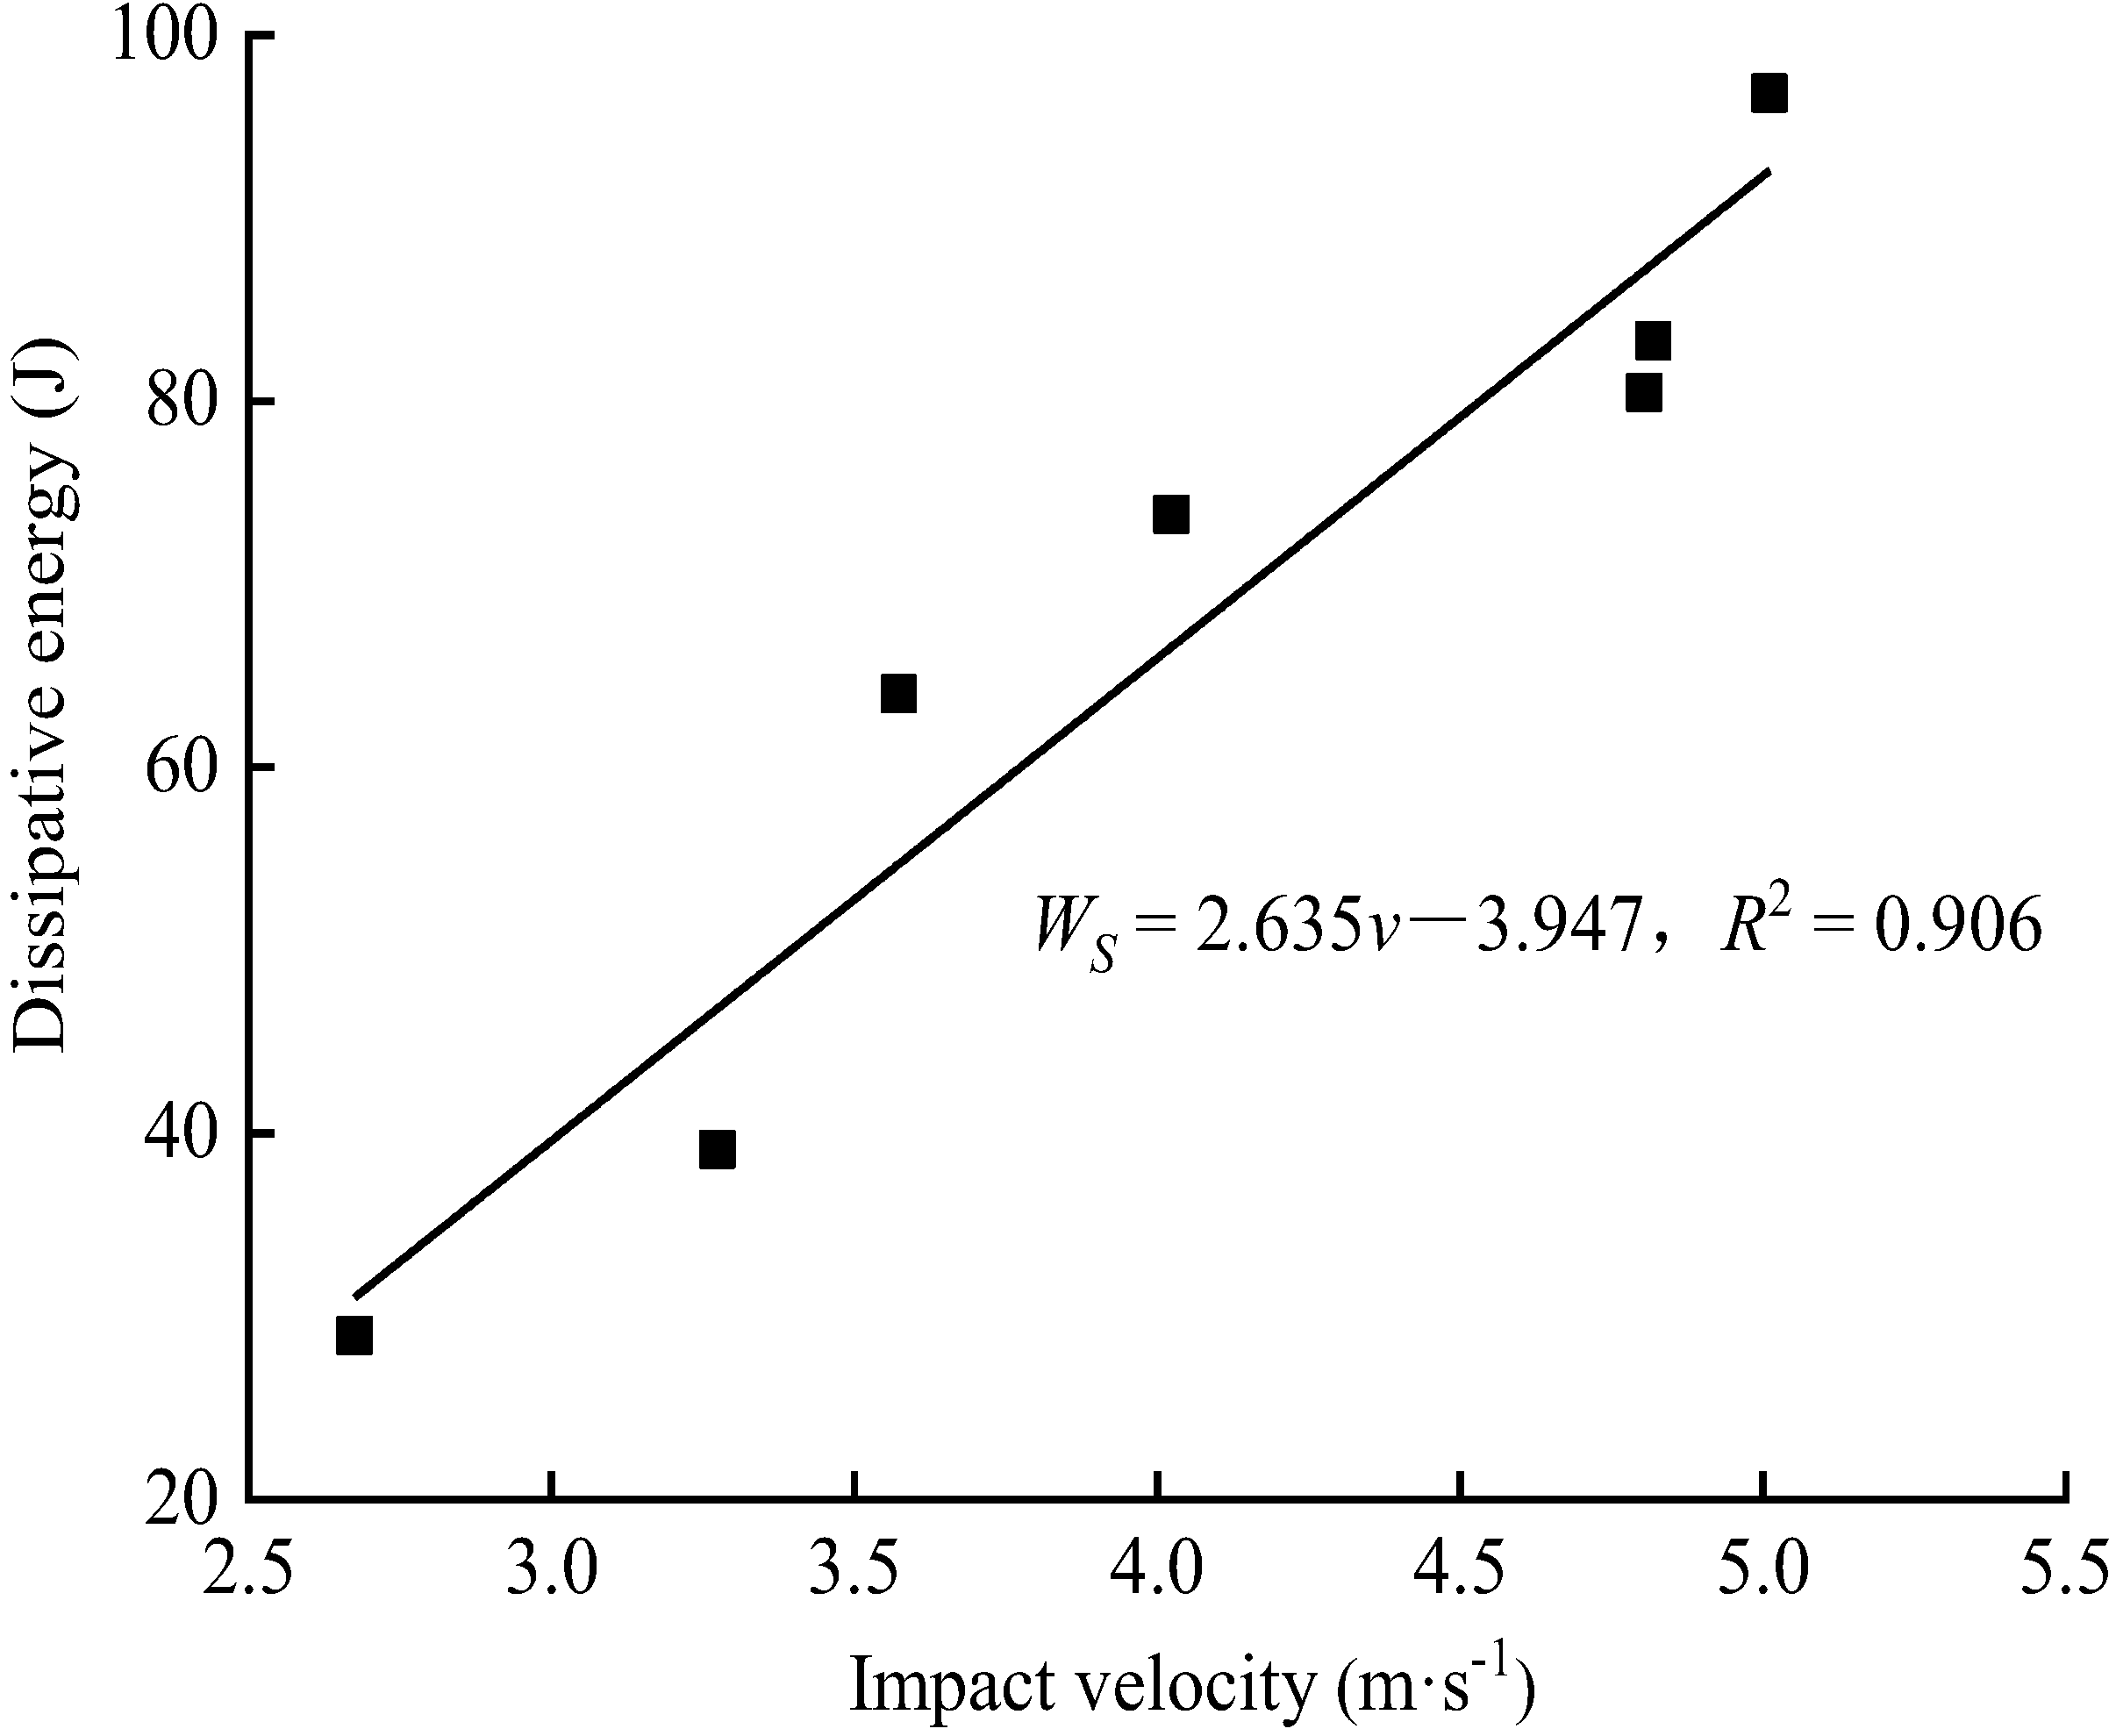
3.4. Energy Dissipation Analysis

According to Equations (6)–(10), the incident energy, reflective energy, transmitted energy, dissipative energy, and energy dissipation rate of hard coal specimens at different impact velocities are calculated. The results are summarized in Table 4.
Table 3 shows that both incident energy and reflected energy levels increase with the acceleration of bullet impact velocity. According to the propagation law of stress wave, a stress wave will be reflected through the contact surface of two materials. There is a great difference in wave impedance between rod and coal specimens, and while most of the energy will be lost in the form of reflected waves, part of the energy will pass through the specimen to the transmission rod. The rest of the energy is absorbed, which is manifested in the macroscopic form of the extension and expansion of cracks and the fracture and breakage of the specimen. The dissipated energy also increases with the acceleration of bullet impact velocity. This is because the increase in external impact load increases the crack propagation length under the load. In this process, the energy absorption effect increases, and the dissipated energy is increased accordingly. According to the calculation results in Table 3, the variation curves of incident energy, reflective energy, and transmitted energy under impact loads are obtained. In Figure 10, both incident energy and reflected energy increase linearly, but the increase in the reflected energy is smaller than that of the incident energy. The transmitted energy is relatively small, and the overall trend increases first and then decreases. This is because when bullet impact velocity is small, the energy that is carried by the incident wave will cause the cracks and defects in the hard coal specimen to expand and penetrate until the specimen is broken. The loaded energy also increases with the increase in the bullet impact velocity. Under high-energy impact, the crack and defect extension time in the hard coal specimen is extremely short, and the specimen is instantaneously penetrated, so the transmitted energy is reduced compared with the previous section.
Figure 11 and Figure 12 show the relationship between dissipative energy and the energy dissipation rate with bullet impact velocity. In Figure 11, the dissipative energy of the fracture of specimen increases linearly. The increase in bullet impact velocity increases the energy absorption effect of the coal specimen, as well as the energy consumption of the crack development of the specimen. Additionally, the energy consumption of the fracture of the specimen increases.
When the bullet’s impact velocity increases, the incident energy and dissipated energy both increase. Therefore, the energy dissipation rate N can be used to represent the strength of energy dissipation of a hard coal specimen under impact load. Figure 12 shows variation in the energy dissipation rate with the bullet impact velocity. The increase in the impact velocity has little effect on the energy dissipation rate, which does not change significantly, but does present a certain volatility. The reason for this is that the internal structure of the hard coal specimen is not uniform, and the dispersion of the specimens is also large, resulting in a large difference in energy transmission. During the process of coal rock crushing, the dissipative energy causing macroscopic fractures in coal rock only accounts for 10 to 20% of the incident energy; the majority of the energy is used for damping loss and damage loss.

4. Conclusions

An impact compression test of hard coal specimens under different impact loading speeds was carried out using the SHPB test system, and the energy characteristics and particle size distribution of hard coal specimens were analyzed.
(1) Due to the different original states of hard coal specimens, the damage to specimens under static load occurs in three different damage modes: conjugate surface shear damage, monoclinic shear damage, and tensile damage. The specimen breaks under impact loading, and the greater the impact velocity, the higher the degree of specimen breakage and fragmentation.
(2) Weibull distribution can characterize the impact crushing particle size distribution of coal rock specimens, and the coal rock crushing degree parameter has a power function relationship with the impact velocity. By referring to the coal rock crushing degree parameter and crushing characteristic index, the coal rock impact crushing velocity can be selected to ensure the crushing particle size and improve the economic value of coal.
(3) With the increase in the impact velocity, the incident energy and reflected energy grow linearly, and there is a significant linear correlation between the dissipated energy of specimen crushing and impact velocity. Due to the existence of structural variability of hard coal itself, there is no significant pattern in the energy dissipation rate of specimen and impact velocity, with some variability.

Author Contributions

Conceptualization, H.W.; methodology, W.X.; validation, H.W., W.X. and Q.Z.; formal analysis, W.X.; investigation, H.W., W.X. and B.C.; resources, Q.Z.; data curation, W.X.; writing—original draft preparation, H.W. All authors have read and agreed to the published version of the manuscript.

Funding

This work was supported by the Open Foundation of Engineering Research Center of Underground Mine Construction, Ministry of Education of China (no. JYBGCZX2022104).

Institutional Review Board Statement

Not applicable.

Informed Consent Statement

Not applicable.

Data Availability Statement

The data used to support the findings of this study are included within the article.

Conflicts of Interest

The authors declare no conflict of interest.

References

  1. Ranjith, P.G.; Zhao, J.; Ju, M.H.; De Silva, R.V.S.; Rathnaweera, T.D.; Bandara, A.K.M.S. Opportunities and challenges in deep mining: A brief review. Engineering 2017, 3, 546–551. [Google Scholar] [CrossRef]
  2. Liu, H.B.; Cheng, Y.P. The elimination of coal and gas outburst disasters by long distance lower protective seam mining combined with stress-relief gas extraction in the Huaibei coal mine area. J. Nat. Gas Sci. Eng. 2015, 27, 346–353. [Google Scholar] [CrossRef]
  3. Christopher, M.; Michael, G. Evaluating the risk of coal bursts in underground coal mines. Int. J. Min. Sci. Technol. 2016, 26, 47–52. [Google Scholar]
  4. Tang, Z.Q.; Yang, S.Q.; Zhai, C.; Xu, Q. Coal pores and fracture development during CBM drainage: Their promoting effects on the propensity for coal and gas outbursts. J. Nat. Gas Sci. Eng. 2018, 51, 9–17. [Google Scholar] [CrossRef]
  5. Nie, F.X.; Wang, H.L.; Qiu, L.M. Research on the Disaster-Inducing Mechanism of Coal-Gas Outburst. Adv. Civ. Eng. 2020, 2020, 1052618. [Google Scholar] [CrossRef] [Green Version]
  6. Chen, S.J.; Wang, H.L.; Wang, H.Y.; Guo, W.J.; Li, X.S. Strip Coal Pillar Design Based on Estimated Surface Subsidence in Eastern China. Rock Mech. Rock Eng. 2016, 49, 3829–3838. [Google Scholar]
  7. Guo, W.J.; Wang, H.L.; Chen, S.J. Coal pillar safety and surface deformation characteristics of wide strip pillar mining in deep mine. Arab. J. Geosci. 2016, 9, 137. [Google Scholar] [CrossRef]
  8. Qiao, W.; Li, W.P.; Zhang, X. Characteristic of water chemistry and hydrodynamics of deep karst and its influence on deep coal mining. Arab. J. Geosci. 2014, 7, 1261–1275. [Google Scholar] [CrossRef]
  9. Khosravani, M.R. Inverse characterization of UHPC material based on Hopkinson bar test. Appl. Eng. Sci. 2021, 6, 100043. [Google Scholar] [CrossRef]
  10. Yang, R.S.; Li, W.J.; Yue, Z.W. Comparative Study on Dynamic Mechanical Properties and Energy Dissipation of Rocks under Impact Loads. Shock Vib. 2020, 2020, 8865099. [Google Scholar] [CrossRef]
  11. Xia, Z.B.; Zhang, K.F.; Deng, Y.F.; Ge, F.W. Comparative study on dynamic mechanical performance of concrete and rock. Frat. Integrità Strutt. 2015, 9, 574–579. [Google Scholar]
  12. Han, Z.Y.; Li, D.Y.; Li, X.B. Dynamic mechanical properties and wave propagation of composite rock-mortar specimens based on SHPB tests. Int. J. Min. Sci. Technol. 2022, 32, 793–806. [Google Scholar] [CrossRef]
  13. Zhai, Y.; Gao, H.; Wang, T.N. Research on the Dynamic Response and Failure Characteristics of Concrete-Granite Specimens with Varied Interface Roughness. J. Mater. Civ. Eng. 2023, 35, 04022407. [Google Scholar] [CrossRef]
  14. Li, X.F.; Li, H.B.; Liu, K.; Zhang, Q.B.; Zou, F.; Huang, L.X.; Zhao, J. Study of dynamic mechanical properties and fracture characteristics of rocks under impact loading. Chin. J. Rock Mech. Eng. 2017, 36, 2393–2405. [Google Scholar]
  15. Kolsky, H. An investigation of the mechanical properties of materials at very high rates of loading. Proc. Phys. Soc. Sect. B 1949, 62, 676–700. [Google Scholar] [CrossRef]
  16. Xia, K.W.; Yao, W. Dynamic rock tests using split Hopkinson (Kolsky) bar system a review. J. Rock Mech. Geotech. Eng. 2015, 7, 27–59. [Google Scholar] [CrossRef] [Green Version]
  17. Fakhimia, A.; Azhdaria, P.; Kimberley, J. Physical and numerical evaluation of rock strength in split Hopkinson pressure bar testing. Comput. Geotech. 2018, 102, 1–11. [Google Scholar] [CrossRef]
  18. Mishra, S.; Chakraborty, T.; Matsagar, V. Dynamic characterization of himalayan quartzite using SHPB. Procedia Eng. 2017, 191, 2–9. [Google Scholar] [CrossRef]
  19. Wang, Y.F.; Cui, F. Energy evolution mechanism in process of Sandstone failure and energy strength criterion. J. Appl. Geophys. 2018, 154, 21–28. [Google Scholar] [CrossRef]
  20. Yang, D.; Chen, M.; Yan, J.; Zou, D.W. Theoretical analysis and experimental research on the energy dissipation of rock crushing based on fractal theory. J. Nat. Gas Sci. Eng. 2016, 33, 231–239. [Google Scholar]
  21. Zwiessler, R.; Kenkmann, T.; Poelchau, M.H.; Nau, S.; Hess, S. On the use of a split Hopkinson pressure bar in structural geology: High strain rate deformation of Seeberger sandstone and Carrara marble under uniaxial compression. J. Struct. Geol. 2017, 97, 225–236. [Google Scholar] [CrossRef]
  22. Zhao, J.Y.; Liu, X.; Hu, Z.H.; Wang, X.S.; Xu, Z.Y. Fractal and energy dissipation characteristics of rock impact fragmentation. Nonferrous Met. Eng. 2022, 12, 100–108. [Google Scholar]
  23. Ma, Q.F.; Liu, Z.H.; Qin, Y.P.; Tian, J.; Wang, S.L. Plastic damage constitutive model of rock based on energy dissipation theory. Rock Soil Mech. 2021, 42, 1210–1220. [Google Scholar]
  24. Zhang, D.M.; Bai, X.; Yin, G.Z.; Li, S.J.; He, Q.B. Acoustic emission parameters and energy dissipation law of layered rock with uniaxial damage. J. China Coal Soc. 2018, 43, 646–656. [Google Scholar]
  25. Zhang, C.X.; Dai, B.; Wu, Q.H. Deformation characteristics and energy dissipation analysis of rock during unloading failure under different stress paths. J. Saf. Sci. Technol. 2014, 10, 35–40. [Google Scholar]
  26. Chen, X.G.; Zhang, G.Q. Study on energy dissipation and release in shear failure process of rock. J. Min. Saf. Eng. 2010, 27, 179–184. [Google Scholar]
  27. Ji, J.J.; Li, H.T.; Wu, F.M.; Yao, Q. Fractal characteristics of rock breakage under impact load. J. Vib. Shock 2020, 39, 176–183+214. [Google Scholar]
  28. Wu, R.J.; Li, H.B.; Li, X.F.; Yu, C.; Xia, X.; Liu, L.W. Crushing energy consumption and lumpiness characteristics of underlying rock under impact load. J. China Coal Soc. 2020, 45, 1053–1060. [Google Scholar]
  29. Wang, H.F.; Zhao, F.J.; Li, Y.; Zhang, S.P.; Liu, Y.H. Crack propagation and acoustic emission characteristics of statically invaded rock. J. Hunan Univ. Sci. Technol. (Nat. Sci. Ed.) 2019, 34, 18–24. [Google Scholar]
  30. Gao, F.; Gan, D.Q.; Guo, J.; Gan, Z. Research progress on energy characteristics of rock impact crushing. Eng. Blasting 2022, 28, 14–24. [Google Scholar]
  31. Tang, Z.Q.; Li, H.; Shi, X.C.; Li, Z.; Peng, Y.; Bao, H. Fracture characteristics of rock under uniaxial impact loading. Chin. J. Appl. Mech. 2019, 36, 1076–1081+1258. [Google Scholar]
  32. Yang, Y.; Li, X.L.; Yang, R.S.; Wang, J.G. Fractal characteristics and fracture morphology of low temperature rock impact fracture. Trans. Beijing Inst. Technol. 2020, 40, 632–639+682. [Google Scholar]
  33. Zhao, F.J.; Li, Y.; Chen, K.; Zhang, B. Experimental study on acoustic emission and electromagnetic radiation characteristics of rock breakage. Chin. J. Undergr. Space Eng. 2019, 15, 345–351+364. [Google Scholar]
  34. Deng, Y.; Chen, M.; Jin, Y.; Zhou, D.W. Study on dynamic characteristics and energy consumption characteristics of rock breakage under impact. Pet. Drill. Tech. 2016, 44, 27–32. [Google Scholar]
  35. Wan, G.X.; Wang, Q.S.; Li, X.B. Acoustic emission energy characteristics of rock under stress waves. J. Exp. Mech. 2012, 27, 727–733. [Google Scholar]
  36. Cao, J.; Shen, Z.K.; Hu, Y.L.; Fan, C.Z.; Wang, D.X.; Deng, L.Y.; Yang, H. Theoretical analysis and fuzzy prediction model of specific work of rock breakage under impact. Rock Soil Mech. 2012, 33, 145–149. [Google Scholar]
  37. Song, C.S.; Wang, W.; Liu, K.; Yuan, R.P.; Zhang, S.W.; Li, D.Y.; Li, H.M.; Kang, Y.C. Energy dissipation characteristics of saturated coal specimens under true triaxial dynamic and static loading. J. China Coal Soc. 2022, 47, 2011–2026. [Google Scholar]
  38. Wang, L.; Yuan, Q.P.; Xie, G.X.; Gu, S.H.; Jiao, Z.H.; Liu, H.Q.; Chen, L.P. Length-diameter ratio effect of coal specimen energy dissipation and broken fractals under impact load. J. China Coal Soc. 2022, 47, 1534–1546. [Google Scholar]
  39. Wang, N.; Li, S.G.; Wang, S.B.; Zhang, T.J.; Guo, Y. Study on fractal characteristics and energy dissipation law of coal crushing process. Saf. Coal Mines 2022, 47, 1534–1546. [Google Scholar]
  40. Gong, S.; Zhao, Y.X. Experimental study on the influence of bedding on dynamic fracture and energy dissipation of coal rock. Chin. J. Rock Mech. Eng. 2017, 36, 3723–3731. [Google Scholar]
  41. Zhang, M.B.; Lei, K.J.; Lin, M.Q.; Zhao, Y.; Wang, L.K. The energy evolution mechanism of damage deformation of coal rock containing gas under axial pressure unloading confining pressure. J. Saf. Sci. Technol. 2018, 14, 45–50. [Google Scholar]
  42. Lu, X.G.; Ji, H.G.; Yu, X.M.; Jiang, H.; Gao, Y.; Wu, H.Y. Mechanical properties and energy dissipation evolution of coal under triaxial unloading conditions. J. Harbin Inst. Technol. 2022, 54, 90–98. [Google Scholar]
  43. Jiang, H.X.; Du, C.L.; Liu, S.Y. The effects of impact velocity on energy and size distribution of rock crushing. J. China Coal Soc. 2013, 38, 604–609. [Google Scholar]
  44. Zheng, K.H.; Du, C.L.; Qiu, B.J. Experimental study on the fractal characteristics of crushing coal and gangue. J. China Coal Soc. 2013, 38, 1089–1094. [Google Scholar]
  45. Liu, X.H.; Dai, F.; Zhang, R.; Liu, J.F. Static and dynamic uniaxial compression tests on coal rock considering the bedding directivity. Environ. Earth Sci. 2015, 73, 5933–5949. [Google Scholar] [CrossRef]
  46. Zhang, W.Q.; Shi, B.M.; Mu, C.M. Experimental research on failure and energy dissipation law of coal under impact load. J. Min. Saf. Eng. 2016, 33, 375–380. [Google Scholar]
  47. Feng, J.J.; Wang, E.Y.; Chen, X.; Ding, H.C. Energy dissipation rate: An indicator of coal deformation and failure under static and dynamic compressive loads. Int. J. Min. Sci. Technol. 2018, 28, 397–406. [Google Scholar] [CrossRef]
  48. Wang, J.C.; Wang, Z.H.; Kong, D.Z. Failure and prevention mechanism of coal wall in hard coal seam. J. China Coal Soc. 2015, 40, 2243–2250. [Google Scholar]
  49. Shang, B.; Hu, S.S.; Jiang, X.Q. Three-wave calibration method for SHPB experimental data processing of metallic materials. Explos. Shock Waves 2010, 30, 429–432. [Google Scholar]
  50. Song, L.; Hu, S.S. Two-wave and three-wave methods in SHPB data processing. Explos. Shock Waves 2005, 25, 368–373. [Google Scholar]
  51. Wang, S.L. Stress Wave Basis; National Defense Industry Press: Beijing, China, 2005. [Google Scholar]
  52. Gong, F.Q.; Ye, H.; Luo, Y. The effect of high loading rate on the behaviour and mechanical properties of coal-rock combined body. Shock Vib. 2018, 2018, 4374530. [Google Scholar] [CrossRef] [Green Version]
  53. Rosin, P.; Rammler, E. The laws governing the fineness of powdered coal. J. Inst. Fuel 1933, 7, 29–36. [Google Scholar]
  54. Weibull, W. Statistical theory of the strength of materials. Stockh. Gen. Litogr. Anst. Forl. 1939, 151. [Google Scholar]
  55. Wang, D.K.; Liu, S.M.; Wei, J.P.; Yao, B.H.; Peng, M. The failure characteristics of coal under impact load in laboratory. J. Min. Saf. Eng. 2017, 34, 594–600. [Google Scholar]
Figure 1. Specimens for static compression test.
Applsci 13 03298 g001
Figure 2. The schematic diagram of SHPB.
Applsci 13 03298 g002
Figure 3. Stress balance curve.
Applsci 13 03298 g003
Figure 4. Partial coal specimen compressive strength test failure mode. (a) 1-1# test piece. (b) 1-4# test piece. (c) 1-9# test piece.
Applsci 13 03298 g004aApplsci 13 03298 g004b
Figure 5. Stress-strain curves of typical hard coal specimens.
Applsci 13 03298 g005
Figure 6. Failure morphology of coal specimens under differential dynamic impact velocities before sieving. (a) v = 2.675 m·s−1. (b) v = 3.275 m·s−1. (c) v = 4.024 m·s−1. (d) v = 5.011 m·s−1.
Applsci 13 03298 g006
Figure 7. Failure morphology of coal specimens under differential dynamic impact velocities after sieving. (a) v = 2.675 m·s−1. (b) v = 3.275 m·s−1. (c) v = 4.024 m·s−1. (d) v = 5.011 m·s−1.
Applsci 13 03298 g007aApplsci 13 03298 g007b
Figure 8. Hard coal crushing particle size distribution curve.
Applsci 13 03298 g008
Figure 9. Relationship of CDI and impact velocity.
Applsci 13 03298 g009
Figure 10. The relationship of incident, reflective, and transmitted energy with impact velocity.
Applsci 13 03298 g010
Figure 11. Variation of dissipated energy with bullet impact velocity.
Applsci 13 03298 g011
Figure 12. Variation of energy dissipation rate with bullet impact velocity.
Applsci 13 03298 g012
Table 1. Test results of hard coal specimens.
Specimen No.Diameter
/mm
Height
/mm
Quality
/g
Height-Diameter RatioDensity
/(g/cm3)
Compressive Strength/MPaModulus of Elasticity/GPaPoisson’s Ratio
1-1#49.90102.14310.62.051.56 35.5893.0580.088
1-2#49.89101.44287.92.031.45 33.3532.6660.316
1-3#49.9699.68295.22.001.51 31.0662.8270.249
1-4#49.6799.61301.02.011.56 25.3913.550.417
1-5#49.99100.34309.12.011.57 28.3383.3160.489
1-6#49.64102.81250.72.071.26 13.1141.9690.378
1-7#50.01100.04279.22.001.42 25.9232.3650.553
1-8#50.2598.92243.01.971.24 20.7952.3440.357
1-9#49.97102.21262.82.051.31 16.7152.2570.505
Average value49.95 100.31 289.43 2.01 1.47328.636 2.875 0.353
Note: Specimens 6# and 9# had obvious primary cracks, resulting in their uniaxial compressive strength being much lower than that of other specimens. This was not taken into account when calculating the average value.
Table 2. Impact test results of hard coal specimens.
Specimen No.Impact Pressure
/MPa
Impact Velocity
/(m·s−1)
Maximum Strain Rate
/s−1
Peak Stress
/MPa
Peak Strain
/10−3
Destruction
10.152.67590.09025.99914.718broken
20.153.27597.43430.15217.588broken
30.23.57467.46540.13521.165broken
40.24.02499.87943.74322.558broken
50.34.80493.16833.42529.227broken
60.34.81983.04619.86421.187broken
70.35.01194.704 37.26826.966broken
Table 3. The analysis results of coal rock fragmentation.
Specimen No.Impact Velocity
/(m·s−1)
Coal Particles Sieve AnalysisCurve FittingCCI
m0
CDI
d0
Correlation Coefficient
R2
dk
/mm
Less than the Mass of the Grade
/g
Cumulative Probability
V/%
lndklnln [1/(1 − V)]
12.6754.758.59215.3351.558−1.7931.18122.2730.997
2.363.5676.3660.859−2.721
0.60.8391.497−0.511−4.194
0.30.3310.591−1.204−5.129
23.2754.7510.22318.1051.558−1.6071.45714.3010.999
2.363.8756.8490.859−2.64
0.60.581.064−0.511−4.57
0.30.1950.379−1.204−5.663
33.5744.7517.82131.0261.558−0.9671.36510.2050.996
2.366.39911.1410.859−2.116
0.61.2112.108−0.511−3.829
0.30.4550.618−1.204−4.815
44.0244.7520.28135.1131.558−0.8381.2879.7530.995
2.367.65513.2530.859−1.951
0.61.6042.777−0.511−3.57
0.30.6611.144−1.204−4.465
54.8044.7523.1238.1281.558−0.8191.3238.8330.999
2.3610.17316.8970.859−1.768
0.61.9313.105−0.511−3.499
0.30.7081.16−1.204−4.511
64.8194.7524.71439.7991.558−0.591.3467.4120.999
2.3610.95317.5120.859−1.566
0.62.0133.324−0.511−3.345
0.30.7521.218−1.204−4.341
75.0114.7528.48848.9421.558−0.3971.2806.3430.996
2.3614.31424.5940.859−1.265
0.63.0765.283−0.511−2.914
0.31.0711.838−1.204−3.986
Table 4. Energy calculation results of coal rocks under dynamic impact.
Specimen No.Impact Velocity
/(m·s−1)
Incident Energy
/J
Reflective Energy
/J
Transmitted Energy
/J
Dissipative Energy
/J
Energy Dissipation Rate
12.675177.26135.2913.0128.960.163
23.275257.16194.1723.8839.110.152
33.574326.88236.6826.2163.990.196
44.024405.53302.5329.2173.790.182
54.804523.21419.6223.1280.470.154
64.819558.42452.6122.5183.30.149
75.011610.69492.1321.7696.80.159
Disclaimer/Publisher’s Note: The statements, opinions and data contained in all publications are solely those of the individual author(s) and contributor(s) and not of MDPI and/or the editor(s). MDPI and/or the editor(s) disclaim responsibility for any injury to people or property resulting from any ideas, methods, instructions or products referred to in the content.

