Featured Application
A portable neutron-monitoring system can be effectively applied to verification of the models used for estimating cosmic radiation intensities over a wide range of altitudes in a harsh environment such as in Antarctica.
Abstract
Many ongoing studies for predicting the production rates of cosmogenic nuclides, forecasting changes of atmospheric compositions and climate, assessing the cosmic-radiation exposure of aircraft crew, and the effects on precise electronic devices use numerical models that estimate cosmic-radiation intensities in the atmosphere. Periodic verifications of those models are desirable to be performed for assuring the reliability of the study outcomes. Here, we investigated an application of a portable neutron-monitoring system composed of an extended-energy-range neutron monitor and a small data logger for monitoring of cosmic-neutron intensities in a polar region. As a result of measurements in the east Antarctica region covering a wide range of altitudes (from 30 m to 3762 m) and comparisons with the model calculations performed with an analytical model based on comprehensive Monte Carlo simulations (PARMA), it was demonstrated that the portable neutron-monitoring system could be effectively applied for periodic verification of cosmic-neutron intensities that would improve the reliability of related studies.
1. Introduction
Primary cosmic radiations or cosmic rays are composed of highly energetic particles, mainly protons. Those particles can be classified by origin to two main components: galactic cosmic rays (GCRs) that come from outside our solar system and solar energetic particles (SEPs) that originate from an eruptive process on the sun. The high-energy cosmic-ray particles that enter the Earth’s atmosphere cause nuclear spallation reactions with atmospheric atoms, mainly oxygen or nitrogen atoms, in the stratosphere and the upper troposphere. The electromagnetic cascades produce various secondary radiations such as electrons, pions, neutrons, etc.
These nuclear reactions also produce many cosmogenic nuclides such as 3H, 7Be, 10Be, 14C, and 36Cl that fall out onto the ground with almost constant rates. Those nuclides provide useful information related to geoscience, and much research has actively been performed in the relevant field [1,2,3,4,5]. Particularly, cosmogenic nuclides in snow and ice in polar regions at high geomagnetic latitudes can tell us about the long history of solar activities, including extreme solar particle events that affect cosmic radiation intensities and resultant cosmogenic production rates [6,7,8]. Production rates of cosmogenic nuclides in the earth’s atmosphere have been estimated by model calculations, and many models have been developed for this purpose over the past 70 years. The first models [9,10,11] were based on simplified functions expressing the cosmic-ray-induced cascade process. Since the 1980s, Monte Carlo simulation codes were developed to describe the stochastic process of the spallation reactions in more detail [12,13,14,15,16,17]. In addition, an analytical model based on comprehensive Monte Carlo simulations has been lately developed [18,19].
Cosmic radiation can change the physical–chemical properties of the atmosphere, such as ion balance and temperature, and may subsequently affect regional climate variability [20,21,22,23]. It has been considered that ionizations induced by cosmic radiation in the atmosphere contribute to the production of many ions that are followed by various reaction processes that may cause different climate parameters. More accurate prediction of long-term climate change needs a more reliable model that can precisely describe the atmospheric ionization processes in the atmosphere, especially in the polar regions.
Aside from the effects on the atmospheric compositions, direct exposure of humans to cosmic radiation at high altitude has become a subject in view of health [24]. According to the fact that the dose level of the cosmic radiation is elevated with altitude and reaches a level about 100 times higher at the cruising altitude of a commercial jet aircraft than that on the ground, the International Commission on Radiological Protection (ICRP) has recommended that exposure to cosmic radiation of aircraft crew should be managed as an occupational exposure [25,26]. ICRP recommended in a recent publication [27] that frequent flyers also be informed of their dose levels in aviation. Following these recommendations, the individual doses received from cosmic radiation onboard aircraft have been assessed by using numerical models. Several easy-to-use program tools for aviation-dose calculations were developed based on those models and have been provided by different groups. Those are CARI [28], PCAIRE [29], SIEVERT [30], AVIDOS [31], EPCARD [32], JISCARD EX [33], and other models [34]. Periodic verification of the accuracies of those programs including intercomparisons [35,36] is crucially important for reliable dose assessments of aircraft crew and frequent flyers.
Furthermore, there are concerns about possible errors by many avionic electronic systems during a flight due to the hits by cosmic radiation, particularly high-energy neutrons [37,38]. A secondary high-energy neutron collides with an atom of the semiconductor, which produces an ionization charge that can cause an unfavorable reaction of a semiconductor device. To prepare adequately for such errors, a reliable, well-verified model that can predict the probabilities of the hits is needed.
Regarding observations of cosmic radiation intensities related to the fields above, ground-based neutron monitors have played an important role for up to 70 years. The ground-based neutron monitors detect secondary particles produced in the atmosphere as a product of spallation reactions caused by primary cosmic-ray particles. While two types of standardized detectors (IGY and NM64) are generally operated, both types consist of gas-filled proportional counters surrounded by a moderator, lead producer, and reflector [39]. The incident cosmic protons and neutrons cause nuclear reactions in the lead, and the secondary neutrons slow down by the moderator, and thermal-energy neutrons are detected by the proportional counter tubes. Many stations of the ground-based neutron monitors were built worldwide since the 1950s and have been operated for space sciences and space weather applications [40]. The monitoring data acquired at these stations are publicly available in some repositories and data sources to observe the cosmic-ray variations and incident energetic solar particles, and also to estimate the global-scale change of cut-off rigidity, i.e., the minimum magnetic rigidity that a vertically incident particle can have and still reach a given location above the Earth [18].
While the ground-based neutron monitors have provided accurate and stable data, these large-scale instruments can hardly be carried and thus have been employed for fixed-point observations. It should be noted that, in addition to the solar activities and global geomagnetic field condition, local meteorological factors as well as the atmospheric pressure, such as clouds and snowfall, could affect the cosmic-radiation intensities at a specific site. Moreover, a notable change in the Earth’s geomagnetic field originating from the core has lately been observed [41,42]. According to the awareness on the spatial variation of cosmic-radiation intensity, we have investigated the application of a portable neutron-monitoring system composed of an extended-energy-range neutron monitor and a small data logger for model verifications, with the on-site measurements covering a wide area of interest. The designed monitoring system is preferably to be tested in a polar region where the cosmic-radiation intensities are the highest on the Earth.
2. Materials and Methods
2.1. Locations of Measurements
Measurements of cosmic neutrons were performed from a coastal to a plateau region in East Antarctica where the Japanese crew usually conducts their activities. A snow vehicle with the instruments for neutron measurement left Syowa Station (69.0° S, 39.6° E) in the coastal area in November 2018, moved to Dome Fuji Station (77.5°S, 37.5° E) at 3765 m in altitude in the inland area, and then back to the Syowa Station in January 2019. This period was in the solar minimum. The neutron measurements along the inward (coast to inland) route were performed at 16 locations from 17 November 2018 to 7 December 2018, and those along the outward route were performed at 17 locations from 31 December 2018 to 19 January 2019. The time for monitoring at each location ranged from 7.2 h to 88 h. The locations of these measurements are shown with circle points in Figure 1.
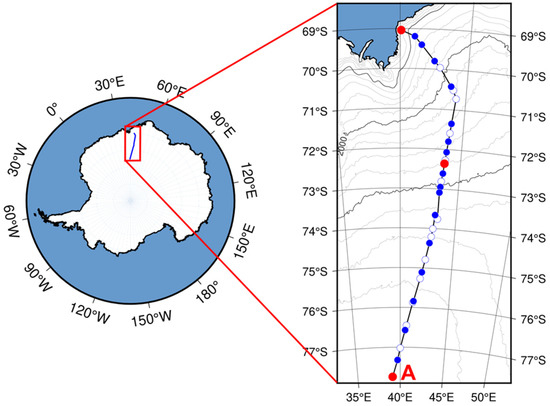
Figure 1.
Locations in the Antarctica Continent where the measurements of cosmic neutrons were performed with a portable neutron monitor (WENDI-II) from November 2018 to January 2019. The points on the inward route are indicated with blue, those on the outward with white. The time for monitoring at each location was more than 7 h. Long-term stays were made at three points shown in red; among them, a continuous neutron monitoring for about 20 days was performed at the end of the inward route near Dome Fuji Station (location A).
In addition to the repetitive measurements along the inward and outward routes, long-term monitoring for about 20 days was performed at the end point of the route (location A in Figure 1); the measured data were recorded with 12 h intervals at these fixed-point measurements.
2.2. Methods of Measurements
For cosmic-neutron measurements, we employed an extended energy-range rem meter coupled with a tungsten-powder-mixed moderator (FHT762 Wendi-2, Thermo Fisher Scientific K.K., Franklin, MA, USA). WENDI-II has functions of continuously counting the pulses generated from the 3He(n, α)Li reaction with moderated thermal neutrons and calculating the hourly rate of 1 cm ambient dose equivalent, H*(10), multiplying the one-hour integrated pulse counts and a constant conversion coefficient. Selected properties of WENDI-II are indicated in Table 1. More details on the dosimetric properties of WENDI-II were presented by Olsher et al. [43,44].

Table 1.
Selected properties of the portable neutron monitor WENDI-II.
WENDI-II has been employed by the authors for measurements of cosmic neutrons on high mountains and onboard aircraft [45,46,47,48,49] and was carefully calibrated with the monitoring data acquired through the repeated neutron measurements at the high-altitude station at Mt. Fuji (altitude: 3776 m) in Japan [46,48]. It was confirmed that WENDI-II had negligibly low sensitivity to photons from 60Co and 137Cs sources and thus its threshold for n/γ discrimination was set as a default value. In addition, its negligible response to energetic protons (~230 MeV) was roughly confirmed at the Heavy Ion Medical Accelerator in Chiba (HIMAC) in Japan.
WENDI-II was connected to a small, battery-powered data logger (NM10) with dimensions of W21 cm × H6.6 cm × D16 cm and weight of 2.4 kg. NM10 was originally made by the authors for long-term mobile use in recording the pulse counts from WENDI-II with adjustable time intervals [45,49]. A set of WENDI-II and NM10 was placed on the desk near a front window of the snow vehicle (Figure 2) over the whole monitoring period. The signals of neutron-induced pulses from WENDI-II were automatically recorded by NM10 with 1 h intervals and converted to the hourly H*(10) rates. The temperature at the location where the neutron-monitoring system was placed varied from −10 °C to 20 °C during the measurement period (i.e., November 2018 to January 2019); this variation was within the temperature-applicable range of WENDI-II (−30 °C to 50 °C) indicated in Table 1.
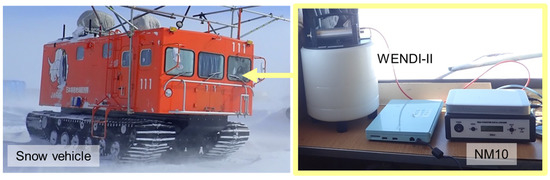
Figure 2.
A photograph of the snow vehicle (left) and the portable neutron monitor (WENDI-II) connected to an exclusive data logger (NM10) (right) originally made for mobile use. The neutron monitor was placed near the front window inside the snow vehicle.
2.3. Model Calculation
For discussion about the effectiveness of the portable neutron-monitoring system in comparison with model estimates, we employed a recent model named “PHITS-based Analytical Radiation Model in the Atmosphere (PARMA)” [18,19], which was originally developed in Japan and has been incorporated into the program (JISCARD EX) for calculating the crew doses of selected Japanese airlines [33]. Those companies have responsibility for calculations of individual doses of aircraft crew from cosmic radiation to keep their annual doses below 5 mSv y−1 by voluntary efforts; they are also requested to prepare for an additional dose increase due to a solar flare by utilizing possible prediction measures such as space weather forecasts.
The PARMA comprises several theoretical or empirical functions with parameters whose numerical values were fitted through the least square method to the results of the comprehensive Monte Carlo air-shower simulations performed by using the Particle and Heavy Ion Transport code System (PHITS) [50] coupled with the Japanese Evaluated Nuclear Data Library/High Energy file (JENDL/HE), which contains differential cross-sections of neutrons and protons over a wide range of energy up to 3 GeV [51]. In the air-shower simulation, cosmic rays were assumed to be incident from the top of the Earth’s atmosphere, i.e., from the altitude of 86 km. Though the atmospheric atoms slightly exist over 86 km actually, it was judged that the effects of such a high-altitude atmosphere had little influence on the spallation reactions. As incident particles, the protons and heavy ions of galactic cosmic rays (GCRs) with energies up to 1 TeV per nucleon and charges up to 28 (nickel) were considered. The GCR fluxes at 1 astronomical unit (1 AU, around the Earth) were obtained from their local interstellar (LIS) fluxes considering the modulation due to the solar-wind magnetic field, so-called solar modulation. Effects of the solar modulation were evaluated from the count rates of several neutron monitors located all over the world, using the force-field formalism.
According to its analytical calculation procedures, PARMA can instantaneously estimate terrestrial cosmic-ray fluxes of neutrons, protons, and ions with charge up to 28 (nickel), muons, electrons, positrons, and photons anywhere in the Earth’s atmosphere; the covered energy ranges are from 0.01 eV to 100 GeV for neutrons and from 1 keV to 100 GeV for other major particles such as protons, helium ions (per nucleon), muons, electrons, positrons, and photons. While the first version of PARMA was applicable to 20 km or lower in altitude [18], the lately updated version can deal with a wider altitude of nearly the top of the atmosphere [19].
3. Results and Discussions
3.1. Time Change of Neutron Dose Rates
Figure 3 shows the time change of atmospheric pressure measured with a barometer and neutron-dose rates measured with WENDI-II near Dome Fuji Station (77.735° S, 39.114° E, 3762 m in altitude; location A in Figure 1). Each plot was obtained as an average of continuous measurements at the same location for 12 h. Total counts of neutron pulses at each location were around 7000, and thus the standard deviation of each value was derived as less than 2%. A clear, inverse correlation was observed between the neutron-dose rate and atmospheric pressure, which was considered to result from the nuclear spallation reactions with atmospheric atoms such as nitrogen and oxygen. The fact that this relationship was confirmed even for a small fluctuation (~10 hPa) of atmospheric pressure indicates that the employed portable system (WENDI-II and NM10) can be appropriately used for on-site monitoring of cosmic neutrons in Antarctica.
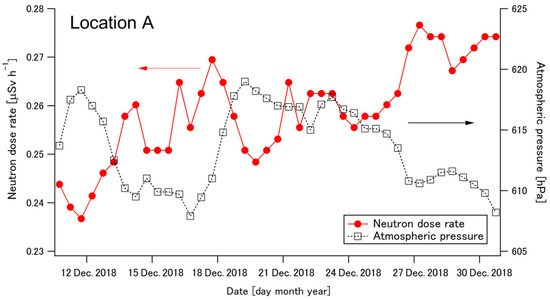
Figure 3.
Time course of the neutron dose rate measured with WENDI-II (circle marker/solid line) and atmospheric pressure (square marker/dotted line) measured with a barometer near Dome Fuji Station (location A in Figure 1) at 3762 m in altitude in December 2018. The standard deviation of each dose-rate plot was less than 2%.
3.2. Neutron Dose Rates as a Function of Atmospheric Pressure
Figure 4 shows the relationships of the measured neutron dose rates versus the barometric atmospheric pressures along the inward and outward routes between the areas near Syowa Station and near Dome Fuji Station in the period from 18 November 2018 to 23 January 2019. The counts of neutron signals obtained at each plot ranged from 1300 (for 7.2 h) to 25,000 (for 35 h), and thus the standard deviation of each point was calculated to be less than 3%.
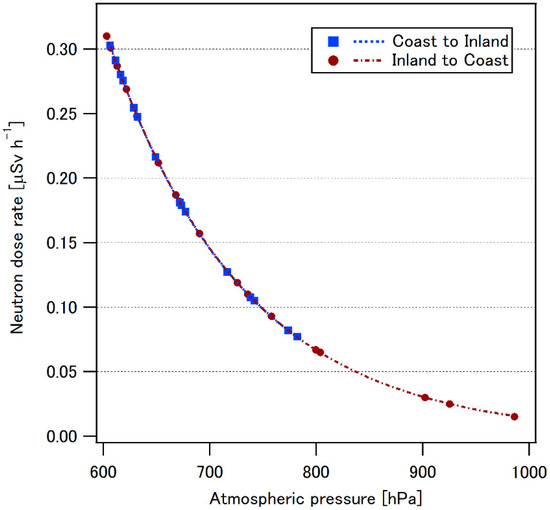
Figure 4.
Relationship of the measured neutron-dose rates and barometric atmospheric pressures along the routes between the coastal and inland areas (shown in Figure 1) in the period from November 2018 to January 2019. The standard deviation of each dose-rate plot was less than 3%.
As seen in the figure, the quite reproducible relationships were obtained between the cosmic-neutron intensities and atmospheric pressures, regardless of the measurement timings; as mentioned above, there was a time interval of about 20 days between the end of the inward route measurements and the start of the outward route ones. These results imply that the employed portable system can stably work for measuring the cosmic- neutron intensities with good accuracy even in a harsh environment such as Antarctica.
3.3. Comparison with Model Calculation
The relationships between the neutron-dose rates calculated by using the analytical model (PARMA) and those measured with the portable neutron-monitoring system are plotted in Figure 5. Overall good agreements of the calculated and measured neutron-dose rates were produced for both routes covering a wide range of altitudes. Since the model calculations did not consider the shielding effects of the structure of the snow vehicle and onboard equipment, it was assumed that the slightly smaller measured values in the range of low dose rates (i.e., at lower altitudes) were due to the attenuation of the lower-energy secondary cosmic radiation inside the vehicle.
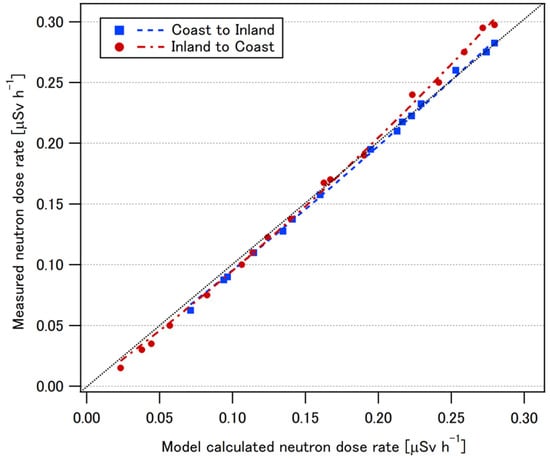
Figure 5.
Relationship between the calculated neutron-dose rates (X-axis) using PARMA [18,19] and the measured neutron-dose rates (Y-axis) along the routes shown in Figure 1 for the period from November 2018 to January 2019. The standard deviation of each plot was less than 3%.
On the other hand, some discrepancies (~10%) were seen at the high dose rates, i.e., at high-altitude areas. Since no major space weather events were reported in the respective period (i.e., from late December 2018 to January 2019) [52], this discrepancy is attributable to short-term changes of environmental factors such as atmospheric parameters (other than barometric pressure), heliospheric modulation by the solar wind, and geomagnetic cutoff rigidity at the monitoring location.
It can be pointed out that the chronological variations of meteorological conditions such as clouds and snowfall affected the energy spectra of the cosmic neutrons, and those changes altered the responses of the neutron detector as the efficiency of WENDI-II varied depending on the neutron energy [44,45]. However, this possibility is low since it is known that the shapes of cosmic-neutron-energy spectra in the atmosphere do not notably change with altitude. In a previous monitoring performed at Mt. Fuji, Japan, covering similar altitudes (40 to 3700 m) [53], the energy spectra of cosmic neutrons measured by using a Bonner multi-sphere neutron spectrometer were quite identical in their shapes, irrelevant to the altitude. This finding has been well-reflected in our model calculations. For example, the neutron-energy spectra calculated by PARMA at three locations along the routes (indicated with red points in Figure 1) are shown in Figure 6. It is seen that the shapes of neutron-energy spectra are nearly the same while the overall level of neutron flux decreases with increasing atmospheric pressure, i.e., decreasing altitude. Thus, the relative response of WENDI-II would be stable, regardless of the atmospheric pressure.
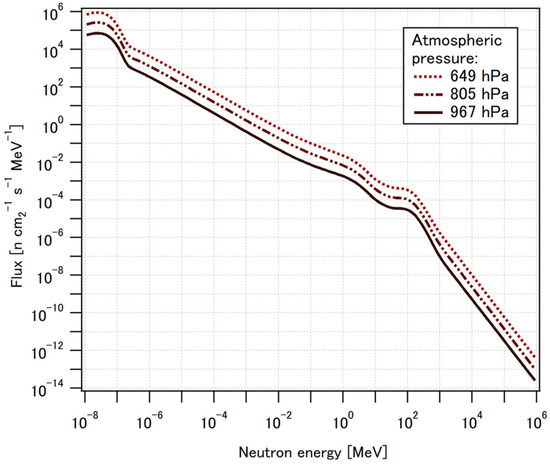
Figure 6.
The neutron-energy spectra calculated by the model PARMA [18,19] at three locations along the route (indicated with red points in Figure 1) in the period from December 2018 to January 2019.
Regarding the effect of geomagnetic-field variation surrounding the Earth, it was confirmed that the count rates of the ground-based neutron monitors (South Pole: SOPO and South Pole Bare: SOPB) placed at 90.0° S reduced by a few percent during the respective period [52]. As PARMA simply described the azimuth and zenith dependences of the cut-off rigidities assuming a dipole magnet [19], it can be assumed that, as a result of such simplification of the model structure, the observed count reductions of ground-based neutron monitors were overly reflected in evaluation of solar activities expressed as the values of heliocentric or force field potential, i.e., they caused the smaller cosmic-neutron intensities at the high-latitude and high-altitude area. This possibility should thoroughly be investigated with more comprehensive data in further research.
These findings indicate the need for further studies for improving the reliability of model calculations of cosmic-radiation intensities in the atmosphere and imply that the portable neutron-monitoring system employed in the present study would be useful for achieving this task.
4. Conclusions
In the present study, we confirmed that cosmic-neutron intensities could be measured over a wide range of altitude (from 30 m to 3762 m) in Antarctica by using a portable neutron-monitoring system composed of an extended-energy neutron detector and an originally made data logger. While the cosmic-neutron intensities measured for more than two months agreed well with those calculated with one of the most recent models overall, some discrepancy (~10%) was observed at a high-altitude area, which implies further need for improving the reliability of the model calculations of cosmic-radiation intensities in the atmosphere.
In view of technological application, it is considered that the employed portable system for neutron monitoring will be effectively applied to verifications of the models that describe the nuclear spallation reactions in the atmosphere. It is expected that the data from such on-site measurements covering a wide area at different altitudes in harsh environments will improve the soundness of many ongoing studies on various subjects, such as the production of cosmogenic nuclides, changes in atmospheric properties/climate, the cosmic-radiation exposure of aircraft crew, and the stability of precise electronic devices, that rely on models for calculating the complex nuclear reactions in the atmosphere. More investigations to explain the reasons of observed discrepancies between the measurements and the model calculations are to be conducted in future studies.
Author Contributions
Conceptualization, N.K. and H.Y.; material preparation and maintenance, K.Y. and H.Y.; transporting and measurements, N.K.; data curation, N.K.; data analysis, H.Y.; model validation, H.Y.; writing—original draft preparation, H.Y.; writing—review and editing, N.K. and K.Y.; funding acquisition, N.K. and H.Y. All authors have read and agreed to the published version of the manuscript.
Funding
This research was supported by JSPS KAKENHI Grant Number 18K19851, the joint research program of the Institute for Space–Earth Environmental Research (ISEE), Nagoya University, and the Program of the Network-type joint Usage/Research Center for Radiation Disaster Medical Science funded by the Ministry of Education, Culture, Sports, Science, and Technology (MEXT) of Japan and Hiroshima University.
Institutional Review Board Statement
Not applicable.
Informed Consent Statement
Not applicable.
Data Availability Statement
Not applicable.
Conflicts of Interest
The authors declare no conflict of interest.
References
- Asvestari, E.; Gil, A.; Kovaltsov, G.A.; Usoskin, I.G. Neutron monitors and cosmogenic isotopes as cosmic ray energy-integration detectors: Effective yield functions, effective energy, and its dependence on the local interstellar spectrum. J. Geophys. Res. Space Phys. 2017, 122, 9790–9802. [Google Scholar] [CrossRef]
- Palcsu, L.; Morgenstern, U.; Sültenfuss, J.; Koltai, G.; László, E.; Temovski, M.; Major, Z.; Nagy, J.T.; Papp, L.; Varlam, C.; et al. Modulation of cosmogenic tritium in meteoric precipitation by the 11-year cycle of solar magnetic field activity. Sci. Rep. 2018, 8, 12813. [Google Scholar] [CrossRef]
- Arce-Chamorro, C.; Sanjurjo-Sánchez, J.; Vidal-Romaní, J.R. Chronology of coastal alluvial deposits in the Ria de Coruña (NW Spain) linked to the upper pleistocene sea level regression. Appl. Sci. 2022, 12, 9982. [Google Scholar] [CrossRef]
- Narazaki, Y.; Sakoda, A.; Akata, N.; Itoh, H.; Momoshima, N. Analysis of Factors Contributing to the Increase in 7Be Activity Concentrations in the Atmosphere. Int. J. Environ. Res. Public Health 2022, 19, 10128. [Google Scholar] [CrossRef] [PubMed]
- Schaefer, J.M.; Codilean, A.T.; Willenbring, J.K.; Lu, Z.-T.; Keisling, B.; Fülöp, R.-H.; Val, P. Cosmogenic nuclide techniques. Nat. Rev. Methods Prim. 2022, 2, 18. [Google Scholar] [CrossRef]
- Fourré, E.; Landais, A.; Cauquoin, A.; Jean-Baptiste, P.; Lipenkov, V.; Petit, J.R. Tritium records to trace stratospheric moisture inputs in Antarctica. J. Geophys. Res. Atmos. 2018, 123, 3009–3018. [Google Scholar] [CrossRef]
- Spector, P.; Balco, G. Exposure-age data from across Antarctica reveal mid-Miocene establishment of polar desert climate. Geology 2021, 49, 91–95. [Google Scholar] [CrossRef]
- Horiuchi, K.; Kato, S.; Ohtani, K.; Kurita, N.; Tsutaki, S.; Nakazawa, F.; Motoyama, H.; Kawamura, K.; Tazoe, H.; Akata, N.; et al. Spatial variations of 10Be in surface snow along the inland traverse route of Japanese Antarctic Research Expeditions. Nucl. Instrum. Methods Phys. Res. Sect. B 2022, 533, 61–65. [Google Scholar] [CrossRef]
- Fireman, E.L. Measurement of the (n, H3) cross section in nitrogen and its relationship to the tritium production in the atmosphere. Phys. Rev. 1953, 91, 922–926. [Google Scholar] [CrossRef]
- Nir, A.; Kruger, S.T.; Lingenfelter, R.E.; Flamm, E.J. Natural tritium. Rev. Geophys. 1966, 4, 441–456. [Google Scholar] [CrossRef]
- O’Brien, K. Secular variations in the production of cosmogenic isotopes in the Earth’s atmosphere. J. Geophys. Res. 1979, 84, 423–431. [Google Scholar] [CrossRef]
- Masarik, J.; Beer, J. Simulation of particle fluxes and cosmogenic nuclide production in the Earth’s atmosphere. J. Geophys. Res. 1999, 104, 12099–12112. [Google Scholar] [CrossRef]
- Webber, W.R.; Higbie, P.R.; McCracken, K.G. Production of the cosmogenic isotopes 3H, 7Be, 10Be, and 36Cl in the Earth's atmosphere by solar and galactic cosmic rays. J. Geophys. Res. 2007, 112, A10106. [Google Scholar] [CrossRef]
- Masarik, J.; Beer, J. An updated simulation of particle fluxes and cosmogenic nuclide production in the Earth’s atmosphere. J. Geophys. Res. 2009, 114, D11103. [Google Scholar] [CrossRef]
- Usoskin, I.G.; Kovaltsov, G.A.; Mironova, I.A. Cosmic ray induced ionization model CRAC: CRII: An extension to the upper atmosphere. J. Geophys. Res. 2010, 115, D10302. [Google Scholar] [CrossRef]
- Poluianov, S.V.; Kovaltsov, G.A.; Mishev, A.L.; Usoskin, I.G. Production of cosmogenic isotopes 7Be, 10Be, 14C, 22Na, and 36Cl in the atmosphere: Altitudinal profiles of yield functions. J. Geophys. Res. Atmos. 2016, 121, 8125–8136. [Google Scholar] [CrossRef]
- Poluianov, S.V.; Kovaltsov, G.A.; Usoskin, I.G. A New Full 3-D Model of Cosmogenic Tritium 3H production in the atmosphere (CRAC:3H). J. Geophys. Res. Atmos. 2020, 125, e2020JD033147. [Google Scholar] [CrossRef]
- Sato, T.; Yasuda, H.; Niita, K.; Endo, A.; Sihver, L. Development of PARMA: PHITS-based Analytical Radiation Model in the Atmosphere. Radiat. Res. 2008, 170, 244–259. [Google Scholar] [CrossRef] [PubMed]
- Sato, T. Analytical Model for Estimating Terrestrial Cosmic Ray Fluxes Nearly Anytime and Anywhere in the World: Extension of PARMA/EXPACS. PLoS ONE 2015, 10, e0144679. [Google Scholar] [CrossRef]
- Velinov, P.I.Y.; Mateev, L. Analytical approach for cosmic ray proton ionization in the lower ionosphere and middle atmosphere. Comptes Rendus l’Academie Bulg. Sci. 2005, 58, 511–516. [Google Scholar]
- Calisto, M.; Usoskin, I.; Rozanov, E.; Peter, T. Influence of Galactic Cosmic Rays on atmospheric composition and dynamics. Atmos. Chem. Phys. 2011, 11, 4547–4556. [Google Scholar] [CrossRef]
- Semeniuk, K.; Fomichev, V.I.; McConnell, J.C.; Fu, C.; Melo, S.M.L.; Usoskin, I.G. Middle atmosphere response to the solar cycle in irradiance and ionizing particle precipitation. Atmos. Chem. Phys. 2011, 11, 5045–5077. [Google Scholar] [CrossRef]
- Mironova, I.A.; Aplin, K.L.; Arnold, F.; Bazilevskaya, G.A.; Harrison, R.G.; Krivolutsky, A.A.; Nicoll, K.A.; Rozanov, E.V.; Turunen, E.; Usoskin, I.G. Energetic Particle Influence on the Earth’s Atmosphere. Space Sci. Rev. 2015, 194, 1–96. [Google Scholar] [CrossRef]
- Ortiz, E.; Mendoza, B.; Gay, C.; Mendoza, V.M.; Pazos, M.; Garduño, R. Simulation and Evaluation of the Radiation Dose Deposited in Human Tissues by Atmospheric Neutrons. Appl. Sci. 2021, 11, 8338. [Google Scholar] [CrossRef]
- International Commission on Radiological Protection (ICRP). 1990 Recommendations of the International Commission on Radiological Protection; ICRP Publication 60; Ann. ICRP 21, Pergamon Press: London, UK, 1991. [Google Scholar]
- International Commission on Radiological Protection (ICRP). The 2007 Recommendations of the International Commission on Radiological Protection; ICRP Publication 103; Ann. ICRP 37, Elsevier: London, UK, 2007. [Google Scholar]
- International Commission on Radiological Protection. Radiological Protection from Cosmic Radiation in Aviation; ICRP Publication 132; Ann. ICRP 45, SAGE: London, UK, 2016. [Google Scholar]
- Copeland, K. CARI-7A: Development and validation. Radiat. Prot. Dosim. 2017, 175, 419–431. [Google Scholar] [CrossRef] [PubMed]
- Lewis, B.J.; Bennett, L.G.I.; Green, A.R.; Butler, A.; Desormeaux, M.; Kitching, F.; McCall, M.J.; Ellaschuk, B.; Pierre, M. Aircrew dosimetry using the predictive code for aircrew radiation exposure (PCAIRE). Radiat. Prot. Dosim. 2005, 116, 320–326. [Google Scholar] [CrossRef] [PubMed]
- Bottollier-Depois, J.F.; Blanchard, P.; Clairand, I.; Dessarps, P.; Fuller, N.; Lantos, P.; Saint-Lô, D.; Trompier, F. An operational approach for aircraft crew dosimetry: The SIEVERT system. Radiat. Prot. Dosim. 2007, 125, 421–424. [Google Scholar] [CrossRef] [PubMed]
- Latocha, M.; Beck, P.; Rollet, S. AVIDOS—A software package for European accredited aviation dosimetry. Radiat. Prot. Dosim. 2009, 136, 286–290. [Google Scholar] [CrossRef]
- Mares, V.; Maczka, T.; Leuthold, G.; Ruhm, W. Air crew dosimetry with a new version of EPCARD. Radiat. Prot. Dosim. 2009, 136, 262–266. [Google Scholar] [CrossRef] [PubMed]
- Yasuda, H.; Sato, T.; Yonehara, H.; Kosako, T.; Fujitaka, K.; Sasaki, Y. Management of cosmic radiation exposure for aircraft crew in Japan. Radiat. Prot. Dosim. 2011, 146, 123–125. [Google Scholar] [CrossRef]
- Makrantoni, P.; Tezari, A.; Stassinakis, A.N.; Paschalis, P.; Gerontidou, M.; Karaiskos, P.; Georgakilas, A.G.; Mavromichalaki, H.; Usoskin, I.G.; Crosby, N.; et al. Estimation of Cosmic-Ray-Induced Atmospheric Ionization and Radiation at Commercial Aviation Flight Altitudes. Appl. Sci. 2022, 12, 5297. [Google Scholar] [CrossRef]
- Mares, V.; Yasuda, H. Aviation route doses calculated with EPCARD.Net and JISCARD EX. Radiat. Meas. 2010, 45, 1553–1556. [Google Scholar] [CrossRef]
- Zhou, D.; O’Sullivan, D.; Xu, B.; Flood, E. Cosmic ray measurements at aircraft altitudes and comparison with predictions of computer codes. Adv. Space Res. 2003, 32, 47–52. [Google Scholar] [CrossRef]
- Chiang, Y.; Tan, C.M.; Chao, T.-C.; Lee, C.-C.; Tung, C.-J. Investigate the Equivalence of Neutrons and Protons in Single Event Effects Testing: A Geant4 Study. Appl. Sci. 2020, 10, 3234. [Google Scholar] [CrossRef]
- Leray, J.L. Effects of atmospheric neutrons on devices, at sea level and in avionics embedded systems. Microelectron. Reliab. 2007, 47, 1827–1835. [Google Scholar] [CrossRef]
- Bütikofer, R. Neutron Monitors–Study of Solar and Galactic Cosmic Rays; Activity Report; International Foundation HFSJG: Bern, Switzerland, 2018; pp. 50–52. [Google Scholar]
- Väisänen, P.; Usoskin, I.; Mursula, K. Seven Decades of Neutron Monitors (1951–2019): Overview and Evaluation of Data Sources. J. Geophys. Res. Space Phys. 2021, 126, e2020JA028941. [Google Scholar] [CrossRef]
- Gillet, N.; Gerick, F.; Angappan, R.; Jault, D. A Dynamical Prospective on Interannual Geomagnetic Field Changes. Surv. Geophys. 2022, 43, 71–105. [Google Scholar] [CrossRef]
- Nicolas, Q.; Buffett, B. Excitation of high-latitude MAC waves in Earth’s core. Geophys. J. Int. 2023, 233, 1961–1973. [Google Scholar] [CrossRef]
- Olsher, R.H.; Hsu, H.-H.; Beverding, A.; Kleck, J.H.; Casson, W.H.; Vasilik, D.G.; Devine, R.T. WENDI: An improved neutron rem meter. Health Phys. 2000, 79, 170–181. [Google Scholar] [CrossRef]
- Olsher, R.H.; McLean, T.D. High-energy response of the PRESCILA and WENDI-II neutron rem meters. Radiat. Prot. Dosim. 2008, 130, 510–513. [Google Scholar] [CrossRef]
- Yasuda, H.; Yajima, K.; Sato, T.; Takada, M.; Nakamura, T. Responses Of Selected Neutron Monitors To Cosmic Radiation At Aviation Altitudes. Health Phys. 2009, 96, 655–660. [Google Scholar] [CrossRef]
- Yasuda, H.; Yajima, K. Characterization of Radiation Instruments at the Summit of Mt. Fuji. Radiat. Meas. 2010, 45, 1600–1604. [Google Scholar] [CrossRef]
- Yasuda, H.; Lee, J.; Yajima, K.; Hwang, J.A.; Sakai, K. Measurement of cosmic-ray neutron dose onboard a polar route flight from New York to Seoul. Radiat. Prot. Dosim. 2011, 146, 213–216. [Google Scholar] [CrossRef]
- Yasuda, H.; Yajima, K.; Yoshida, S. Dosimetry of cosmic radiation in the troposphere based on the measurements at the summit of Mt. Fuji. Proc. Radiochem. 2011, 1, 67–70. [Google Scholar] [CrossRef]
- Yasuda, H.; Yajima, K. Verification of cosmic neutron doses in long-haul flights from Japan. Radiat. Meas. 2018, 119, 6–11. [Google Scholar] [CrossRef]
- Niita, K.; Sato, T.; Iwase, H.; Nose, H.; Nakashima, H.; Sihver, L. PHITS—A particle and heavy ion transport code system. Radiat. Meas. 2006, 41, 1080–1090. [Google Scholar] [CrossRef]
- Watanabe, Y.; Kosako, K.; Kunieda, S.; Chiba, S.; Fujimoto, R.; Harada, H.; Kawai, M.; Maekawa, F.; Murata, T.; Nakashima, H.; et al. Status of JENDL High Energy File. J. Korean Phys. Soc. 2011, 59, 1040–1045. [Google Scholar] [CrossRef]
- Neutron Monitor Database (NMDB). NMDB Event Search Tool (NEST). Available online: https://www.nmdb.eu/nest/ (accessed on 24 February 2023).
- Kowatari, M.; Nagaoka, K.; Satoh, S.; Ohta, Y.; Abukawa, J.; Tachimori, S.; Nakamura, T. Evaluation of the altitude variation of the cosmic-ray induced environmental neutrons in the Mt. Fuji area. J. Nucl. Sci. Technol. 2005, 42, 495–502. [Google Scholar] [CrossRef]
Disclaimer/Publisher’s Note: The statements, opinions and data contained in all publications are solely those of the individual author(s) and contributor(s) and not of MDPI and/or the editor(s). MDPI and/or the editor(s) disclaim responsibility for any injury to people or property resulting from any ideas, methods, instructions or products referred to in the content. |
© 2023 by the authors. Licensee MDPI, Basel, Switzerland. This article is an open access article distributed under the terms and conditions of the Creative Commons Attribution (CC BY) license (https://creativecommons.org/licenses/by/4.0/).