Article

Investigation of Rock Joint and Fracture Influence on Delayed Blasting Performance

1
School of Mining, Liaoning Technical University, Fuxin 123000, China
2
Institute of Technology and Equipment for the Development and Utilization of Mineral Resources, Liaoning Provincial College of Engineering, Liaoning Technical University, Fuxin 123000, China
3
School of Energy Engineering, Longdong University, Qingyang 745000, China
4
School of Science, Liaoning Technical University, Fuxin 123000, China
*
Authors to whom correspondence should be addressed.
Appl. Sci. 2023, 13(18), 10275; https://doi.org/10.3390/app131810275
Submission received: 3 March 2023 / Revised: 30 March 2023 / Accepted: 8 May 2023 / Published: 13 September 2023
(This article belongs to the Special Issue Advances and Challenges in Rock Mechanics and Rock Engineering)

Abstract

:
Geological structures such as joints and faults in rock mass have a significant influence on open-pit mining. Hence, it is critical to develop an understanding of dynamic joint behavior under blasting loading. This, in turn, can provide both theoretical and practical guidance to improve blasting rock fragmentation and associated bucket excavating efficiency. In this paper, delayed blasting on a highwall bench at an open-pit mine is used as an example; a nonlinear joint blasting model is also constructed. By simplifying the blasting wave propagation velocity and combining the relevant stress and displacement theories of type I and II cracks, equipotential diagrams of the stress and displacement field with the vibration velocity of the particle are obtained. Additionally, ANSYS is used to analyze the distribution of the stress field. This is able to be visualized by the degree of color change post-processing. It is concluded that, with the attenuation of the detonation wave energy, the stress exhibited a decreasing trend in this process. According to the distribution of the peak effective stress, it is found that the peak value first increases to 10–12 MPa and then shows a downward trend.

1. Introduction

Because of the rapid development of mine operations, mining technology has become a process that adapts to changes in ore body, rock conditions, and operational requirements. Currently, large-scale blasting is a challenging topic in open-pit operations. This is because of the existence of unpredictable geological structures, including joints, fissures, faults, and muddy-interbedding planes in rock mass. Hence, it is critical to improve the blasting technology to satisfy the operational environments.
As joint structures are naturally formed with high randomness, it is difficult to study a universally applicable joint structure. In the past, studies only focused on joint behavior under static loads. In this paper, a dynamic analysis of joint behavior under blasting is carried out.
The attenuation index of shock and stress waves in this study was determined by determining the degree of rock mass damage in conjunction with stress and displacement field in fracture mechanics type I and II cracks. By analyzing the change in vibration velocity of incident and transmitted particles at the joint interface, the propagation velocity of the detonation wave can be calculated. This can, in turn, simplify the analysis of the incident particle vibration velocity at the interface of joints from the detonation wave attenuation to the stress wave. After the fracture stress wave changes, the particle stress change around the fracture is deduced, and the stress state of the surrounding rock during the blasting and mining process of the fractured rock mass can be determined. This result can provide a technical basis for large-scale open-pit blasting.

2. Current Status of Blasting on Fractured Rock Mass

During open-pit blasting, rock joints are usually the primary locations prone to blasting damage, as they are the weakest points. At joint locations, a series of complex transmission and reflection waves can be generated along the transformation of blasting shock waves to stress waves. Subsequently, stress waves induce nonlinear dynamic responses in engineering bodies. Bao et al. [1] used a time domain analysis and classical joint nonlinear normal deformation constitutive model (BB model) to calculate and analyze the force along joint ends and deduced the formula of stress change under the change in stress wave. Song et al. [2] analyzed the elastic longitudinal wave propagation in nonlinear rock joints based on the time domain analysis proposed from the wavefront momentum conservation theory and displacement discontinuity method. Subsequently, the researchers found the nonlinear deformation properties of joints have a great influence on transmitted and reflected waves. Zhao [3] established a one-dimensional analysis model of jointed rock mass and carried out a parametric analysis. In addition, Zhao [3] used continuous and discontinuous element methods to explore the influence of joint parameters on blasting and obtained a negative correlation between the extent of joints in a blasting area and the blasting effect. Hence, it was found that the influence of joint parameters on the blasting effect is also a crucial aspect of rock dynamics.
As the blasting effect of highwall benches is also a multi-factor and complex system engineering topic, there are fewer related studies on the reasonable use of delayed initiation to achieve optimized shock wave collision in mine blasting. Gao et al. [4] evaluated the spatial distribution of blast energy and the blasting effect at the initiation position based on blast energy transmission and blast stress field distribution combined with simulation and experiments. Leng et al. [5] used the degree of tensile and compressional shear damage to calculate the crushing range and combined it with a step blasting field test to compare the blasting block size distribution under different blasting methods. The researchers then determined an optimized design for the number and position of blasting initiation points to significantly improve blasting efficiency. Therefore, the setting of delayed blasting in a hole is critical for efficient mining, slope stability, and capacity utilization improvement in open-pit mines.
Most of the previous differential time calculation methods are based on semi-empirical formulas obtained from row initiation, and most of them have focused on reducing the blasting vibration. Wu and Gong [6] used a single-hole blasting curve as the waveform source and conducted regression analysis based on a Fourier series. Subsequently, they used a multi-level loop nested logic language to write a MATLAB program and obtained all possible syntheses of an eight-stage differential blasting. The vibration curve was consistent with the maximum calculated synthetic vibration velocity of 0.26 cm/s under the field design. With the continuous development of digital mining, the large-scale application of air spacers and digital electronic detonators has made deep-hole blasting technology more flexible and diverse [7]. However, there is still a lack of detailed research on joints and extensions.
Based on the above research results, there are limited studies on the dynamic characteristics of particles around rock mass joints under blasting [8]. Therefore, this paper used the delayed blasting on a highwall bench of the Baiyunebo open-pit mine as a field study and investigated the dynamic response of jointed and fissured rock mass under blasting load to meet the blasting requirements of a modern, large open-pit mine as well as improve the utilization rate of blast energy.

3. Change in Stress Field in Fractured Rock Due to Blasting

3.1. Attenuation of Stress Wave in Fractured Rock Mass

In the vicinity of a blasting source, the shock wave in the radial direction attenuates with the increase in the distance from the blast hole until the attenuation becomes a stress wave [9]. Based on the definition of damaged rock mass [10], the shock wave pressure [11] and decay exponents of stress waves [12] are
α1 = 2 + b(D)
α2 = 2 − b(D)
b ( D ) = μ α [ 1 16 9 C d ] / { 1 μ α [ 1 16 9 C d ] }
where α1 is the attenuation index of shock wave pressure; α2 is the attenuation index of stress wave; b(D) is the lateral stress coefficient of damaged rock mass; Cd is the crack density caused by damage; and μα is the dynamic Poisson’s ratio, where μα = 0.8 μc and μc is the static Poisson’s ratio of rock.
After the explosive is detonated [13], it is assumed that the impact pressure changes exponentially. By combining this with the stress boundary conditions, this study analyzed the particle at a position far from the explosion source to investigate the attenuation relationship between the vibration velocity with distance and stress wave arrival time. By substituting α for α2, the change in stress [14] can be represented by the shock pressure attenuation formula. Based on the relationship between stress and wave velocity [15,16,17], the change in the vibration velocity of the incident and transmitted particles at the joint interface can be expressed as
σ = P(t) = ρ0C2e−α2t/8
v I P = l 2 l 2 { α 2 c 2 P t 4 G C p · ( 1 μ ) d 3 + μ ( l 0 l ) 2 l 0 ( 1 μ ) [ ( l 0 l ) 2 + l 0 2 ] 2 e α ( t t p ) α 2 c 2 P t 2 G C s · ( l 0 l ) 2 l 0 [ ( l 0 l ) 2 + l 0 2 ] 2 e α ( t t p ) } d l
v T s = l 2 l 2 { α 2 c 2 P t 4 G C p · ( 1 μ ) ( l 0 l ) d 2 + μ ( l 0 l ) 3 ( 1 μ ) [ ( l 0 l ) 2 + l 0 2 ] 2 e α ( t t p ) α 2 c 2 P t 2 G C s · ( l 0 l ) 2 d 2 [ ( l 0 l ) 2 + d 2 ] 2 e α ( t t s ) } d l
t s = l z C + ( l 0 l ) 2 + l 0 2 C s   t p = l z C + ( l 0 l ) 2 + l 0 2 C p
where Cp and Cs where are propagation velocities of the P-wave and S-wave, respectively, which are assumed as 4803 and 1961 m/s. ts and tp are propagation times of the P-wave and S-wave, respectively; C is the detonation velocity, which is between 2000 and 4000 m/s; μ is the Poisson’s ratio, which is taken as 0.3; G is the shear modulus of the rock, which is taken as 30 GPa; P(t) is the impact pressure; ρ0 is the density of the explosive, which is assumed as 1.63 g/cm3; α is attenuation index, which equals 4000; and t is the control load input termination time (0.05 s).
According to the change in vibration velocity of transmission particles [18,19], joints in the rock mass are subject to the superposition of in situ stress. This superposition of joint interface stress can be expressed as
σ i = z p cos 2 β v IP i + z s sin 2 β v Ts i + σ d
τ i = z p sin 2 β cot α v IP i z s cos 2 β v Ts i + τ d
where σ(i) and τ(i) represent the normal and shear stresses along the joint interface, respectively; zp and zs are wave impedances of P and S waves, respectively, which are 15,449,500 and 6,307,800; vIP and vTs are particle vibration velocities of the incident P wave and transmitted S wave, respectively; and α is the incident angle, reflection angle, and transmission angle of the P wave. β is the reflection angle of the reflected S-wave and the transmission angle of transmitted S-wave. σd is stress at the end of the joint under in situ stress, and τd is the shear stress at the end of the joint under in situ stress. In this study, σ1 and τ1 are approximately equivalent to the in situ stress values at the midpoint of the joint.

3.2. Constitutive Model of Fractured Rock Mass Blasting

By combining the classical joint nonlinear normal deformation constitutive model (BB) and the cylindrical cavity Heelan solution [20,21], a delayed blasting model in the hole of fractured rock mass is constructed [22,23]. The stress change in the red particles on both sides of the joint interface is analyzed, where γ is the polar angle, a is the length of the joint, l is the length of the explosive column, c is the horizontal distance between the blast hole and the joint, b is the distance between the lower explosive column and the middle of blasting hole, and d is the radius of the explosives, as shown in Figure 1 below.
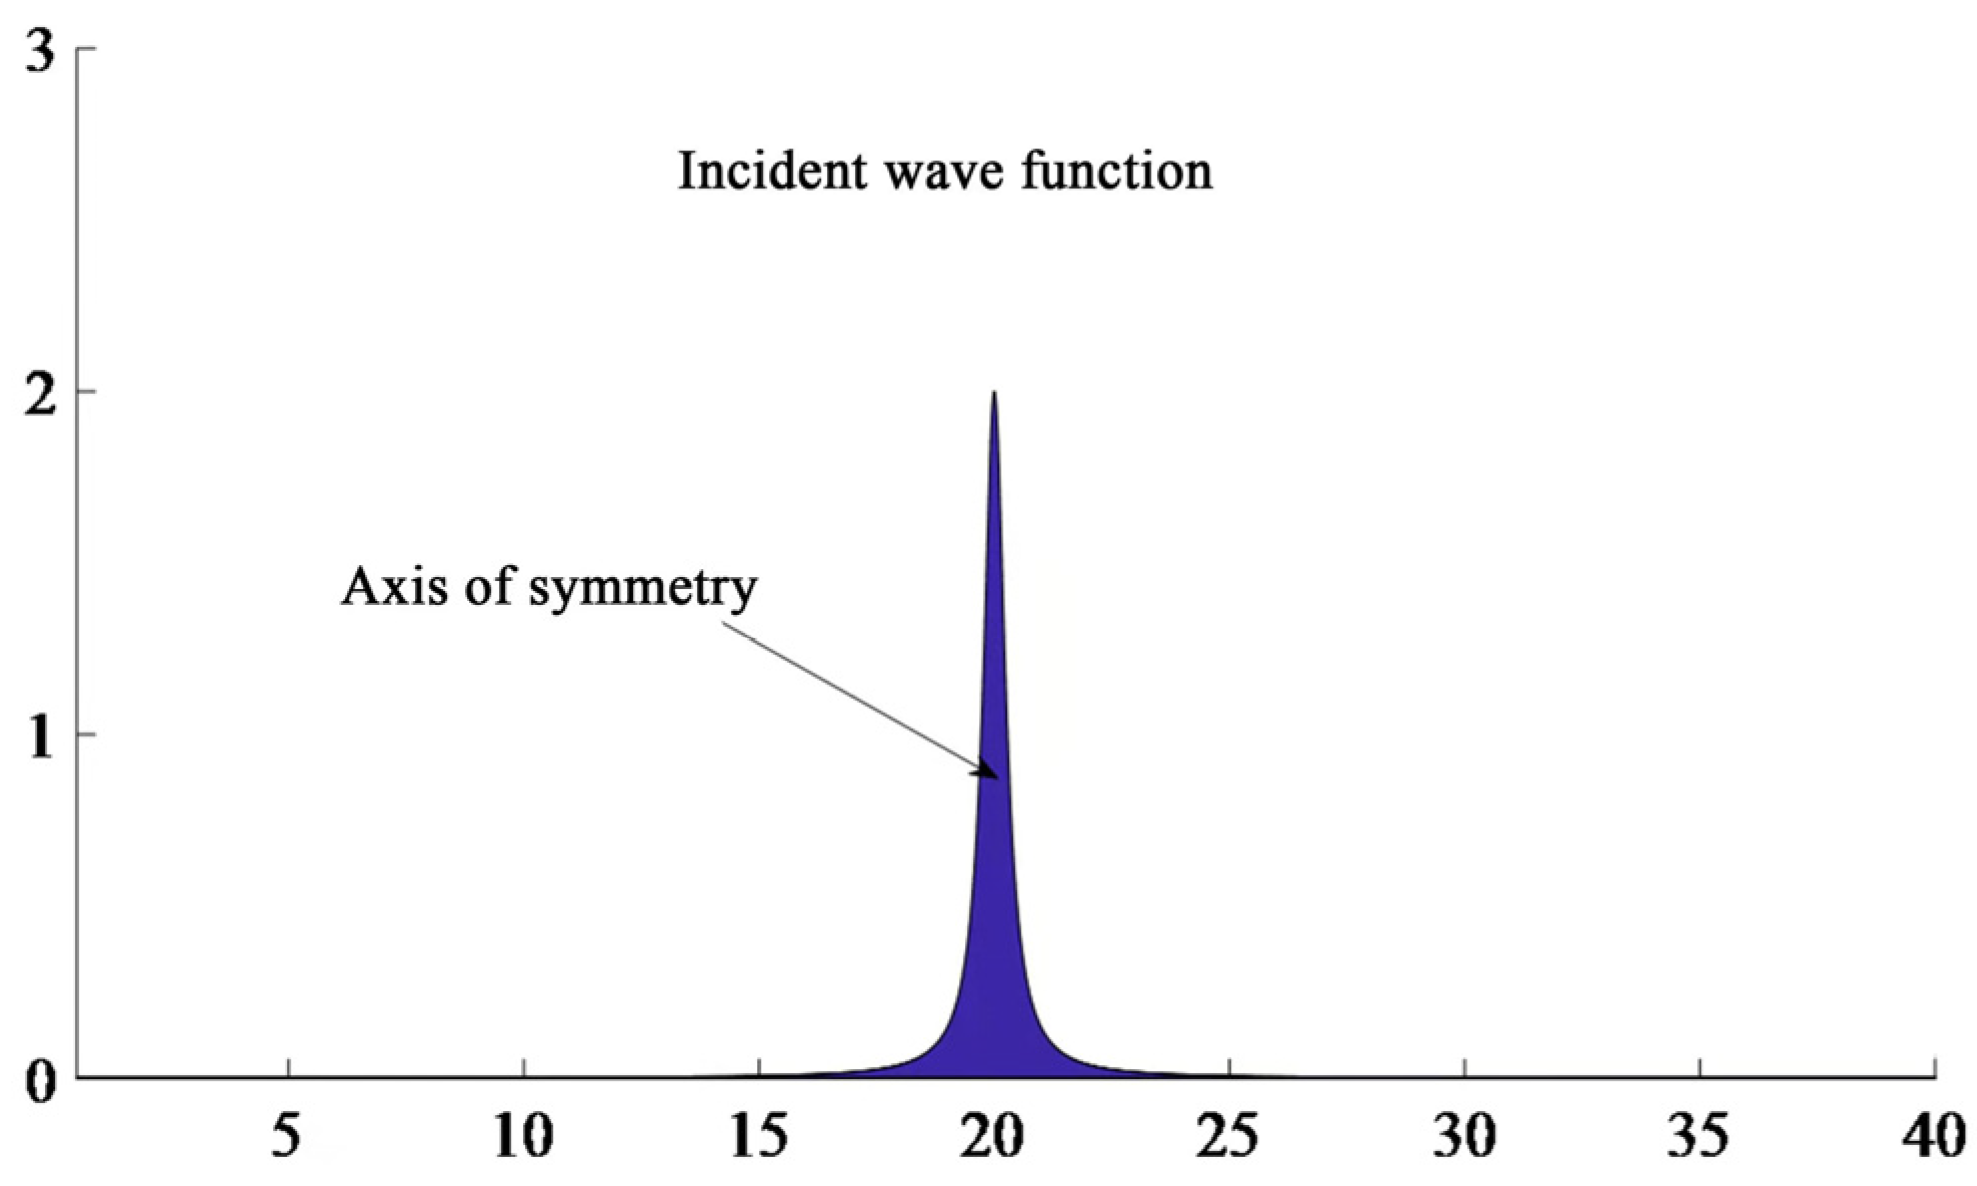
In addition, x1 represents the location of the axis of symmetry, and β is any number of adjustment functions. To simplify the change in the vibration velocity of the incident particle at the joint interface, as shown in Figure 2, the change form is simplified as
v I P = 1 β π e ( x x 1 ) 2 β
Therefore, time t = 0 to 4000 ms of the incident wave function is defined. To ensure the accuracy of numerical calculation, a total of 2000 times is selected, in which the peak time b = 2000 ms and the corresponding peak value G(t − 2)max = 0.2 m/s.
After the initial directional crack is formed, the crack continues to expand under the explosive gas. Based on the theory of fracture mechanics, the stress intensity factors of types I and II inside the crack under quasi-static pressure are
K I K I I = 1 π a a a a + x a x σ ( i ) τ ( i ) d x
By substituting σ and τ into Equation (11), the stress intensity factor can be expressed in terms of distance and time after detonation. By bringing the results into Equations (12) and (13), the crack tip stress and displacement can be calculated as
σ x = K Ι 2 π r cos θ 2 1 sin θ 2 sin 3 θ 2 K Ι Ι 2 π r sin θ 2 2 + cos θ 2 cos 3 θ 2 σ y = K Ι 2 π r cos θ 2 1 + sin θ 2 sin 3 θ 2 + K Ι Ι 2 π r sin θ 2 cos θ 2 cos 3 θ 2 τ x y = K Ι 2 π r cos θ 2 sin θ 2 cos 3 θ 2 + K Ι Ι 2 π r cos θ 2 1 sin θ 2 sin 3 θ 2
u = ( 1 + μ ) K I 2 E a r 2 π ( 2 k 1 ) cos θ 2 cos 3 θ 2 + 2 ( 1 + μ ) K II 4 E a r 2 π ( 2 k + 3 ) sin θ 2 + sin 3 θ 2 ν = ( 1 + μ ) K I 2 E a r 2 π ( 2 k + 1 ) sin θ 2 sin 3 θ 2 2 ( 1 + μ ) K II 4 E a r 2 π ( 2 k 3 ) cos θ 2 cos 3 θ 2
where Ea is the dynamic elastic modulus of rock, which is taken as 10 GPa. σx, σy, and τxy are the stress components at the joint ends. u and v are the displacement components at the joint ends; r and θ are the polar diameter and polar angle from the joint ends, respectively. This paper studies the plane strain problem, where k = 3 to 4 μ.
Since the integral does not have an explicit solution for the stress and displacement of the particle around the crack, MATLAB numerical integration is used to obtain the numerical solution of the vibration velocity. Its associated variation is able to be represented by an image [24].
From Figure 3, the incident P-wave is positively incident on the joint, and the peak value of particle vibration velocity is 0.33 m/s, whereas the peak time is 3.0 s. The propagation direction of the P-wave reflected at the joint interface is the same as the vibration direction of the particle at first (forward reflection). After a period of time, the propagation direction is opposite to the vibration direction of the particle (reverse reflection). This time is obtained to be 3.205 s. The S-wave reflected by the joint interface is first reflected backward and then forward reflected; the peak vibration velocity of the particle is 0.027 m/s.

4. Analysis of Stress and Displacement Distribution around Joints

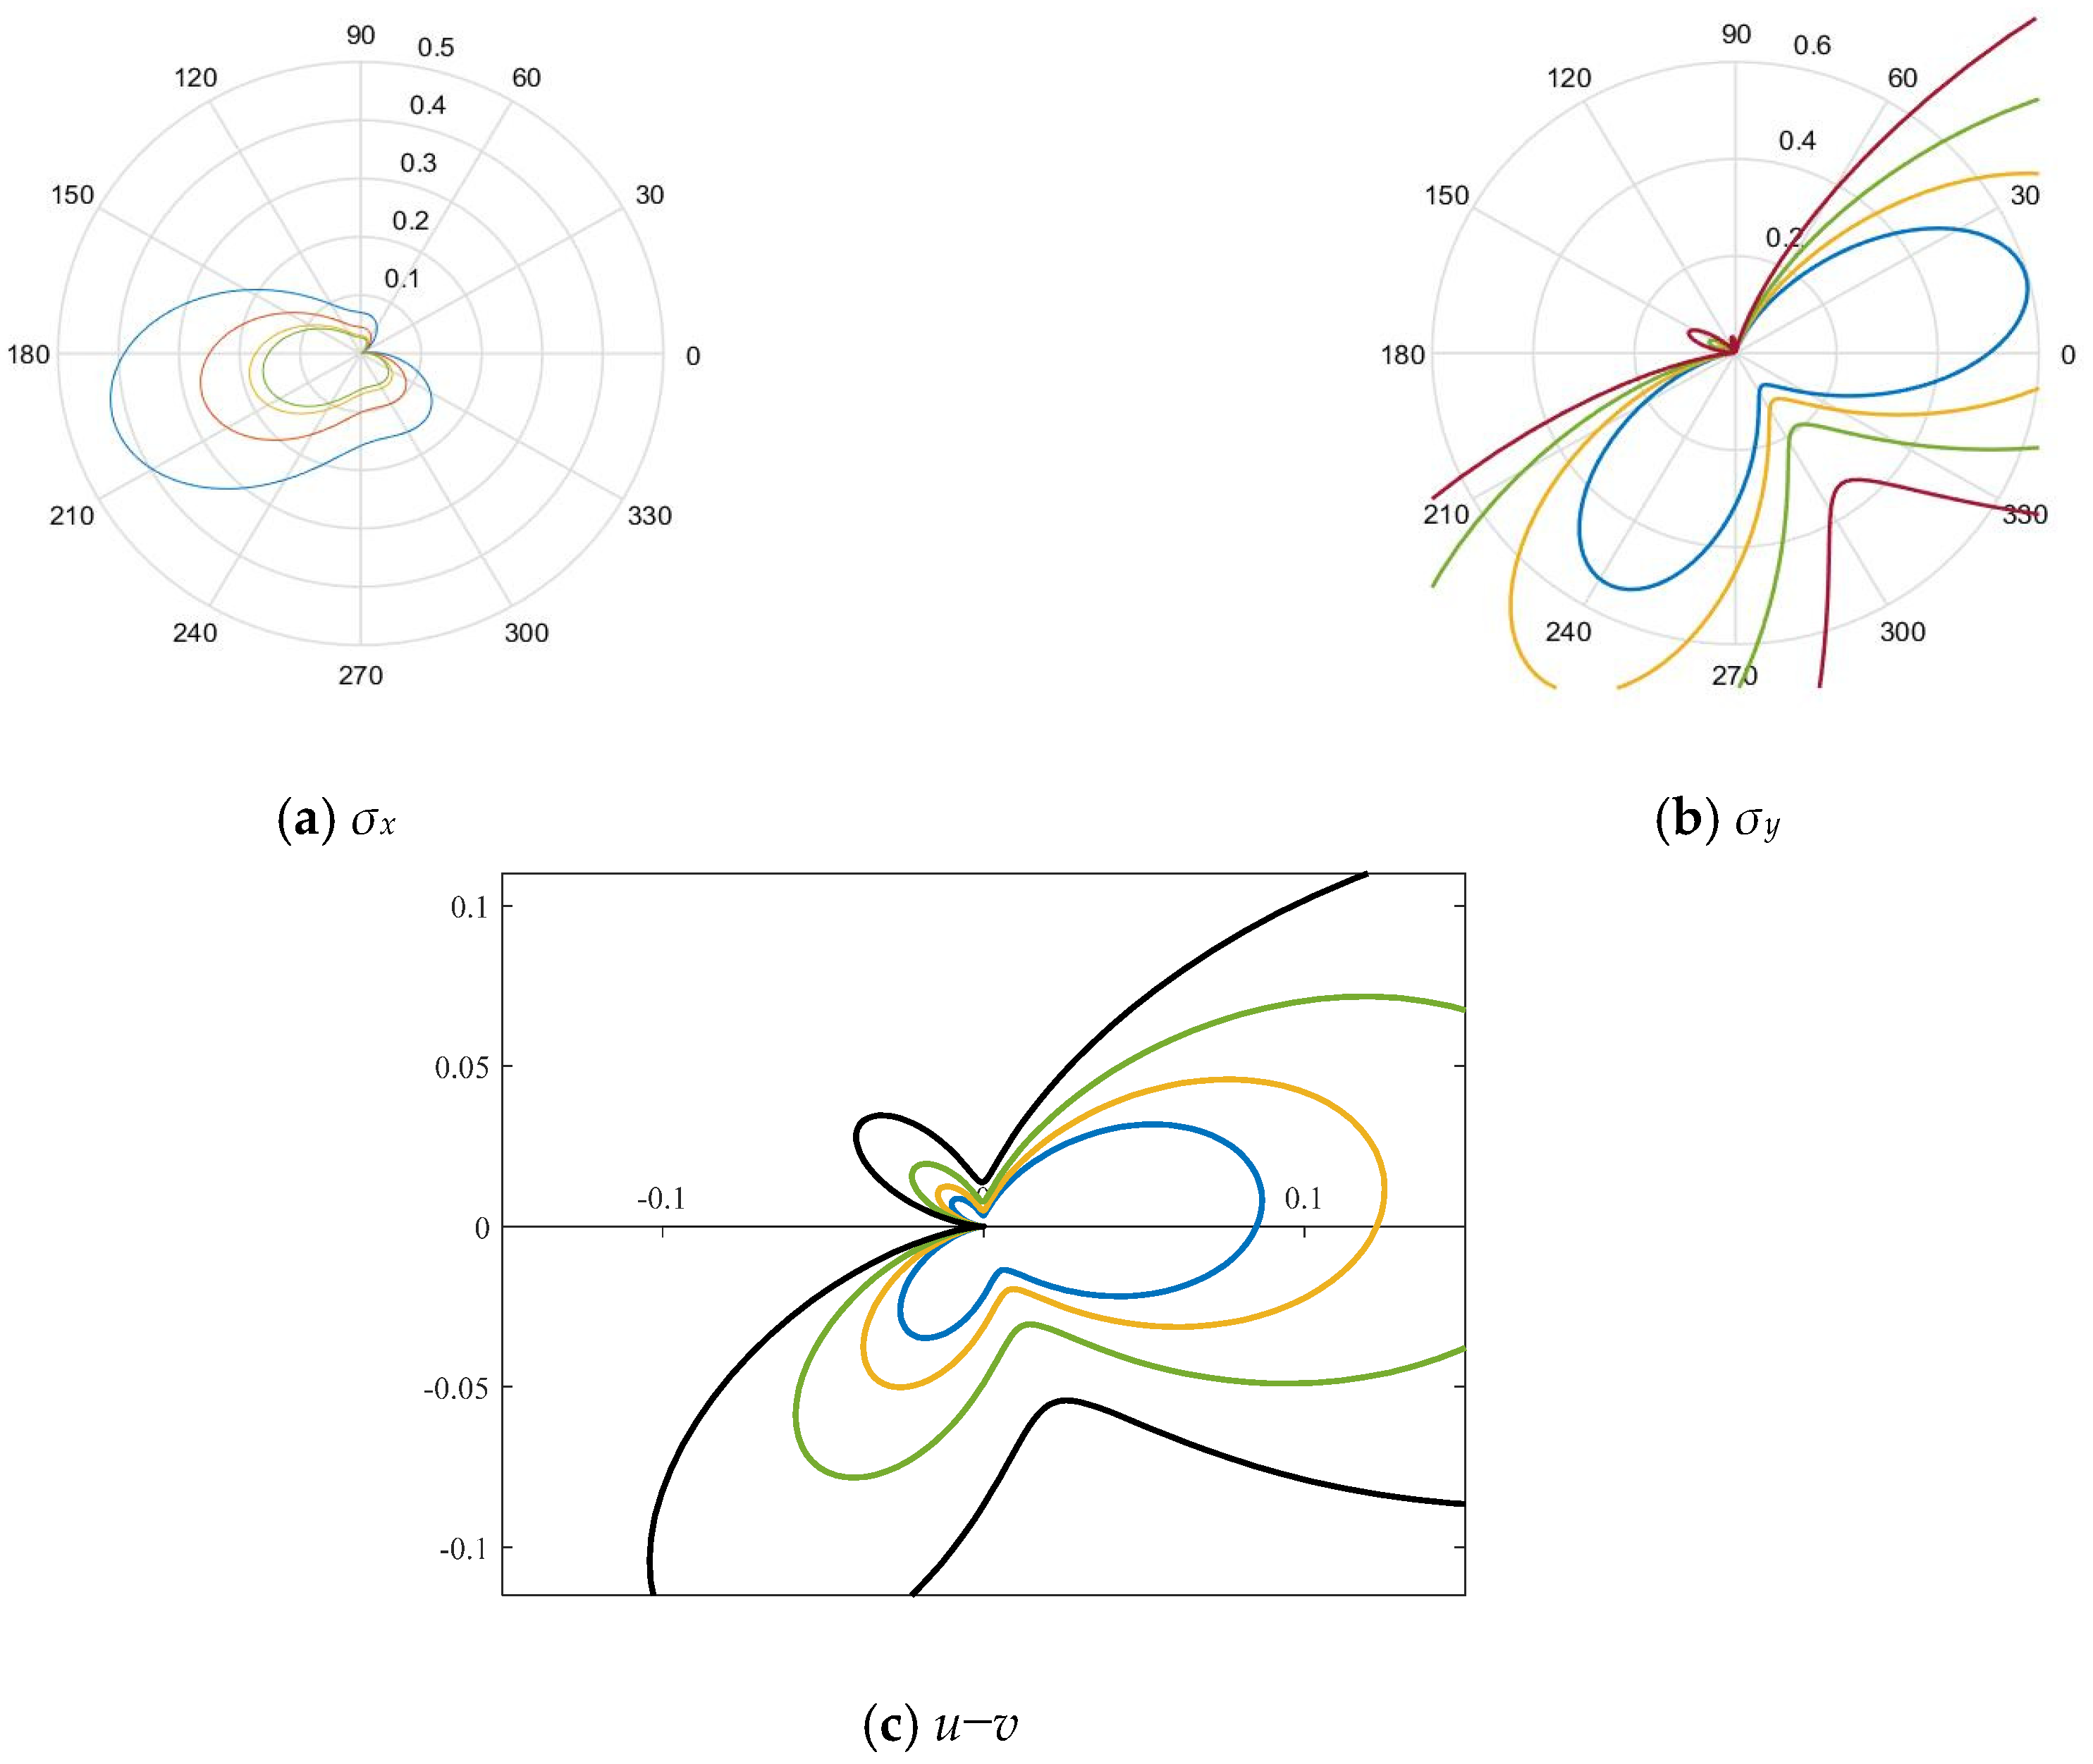
By substituting the transmission wave function of the joint interface in Figure 2 into Equations (12) and (13) and combining them with the delayed blasting model, the contour plots of stresses and deformation are calculated in Figure 3.
It can be seen from Figure 3a that at the joint end, σx is positive in the direction of 0°–330° and subjected to tensile stress, whereas it is negative in the direction between 330° and 360° under compressive stress. σx is not symmetrical along the joint interface, and σx stress gradient increases rapidly in the direction of 300°–330°, forming a stress concentration area. Figure 3b shows that at the joint end, σy is positive in the direction of 0°–180° under tensile stress. On the other hand, it is negative in the direction of 180°–360° and subjected to compressive stress. Although stress is symmetrically distributed along the joint interface, it can be clearly found from the figure that the σy stress field is not distributed symmetrically. Comparing Figure 3a,b, however, there are normal stress components in σx, and σy and σx had a larger stress range. It can be seen from Figure 3c that the lateral displacement of the joint end is affected by the stress components in both directions. Although an intuitive understanding of the stress field distribution at the joint end can be obtained from the stress contour diagram, the asymmetry and continuous changes in the whole process still cannot be analyzed from the contour plot. Thus, the numerical simulation method is used to analyze the stress change in the wave acting on the mass point on the left side of the joint. Based on the following three figures, the stress field of the joint particle is asymmetric.
Based on Figure 3a, the stress on the left side of the joint is tensile. According to the gradient change in the stress value with the distance from the joint, the stress distribution in the contours is denser, indicating it is manifested as tensile stress. A failure is more likely to appear in this area. Figure 3b shows the contour plot of longitudinal stress along the joint. It can be seen from the figure that the compressive stress distribution area and value are very small and the rock material is not damaged at this time. In addition, the stress concentration appears in the lower-right position. However, the vibration velocity of the particles on both sides of the joint interface change from time to time; the maximum force position also changes accordingly.
To verify the propagation of the detonation wave incident on the jointed rock mass and discuss the distribution of the stress field of the jointed rock mass under the blasting, a finite element model is used. To assess the effect of the blast shock wave on the stress field around the joint, the peak strain value is used as the only parameter (positive values represent tensile stress, and negative values represent compressive stress) in the numerical simulation [25,26]. By setting parameters such as time step, the influence of the joint on the stress field around the incident joint subject to explosion stress wave can be analyzed.

5. Analysis of Blasting Simulation

Based on field conditions, pore spacing and lithology, the fluid–structure coupling of the explosive, and the Lagrange algorithm are assumed and used for the ore rock and the blockage simulation. Yield occurs when the average stress σm at a point in the rock mass exceeds its yield strength σy (that is, it begins to enter the plastic stage); for high-speed impact processes, such as explosions, the strain rate effect of rock mass is significant. The rock’s constitutive model adopts the bilinear kinematic hardening model (plastic kinematic) [27,28,29], and the specific expression is as follows:
σ Y = 1 + ε . C 1 P ( σ 0 + β E p ε e f f p )
ε e f f p = 0 t ( 2 3 ε . i j p ε i j p ) 1 2 d t
where σ0 is the initial yield strength; C and P are constants related to material properties and C = 35, P = 3; ε . is the strain rate; β is an adjustable parameter, β = 1; EP is the plastic hardening modulus, 23.7 MPa; ε . ij p is the plastic strain rate; and ε eff p is the equivalent plastic strain.
Through the analysis of the above two formulas, when the detonation wave generated by the explosion acts on the rock mass and the Mises stress σvm of the rock in the near explosion source area exceeds the set dynamic compressive strength σcd, the point fails. In the far zone of the explosion source, when the calculated tensile stress σt of the point in the rock mass is greater than the set dynamic tensile strength σtd, the point fails, and in the near zone of the explosion source, the calculated cumulative plastic strain εp of the point in the rock mass exceeds the set failure strain εpf, the point fails. In short, the possibility of rock mass failure increases, which is convenient to more realistically simulate the dynamic force of rock mass after the detonation wave and symbiotic gas.
Based on the existing reference manual “Engineering Geology Handbook” and an engineering geological survey report, the relevant strain rate parameters are selected, and it is believed that the dynamic compressive strength of the rock will be significantly enhanced under high loading strain rate. The conversion relationship between the dynamic compressive strength σcd and the static compressive strength σc is as follows.
σ cd = σ c ε . 1 / 3
The same material model is used for the stemming and hosting rock [30], in which the specific parameter settings are shown in Table 1 and Table 2.
The intervals are filled with air to a density of 1.29 g/L. On the other hand, other parameters are defaulted, and the state equation is expressed as the following: When μ < 0, C2μ2 and C6μ3 are 0; C0 = C1 = C2 = C3 = C6 = 0, C4 = C5 = γ − 1, where γ is the ratio of two pressures and volume specific heat.
The JWL equation is used to describe the emulsion explosives state, which was expressed as
P = A ( 1 w R 1 V ) e R 1 V + B ( 1 w R 2 V ) e R 2 V + w V E ,
where P is the required pressure value; E is the internal energy of the detonation product per unit volume; V is the volume of the detonation product; A, B, R1, R2, and w are empirical parameters; and the explosives are selected according to the site conditions. The parameters are detailed in Table 3.
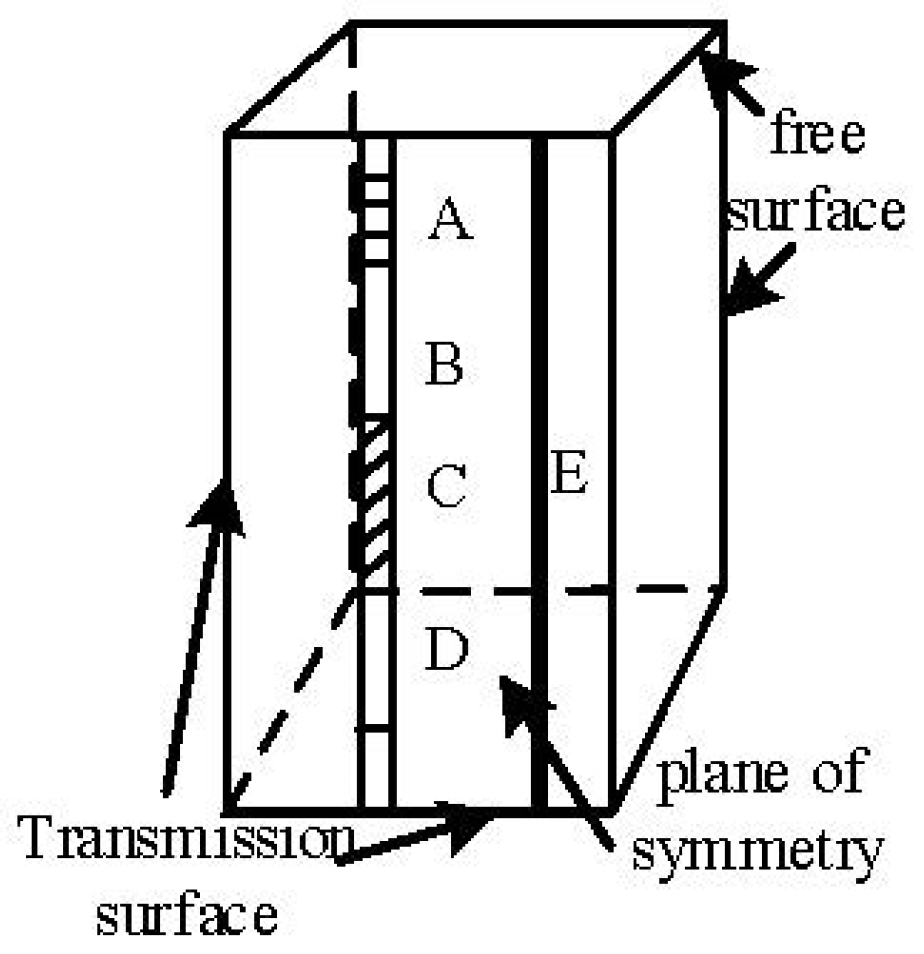
When defining the boundary conditions, define the top, slope, and foot surface of the step as free surfaces; that is, displacement can be generated, and stress waves in the rock mass can be reflected. All remaining surfaces are set to non-reflective boundary conditions; that is, there is no change in displacement and no reflection of stress waves. The underside is set as a perspective surface, which allows the energy of detonation to be released. Numerical simulation software is used to obtain the dynamic distribution of effective stress within the surrounding rock mass after the explosion. According to the statistics of the mechanical test results, the average tensile strength is 5 MPa, and the value is used as the critical value to judge whether the rock can yield. The rock mass in the stress area is analyzed in a critical state or plastic state by the color change in the effective stress cloud. The effective stress is greater than the tensile strength; otherwise, it does not occur. The material parameters are restored and set with reference to the physical and mechanical parameters in the field; boundary load constraints are imposed. By calibrating against the field conditions, a reasonable time step, CPU speed, and storage space are obtained. Then, the symmetry axis is used as a constraint, and transmission boundaries and reflection boundaries are imposed. Figure 4 shows a typical setup.
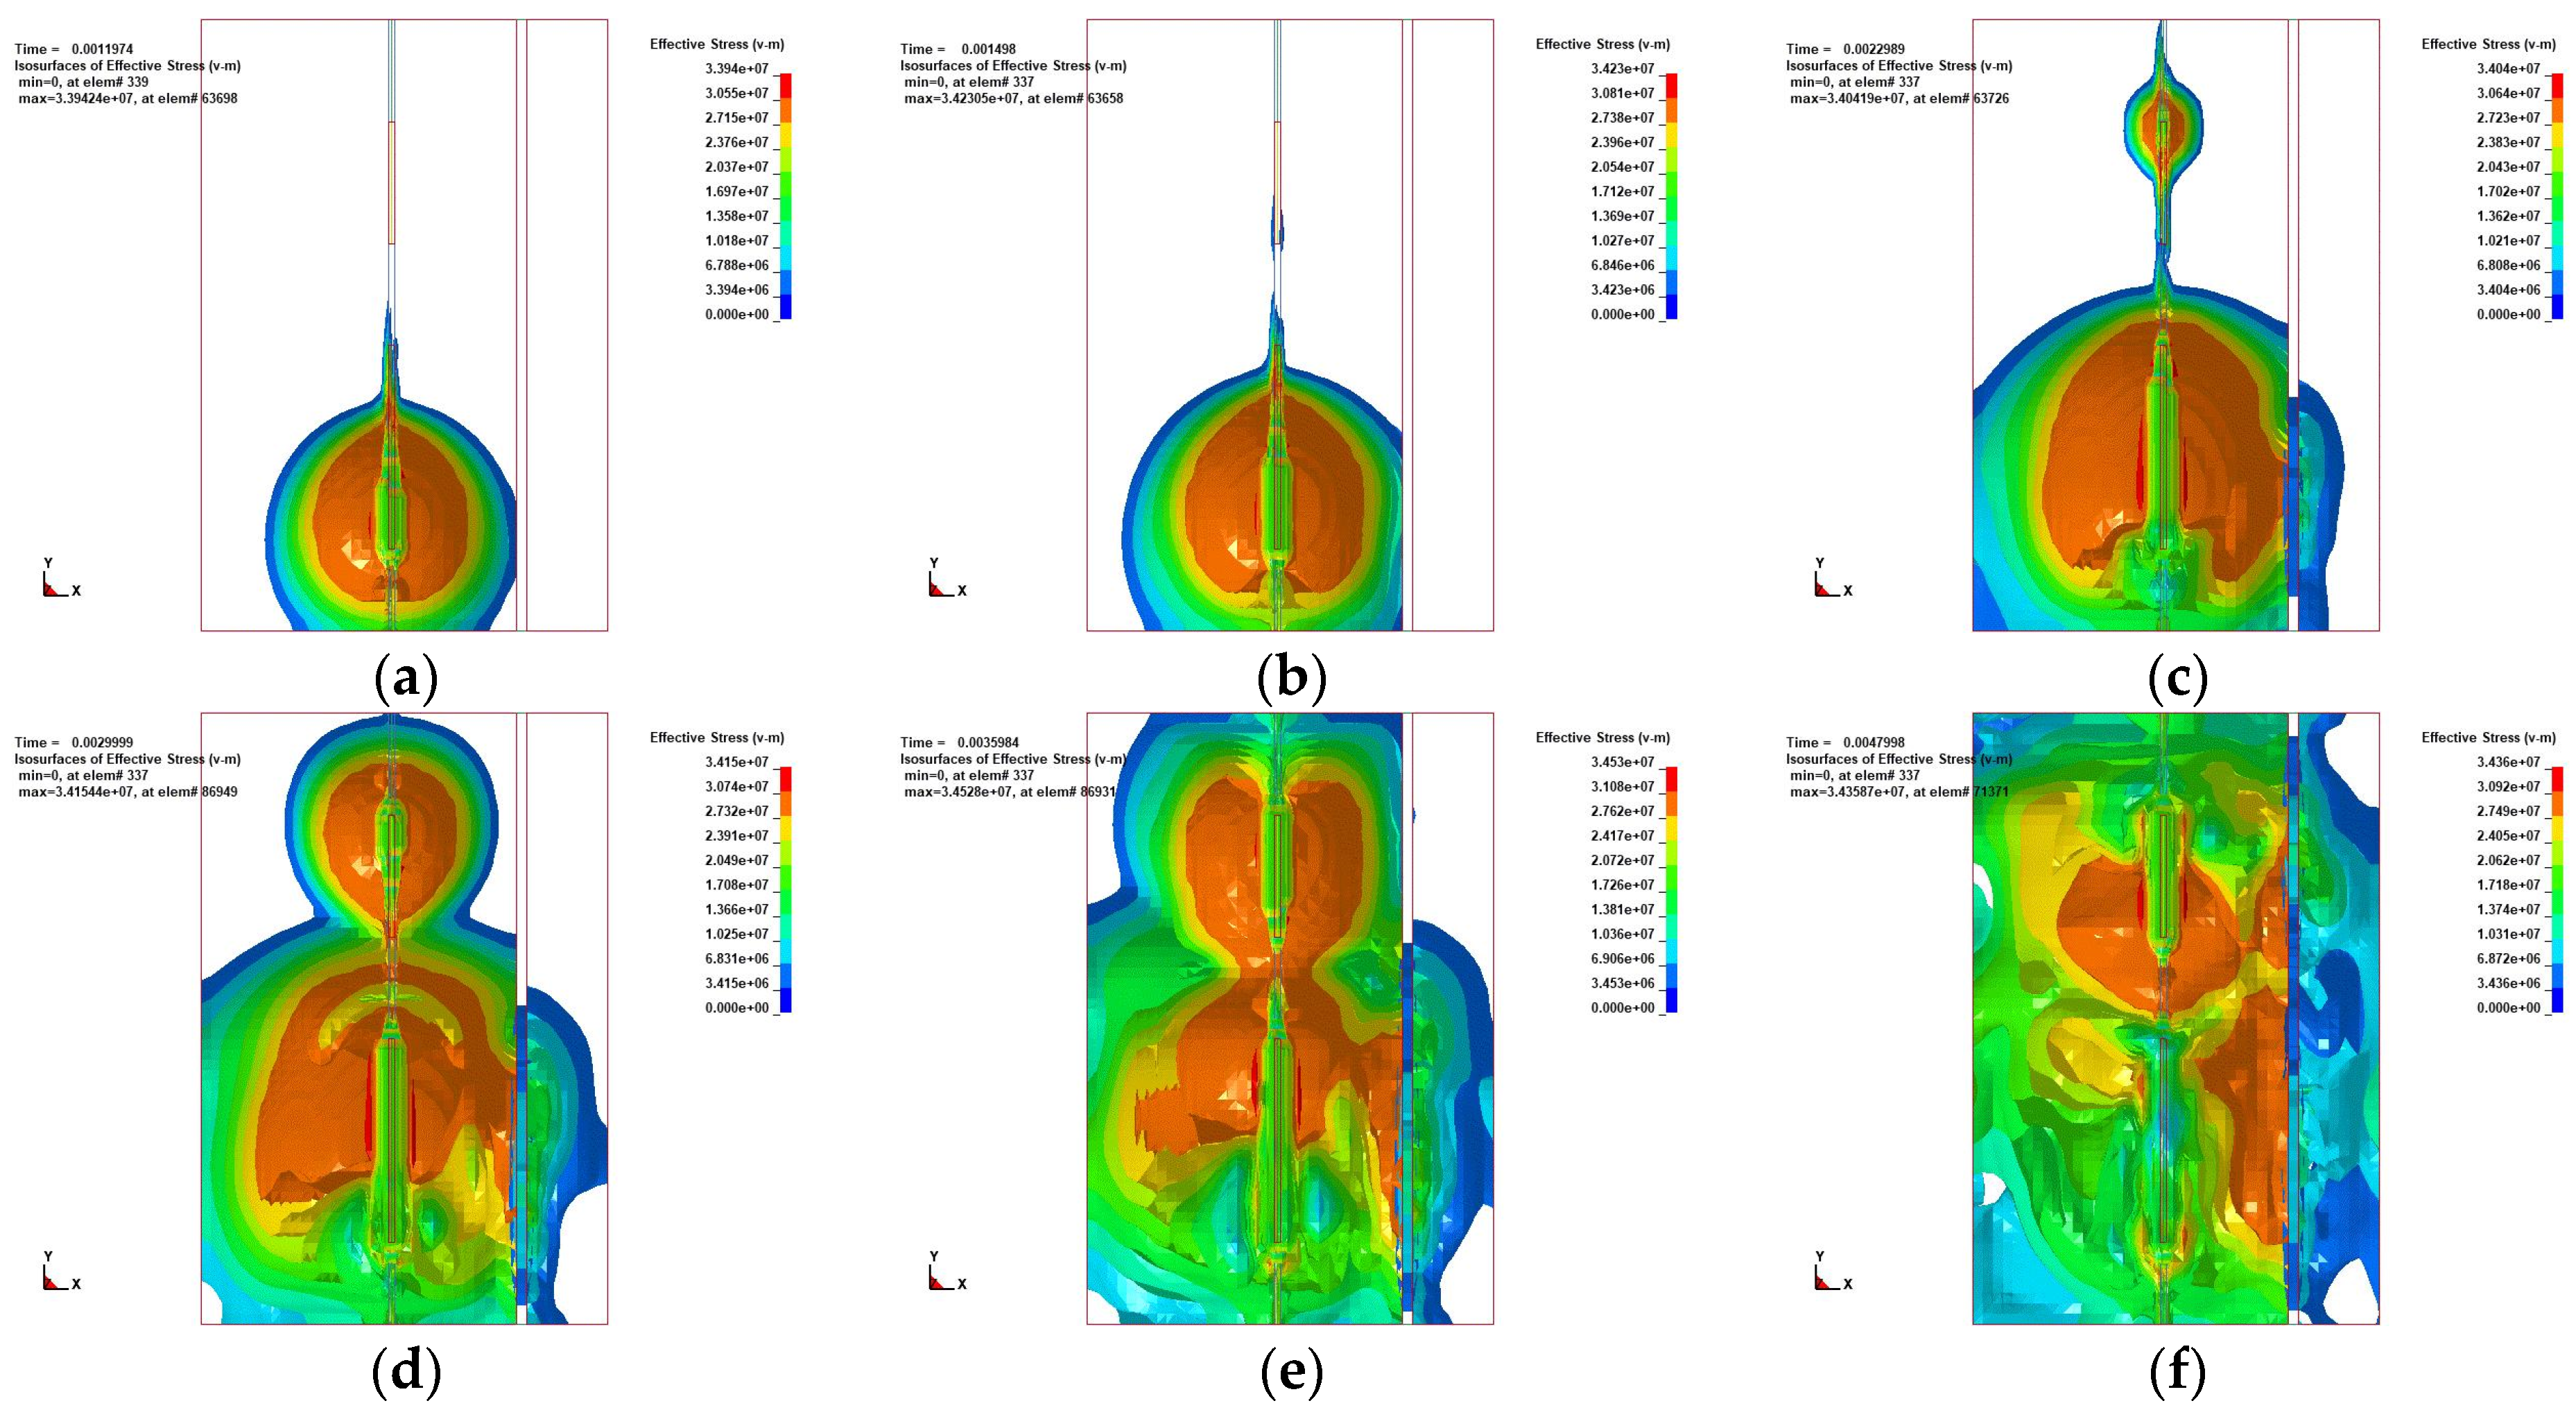
Upon the completion of the calibration, changes in the Mises stress nephogram of highwall bench blasting at different times are obtained. In Figure 5, the charge column at the lower part of the blast hole detonates first, and the detonation wave propagates from the bottom to the top of the hole. When t = 1197 µs, the shock wave generated by the explosive induces a fracture in the surrounding rock, and the stress wave of the charge column begins to propagate to the hole. In comparison, the stress wave that propagates to the bottom of the hole is pear-like and propagates downward. When t = 1498 μs, blasting spreads radially from the hole center like water ripples. At the same time, the value gradually decreases. Stress in the crushing area around the blasthole is relatively concentrated, and the wave propagating to the crack area can pass through the depth of color in the figure. The change is then analyzed, and the color of the outer layer is weakened to a certain extent from the blast hole. With the propagation of the detonation wave in the hole, the detonation wave attenuates into a stress wave, and rock mass hinders the propagation of the shock wave. This is similar to the propagation of ocean waves to the position of the free surface layer by layer. The intensity of the shock wave is lower than the damage strength of the rock, and the sub-layer shock wave supplements the shock wave energy that is not enough to break the rock. This further pushes the explosive gas into the crack, forming a gas wedge effect, which further deepens and expands the crack. This is shown in Figure 5. Based on the degree of color change with the attenuation of the detonation wave energy, the stress exhibits a decreasing trend in this process.
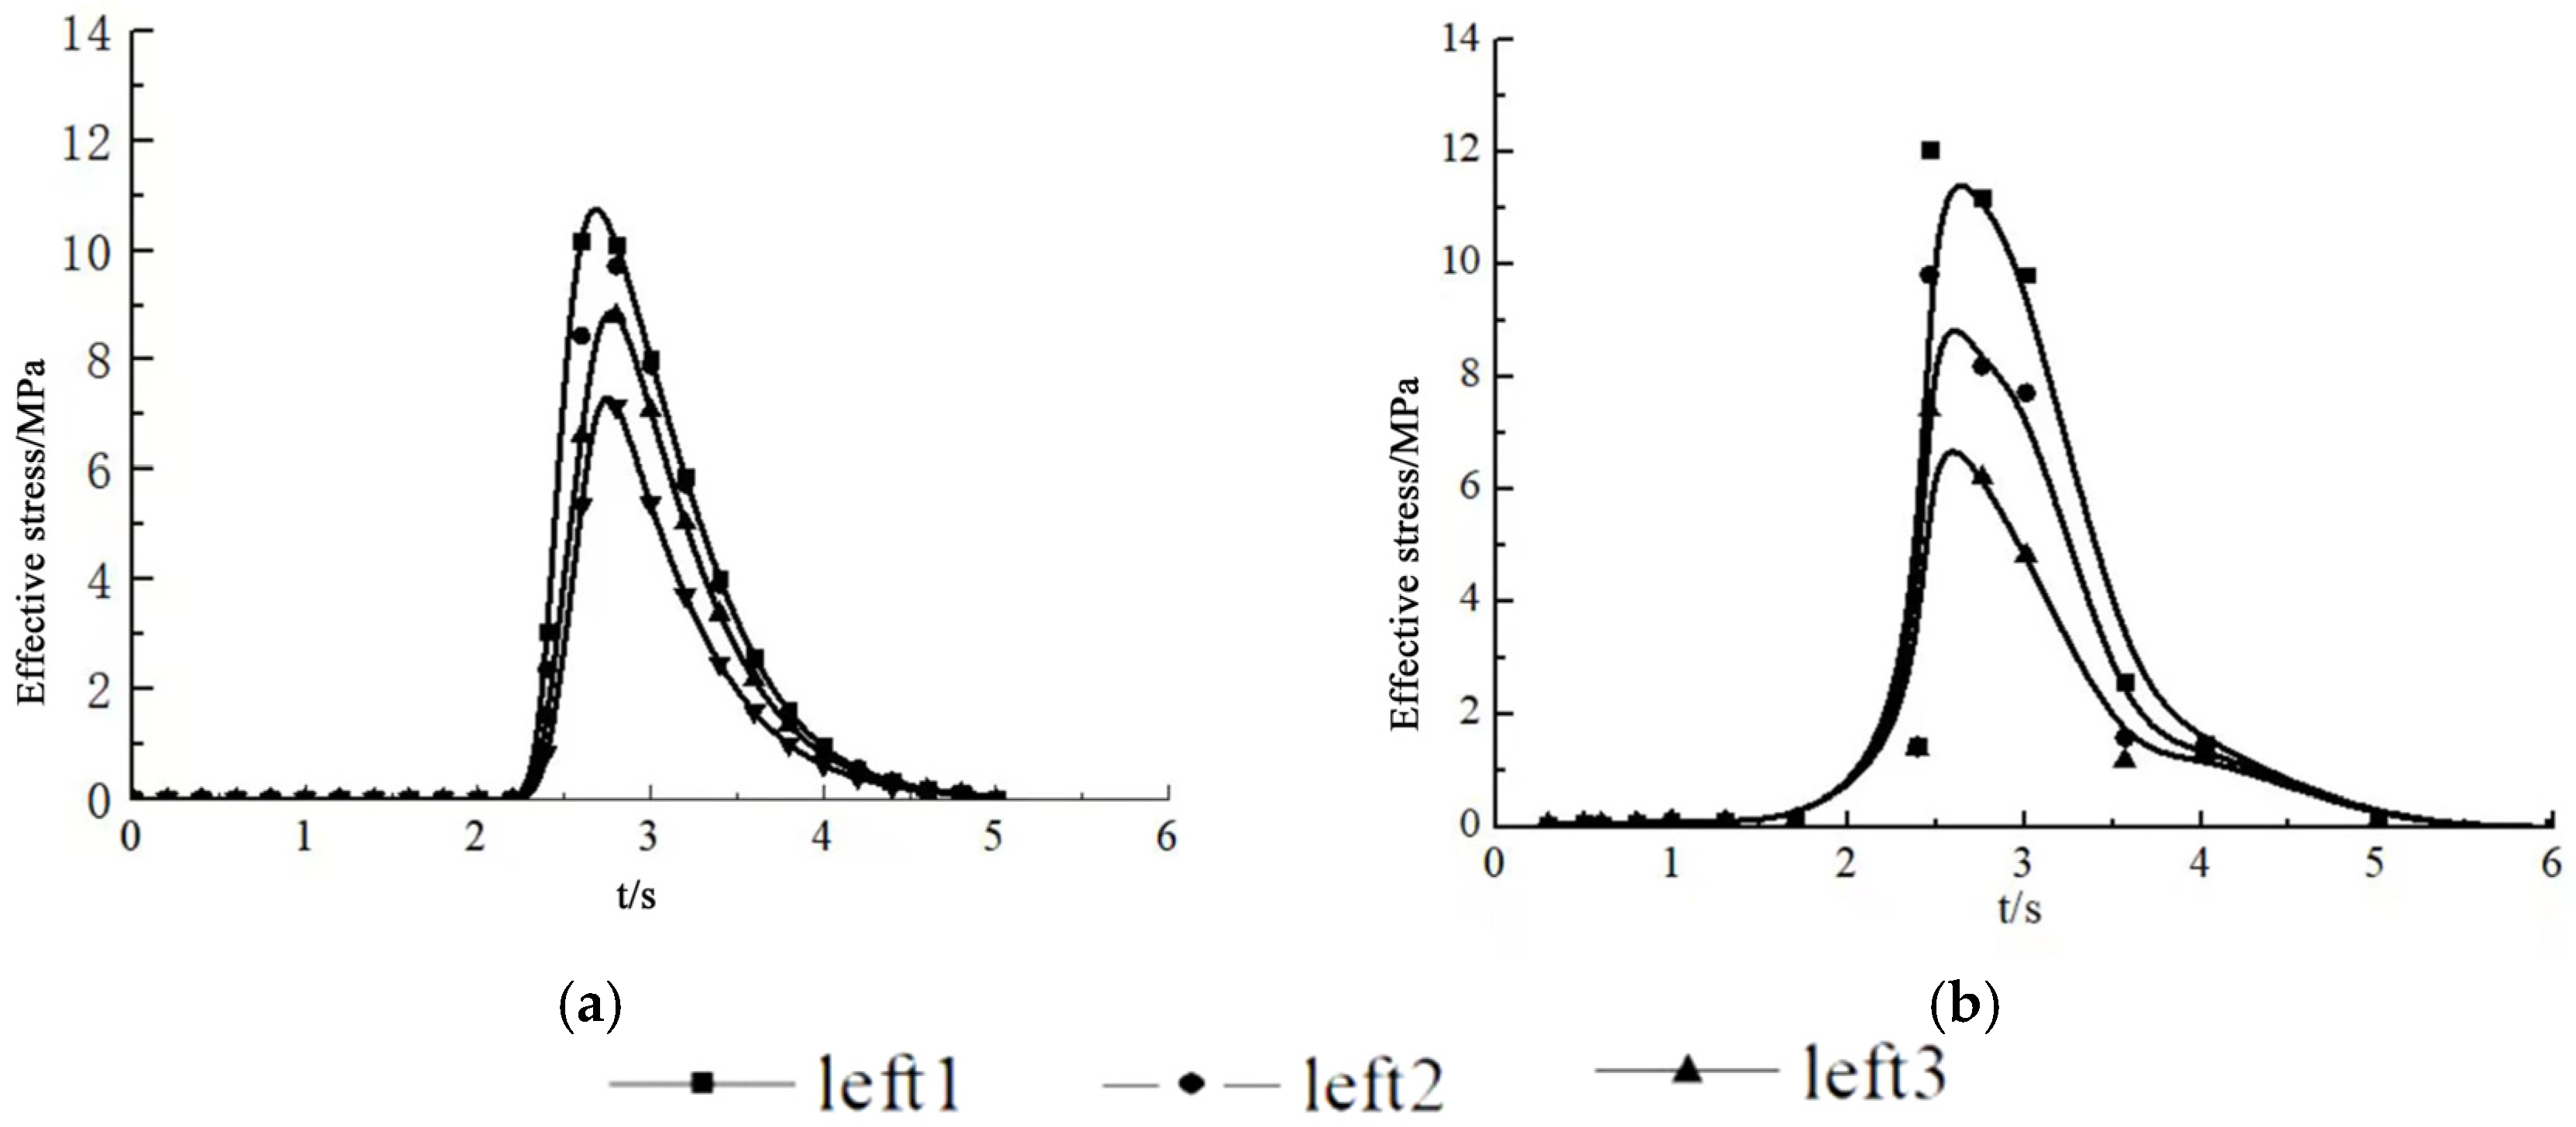
The differential detonation time of the upper and lower charges in the hole is taken as 3–5 ms. After the detonation is initiated between 3 and 5 ms, the change in the peak effective stress values and the strength and duration of the stress around each inspection point in the air charge column are analyzed. It can be seen from Figure 6 that it only takes 2.5 ms from the start of detonation to the peak effective stress. Subsequently, the energy of the shock wave acting on the rock mass decreases sharply with the increase in distance from the blasthole, along with a loss of energy. The rock mass in the fissure area penetrates the fissure under the detonation wave and the symbiotic gas. Then, the instantaneous peak effective stress value decreases to zero at 5 ms and forms in the horizontal direction. The distribution of the peak effective stress is compared and analyzed from the two figures. It is observed that the peak value first increases to 10–12 MPa and then shows a downward trend. The finite element simulation results and the mathematical analysis theoretical results both show the same variation.

6. Conclusions

Under the condition of a 24 m highwall bench and large-diameter vertical drilling at a Barun mine, the distribution of blasting-induced stress under a delayed detonating explosive within fractured rock mass is analyzed. The following conclusions are obtained:
(1)
By constructing a nonlinear joint blasting model and introducing the detonation wave propagation velocity simplification into the vibration velocity of the incident particle at the joint interface, the incident P-wave incident joint is obtained. The peak value is at 3.0 s with a peak vibration velocity of 0.33 m/s; the S-wave reflected from the joint interface is first reflected backward and then forward. The peak vibration velocity of the particle is 0.027 m/s.
(2)
By combining with the relevant theories of stress and displacement field at the crack end of type I and II cracks, it is obtained that the joint presents asymmetric characteristics around the stress field. The end σx is positive in the direction of 0°–330° subject to tensile stress, whereas σy is positive in the direction of 0°–180° under tensile stress; the longitudinal stress σy of the joint is low around the compressive stress distribution area. At this point, the rock material does not fail, and the stress concentration appears in the lower-right position. The lateral displacement of the joint ends is significantly affected by the stress components in both directions.
(3)
Based on the analysis results of ANSYS, it is found that the intensity of the shock wave after detonation is greater than the strength of the rock. Then, the sub-layer shock wave supplements the energy of the shock wave that is not enough to break the rock and induces further cracking. Based on the analysis results on the attenuation of detonation wave energy, the stress exhibits a decreasing trend in the process. By constructing a variation diagram of the peak effective stress, it is found that the peak value first increases to 10–12 MPa and then shows a downward trend.
The main contents of this research are as follows:
Firstly, the construction of a simulation model for a jointed rock mass model under blasting is presented. This is achieved by combining a nonlinear joint model, hyperbolic joint constitutive model (BB model) of normal nonlinear deformation, and tangential linear deformation. Subsequently, the function of the P-wave joint incident propagation is deduced. By selecting δ as the factor of the stress wave function, the relationships between reflecting and incident wave points, the peak value of vibration velocity, and time were investigated. MATLAB is used to analyze changes in the stress and displacement of particles around the joints.
Based on existing technological conditions, the influence of stress distribution of rock mass under delayed blasting of the jointed rock mass is studied. The analysis results show that the peak stress first reaches 10–12 MPa, followed by a decreasing trend. The particle changes of the two analysis methods have the same trends, which are subsequently verified by the results of a finite element simulation and mathematical analysis.

Author Contributions

Conceptualization, P.Z. and X.S.; methodology, P.Z.; software, P.Z.; validation, P.Z., X.S. and T.W.; formal analysis, X.S.; investigation, X.S.; resources, T.W.; data curation, T.W.; writing—original draft preparation, P.Z.; writing—review and editing, P.Z.; visualization, P.Z.; supervision, R.B.; project administration, R.B.; funding acquisition, R.B. All authors have read and agreed to the published version of the manuscript.

Funding

This research received no external funding.

Institutional Review Board Statement

Not applicable.

Informed Consent Statement

The study did not involve humans.

Conflicts of Interest

The authors declare no conflict of interest.

References

  1. Bao, S. Study on the Change Law of Stress and Displacement at the End of Finite-Length Joints with Oblique Incidence of Stress Waves. Master’s Thesis, Liaoning University of Engineering and Technology, Fuxin, China, 2017. [Google Scholar]
  2. Song, L.; Yan, Y.; Han, B.; Shao, Z. Theoretical study on the propagation characteristics of longitudinal waves in nonlinear deformation joints. Chin. J. Appl. Mech. 2012, 29, 133–140+236. [Google Scholar]
  3. Zhao, A.; Feng, C.; Guo, R.; Li, S.; Jia, J. Research on the influence of joint properties on stress wave propagation and blasting effect. Chin. J. Rock Mech. Eng. 2018, 37, 2027–2037. [Google Scholar]
  4. Gao, Q.; Lu, W.; Leng, Z.; Wang, Y.; Sun, P.; Chen, M. Research on the regulation of blasting energy transmission in the blasting position in the hole in rock blasting. Chin. J. Geotech. Eng. 2020, 42, 2050–2059. [Google Scholar]
  5. Leng, Z.; Fan, Y.; Lu, W.; Zhou, J. Analysis of explosion energy transmission and rock breaking effect under the condition of double-point blasting in the hole. Chin. J. Rock Mech. Eng. 2019, 38, 2451–2462. [Google Scholar]
  6. Wu, H.; Gong, M. Calculation and application of hole-by-hole blasting vibration synthesis based on the actual delay range of the detonator. Blasting Vib. 2019, 39, 02520201–02520212. [Google Scholar]
  7. Beckel, E.; Oyler, K.; Mehta, N.; Khatri, N.; Marin, J.; Shah, A.; Cordaro-Gioia, E.; Decker, R.; Grau, H.; Stec, D. Primary explosive processing in the resonant acoustic mixer. Propellants Explos. Pyrotech. 2021, 46, 697–704. [Google Scholar] [CrossRef]
  8. Babanouri, N.; Abdolahpour, M.; Dehghani, H. Modeling blast-induced fragmentation of jointed rock mass using voronoi discrete-element method. Int. J. Geomech. 2020, 20, 04020117. [Google Scholar] [CrossRef]
  9. Han, D.Y.; Yang, H. Effects of tensile stresses on wave propagation across stylolitic rock joints. Int. J. Rock Mech. Min. Sci. 2021, 139, 104617. [Google Scholar] [CrossRef]
  10. Chai, S.B.; Wang, H.; Yu, L.Y.; Shi, J.H. Experimental study on static and dynamic compression mechanical properties of filled rock joints. Lat. Am. J. Solids Struct. 2020, 17, e264. [Google Scholar] [CrossRef]
  11. Lak, M.; Marji, M.F.; Bafghi, A.R.Y.; Abdollahipour, A. Discrete element modeling of explosion-induced fracture extension in jointed rock masses. J. Min. Environ. 2019, 10, 125–138. [Google Scholar]
  12. Dong, Q.; Li, X.P.; Huang, J.H. Model test study on cylindrical blasting stress wave propagation across jointed rock mass with different initial stresses. Adv. Civ. Eng. 2020, 8, 8881302. [Google Scholar] [CrossRef]
  13. Dunlop, E.C.; Salmachi, A.; McCabe, P.J. Investigation of increasing hydraulic fracture conductivity within producing ultra-deep coal seams using time-lapse rate transient analysis: A long-term pilot experiment in the Cooper Basin, Australia. Int. J. Coal Geol. 2020, 220, 103363. [Google Scholar] [CrossRef]
  14. Huang, L.; Liu, J.; Zhang, F.; Dontsov, E.; Damjanac, B. Exploring the influence of rock inherent heterogeneity and grain size on hydraulic fracturing using discrete element modeling. Int. J. Solids Struct. 2019, 176–177, 207–220. [Google Scholar] [CrossRef]
  15. Wang, X.; Cai, M. A comprehensive parametric study of grain-based models for rock failure process simulation. Int. J. Rock Mech. Min. Sci. 2019, 115, 60–76. [Google Scholar] [CrossRef]
  16. Chen, J.; Liu, P.; Zhao, H.; Zhang, C.; Zhang, J. Analytical studying the axial performance of fully encapsulated rock bolts. Eng. Fail. Anal. 2021, 128, 105580. [Google Scholar] [CrossRef]
  17. Chen, J.; Zhao, H.; He, F.; Zhang, J.; Tao, K. Studying the performance of fully encapsulated rock bolts with modified structural elements. Int. J. Coal Sci. Technol. 2021, 8, 64–76. [Google Scholar] [CrossRef]
  18. Chen, J.; Zhao, Y.; Zhao, H.; Zhang, J.; Zhang, C.; Li, D. Analytic study on the force transfer of full encapsulating rockbolts subjected to tensile force. Int. J. Appl. Mech. 2021, 13, 2150097. [Google Scholar] [CrossRef]
  19. He, Q.; Lei, Z.; Li, Y. Simulating Hydraulic Fracture Re-orientation from Oriented Perforations in Heterogeneous Rocks with An Improved Discrete Element Method. Rock Mech. Rock Eng. 2021, 54, 2859–2879. [Google Scholar] [CrossRef]
  20. Cai, R.; Li, Y.; Zhang, C. Damage assessment of prefabricated prestressed channel slab under plane charge blast. Eng. Struct. 2021, 246, 113021. [Google Scholar] [CrossRef]
  21. Wu, S.; Li, J.; Guo, J.; Shi, G.; Gu, Q.; Lu, C. Stress corrosion cracking fracture mechanism of cold-drawn high-carbon cable bolts. Mater. Sci. Eng. A 2020, 769, 138479. [Google Scholar] [CrossRef]
  22. Wu, S.; Ramandi, H.L.; Hagan, P.C.; Crosky, A.; Saydam, S. Mineralogically influenced stress corrosion cracking of rockbolts and cable bolts in underground mines. Int. J. Rock Mech. Min. Sci. 2019, 119, 109–116. [Google Scholar] [CrossRef]
  23. Wu, S.; Zhang, X.; Li, J.; Wang, Z. Investigation for influences of seepage on mechanical properties of rocks using acoustic emission technique. Geofluids 2020, 1155, 10–19. [Google Scholar] [CrossRef]
  24. Henry, J. Explosive Dynamics and Its Applications; Xiong, J., Ed.; Science Press: Beijing, China, 1981. [Google Scholar]
  25. Gao, Q.; Lu, W.; Leng, Z. Research on the control effect of the initiation position in the hole on the energy transmission of the explosion in rock blasting. Chin. J. Rock Eng. 2020, 42, 2050–2059. [Google Scholar]
  26. Zhang, P.; Bai, R.; Sun, X. A Study of Millisecond Blasting on High Bench at Barun Iron Ore Operation. Geofluids 2021, 13, 3645438. [Google Scholar] [CrossRef]
  27. Han, Z.; Li, D.Y.; Tao, Z.; Zhu, Q.; Ranjith, P.G. Experimental study of stress wave propagation and energy characteristics across rock specimens containing cemented mortar joint with various thickness. Int. J. Rock Mech. Min. Sci. 2020, 131, 104352. [Google Scholar] [CrossRef]
  28. Shu, P.-Y.; Lin, C.-Y.; Li, H.-H.; Cheng, T.-W.; Ueng, T.-H.; Wang, T.-T. Dynamic response of rock containing regular sawteeth joints under various loading rates and angles of application. Appl. Sci. 2020, 10, 5204. [Google Scholar] [CrossRef]
  29. Hu, Y.G.; Yang, Z.W.; Huang, S.L.; Lu, W.B.; Zhao, G. A new safety control method of blasting excavation in high rock slope with joints. Rock Mech. Rock Eng. 2020, 53, 3015–3029. [Google Scholar] [CrossRef]
  30. Zhu, J.B.; Li, Y.S.; Peng, Q.; Deng, X.F.; Gao, M.Z.; Zhang, Z.J. Stress wave propagation across jointed rock mass under dynamic extension and its effect on dynamic response and supporting of underground opening. Tunn. Undergr. Space Technol. Inc. Trenchless Technol. Res. 2021, 108, 103648. [Google Scholar] [CrossRef]
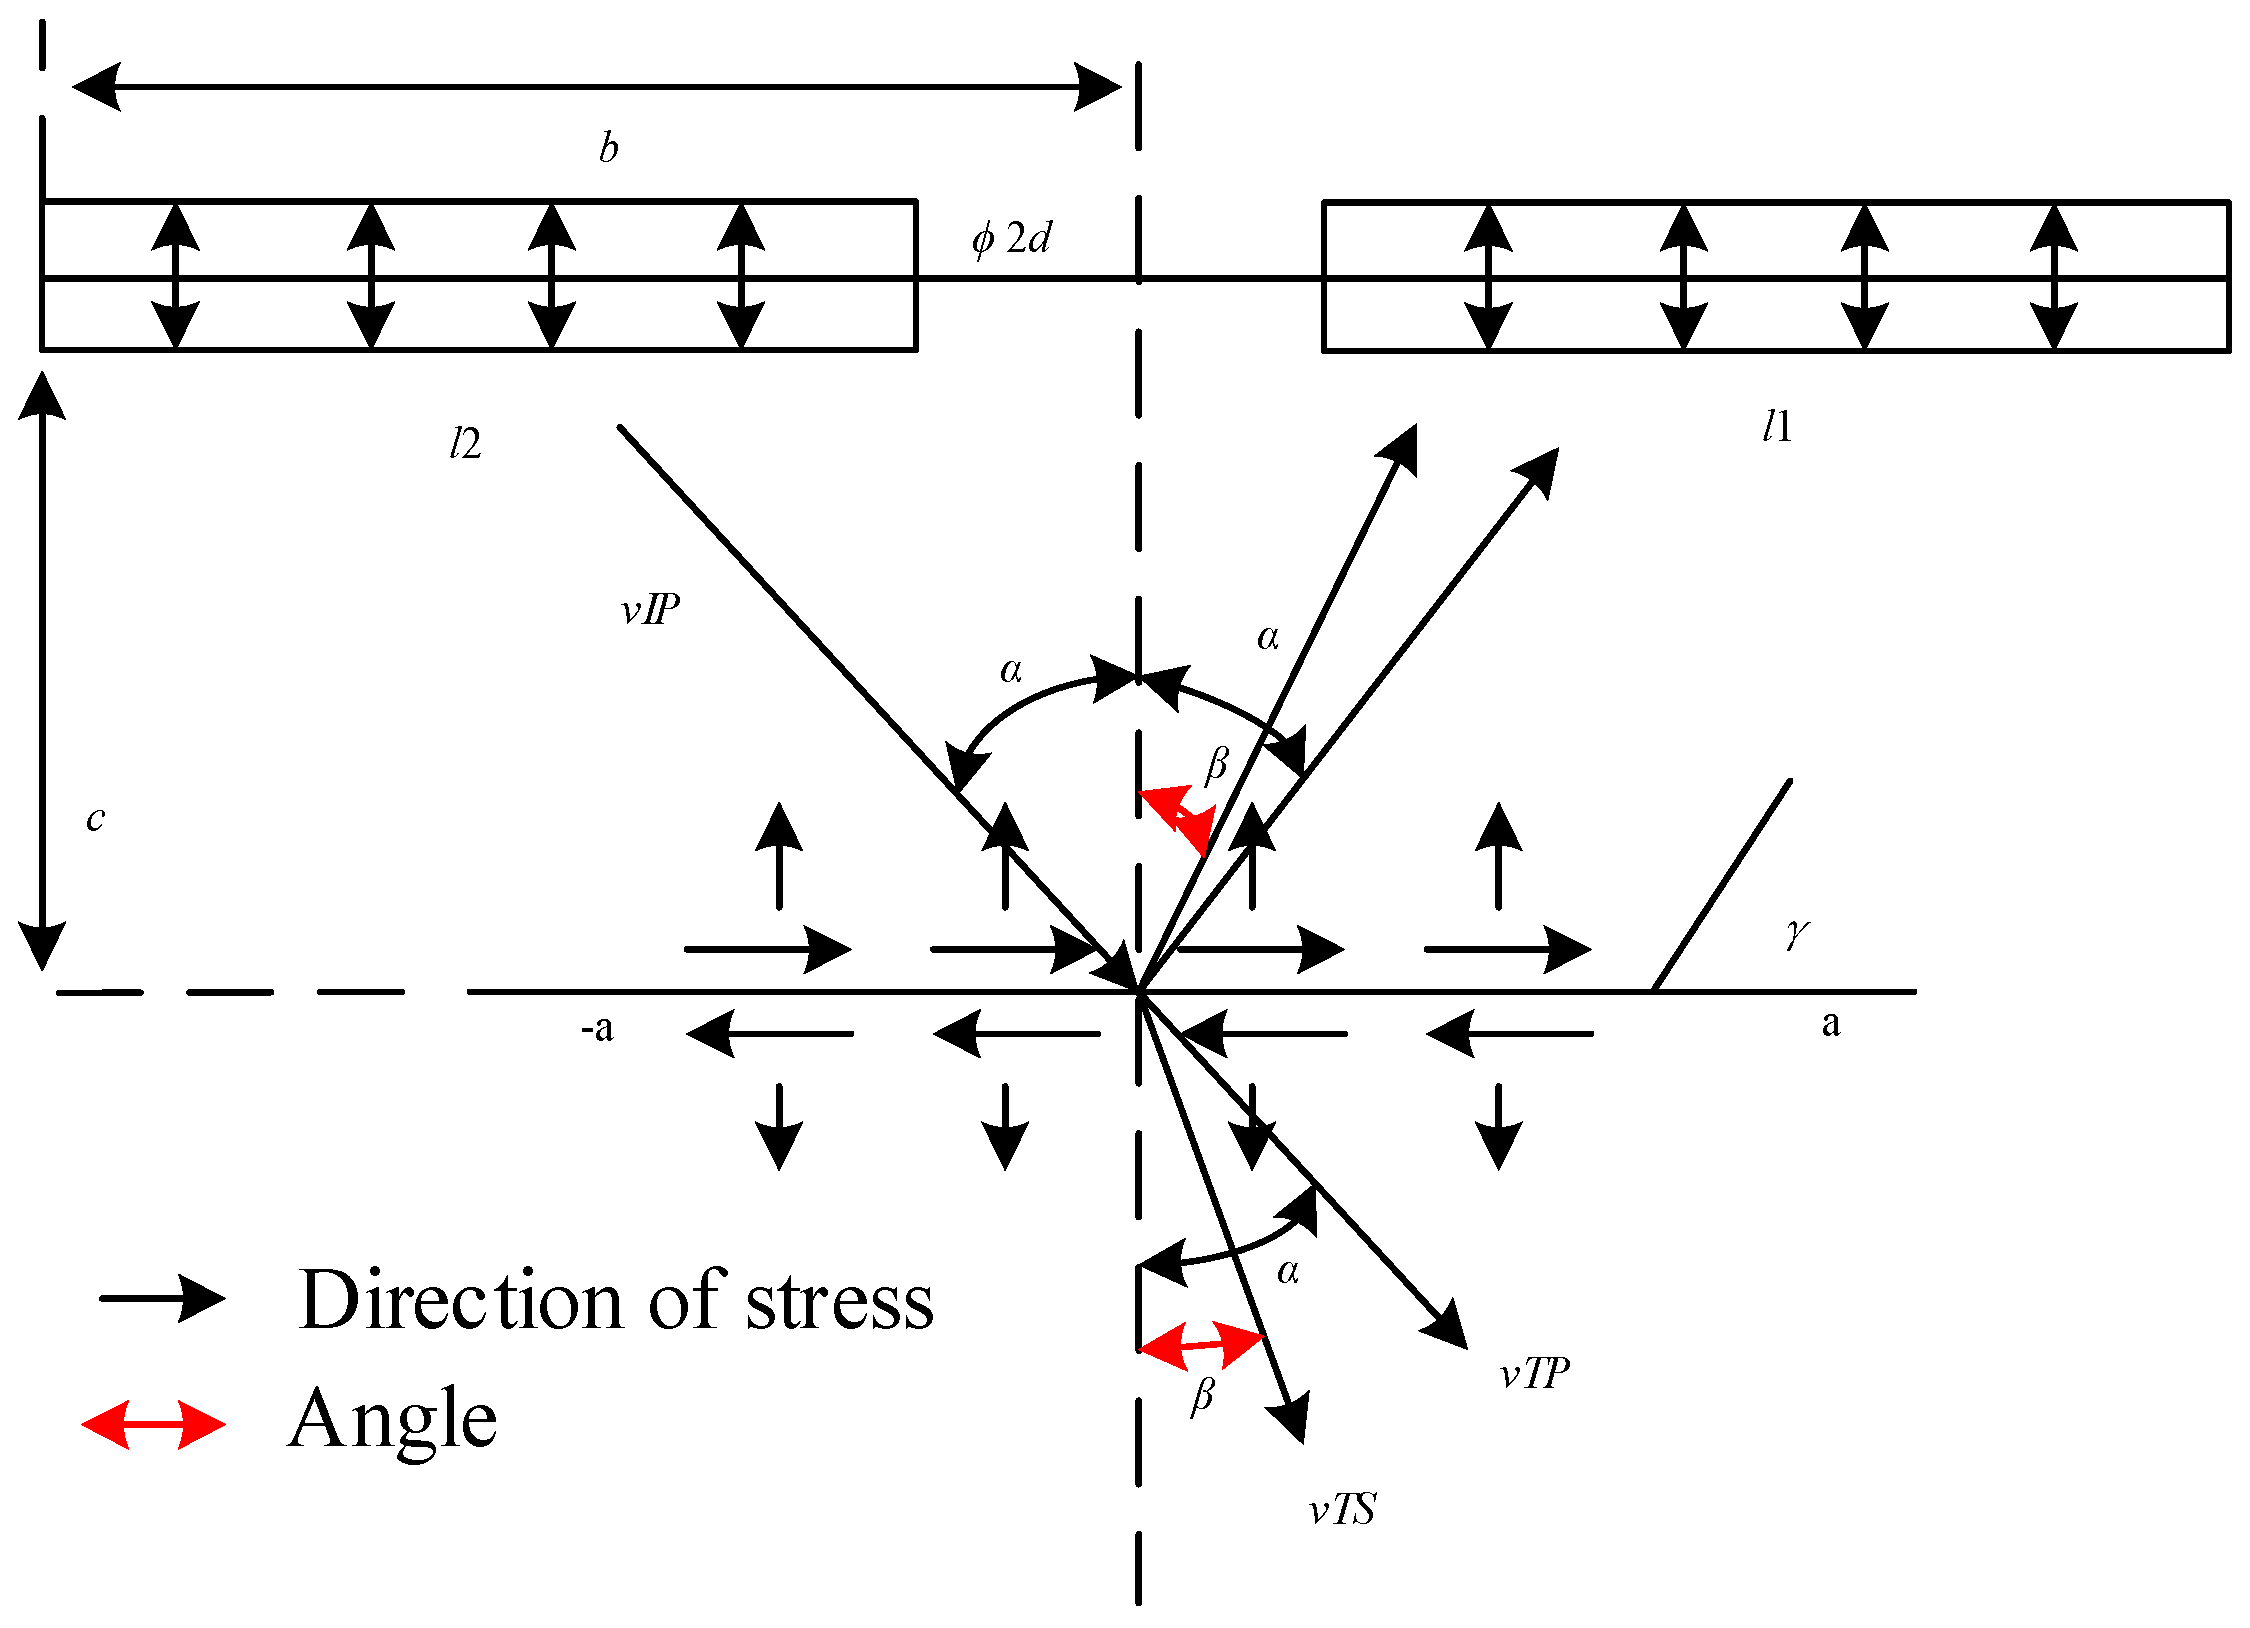
Figure 1. Delay blasting hole model within fractured rock mass.
Applsci 13 10275 g001
Figure 2. Vibration velocity function of incident particle.
Applsci 13 10275 g002
Figure 3. Stress and deformation contour of joints post blasting shock wave.
Applsci 13 10275 g003
Figure 4. Blasting model of micro-delayed holes. A—Stemming 7 m, B—Explosive 6 m, C—Interval 5 m, D—Explosive 8 m, E—Joint.
Applsci 13 10275 g004
Figure 5. Contours of effective stress. (a) t = 1197 μs, (b) t = 1498 μs, (c) t = 2298 μs, (d) t = 2999 μs, (e) t = 3598 μs, (f) t = 4798 μs.
Applsci 13 10275 g005
Figure 6. Change in peak effective stress at selected points. (a) Finite element simulation results, (b) theoretical calculation results.
Applsci 13 10275 g006
Table 1. Stemming Material Properties.
Density (g/cm3)Young’s Modulus (MPa)Poisson’s RatioCompressive Strength (MPa)Tangent Modulus (MPa)
1.851.20.380.80.1
Table 2. Rock properties within highwall bench.
Density (g/cm3)Young’s Modulus (×104 MPa)Poisson’s RatioTensile Strength (MPa)Compressive Strength (MPa)
2.4350.265130
Table 3. Material properties of emulsion explosives.
Density (g/cm3)Blasting Speed (cm/us)Blasting Pressure (GPa)ABR1wR2
1.200.40502.14 × 10111.82 × 1084.150.30.95
Disclaimer/Publisher’s Note: The statements, opinions and data contained in all publications are solely those of the individual author(s) and contributor(s) and not of MDPI and/or the editor(s). MDPI and/or the editor(s) disclaim responsibility for any injury to people or property resulting from any ideas, methods, instructions or products referred to in the content.