Multivariate Statistical Analyses and Potentially Toxic Elements Pollution Assessment of Pyroclastic Products from Mt. Etna, Sicily, Southern Italy
Abstract
1. Introduction
2. Materials and Methods
2.1. Samples Collection
2.2. Inductively Coupled Plasma Mass Spectrometry (ICP-MS) Measurements
2.3. Level of Potentially Toxic Elements Pollution Assessment
2.3.1. The Enrichment Factor
2.3.2. The Geo-Accumulation Index
2.3.3. The Contamination Factor
2.3.4. The Pollution Load Index
2.4. Statistical Analysis
3. Results and Discussion
3.1. Potentially Toxic Elements Analysis
3.2. Estimation of the Level of Potentially Toxic Elements Pollution
3.2.1. EF
3.2.2. Igeo
3.2.3. CF
3.2.4. PLI
3.3. Statistical Features
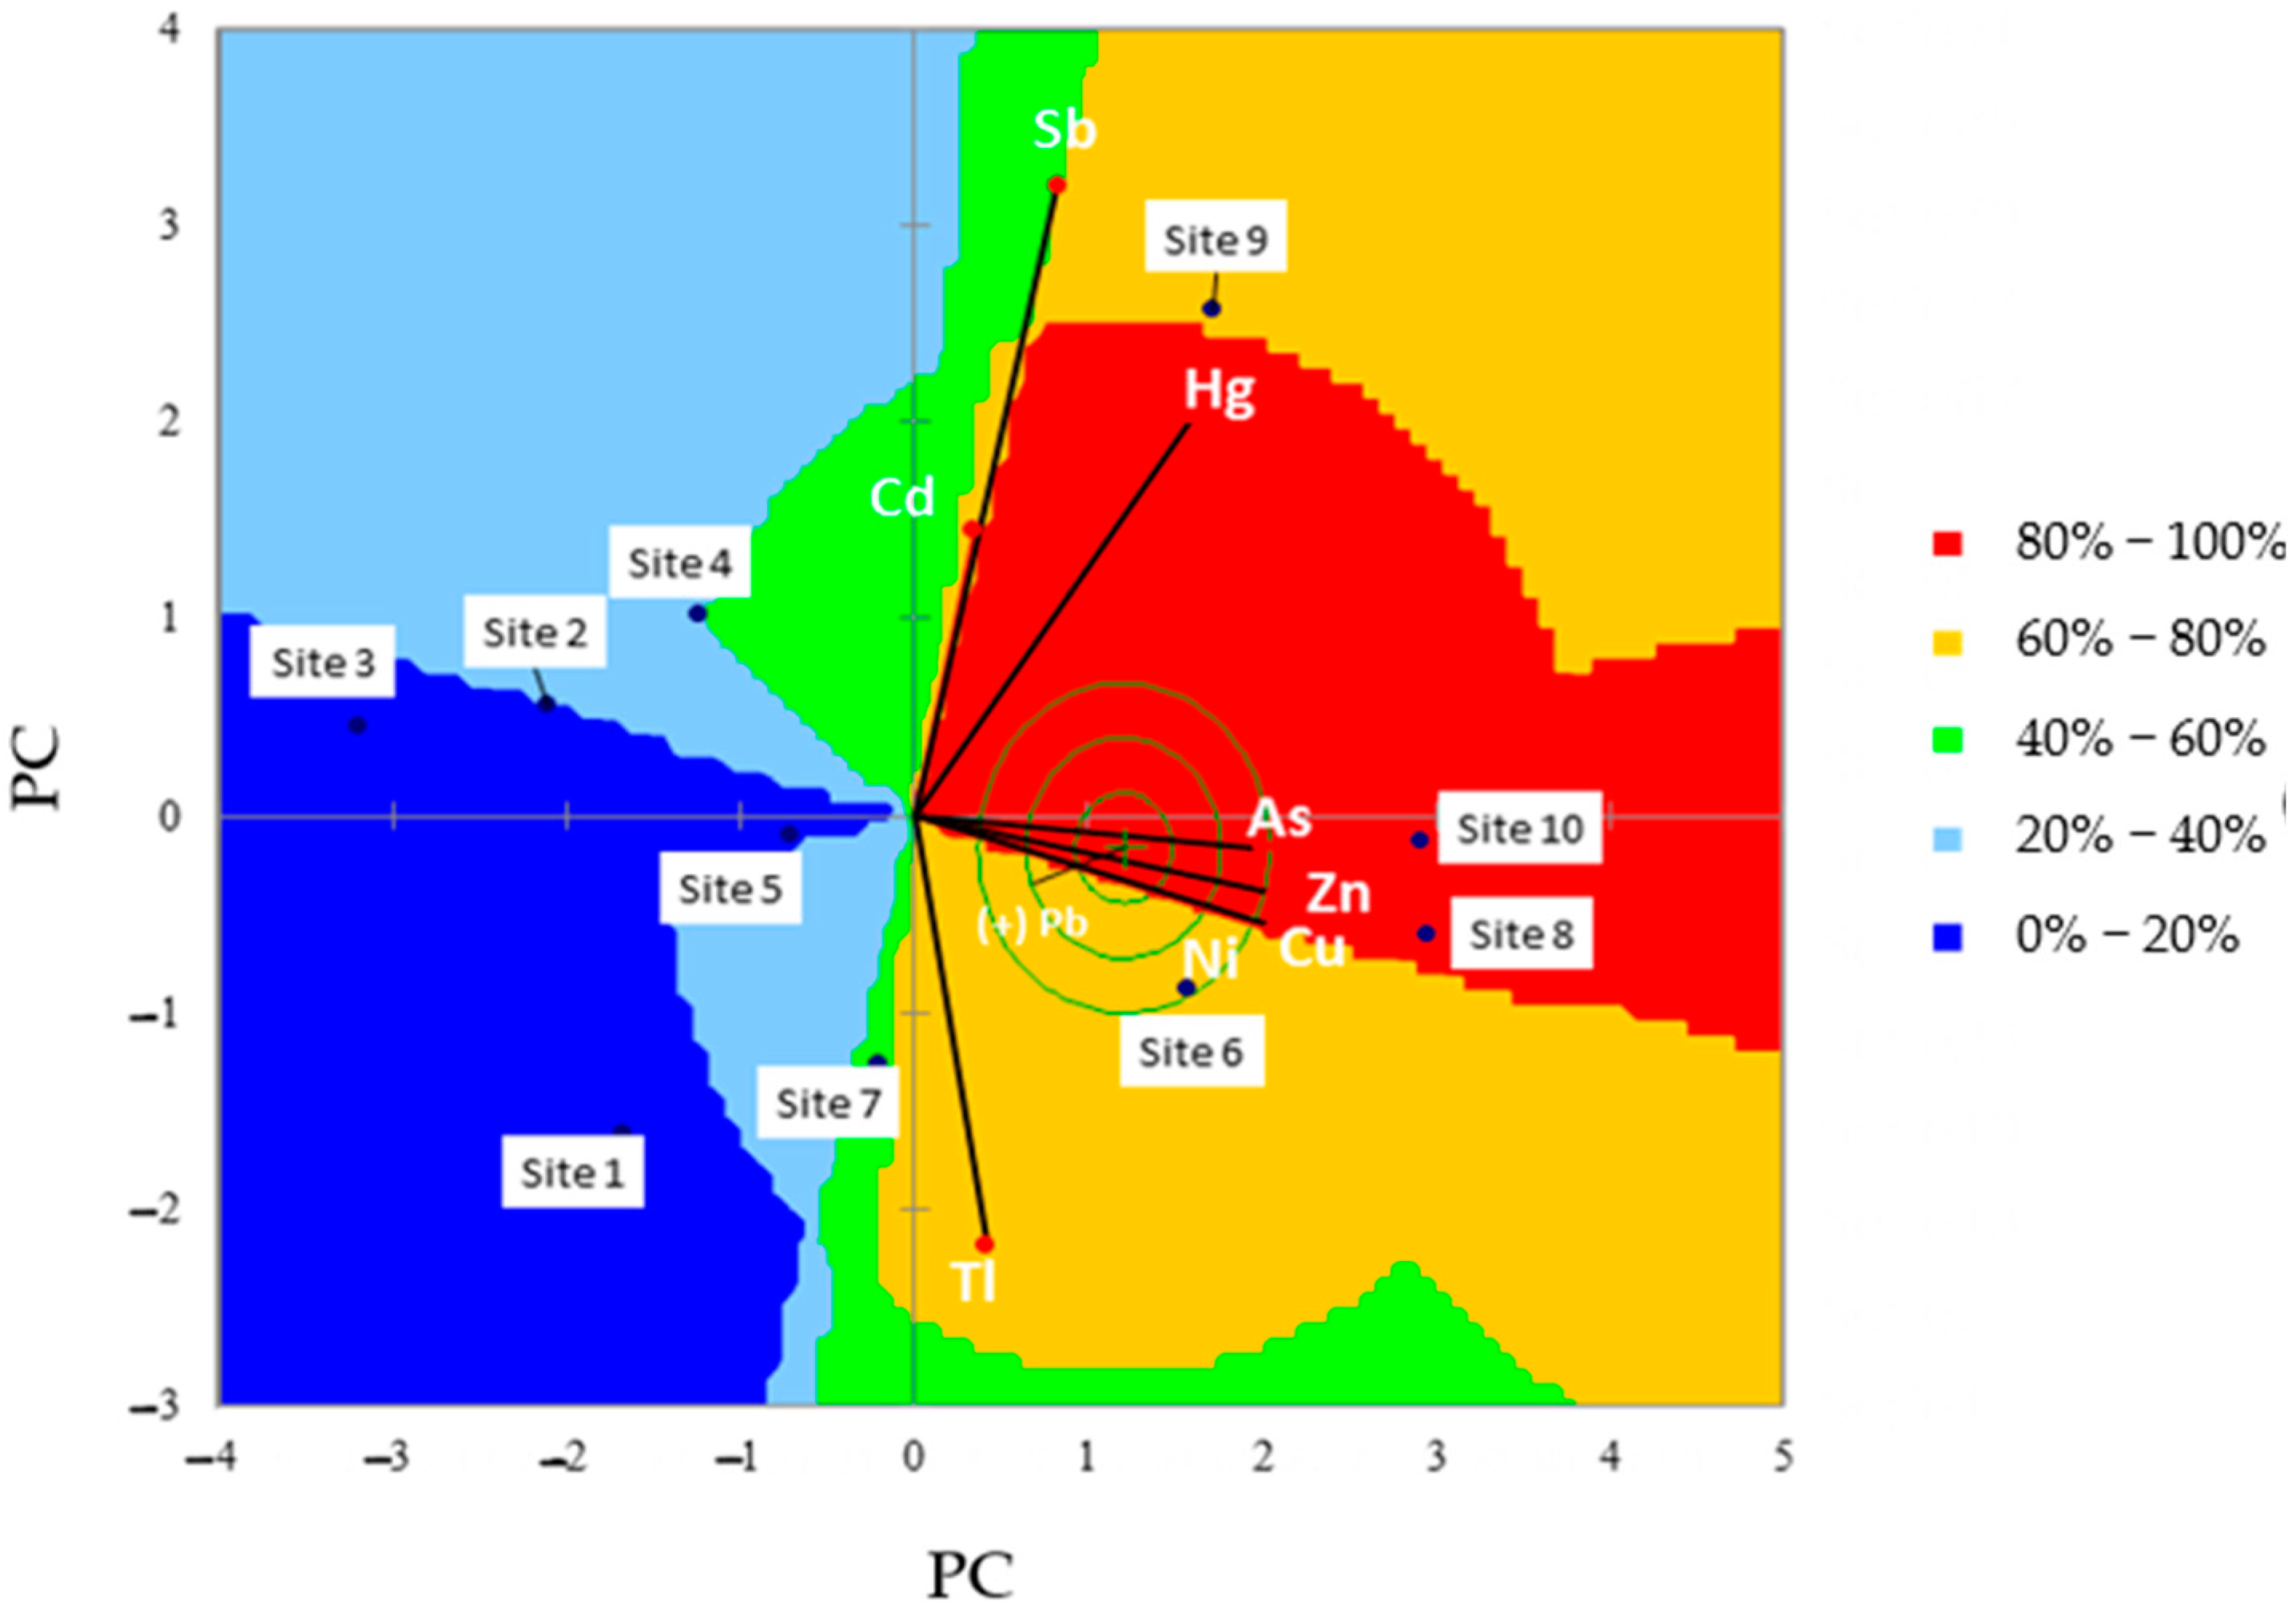
- Samples from the ID 8 and 10 sites, with a degree of similarity equal to 100%, and samples from the ID 6 and 9 sites, with a degree of similarity equal to 78%. These pyroclastic products can be ideally grouped within the same cluster. However, while samples from the ID 6, 8 and 10 sites are pyroclastic wastes, those from the ID 9 site were collected as a fresh eruption sample;
- All other samples are placed in the quadrants on the left side of the MDA graph. In particular, samples from ID 7 site have a degree of similarity of 56% (green color), and belong to the category of freshly erupted air-fall pyroclastic products;
- The remaining samples show heterogeneous degrees of similarity, but commonly less than 40% for all of them. This last hypothetical cluster seems to consist of the remaining fresh eruption samples (ID 1, 4 and 5 sites) and the pyroclastic waste samples (ID 2 and 3 sites), which probably have undergone pollution phenomena capable of determining potentially toxic elements concentrations similar to those shown by the fresh eruption pyroclastic samples.
4. Conclusions
Author Contributions
Funding
Institutional Review Board Statement
Informed Consent Statement
Acknowledgments
Conflicts of Interest
References
- Liang, L.; Gong, P. Urban and air pollution: A multi-city study of long-term effects of urban landscape patterns on air quality trends. Sci. Rep. 2020, 10, 18618. [Google Scholar] [CrossRef]
- Masindi, V.; Liang, L.; Gong, P. Environmental Contamination by Heavy Metals. Heavy Metals 2018, 10, 115–132. [Google Scholar]
- Ali, H.; Khan, E.; Ilahi, I. Environmental Chemistry and Ecotoxicology of Hazardous Heavy Metals: Environmental Persistence, Toxicity, and Bioaccumulation. J. Chem. 2019, 2019, 6730305. [Google Scholar] [CrossRef]
- Briffa, J.; Sinagra, E.; Blundell, R. Heavy metal pollution in the environment and their toxicological effects on humans. Heliyon 2020, 6, e04691. [Google Scholar] [CrossRef] [PubMed]
- Tchounwou, P.B.; Yedjou, C.G.; Patlolla, A.K.; Sutton, D.J. Heavy metal toxicity and the environment. Exp. Suppl. 2012, 101, 133–164. [Google Scholar] [CrossRef]
- Torrisi, L.; Caridi, F.; Giuffrida, L. Protons and ion acceleration from thick targets at 1010 W/cm2 laser pulse intensity. Laser and Part. Beams. 2011, 29, 29–37. [Google Scholar] [CrossRef]
- Torrisi, L.; Visco, A.M.; Campo, N.; Caridi, F. Pulsed laser treatments of polyethylene films. Nucl. Instr. and Meth. in Phys. Res. Sect. B. 2010, 268, 3117–3121. [Google Scholar] [CrossRef]
- Jaishankar, M.; Tseten, T.; Anbalagan, N.; Mathew, B.B.; Beeregowda, K.N. Toxicity, mechanism and health effects of some heavy metals. Interdiscip. Toxicol. 2014, 7, 60–72. [Google Scholar] [CrossRef] [PubMed]
- Saleh, M.Q.; Hamad, Z.A.; Hama, J.R. Assessment of some heavy metals in crude oil workers from Kurdistan Region, northern Iraq. Environ. Monit. Assess. 2021, 193, 49. [Google Scholar] [CrossRef]
- Iwuoha, G.N.; Osuji, L.; Horsfall, M.J. Index model analysis approach to heavy metal pollution assessment in sediments of Nworie and Otamiri Rivers in Imo State of Nigeria. Res. J. Chem. Sci. 2012, 2, 1–8. [Google Scholar]
- Caridi, F.; D’Agostino, M.; Belvedere, A.; Marguccio, S.; Belmusto, G.; Gatto, M.F. Diagnostics techniques and dosimetric evaluations for environmental radioactivity investigations. J. Instrum. 2016, 11, C10012. [Google Scholar] [CrossRef]
- Caridi, F.; D’Agostino, M.; Messina, M.; Marcianò, G.; Grioli, L.; Belvedere, A.; Marguccio, S.; Belmusto, G. Lichens as environmental risk detectors. Eur. Phys. J. Plus 2017, 132, 189. [Google Scholar] [CrossRef]
- Ravisankar, R.; Vanasundari, K.; Chandrasekaran, A.; Rajalakshmi, A.; Suganya, M.; Vijayagopal, P.; Meenakshisundaram, V. Measurement of natural radioactivity in building materials of Namakkal, Tamil Nadu, India using gamma-ray spectrometry. Appl. Radiat. Isot. 2012, 70, 699–704. [Google Scholar] [CrossRef]
- Raja, S.L.; Marpaung, H.; Simanjuntak, S.; Simanjuntak, C.; Pudjadi, E. Distribution and risk assessment of natural radioactive elements in volcanic ashes, cold lava, river waters due to volcanic eruption of Mount Sinabung. AIP Conf. Proc. 2021, 2342, 020008. [Google Scholar] [CrossRef]
- Zagorodnyuk, L.H.; Mestnikov, A.E.; Makhortov, D.S.; Akhmed, A.A.A. Mixed binders with the use of volcanic ash. Lect. Notes Civ. Eng. 2021, 95, 9–15. [Google Scholar] [CrossRef]
- Ahmedai, M.A.; Ahmed, S.A.M.; Ahmed, Y.H.; Ibrahiem, E.-S.M. Tagabo Volcanic Ash as Cement Replacing Materials. FES J. Eng. Sci. 2021, 9, 35–39. [Google Scholar] [CrossRef]
- Gvirtzman, Z.; Nur, A. The formation of Mount Etna as the consequence of slab rollback. Nature 1999, 401, 782–785. [Google Scholar] [CrossRef]
- Tanguy, J.-C.; Condomines, M.; Kieffer, G. Evolution of the Mount Etna magma: Constraints on the present feeding system and eruptive mechanism. J. Volcanol. Geotherm. Res. 1997, 75, 221–250. [Google Scholar] [CrossRef]
- Mezzasalma, A.M.; Mondio, G.; Serafino, T.; Caridi, F.; Torrisi, L. Electronic properties of thin films of laser-ablated Al2O3. Appl. Surf. Sci. 2009, 255, 4123–4128. [Google Scholar] [CrossRef]
- Giorgia Potortì, A.; Francesco Mottese, A.; Rita Fede, M.; Sabatino, G.; Dugo, G.; Lo Turco, V.; Costa, R.; Caridi, F.; Di Bella, M.; Di Bella, G. Multielement and chemometric analysis for the traceability of the Pachino Protected Geographical Indication (PGI) cherry tomatoes. Food Chem. 2022, 386, 132746. [Google Scholar] [CrossRef] [PubMed]
- Mottese, A.F.; Sabatino, G.; Di Bella, M.; Fede, M.R.; Parisi, F.; Marcianò, G.; Tripodo, A.; Italiano, F.; Dugo, G.; Caridi, F. Contribution of soil compositions, harvested times and varieties on chemical fingerprint of Italian and Turkish citrus cultivars. Int. J. Food Sci. Technol. 2021, 56, 2628–2639. [Google Scholar] [CrossRef]
- Stewart, C.; Horwell, C.; Plumlee, G.; Cronin, S.; Delmelle, P.; Baxter, P.; Calkins, J.; Damby, D.; Morman, S.; Oppenheimer, C. Protocol for analysis of volcanic ash samples for assessment of hazards from leachable elements. Int. Volcan. Health Hazards Netw. Publ. 2013, 1, 1–22. [Google Scholar]
- EPA METHOD 3051a:2007. 2007. Available online: https://www.epa.gov/sites/default/files/2015-12/documents/3051a.pdf (accessed on 1 September 2022).
- Caridi, F.; Marguccio, S.; D’Agostino, M.; Belvedere, A.; Belmusto, G. Natural radioactivity and metal contamination of river sediments in the Calabria region, south of Italy. Eur. Phys. J. Plus 2016, 131, 155. [Google Scholar] [CrossRef]
- Caridi, F.; Messina, M.; D’Agostino, M. An investigation about natural radioactivity, hydrochemistry, and metal pollution in groundwater from Calabrian selected areas, southern Italy. Environ. Earth Sci. 2017, 76, 668. [Google Scholar] [CrossRef]
- EPA METHOD 6020a:2007. 2007. Available online: https://19january2017snapshot.epa.gov/sites/production/files/2015-07/documents/epa-6020a.pdf (accessed on 2 September 2022).
- ACCREDIA. Available online: https://www.accredia.it/ (accessed on 2 September 2022).
- Turekian, K.K.; Haven, N.; Hans, K.; Universitat, W.M. Der Distribution of the Elements in Some Major Units of the Earth’s Crust. America (NY) 1961, 1, 175–192. [Google Scholar]
- Caridi, F.; D’Agostino, M.; Marguccio, S.; Belvedere, A.; Belmusto, G.; Marcianò, G.; Sabatino, G.; Mottese, A. Radioactivity, granulometric and elemental analysis of river sediments samples from the coast of Calabria, south of Italy. Eur. Phys. J. Plus 2016, 131, 136. [Google Scholar] [CrossRef]
- Håkanson, L. An Ecological Risk Index for Aquatic Pollution Control—A Sedimentological Approach. Water Res. 1980, 14, 975–1001. [Google Scholar] [CrossRef]
- Chandrasekaran, A.; Ravisankar, R.; Harikrishnan, N.; Satapathy, K.K.; Prasad, M.V.R.; Kanagasabapathy, K.V. Multivariate statistical analysis of heavy metal concentration in soils of Yelagiri Hills, Tamilnadu, India—Spectroscopical approach. Spectrochim. Acta Part A Mol. Biomol. Spectrosc. 2015, 137, 589–600. [Google Scholar] [CrossRef]
- Ramasamy, V.; Meenakshisundaram, V.; Venkatachalapathy, R.; Ponnusamy, V. Influence of mineralogical and heavy metal composition on natural radionuclide concentrations in the river sediments. Appl. Radiat. Isot. 2011, 69, 1466–1474. [Google Scholar] [CrossRef]
- Caridi, F.; D’Agostino, M.; Belvedere, A.; Mottese, A.F. Multi-element Analysis and Geographical Origin Classification of Italian (Calabrian) Wines. Curr. Nutr. Food Sci. 2020, 16, 1259–1264. [Google Scholar] [CrossRef]
- Caridi, F.; Acri, G.; Belvedere, A.; Crupi, V.; Agostino, M.D.; Marguccio, S.; Messina, M.; Paladini, G.; Venuti, V.; Majolino, D. Evaluation of the Radiological and Chemical Risk for Public Health from Flour Sample Investigation. Appl. Sci. 2021, 11, 3646. [Google Scholar] [CrossRef]
- Mottese, A.F.; Fede, M.R.; Caridi, F.; Sabatino, G.; Marcianò, G.; Calabrese, G.; Albergamo, A.; Dugo, G. Chemometrics and innovative multidimensional data analysis (MDA) based on multi-element screening to protect the Italian porcino (Boletus sect. Boletus) from fraud. Food Control 2020, 110, 107004. [Google Scholar] [CrossRef]
- Bondarev, A.E.; Galaktionov, V.A. Multidimensional data analysis and visualization for time-dependent CFD problems. Program. Comput. Softw. 2015, 41, 247–252. [Google Scholar] [CrossRef]
- D. Lgs. 152/2006. Available online: https://www.normattiva.it/uri-res/N2Ls?urn:nir:stato:decreto.legislativo:2006-04-03;152 (accessed on 2 September 2022).
- Hassan, N.M.; Rasmussen, P.E.; Dabek-Zlotorzynska, E.; Celo, V.; Chen, H. Analysis of Environmental Samples Using Microwave-Assisted Acid Digestion and Inductively Coupled Plasma Mass Spectrometry: Maximizing Total Element Recoveries. Water. Air. Soil Pollut. 2007, 178, 323–334. [Google Scholar] [CrossRef]
- Zheng, L.-G.; Liu, G.-J.; Kang, Y.; Yang, R.-K. Some potential hazardous trace elements contamination and their ecological risk in sediments of western Chaohu Lake, China. Environ. Monit. Assess. 2010, 166, 379–386. [Google Scholar] [CrossRef]
- Naji, A.; Ismail, A. Assessment of Metals Contamination in Klang River Surface Sediments by using Different Indexes. EnvironmentAsia 2011, 4, 30–38. [Google Scholar] [CrossRef]
- Karimi, B.; Masson, V.; Guilland, C.; Leroy, E.; Pellegrinelli, S.; Giboulot, E.; Maron, P.-A.; Ranjard, L. Ecotoxicity of copper input and accumulation for soil biodiversity in vineyards. Environ. Chem. Lett. 2021, 19, 2013–2030. [Google Scholar] [CrossRef]
- Pietrzak, U.; McPhail, D.C. Copper accumulation, distribution and fractionation in vineyard soils of Victoria, Australia. Geoderma 2004, 122, 151–166. [Google Scholar] [CrossRef]
- Yuan, H.; Song, J.; Li, X.; Li, N.; Duan, L. Distribution and contamination of heavy metals in surface sediments of the South Yellow Sea. Mar. Pollut. Bull. 2012, 64, 2151–2159. [Google Scholar] [CrossRef]
- Selvaraj, K.; Ram Mohan, V.; Szefer, P. Evaluation of metal contamination in coastal sediments of the Bay of Bengal, India: Geochemical and statistical approaches. Mar. Pollut. Bull. 2004, 49, 174–185. [Google Scholar] [CrossRef]
- Mohd Razali, N.; Yap, B. Power comparisons of some selected normality tests. In Proceedings of the Regional Conference on Statistical Sciences 2010 (RCSS’10), Kota Bharu, Malaysia, 13–14 June 2010; Volume 1, pp. 126–138. [Google Scholar]
- Weide, A.C.; Beauducel, A. Varimax Rotation Based on Gradient Projection Is a Feasible Alternative to SPSS. Front. Psychol. 2019, 10, 1–14. [Google Scholar] [CrossRef]
- Paez, P.A.; Cogliati, M.G.; Caselli, A.T.; Monasterio, A.M. An analysis of volcanic SO2 and ash emissions from Copahue volcano. J. S. Am. Earth Sci. 2021, 110, 103365. [Google Scholar] [CrossRef]
- Fraire, M. Statistical methods for exploratory multidimensional data analysis on time use. Statistica 2013, 69, 317–341. [Google Scholar]


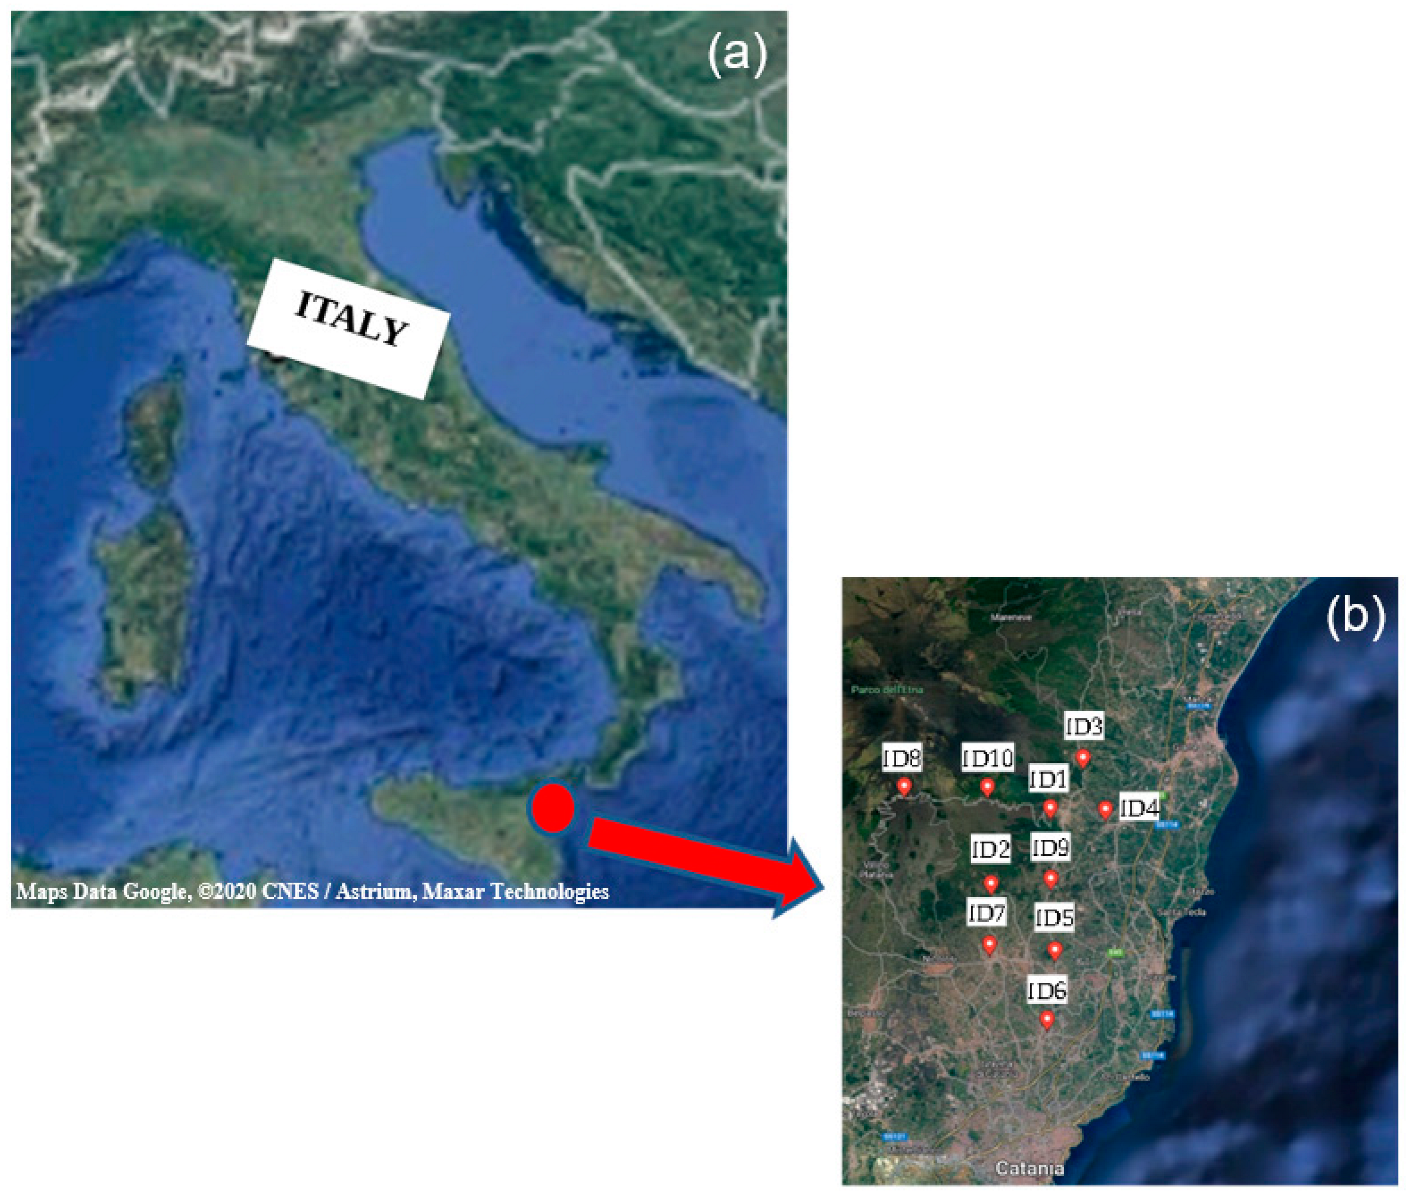
| Site ID | GPS Coordinates | |
|---|---|---|
| Latitude | Longitude | |
| 1 | 37.68864 | 15.09499 |
| 2 | 37.64975 | 15.05663 |
| 3 | 37.71456 | 15.11615 |
| 4 | 37.68809 | 15.13123 |
| 5 | 37.61574 | 15.09846 |
| 6 | 37.57984 | 15.09326 |
| 7 | 37.61873 | 15.05600 |
| 8 | 37.69899 | 15.00120 |
| 9 | 37.65249 | 15.09540 |
| 10 | 37.69900 | 15.05389 |
| ICP-MS Analysis | |||||||||||
|---|---|---|---|---|---|---|---|---|---|---|---|
| Site ID | |||||||||||
| 1 | 2 | 3 | 4 | 5 | 6 | 7 | 8 | 9 | 10 | Threshold Limit | |
| CAs | 1.73 | 1.74 | 1.72 | 2.09 | 1.85 | 2.11 | 1.98 | 2.32 | 1.97 | 2.14 | 20 |
| CCd | 0.10 | 0.15 | 0.10 | 0.11 | 0.10 | 0.13 | 0.10 | 0.11 | 0.12 | 0.12 | 2 |
| CCu | 76.91 | 76.83 | 76.04 | 74.02 | 82.61 | 87.23 | 82.45 | 85.23 | 85.08 | 92.91 | 120 |
| CHg | 0.03 | 0.03 | 0.03 | 0.03 | 0.03 | 0.03 | 0.03 | 0.03 | 0.04 | 0.04 | 1 |
| CNi | 16.61 | 14.95 | 14.32 | 15.06 | 15.91 | 17.45 | 17.81 | 21.95 | 18.82 | 18.32 | 120 |
| CPb | 4.93 | 5.02 | 4.67 | 5.17 | 5.18 | 5.55 | 5.23 | 5.16 | 5.02 | 5.46 | 100 |
| CSb | 0.08 | 0.08 | 0.08 | 0.15 | 0.09 | 0.12 | 0.09 | 0.11 | 0.35 | 0.10 | 10 |
| CTl | 0.11 | 0.09 | 0.08 | 0.07 | 0.08 | 0.09 | 0.09 | 0.08 | 0.09 | 0.09 | 1 |
| CZn | 62.15 | 58.45 | 56.56 | 58.41 | 62.32 | 69.32 | 63.39 | 80.23 | 68.65 | 69.05 | 150 |
| Site ID | Metal | Index of contamination | Site ID | Metal | Index of contamination | Site ID | Metal | Index of contamination | |||||||||
| EF | Igeo | CF | PLI | EF | Igeo | CF | PLI | EF | Igeo | CF | PLI | ||||||
| 1 | As | 0.14 | −3.49 | 0.13 | 0.21 | 2 | As | 0.15 | −3.49 | 0.13 | 0.22 | 3 | As | 0.15 | −3.50 | 0.13 | 0.20 |
| Cd | 0.34 | −2.19 | 0.33 | Cd | 0.54 | −1.58 | 0.50 | Cd | 0.37 | −2.17 | 0.33 | ||||||
| Cu | 1.80 | 0.19 | 1.71 | Cu | 1.85 | 0.19 | 1.71 | Cu | 1.89 | 0.17 | 1.69 | ||||||
| Hg | 0.07 | −4.48 | 0.07 | Hg | 0.07 | −4.48 | 0.07 | Hg | 0.08 | −4.48 | 0.07 | ||||||
| Ni | 0.26 | −2.62 | 0.24 | Ni | 0.24 | −2.78 | 0.22 | Ni | 0.24 | −2.83 | 0.21 | ||||||
| Pb | 0.26 | −2.61 | 0.25 | Pb | 0.27 | −2.58 | 0.25 | Pb | 0.26 | −2.68 | 0.23 | ||||||
| Sb | 0.06 | −4.79 | 0.05 | Sb | 0.06 | −4.81 | 0.05 | Sb | 0.06 | −4.81 | 0.05 | ||||||
| Tl | 0.08 | −4.25 | 0.08 | Tl | 0.07 | −4.54 | 0.06 | Tl | 0.06 | −4.71 | 0.06 | ||||||
| Zn | 0.69 | −1.20 | 0.65 | Zn | 0.67 | −1.29 | 0.61 | Zn | 0.67 | −1.33 | 0.59 | ||||||
| Site ID | Metal | Index of contamination | Site ID | Metal | Index of contamination | Site ID | Metal | Index of contamination | |||||||||
| EF | Igeo | CF | PLI | EF | Igeo | CF | PLI | EF | Igeo | CF | PLI | ||||||
| 4 | As | 0.19 | −3.22 | 0.16 | 0.22 | 5 | As | 0.15 | −3.40 | 0.14 | 0.21 | 6 | As | 0.16 | −3.21 | 0.16 | 0.24 |
| Cd | 0.42 | −2.03 | 0.37 | Cd | 0.36 | −2.17 | 0.33 | Cd | 0.43 | −1.79 | 0.43 | ||||||
| Cu | 1.89 | 0.13 | 1.64 | Cu | 1.97 | 0.29 | 1.84 | Cu | 1.90 | 0.37 | 1.94 | ||||||
| Hg | 0.08 | −4.48 | 0.07 | Hg | 0.07 | −4.48 | 0.07 | Hg | 0.07 | −4.48 | 0.07 | ||||||
| Ni | 0.25 | −2.77 | 0.22 | Ni | 0.25 | −2.68 | 0.23 | Ni | 0.25 | −2.55 | 0.26 | ||||||
| Pb | 0.30 | −2.54 | 0.26 | Pb | 0.28 | −2.53 | 0.26 | Pb | 0.27 | −2.43 | 0.28 | ||||||
| Sb | 0.12 | −3.91 | 0.10 | Sb | 0.06 | −4.64 | 0.06 | Sb | 0.08 | −4.23 | 0.08 | ||||||
| Tl | 0.06 | −4.91 | 0.05 | Tl | 0.06 | −4.71 | 0.06 | Tl | 0.06 | −4.54 | 0.06 | ||||||
| Zn | 0.71 | −1.29 | 0.61 | Zn | 0.70 | −1.19 | 0.66 | Zn | 0.72 | −1.04 | 0.73 | ||||||
| Site ID | Metal | Index of contamination | Site ID | Metal | Index of contamination | Site ID | Metal | Index of contamination | |||||||||
| EF | Igeo | CF | PLI | EF | Igeo | CF | PLI | EF | Igeo | CF | PLI | ||||||
| 7 | As | 0.16 | −3.30 | 0.15 | 0.22 | 8 | As | 0.18 | −3.07 | 0.18 | 0.24 | 9 | As | 0.16 | −3.31 | 0.15 | 0.28 |
| Cd | 0.35 | −2.17 | 0.33 | Cd | 0.36 | −2.03 | 0.37 | Cd | 0.42 | −1.91 | 0.40 | ||||||
| Cu | 1.94 | 0.29 | 1.83 | Cu | 1.86 | 0.34 | 1.89 | Cu | 1.98 | 0.33 | 1.89 | ||||||
| Hg | 0.07 | −4.48 | 0.07 | Hg | 0.07 | −4.48 | 0.07 | Hg | 0.11 | −3.91 | 0.10 | ||||||
| Ni | 0.28 | −2.52 | 0.26 | Ni | 0.32 | −2.22 | 0.32 | Ni | 0.29 | −2.44 | 0.28 | ||||||
| Pb | 0.28 | −2.52 | 0.26 | Pb | 0.25 | −2.54 | 0.26 | Pb | 0.27 | −2.58 | 0.25 | ||||||
| Sb | 0.06 | −4.64 | 0.06 | Sb | 0.07 | −4.35 | 0.07 | Sb | 0.25 | −2.68 | 0.23 | ||||||
| Tl | 0.07 | −4.54 | 0.06 | Tl | 0.06 | −4.71 | 0.06 | Tl | 0.07 | −4.54 | 0.06 | ||||||
| Zn | 0.71 | −1.17 | 0.67 | Zn | 0.83 | −0.83 | 0.84 | Zn | 0.76 | −1.05 | 0.72 | ||||||
| Site ID | Metal | Index of contamination | |||||||||||||||
| EF | Igeo | CF | PLI | ||||||||||||||
| 10 | As | 0.17 | −3.19 | 0.16 | 0.25 | ||||||||||||
| Cd | 0.40 | −1.91 | 0.40 | ||||||||||||||
| Cu | 2.00 | 0.46 | 2.06 | ||||||||||||||
| Hg | 0.10 | −3.91 | 0.10 | ||||||||||||||
| Ni | 0.27 | −2.48 | 0.27 | ||||||||||||||
| Pb | 0.27 | −2.46 | 0.27 | ||||||||||||||
| Sb | 0.07 | −4.49 | 0.07 | ||||||||||||||
| Tl | 0.06 | −4.54 | 0.06 | ||||||||||||||
| Zn | 0.73 | −1.05 | 0.73 | ||||||||||||||
| Variables | CAs | CCd | CCu | CHg | CNi | CPb | CSb | CTl | CZn |
|---|---|---|---|---|---|---|---|---|---|
| CAs | 1.00 | 0.03 | 0.61 | 0.43 | 0.76 | 0.67 | 0.19 | −0.15 | 0.80 |
| CCd | 0.03 | 1.00 | 0.15 | 0.13 | −0.05 | 0.24 | 0.16 | −0.04 | 0.04 |
| CCu | 0.61 | 0.15 | 1.00 | 0.68 | 0.68 | 0.71 | 0.18 | 0.27 | 0.72 |
| CHg | 0.43 | 0.13 | 0.68 | 1.00 | 0.44 | 0.30 | 0.55 | 0.01 | 0.45 |
| CNi | 0.76 | −0.05 | 0.68 | 0.44 | 1.00 | 0.39 | 0.28 | 0.23 | 0.97 |
| CPb | 0.67 | 0.24 | 0.71 | 0.30 | 0.39 | 1.00 | −0.03 | 0.16 | 0.48 |
| CSb | 0.19 | 0.16 | 0.18 | 0.55 | 0.28 | −0.03 | 1.00 | −0.08 | 0.22 |
| CTl | −0.15 | −0.04 | 0.27 | 0.01 | 0.23 | 0.16 | −0.08 | 1.00 | 0.18 |
| CZn | 0.80 | 0.04 | 0.72 | 0.45 | 0.97 | 0.48 | 0.22 | 0.18 | 1.00 |
Publisher’s Note: MDPI stays neutral with regard to jurisdictional claims in published maps and institutional affiliations. |
© 2022 by the authors. Licensee MDPI, Basel, Switzerland. This article is an open access article distributed under the terms and conditions of the Creative Commons Attribution (CC BY) license (https://creativecommons.org/licenses/by/4.0/).
Share and Cite
Caridi, F.; Paladini, G.; Mottese, A.F.; Messina, M.; Venuti, V.; Majolino, D. Multivariate Statistical Analyses and Potentially Toxic Elements Pollution Assessment of Pyroclastic Products from Mt. Etna, Sicily, Southern Italy. Appl. Sci. 2022, 12, 9889. https://doi.org/10.3390/app12199889
Caridi F, Paladini G, Mottese AF, Messina M, Venuti V, Majolino D. Multivariate Statistical Analyses and Potentially Toxic Elements Pollution Assessment of Pyroclastic Products from Mt. Etna, Sicily, Southern Italy. Applied Sciences. 2022; 12(19):9889. https://doi.org/10.3390/app12199889
Chicago/Turabian StyleCaridi, Francesco, Giuseppe Paladini, Antonio Francesco Mottese, Maurizio Messina, Valentina Venuti, and Domenico Majolino. 2022. "Multivariate Statistical Analyses and Potentially Toxic Elements Pollution Assessment of Pyroclastic Products from Mt. Etna, Sicily, Southern Italy" Applied Sciences 12, no. 19: 9889. https://doi.org/10.3390/app12199889
APA StyleCaridi, F., Paladini, G., Mottese, A. F., Messina, M., Venuti, V., & Majolino, D. (2022). Multivariate Statistical Analyses and Potentially Toxic Elements Pollution Assessment of Pyroclastic Products from Mt. Etna, Sicily, Southern Italy. Applied Sciences, 12(19), 9889. https://doi.org/10.3390/app12199889


