Article

Prediction and Analysis of Formation and Development Characteristics of Frozen Soil Wall: A Case Study on the Chengjiao East Ventilation Shaft Repair

State Key Laboratory for Geomechanics and Deep Underground Engineering, School of Mechanics and Civil Engineering, China University of Mining and Technology, Xuzhou 221116, China
*
Author to whom correspondence should be addressed.
Appl. Sci. 2023, 13(5), 3209; https://doi.org/10.3390/app13053209
Submission received: 2 February 2023 / Revised: 22 February 2023 / Accepted: 28 February 2023 / Published: 2 March 2023
(This article belongs to the Section Civil Engineering)

Abstract

:
Due to their advantages, artificial ground freezing methods are widely used in deep shaft construction and repair with the continuous exploitation of coal and other mineral resources. The boundary convection due to ventilation conditions will affect the formation and development of this frozen soil wall, which needs to be studied systematically. Thus, in this study, a numerical calculation model of a freezing temperature field was established based on the actual conditions of the east ventilation shaft in the Chengjiao coal mine during repair by the freezing method, and the temperature and thickness laws of the frozen soil wall and the shaft wall were studied by changing the influencing parameters. The results indicated that the thickness of the outside position gradually exceeded that of the inside position of the frozen soil wall due to the ventilation effect, and the difference between these two parameters was approximately 0.2~0.3 m, while the temperature difference was no more than 1 °C. The frozen soil wall did not complete a cross-loop within 180 d under ventilation conditions when the freezing tube pitch exceeded a certain threshold, which was about 2.3~2.5 m for this ventilation shaft. The soil moisture content played an important role in the initial freezing under ventilation conditions in the full combination calculation. This paper provides theoretical support for studying the application of the artificial ground freezing method for shaft construction and repair under ventilation conditions.

1. Introduction

With economic development and social progression, energy demands have dramatically increased, and an increasing number of deep vertical shafts are being constructed with the continuous exploitation of coal resources [1]. Vertical shafts can be divided into the main shaft, auxiliary shaft, and ventilation shaft according to their purpose, while the main shaft is used exclusively for lifting coal, and the auxiliary shaft is used for lifting personnel, materials, equipment, and gangue. Both have a relatively good internal environment. In contrast, the ventilation shaft is mainly used for ventilating and waterproofing, and its internal environment is harsh and wet all year round. A series of problems appear with the increase in depth, such as an increasing hazard of impact mine pressure, increasing ground temperature, the position error of freezing pipes [2,3], increasing water pressure on the shaft, and an increased risk of sudden water accidents. Therefore, when deep shaft failure occurs, difficulties in governance exponentially increase.
The drilling method and freezing method are usually used in shaft construction, and the reinforcement of the damaged section of shaft, wall breaking and grouting, and artificial ground freezing methods are used in shaft repair [4,5]. However, most construction or repair methods are restricted and cannot be used under complex geological conditions, while the artificial ground freezing method is one of the most reliable methods to deal with complex strata. The basic principle of the artificial ground freezing method is to use a constant cold source to reduce the ground’s temperature to below the freezing point of groundwater, resulting in a hydraulic boundary that enhances and stabilizes the ground structure and restricts the flow of groundwater. This method was widely used in deep shaft construction and repair due to its multiple advantages [6,7,8,9,10,11,12,13]. The frozen soil wall formed by this method can effectively prevent water and quicksand in water-rich soft rock from flowing into the shaft, and the wall can also bear lateral pressure from the soil layer to protect the shaft wall during shaft wall construction and repair [14,15,16,17,18,19], as shown in Figure 1. In addition, the formation and development characteristics of frozen soil walls are of great significance when evaluating the reliability and economy of artificial ground freezing methods, which have been systematically studied.
To date, the mechanical properties of frozen soil have been increasingly established due to their central role in the construction and design of artificial ground freezing in underground projects [20,21]. A statistical damage constitutive model of artificial frozen silt was studied to analyze its mechanical properties, considering the effects of temperature and confining pressures [22]. Many triaxial compression tests of frozen sand were completed under confining pressures to study the mechanical properties of artificial frozen soils [23,24]. A series of laboratory experiments and theoretical analyses were conducted to study the temperature and thickness laws of frozen soil walls, and a more complete basic theoretical system was obtained. A higher precision semi-analytical solution in the dimensionless freezing zone of a temperature field was derived from equations of a single tube frozen soil wall and an analysis of the relationship between the freezing radius and heat flow density and various other factors under the condition of constant wall temperature [25,26,27,28]. In addition, the controlling equations of heat conduction and the analytical solution of the soil temperature around the freezing tube are based on a single-tube freezing temperature field model [29]. However, frozen soil walls have a nonstationary temperature field. An analytical method based on mathematical analysis is relatively rigorous and can be expressed by a function showing the results, but it may not solve complex engineering problems. Thus, it is necessary to build a numerical calculation model that can meet engineering needs and solve complex engineering problems [30,31,32].
A series of numerical calculation analyses were conducted to study the temperature and thickness laws of frozen soil walls. The influence of the soil moisture content, thermal conductivity, initial ground temperature, and changing temperature of a frozen soil wall on the distribution of a freezing temperature field was studied by ANSYS software based on experimental data in the Xinzhuang coal mine [33]. The influence of thermal conductivity and specific heat capacity on the distribution of the freezing temperature field and the freezing rate was considered and studied using finite element software based on a two-dimensional planar numerical model of a ventilation shaft in the Tashendian mine area [13]. The effect of the mesoscale internal structure on the effective thermal conductivity of anisotropic geomaterials and a numerical method to estimate the effective thermal conductivity of a multiphase composite material under the steady-state heat transfer condition were studied [34,35]. Numerical calculation analyses were carried out to observe the changing thickness law of a frozen soil wall under the effect of different parameters. The influence of the freezing tube’s outside diameter, brine temperature, and initial ground temperature on the thickness of the frozen soil wall was studied based on a numerical simulation of PVC tubes [36]. The influence of the phase change latent heat of the soil, thermal conductivity, specific heat capacity, and initial ground temperature on the thickness of a frozen soil wall was considered and studied based on a numerical calculation of the freezing finite element temperature field at Nanjing station [37]. Several studies were conducted to summarize the extent to which different parameters on a frozen soil wall were affected. The extent to which different parameters affected on the freezing efficiency, from largest to smallest, is as follows: brine temperature, initial soil temperature, thermal conductivity, and specific heat capacity [38]. The factors affecting the development of the frozen soil wall, from large to small, are as follows: brine temperature, freezing tube arrangement spacing, freezing tube diameter, and water content of the formation [39].
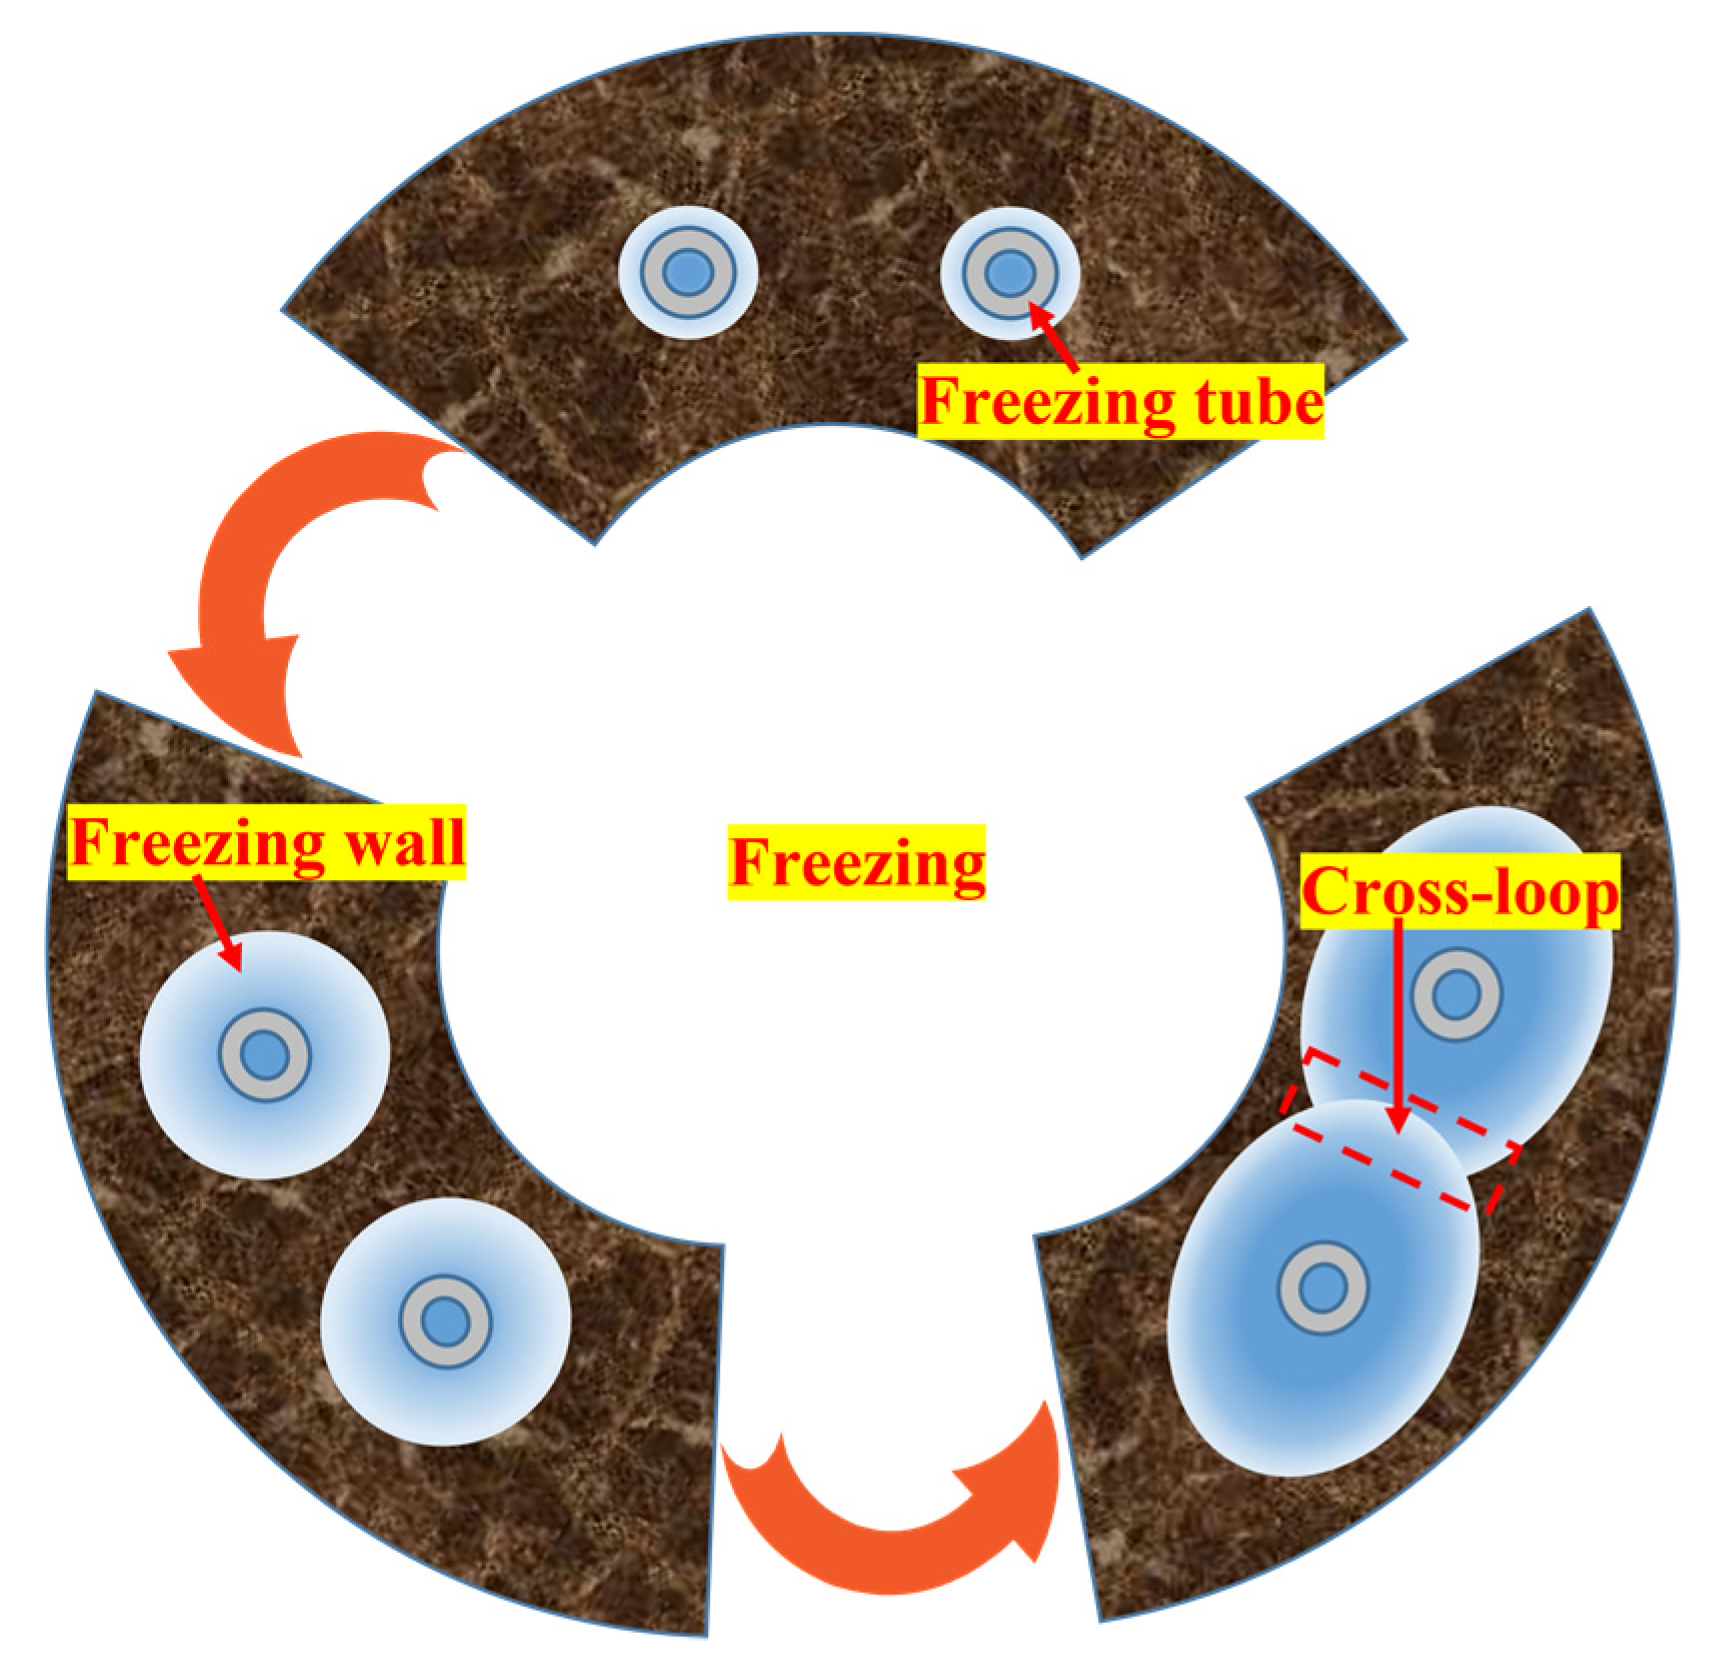
As a shaft wall failure has become increasingly severe with the increase in shaft service time, the application of the freezing method in shaft repair has become more widespread and has proven to be reliable. However, most numerical simulations have focused on the development law of the temperature field around the frozen soil wall in the main shaft and auxiliary shaft, as shown in Figure 2, but the ventilation shaft is more complicated than the main shaft and auxiliary shaft due to the continuous operation of the ventilation shaft during repair, the high total volume of return air, and the wet, high wind, year-round environment. Meanwhile, the development law of frozen soil wall, applied to the ventilation shaft using the freezing method, is not yet clear. The shaft remains within a relatively stable temperature range, and there is a continuous heat exchange during shaft ventilation which is not conducive to the normal development of a frozen soil wall [40]. Hence, the development of the temperature field around the frozen soil wall during ventilation shaft repair was studied by ANSYS software, based on the actual data of the Chengjiao east ventilation shaft combined with the shaft environment, with convective heat exchange conditions used to simulate ventilation. The effect of various influencing factors on the development laws of the frozen soil wall was studied, including the convective heat transfer coefficient, layout radius of freezing tube, freezing tube pitch, freezing tube diameter, thermal conductivity of unfrozen soil, soil moisture content, and shaft wall thickness. To further study the effect of the main factors, including the layout radius of the freezing tube, freezing tube pitch, thermal conductivity of unfrozen soil, and soil moisture content, on the development laws of the frozen soil wall, a full combination calculation of these four factors was studied based on the single-factor calculation results, including 384 sets of numerical experiments.

2. Mathematical Model of the Freezing Temperature Field and Related Physical Parameters

In this study, ANSYS software was used to analyze the development law of the temperature field of frozen soil wall under ventilation conditions, while the finite element method was applied, and the Newton–Raphson balanced iterative method was used for the solution. The basic assumptions regarding the topsoil and shaft are that: (1) the shaft wall, topsoil, and freezing tube are all symmetric around the centerline of the shaft; (2) the soil is considered a homogeneous material, which has isotropic properties; (3) the ventilation was simulated by adding the convective heat exchange condition in the inside shaft wall, which was directly set in the boundary condition; (4) the brine flow was achieved by applying a constant temperature to the freezing tube; (5) the water migration between frozen and unfrozen soils is ignored; (6) the leaks related to cracks and delamination of the rock mass are not considered in the calculation model.

2.1. Mechanical Model of the Freezing Temperature Field

Vertical shaft freezing temperature field calculations are unstable heat conduction problems with phase transitions, moving boundaries, internal heat sources, and complex boundary conditions. Because the size of the frozen soil wall in the vertical direction is much larger than that in the horizontal direction and the heat conduction of the soil layer in the vertical direction is much weaker, the freezing temperature field of the vertical shaft can be simplified as a plane heat conduction problem. In addition, the differential equation of thermal conductivity in column coordinates is obtained by simplifying the freezing temperature field equation of a single tube. The development of the temperature field in different angles is the same under the axis of the freezing tube as the Z-axis for the freezing temperature field of a single tube; therefore, this model can be considered a spatial axisymmetric structure, then the equation is simplified to a one-dimensional parameter model, and its heat conduction equation is:
T n t = a n ( 2 T n r 2 + 1 r T n r ) ( t > 0 ,   0 < r < )
where Tn is the distribution of temperature (°C), n is the state of soil (n = 1 represents the soil is the unfrozen soil, n = 2 represents the soil is the frozen soil), t is the freezing time (s), r is the circular cylindrical coordinates (m), an is the coefficient of temperature conductivity (m2·s−1), an = λn/cn and λn are the thermal conductivity (J·s−1·m−1·°C−1), and cn is the volume specific heat (J·m−3·°C−1).
The temperature of the soil is constant before the freezing process:
T ( r , 0 ) = T 0
The temperature field at infinity is not affected by freezing, and its temperature is:
T ( , t ) = T 0
The temperature on the frozen front is always the freezing temperature Td:
T ( ξ N , t ) = T d
The heat balance equation on either side of the frozen front is [41]:
λ 2 T 2 r | r = ξ N λ 1 T 1 r | r = ξ N = ψ d ξ N d t
The temperature of the freezing tube arrangement ring is:
T ( R 0 , t ) = T c
where T0 is the initial temperature (°C), Td is the freezing temperature of the soil (°C), Tc is the temperature of the brine (°C), R0 is the distribution radius of the freezing tube (m), ξN is the coordinates of the frozen front in the N region (m), N = 1 represents the internal distribution region of the freezing tube, N = 2 represents the external distribution region of the freezing tube, and ψ is the amount of latent heat per volume of soil during freezing (kJ·kg−1).

2.2. Physical Parameters of the Soil Layer

(1)
Physical parameters of the soil layer
In this study, the sandy clay is the main soil type, its freezing temperature is around 0 °C~−0.5 °C as obtained by a series of frozen soil physical tests, and the calculation equation of the freezing temperature for the frozen soil [42] is as follows:
T d = T s + η p
where Ts is the freezing temperature of wet soil without salt and external load (°C), η is the average rate of change of the freezing temperature of wet soil without salt with external loading, generally taken as −0.075 °C·MPa−1, and p is the pore water pressure of the soil (MPa).
(2)
Thermal Conductivity of Soil and Frozen Soil
The thermal conductivity of unfrozen soil and frozen soil decreases by 0.2~0.5% as the temperature decreases by 1 °C, which is taken as 0.3%. The thermal conductivity coefficient at the corresponding temperature can be calculated according to the “Thermophysics of Frozen Soil” in the previous literature [43].
(3)
Specific heat of soil and frozen soil
The calculation equation for the unfrozen and frozen soil is shown below:
C d u = C s u + W C w 1 + W
C d f = C s f + ( W W u ) C i + W u C w 1 + W
where Cdu, Cdf, Csu, Csf, Cw, and Ci are the specific heat of the soil, frozen soil, soil skeleton, frozen soil skeleton, water, and ice (J·kg−1·°C−1), respectively, and W and Wu are the total water content and unfrozen water content, respectively. Specifically, the values of Cw and Ci can be taken as 4182 and 2090, respectively, while the value of Wu is close to 0. In addition, the specific heat capacity of the ice–water mixture is generally ignored due to its relatively weak effect on the calculation of freezing temperature field.
(4)
Phase transformation latent heat of soil
The amount of heat emitted or absorbed due to the phase transformation of water in unit volume soil can be calculated by:
Q = L ρ d ( W W u )
ρ d = ρ / ( 1 + W )
where Q is the phase transformation latent heat of the soil (kJ·m−3), L is the freezing latent heat (334.56 kJ·kg−1), ρd is the dry density of the soil (kg·m−3), and ρ is the wet density of the soil (kg·m−3).
(5)
Enthalpy
The phase transformation latent heat of soil can be taken as the constant value when its water content stays at a lower stage, while the phase transformation latent heat of soil can be expressed by the change in enthalpy, as this method could solve phase transition problems with complex boundary conditions and multiple nonmonotonic interfaces. The unfrozen water content is relatively low and its effect on the phase transition is considered in the calculation. When the enthalpy of unit volume soil at T0 is zero, the enthalpy of unit volume soil at T can be expressed by:
Δ H T = T 0 T ρ C d f d T = ρ C d f ( T T 0 )
The enthalpy increment of unit volume soil from T to T+ is the phase transformation latent heat Q; thus, the enthalpy increment from T+ to T is:
Δ H T + = T + T ρ C d u d T = ρ C d u ( T T + )
where T and T+ are the temperatures of the phase transition interval, which can be taken as the freezing points Td and Td minus 0.5 °C, while these two values could be applicable to the sandy clay and determined by an enthalpy change interval requirement in ANSYS software.

2.3. Finite Element Model

The factors affecting the freezing temperature field of a single-coil tube are as follows:
F ( T , T d , T y , T 0 , t , r , r 0 , L d , λ 1 , λ 2 , λ 3 , C 1 , C 2 , C 3 , ρ 1 , ρ 2 , ρ 3 , Ψ ) = 0
where T is the temperature (°C), Td is the freezing temperature of soil (°C), Ty is the temperature of saline water (°C), T0 is the initial and far field boundary temperatures (°C), t is the freezing time (s), r is the circular cylindrical coordinates (m), taking the center of the freezing tube as the origin value, r0 is the outer radius of freezing tube (m), Ld is the freezing tube pitch (m), λ1 is the thermal conductivity of unfrozen soil (W·m−1·°C−1), λ2 is the thermal conductivity of unfrozen soil (W·m−1·°C−1), λ3 is the thermal conductivity of concrete (W·m−1·°C−1), C1 is the specific heat of unfrozen soil (J·kg−1·°C−1), C2 is the specific heat of frozen soil (J·kg−1·°C−1), C3 is the specific heat of concrete (J·kg−1·°C−1), ρ1 is the dry density of unfrozen soil (kg·m−3), ρ2 is the dry density of frozen soil (kg·m−3), ρ3 is the density of concrete (kg·m−3), and Ψ is the freezing latent heat of soil (kJ·kg−1).

2.4. Geometric Model

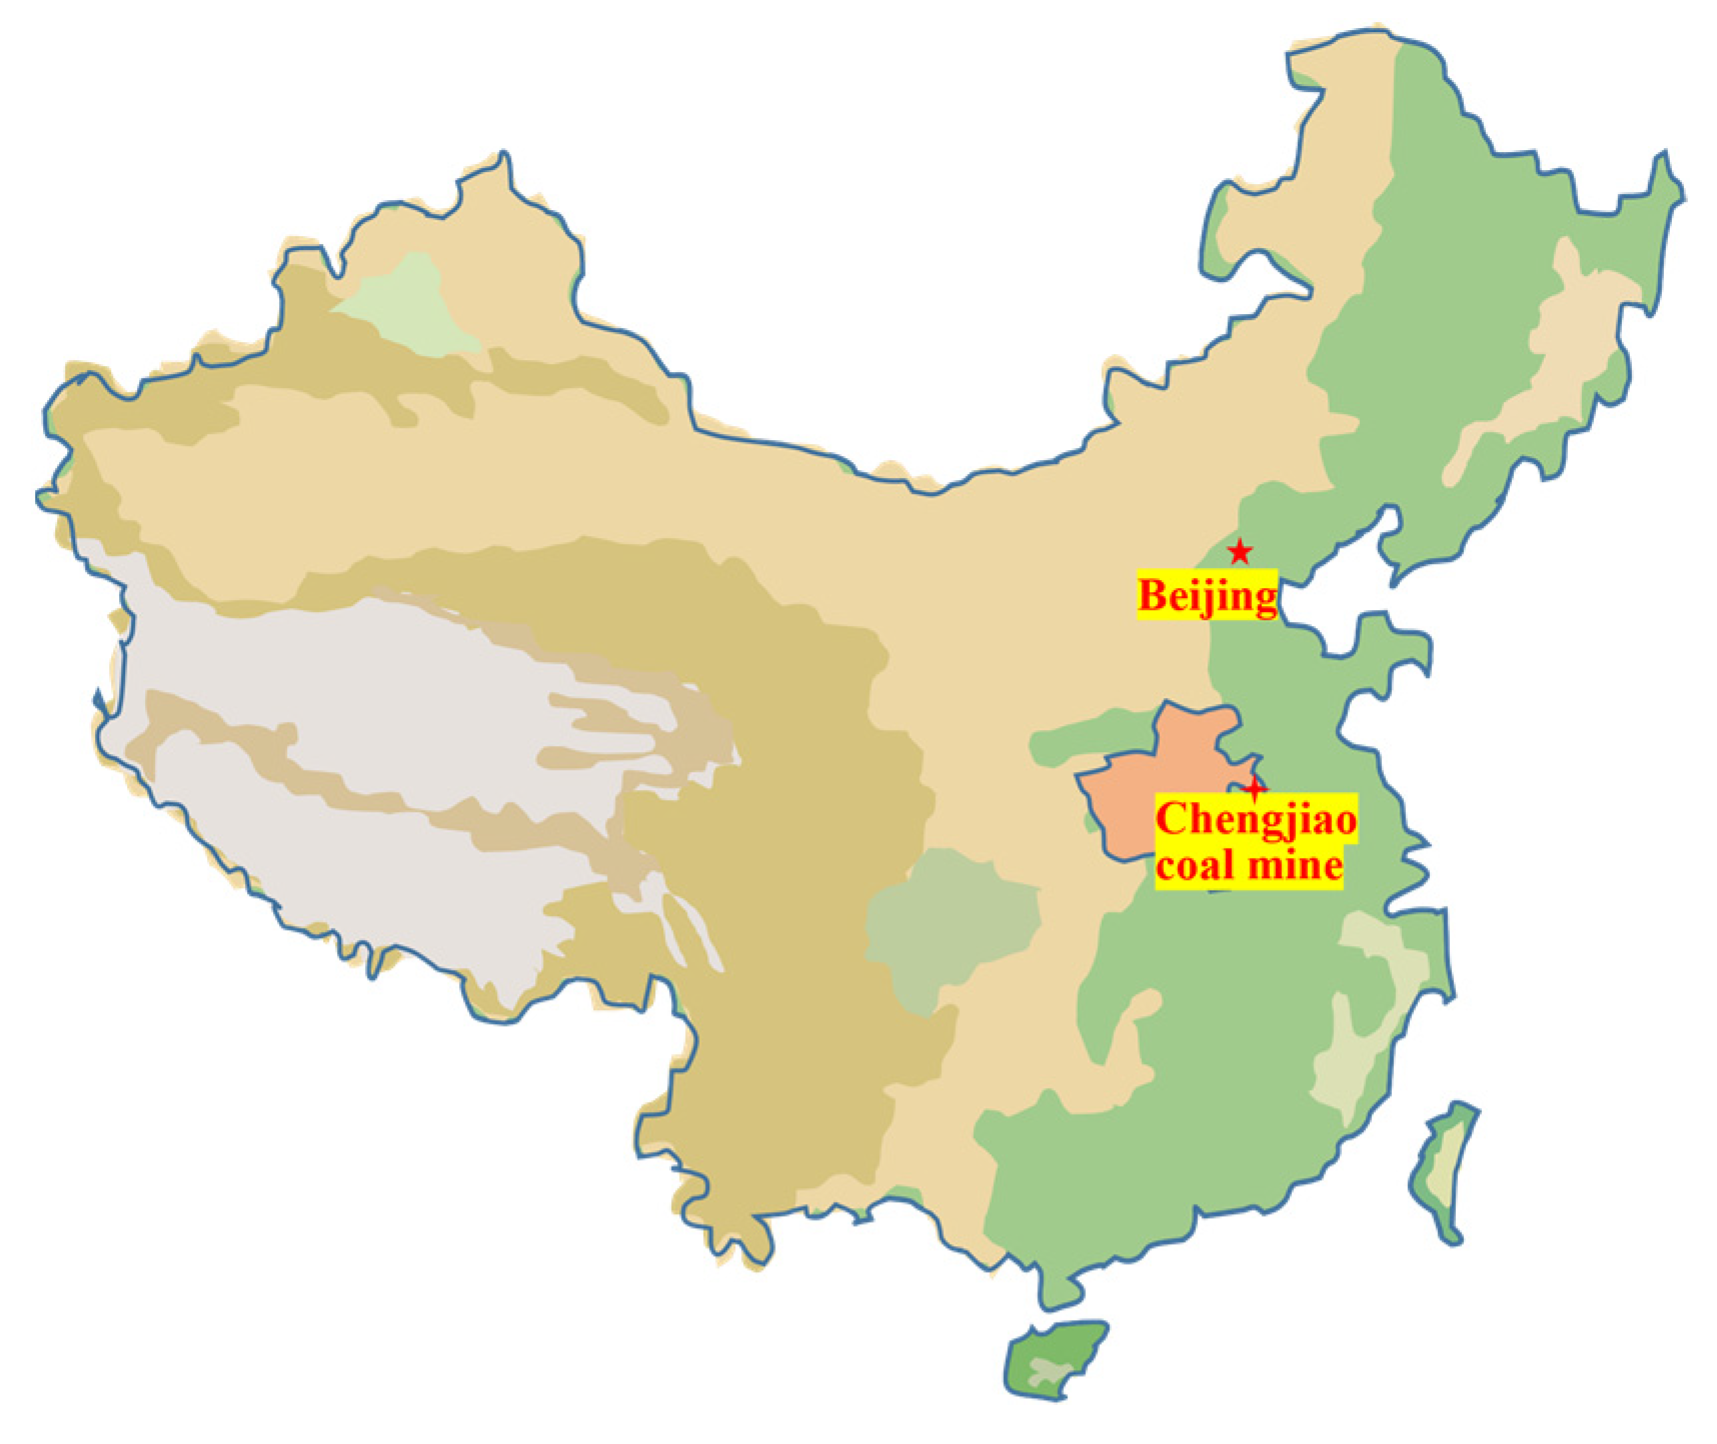
The east ventilation shaft (494.6 m) of the Chengjiao coal mine (located in Yongcheng city, Henan Province, P. R. China, with an east longitude of 116°39′ and a north latitude of 33°94′) passes through an alluvial layer with a thickness of 358.2 m, as shown in Figure 3. The net diameter of the east ventilation shaft is 5.0 m. A rupture disaster occurred in the east ventilation shaft wall in May 2015, and the company decided to use the freezing method to repair the shaft wall to prevent accidents with sudden water and sand gushing.
The damaged depths of the shaft wall (below ground level) in the east ventilation shaft are −199.5 (minus 2 m) and −329.5 m (plus/minus 17.5 m), respectively, where the concrete is badly damaged, and a large amount of steel reinforcement is twisted and exposed. The lithological profile of the shaft is shown in Table 1 (the damaged depths of the shaft wall has been bolded) and the photograph appearance of the damaged wall is shown in Figure 4.
According to the previous computational research results [44,45], the radius of the affected area (the cooling zone) in the outer side of the shaft wall would not exceed 5~8 times the whole thickness of the frozen soil wall in the frozen soil wall development process. In the freezing, engineering, and construction, the whole thickness development of the frozen soil wall in soil generally does not exceed 3 m; thus, the radius of the cooling zone is approximately 15~24 m. The layout radius of the freezing tube is 5.5~6 m, so the radius of the affected area is 6 + (15~24) m = 21~30 m; therefore, the influence radius in the calculation model is set as 30 m. The freezing time nodes were taken to be 30 d, 60 d, 90 d, 120 d, and up to 180 d. The geometric model is shown in Figure 5.

2.5. Calculation Procedure

The boundary temperature of the far field at 30 m radius is the original ground temperature, and the temperature of each unit of the soil layer at the beginning of freezing is the original ground temperature (19.5 °C), which is a fixed value due to its relatively lower effect on the formation and development characteristics of frozen soil wall. The inner surface temperature and air temperature of the shaft wall are 25 °C, the initial temperature of the soil is 19.5 °C, the temperature of saline water is −30 °C in the active freezing period (0~60 d), and the temperature of saline water is −25 °C in the maintenance freezing period (61~180 days), according to the actual measured temperature over 12 months. At the convective heat transfer boundary, the temperature of the air and shaft wall is 25 °C. The temperature at the outer wall of the freezing tube is the temperature value of saline water, and the whole freezing time is 180 d.
The following two scenarios are considered for the calculation scheme and parameters:
(1) The influence of various influencing factors on the development laws of the frozen soil wall is studied when the boundary of convection heat transfers between the air in the well, and the shaft wall is selected in the case of ventilation in the well. The value ranges of all parameters were selected, and shown in Table 2 and Table 3:
(2) To further study the effect of the main factors on the development laws of the frozen soil wall, a full combination calculation of these four factors was studied based on the single-factor calculation results. The value ranges of all parameters were selected and shown in Table 4 and Table 5, including 384 sets of numerical experiments:
The plane quadrilateral element is used to divide the grid, the thinnest grid is applied to the frozen area, followed by the predicted frozen area, and the sparsest grid is set at the outer boundary. The schematic diagrams of grid division are shown in Figure 6a,b. In the temperature analysis of ANSYS software, the convergence criterion for temperature is 0.5 °C.
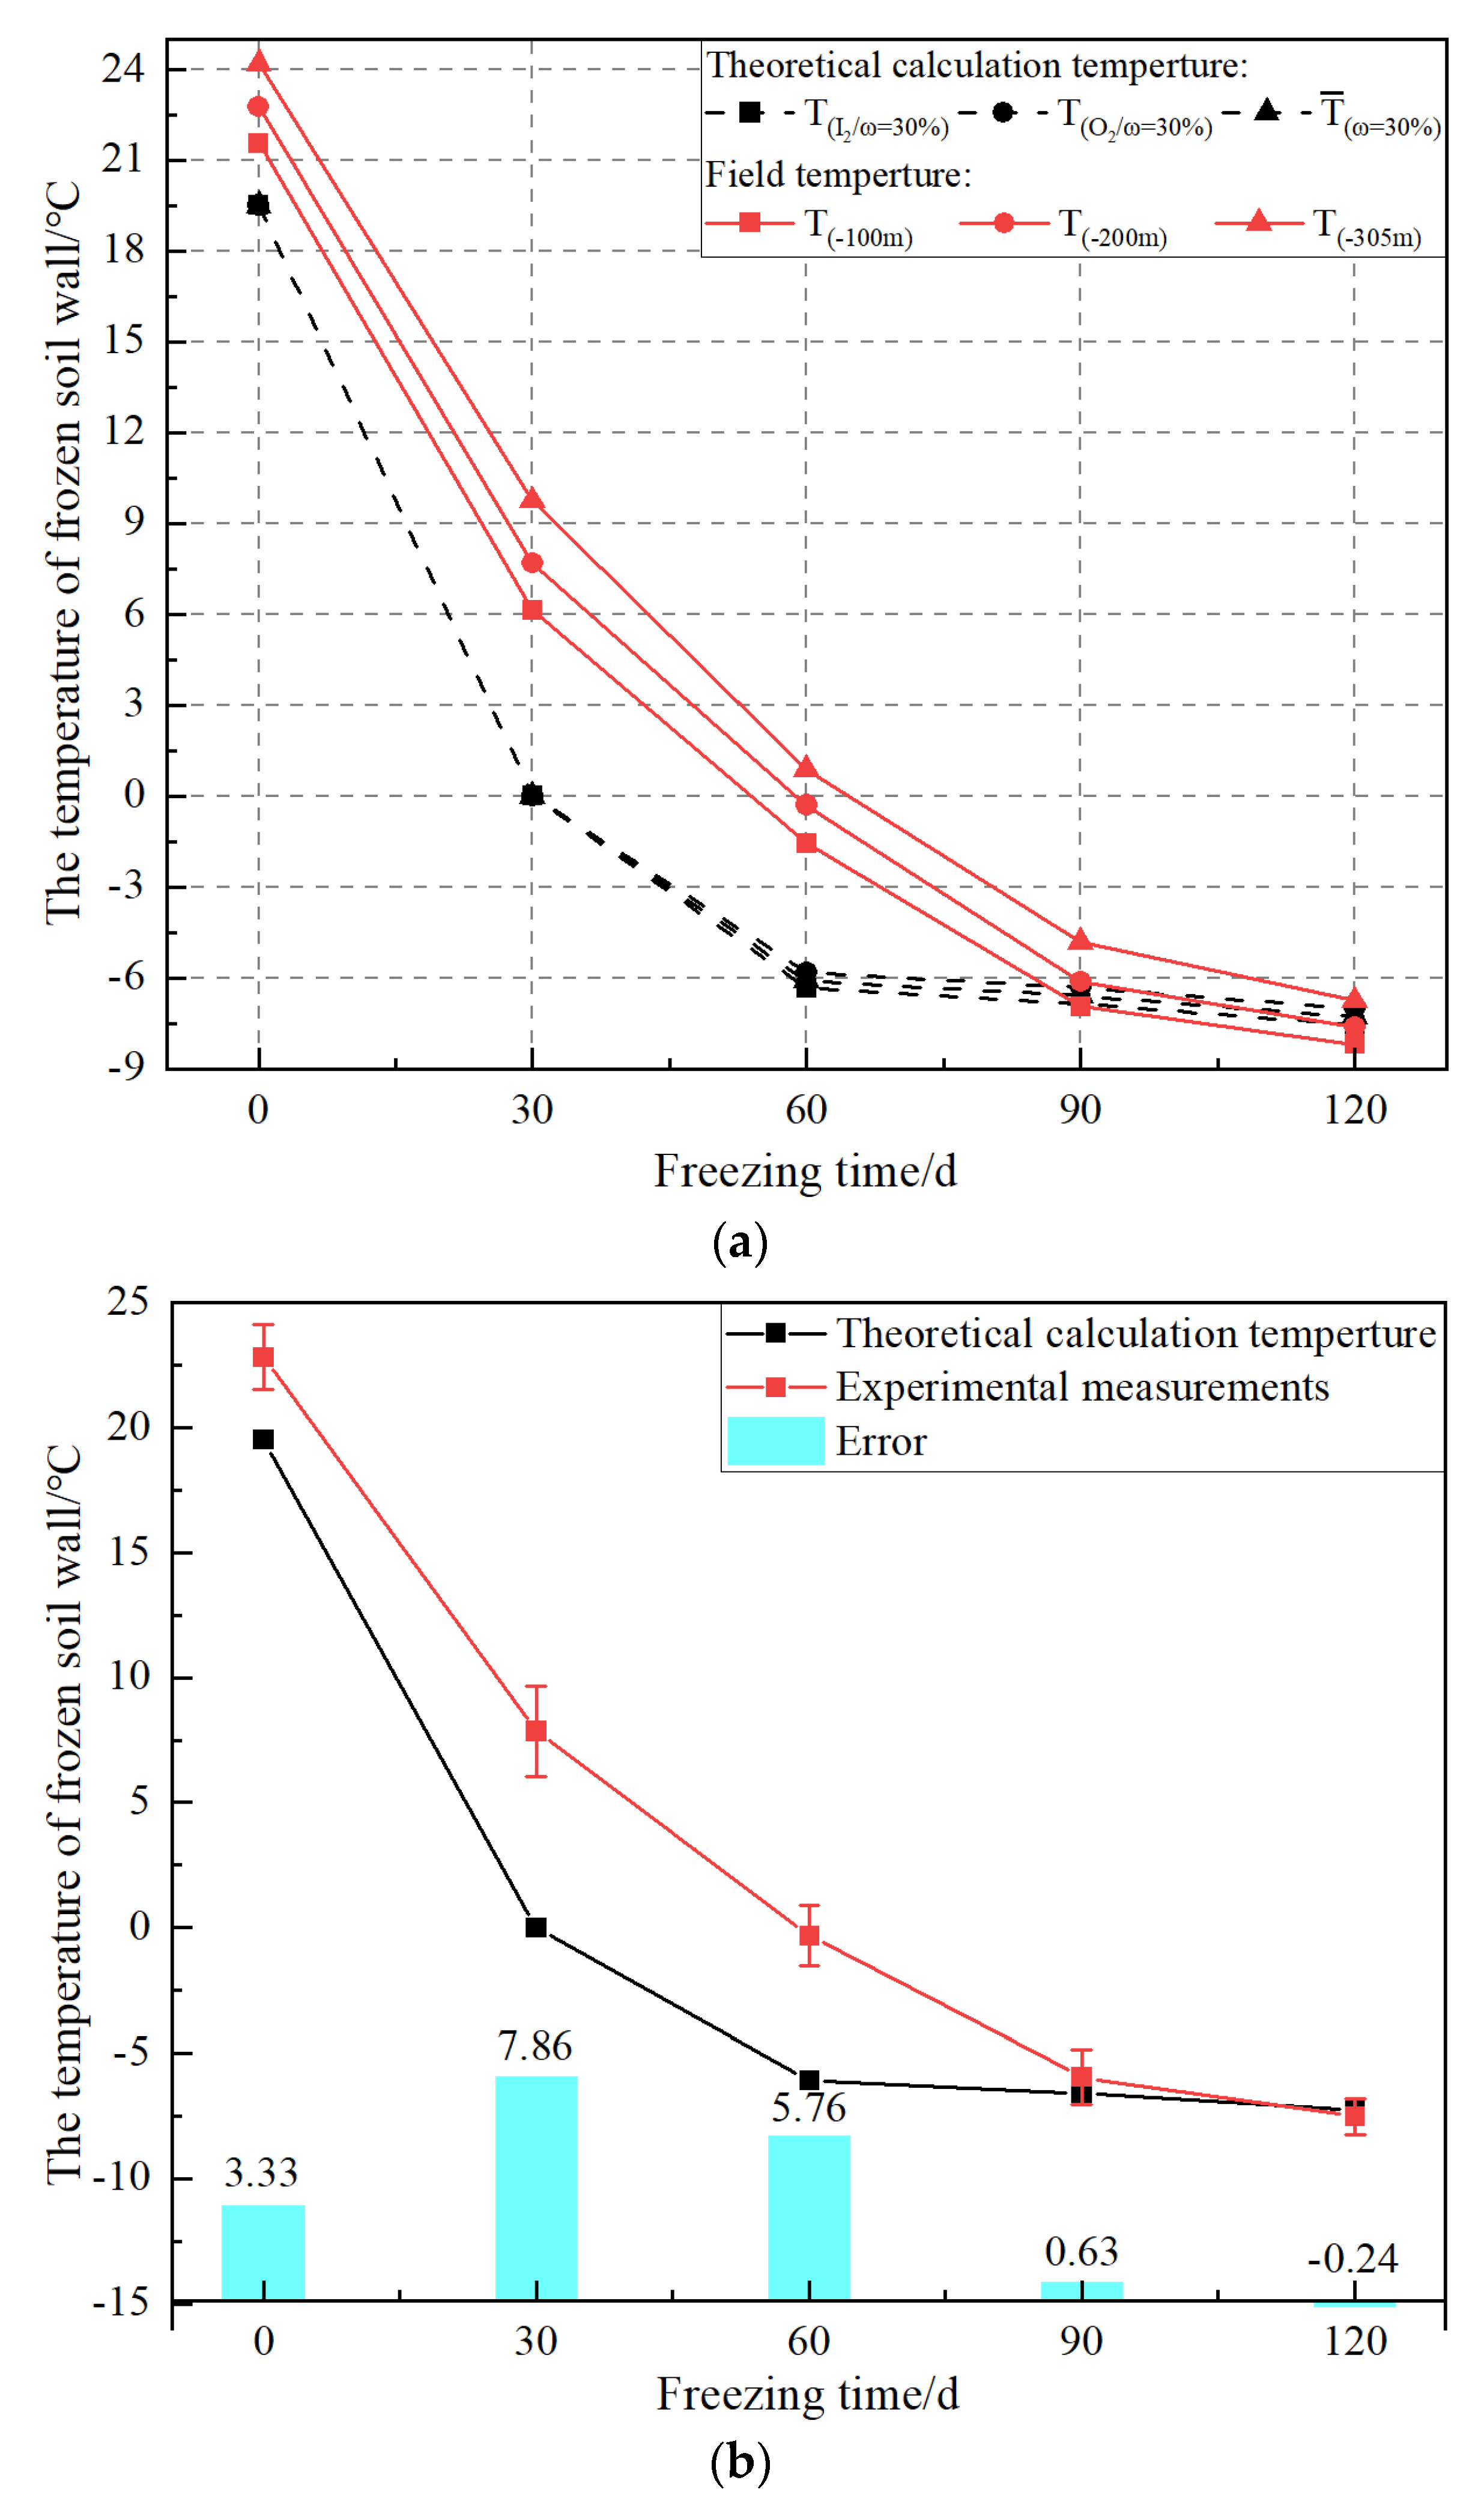
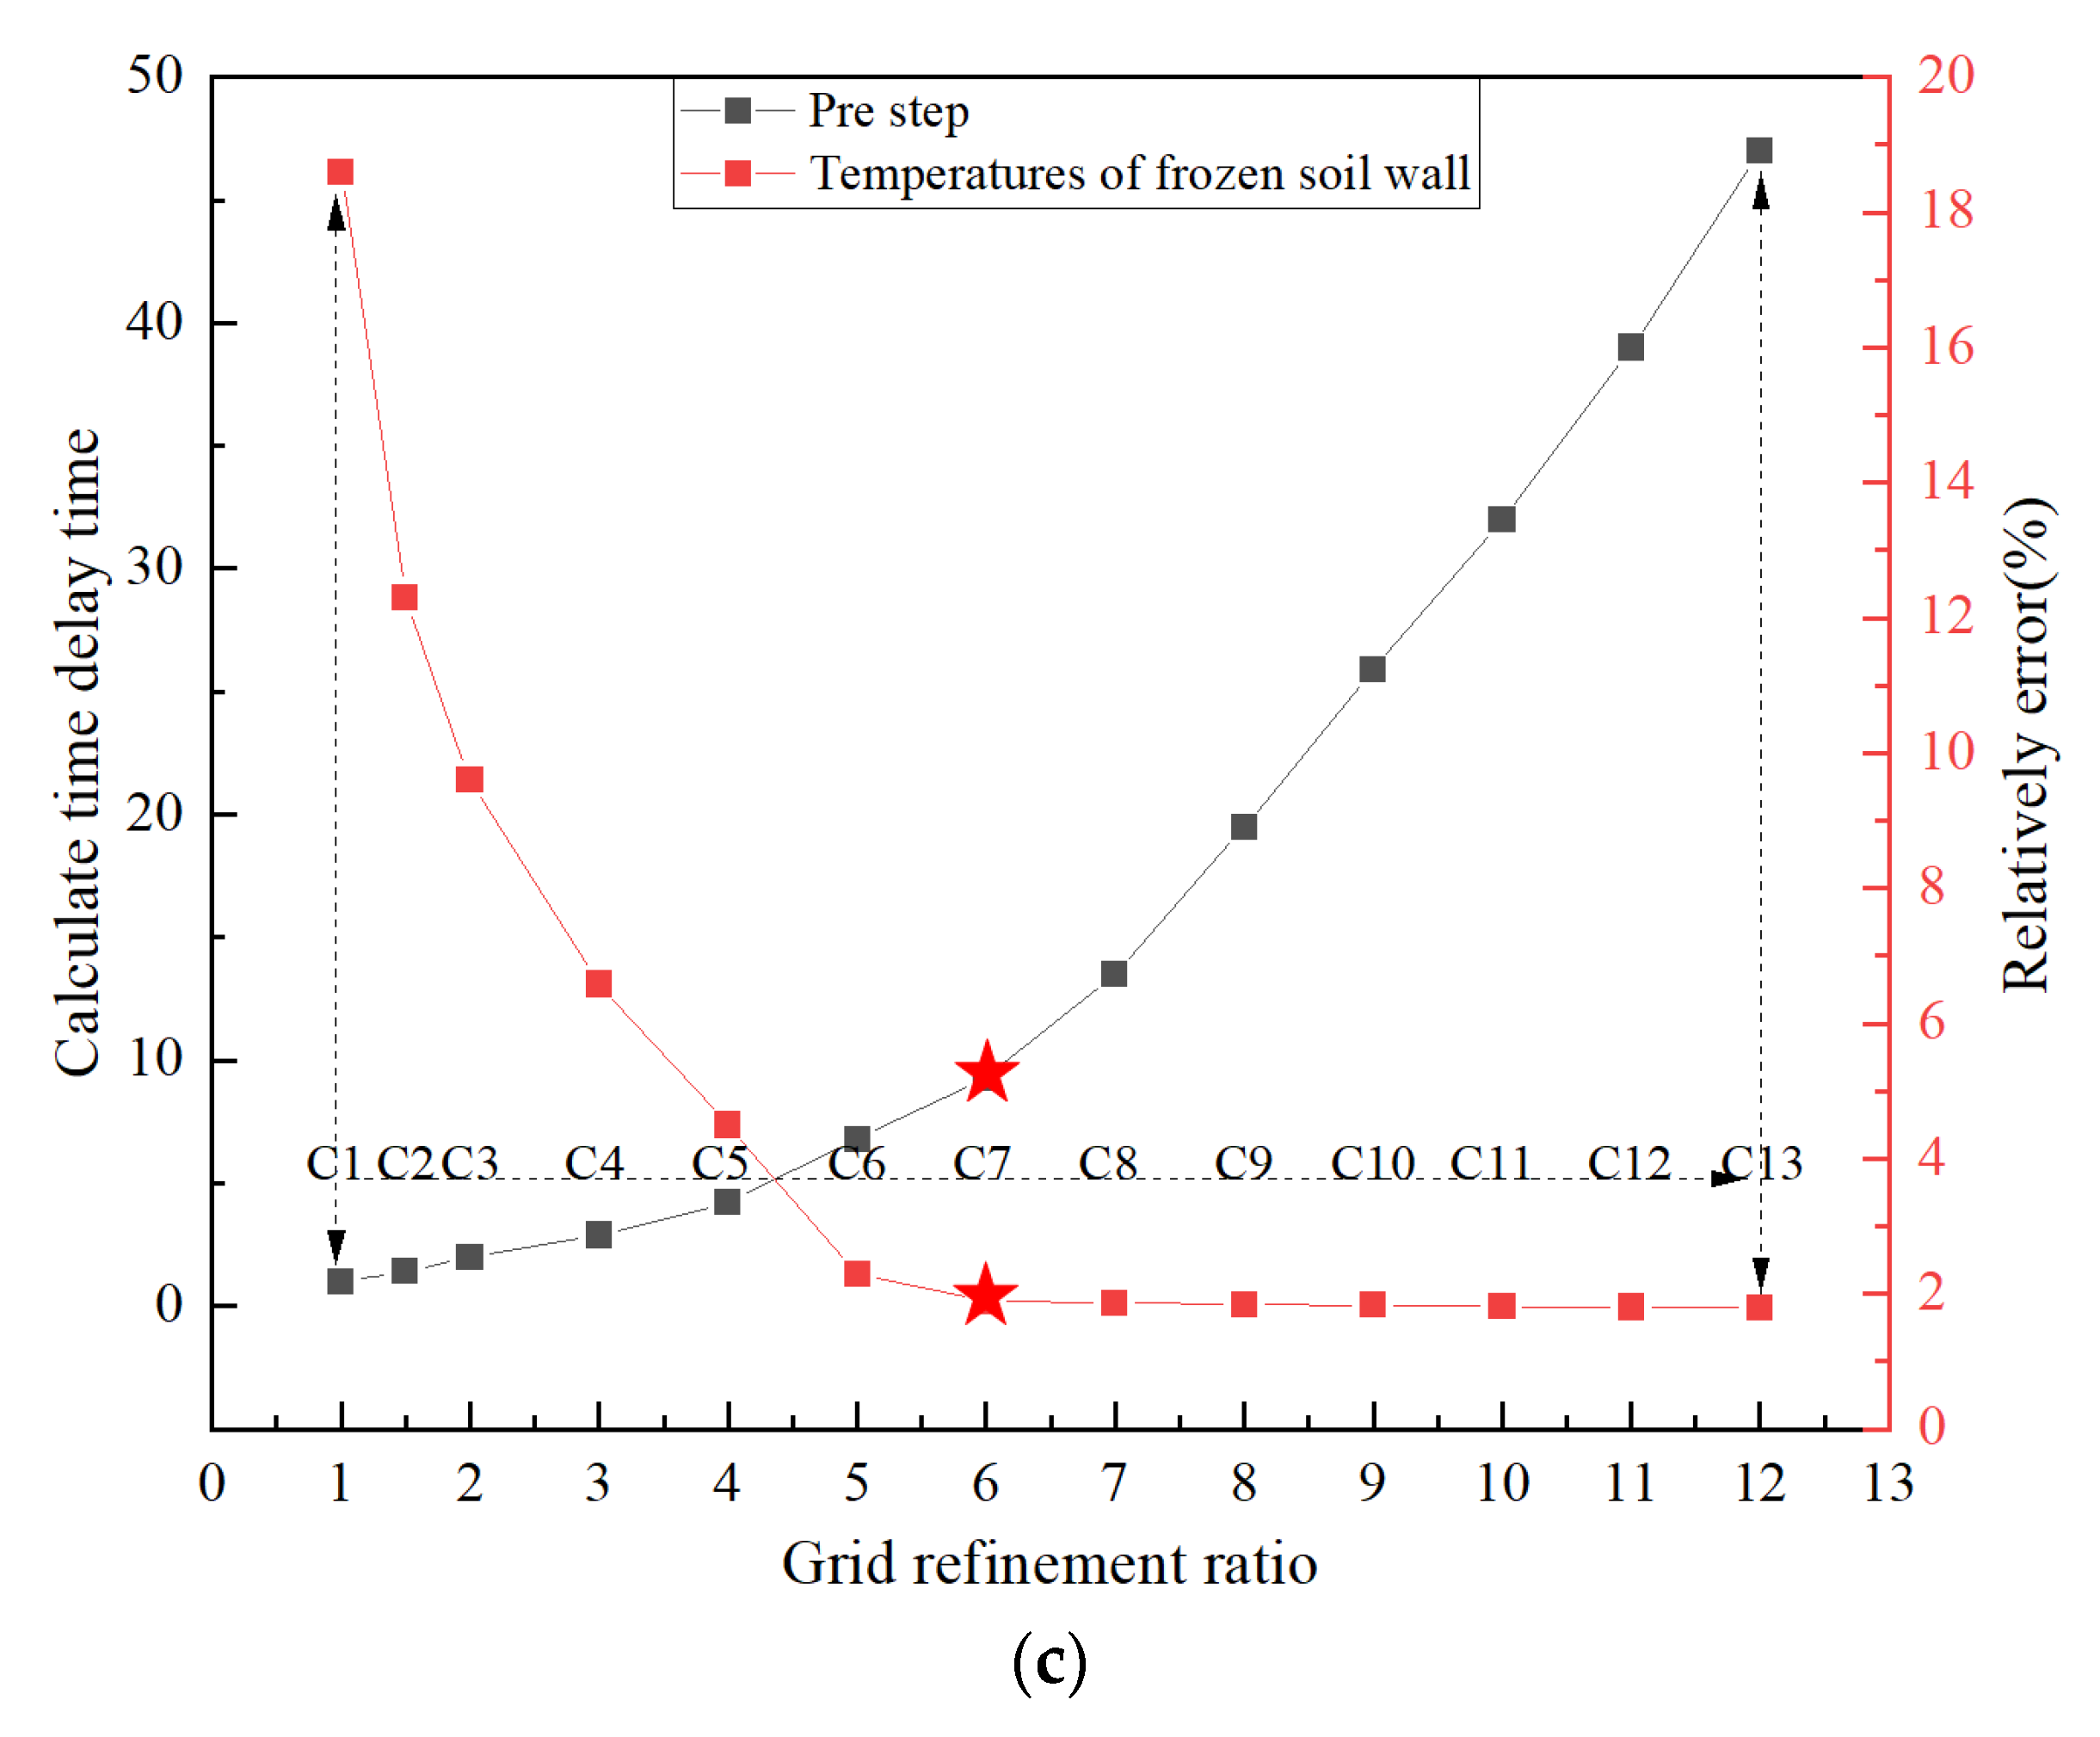
To verify the reliability of this model, the field temperature of the frozen soil wall in the east ventilation shaft of the Chengjiao coal mine was obtained from the thermometer hole (with the temperature sensors of Ocean-1010), as shown in Figure 1, and is compared with the average temperature of the frozen soil wall in the theoretical calculation in this study. The fixed depths of the frozen soil wall (below ground level) in the east ventilation shaft are selected as −100, −200 and −305 m, respectively, and the freezing time is approximately 180 d. In this freezing project, the criterion for the correspondence between experimental measurements and theoretical calculation temperature is the coincidence of these two curves and the temperature difference at 90 d and 120 d. It can be found that the decreasing law of these two kinds of temperatures is consistent, these two curves gradually match, and the temperature difference is below 1 °C at 120 d, as shown in Figure 7a,b, and these two kinds of values are also similar when the initial ground temperature gap caused by the temperature gradient of topsoil is ignored. In addition, the temperatures of the frozen soil wall (all factors were selected as the typical value) were simulated, and the calculated time delay ratio and relative error were selected as evaluation factors for grid sensitivity tests, as presented in Figure 7b. Although the increase in the grid refinement ratio could decrease the relative error and improve the accuracy of the model, the calculation time was found to rapidly increase with an increase in the grid refinement ratio. Thus, the mesh C7 (as shown by red pentagram) was selected for the calculation model. This error was acceptable from the perspective of artificial ground freezing projects.

3. Numerical Calculation Analysis

In this study, the effect of the convective heat transfer coefficient (α), layout radius of the freezing tube (Rd), freezing tube pitch (Ld), freezing tube diameter (D), thermal conductivity of unfrozen soil (λ), soil moisture content (ω) and shaft wall thickness (δ) on the development law of the freezing temperature field were studied and analyzed. Detailed results are shown below.

3.1. The Effect of the Convective Heat Transfer Coefficient

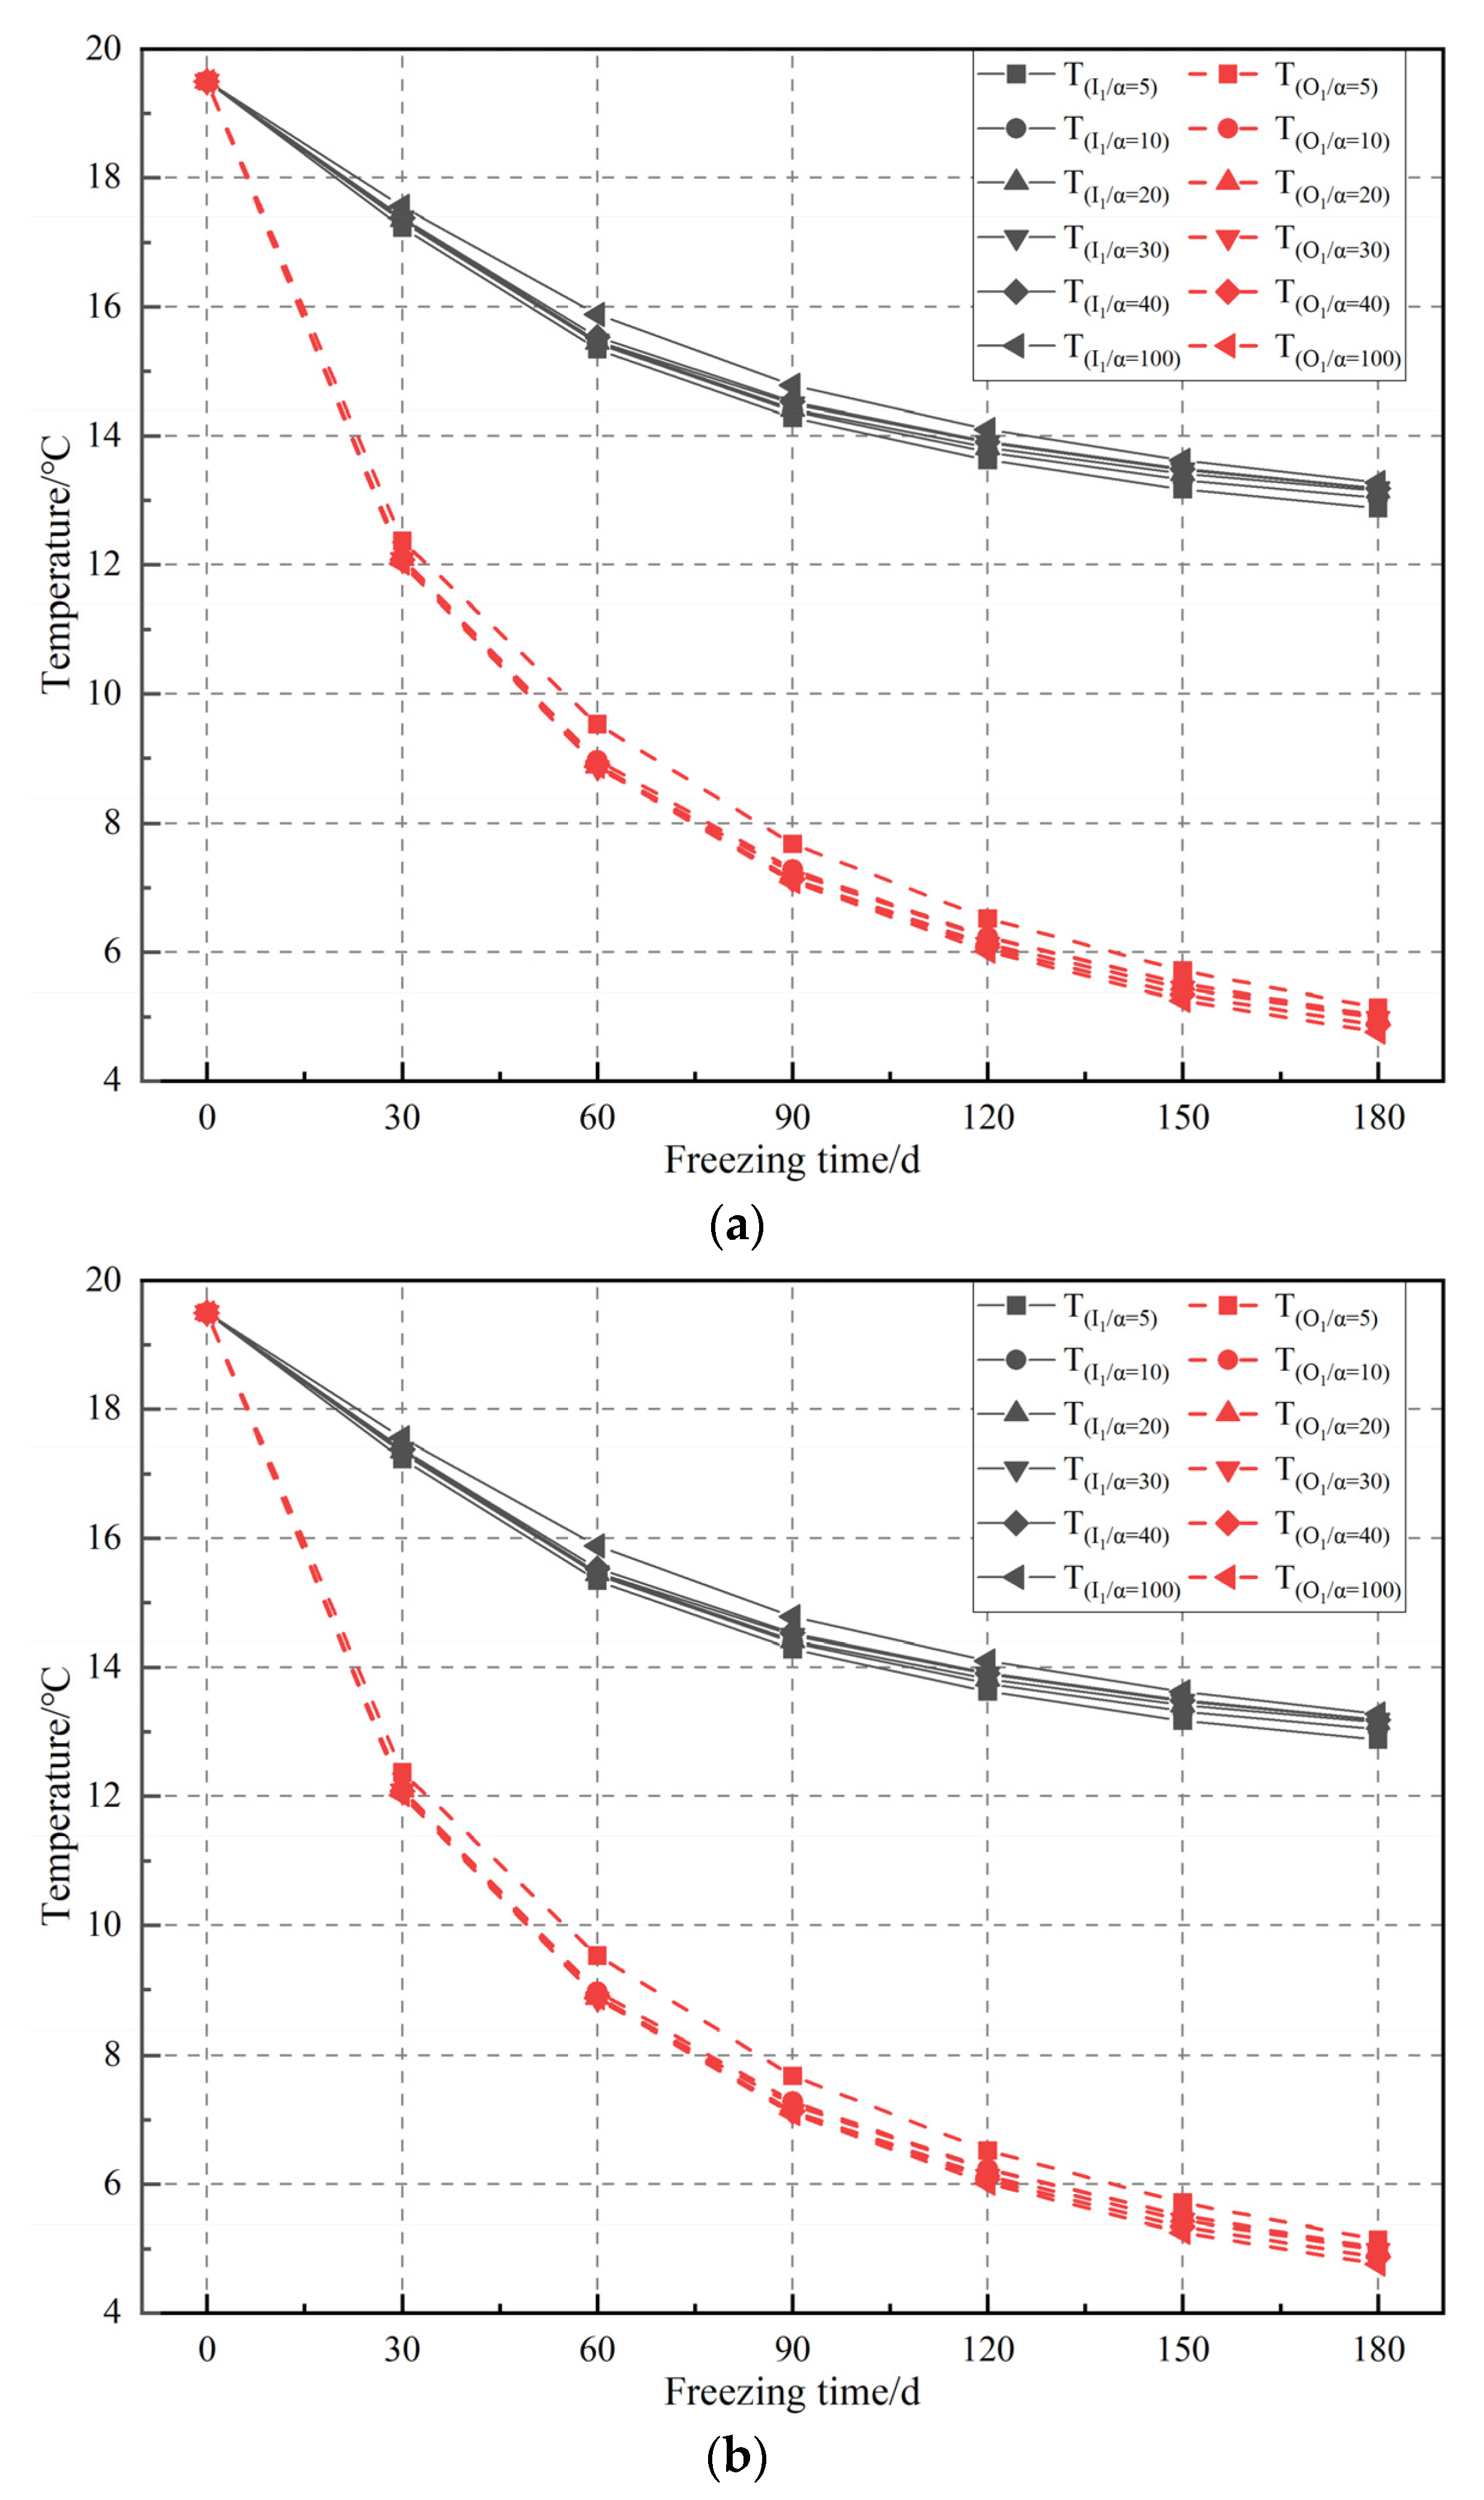
Figure 8a shows the temperature evolution curves of the interlayer (I1) and outside (O1) wall of the shaft wall with different convective heat transfer coefficients (α) and freezing time (t). The results indicate that the temperatures in the interlayer and outside wall of the shaft all gradually decrease with an increase in freezing time, while the temperature difference between these two positions is no more than 9 °C approximately. Due to the huge decrease in the trend difference before and after 30 freezing days, a kink to represent the obvious temperature change in the first 30 freezing days is added in the temperature figures. The temperature of the interlayer dropped by approximately 6.32 °C after 180 freezing days, and the lowest temperature was approximately 13.18 °C with a convective heat transfer coefficient of 30 W·m−2·°C−1, but the lowest outside temperature dropped to 4.98 °C. In addition, the variance in the temperature of these two positions is relatively small when the convective heat transfer coefficient constantly increases, and the freezing time is invariable. For example, the greatest temperature difference in the interlayer is approximately 0.5 °C. Thus, the value of the convective heat transfer coefficient has little influence on the temperature of the interlayer and outside wall under ventilation conditions.
Figure 8b shows the temperature (T) and thickness (δ) evolution inside (I2) and outside (O2) the frozen soil wall and its average ( T ¯ ) or sum value (δ0) with a convective heat transfer coefficient of 30 W·m−2·°C−1. The temperature drop is mainly concentrated in the initial freezing stage. The temperature inside and outside the frozen soil wall first rapidly decreases during the initial 60 freezing days, while the average value decreases from 19.5 °C to −7.5 °C, and then the reduction rate of temperature decreases while the average value decreases by approximately 1 °C in the next 120 freezing days. Meanwhile, the temperature in the outside position (T(O2/α=30)) is constantly higher than that in the inside position (T(I2/α=30)) under normal freezing construction, while the temperature difference between these two positions is basically no more than 0.7 °C. The thickness of the frozen soil wall starts to grow when the temperature passes 0 °C, and the growth rate also increases with continuous freezing, while the largest increase occurs during the 30~60 freezing days, and the sum thickness increases by approximately 1.2 m. With the continuation of freezing and the gradual thickening of the frozen soil wall, the growth rate gradually decreases while the thickness in the outside position exceeds the thickness inside the frozen soil wall. The relatively more concentrated cooling capacity transfer leads to a lower temperature in the inside position, while the larger external fields and the inside ventilation effect tend to make the thickness outside of the frozen soil wall continue to increase and exceed that in the inside position.
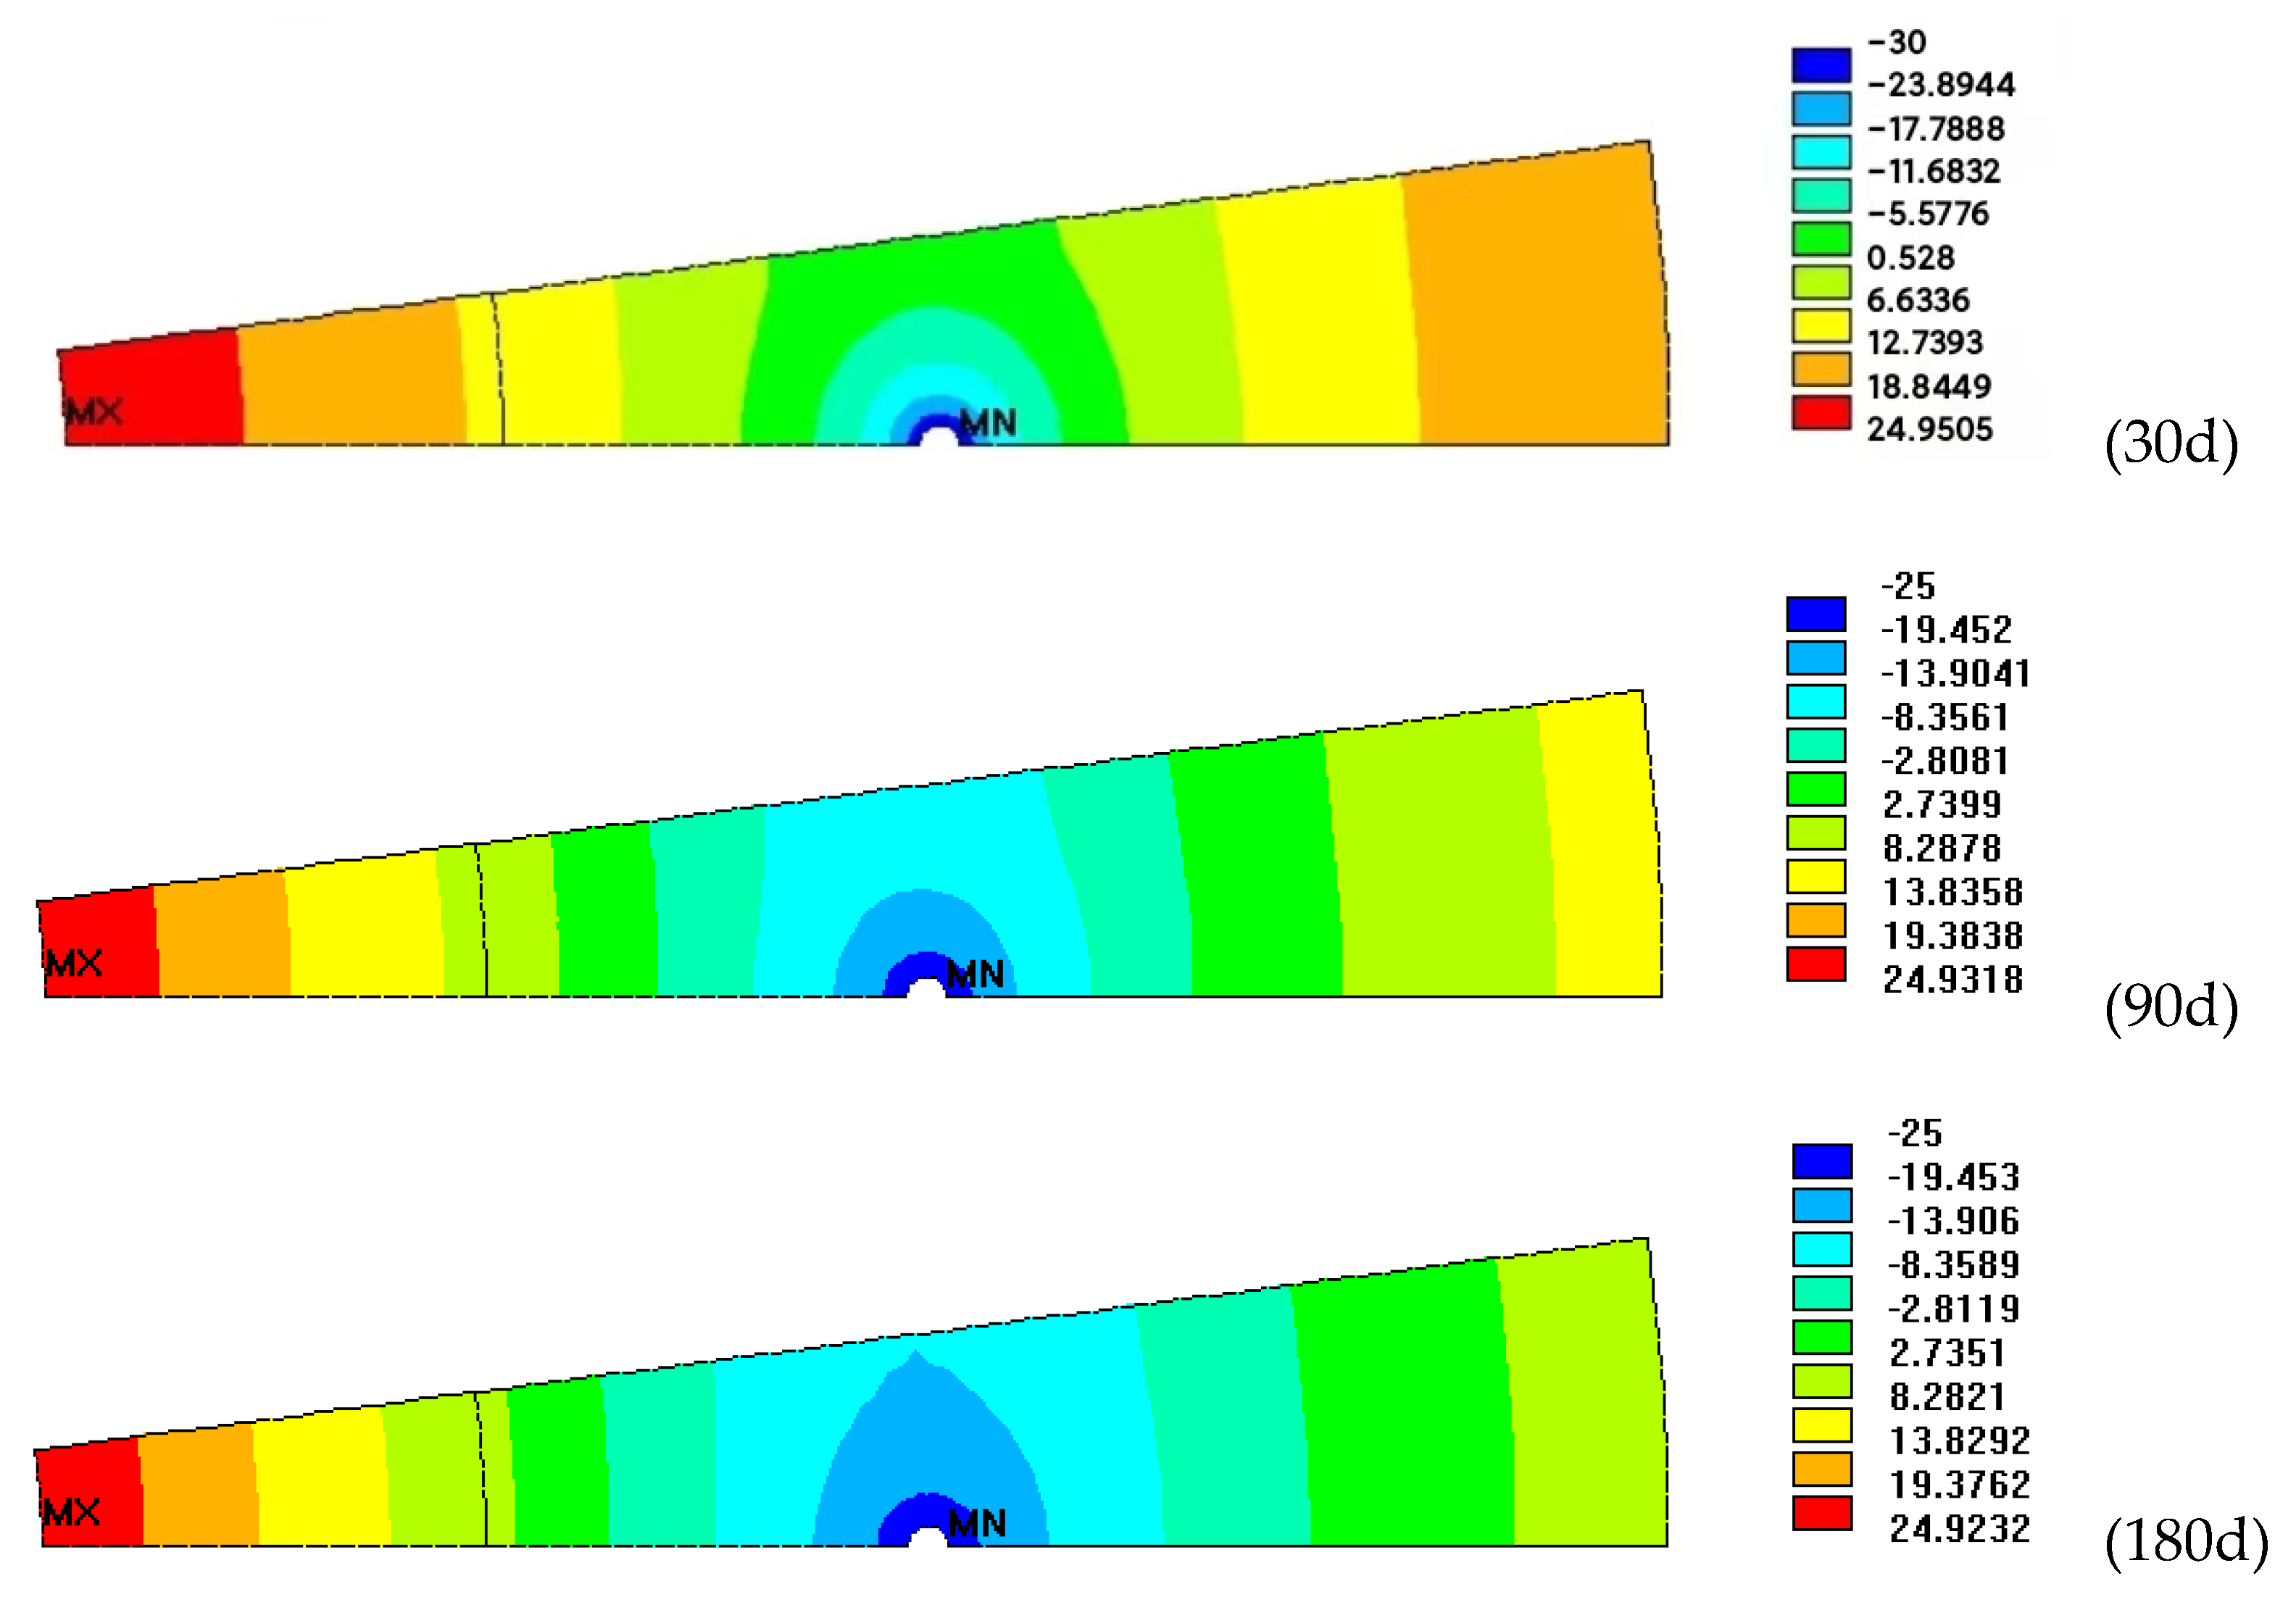
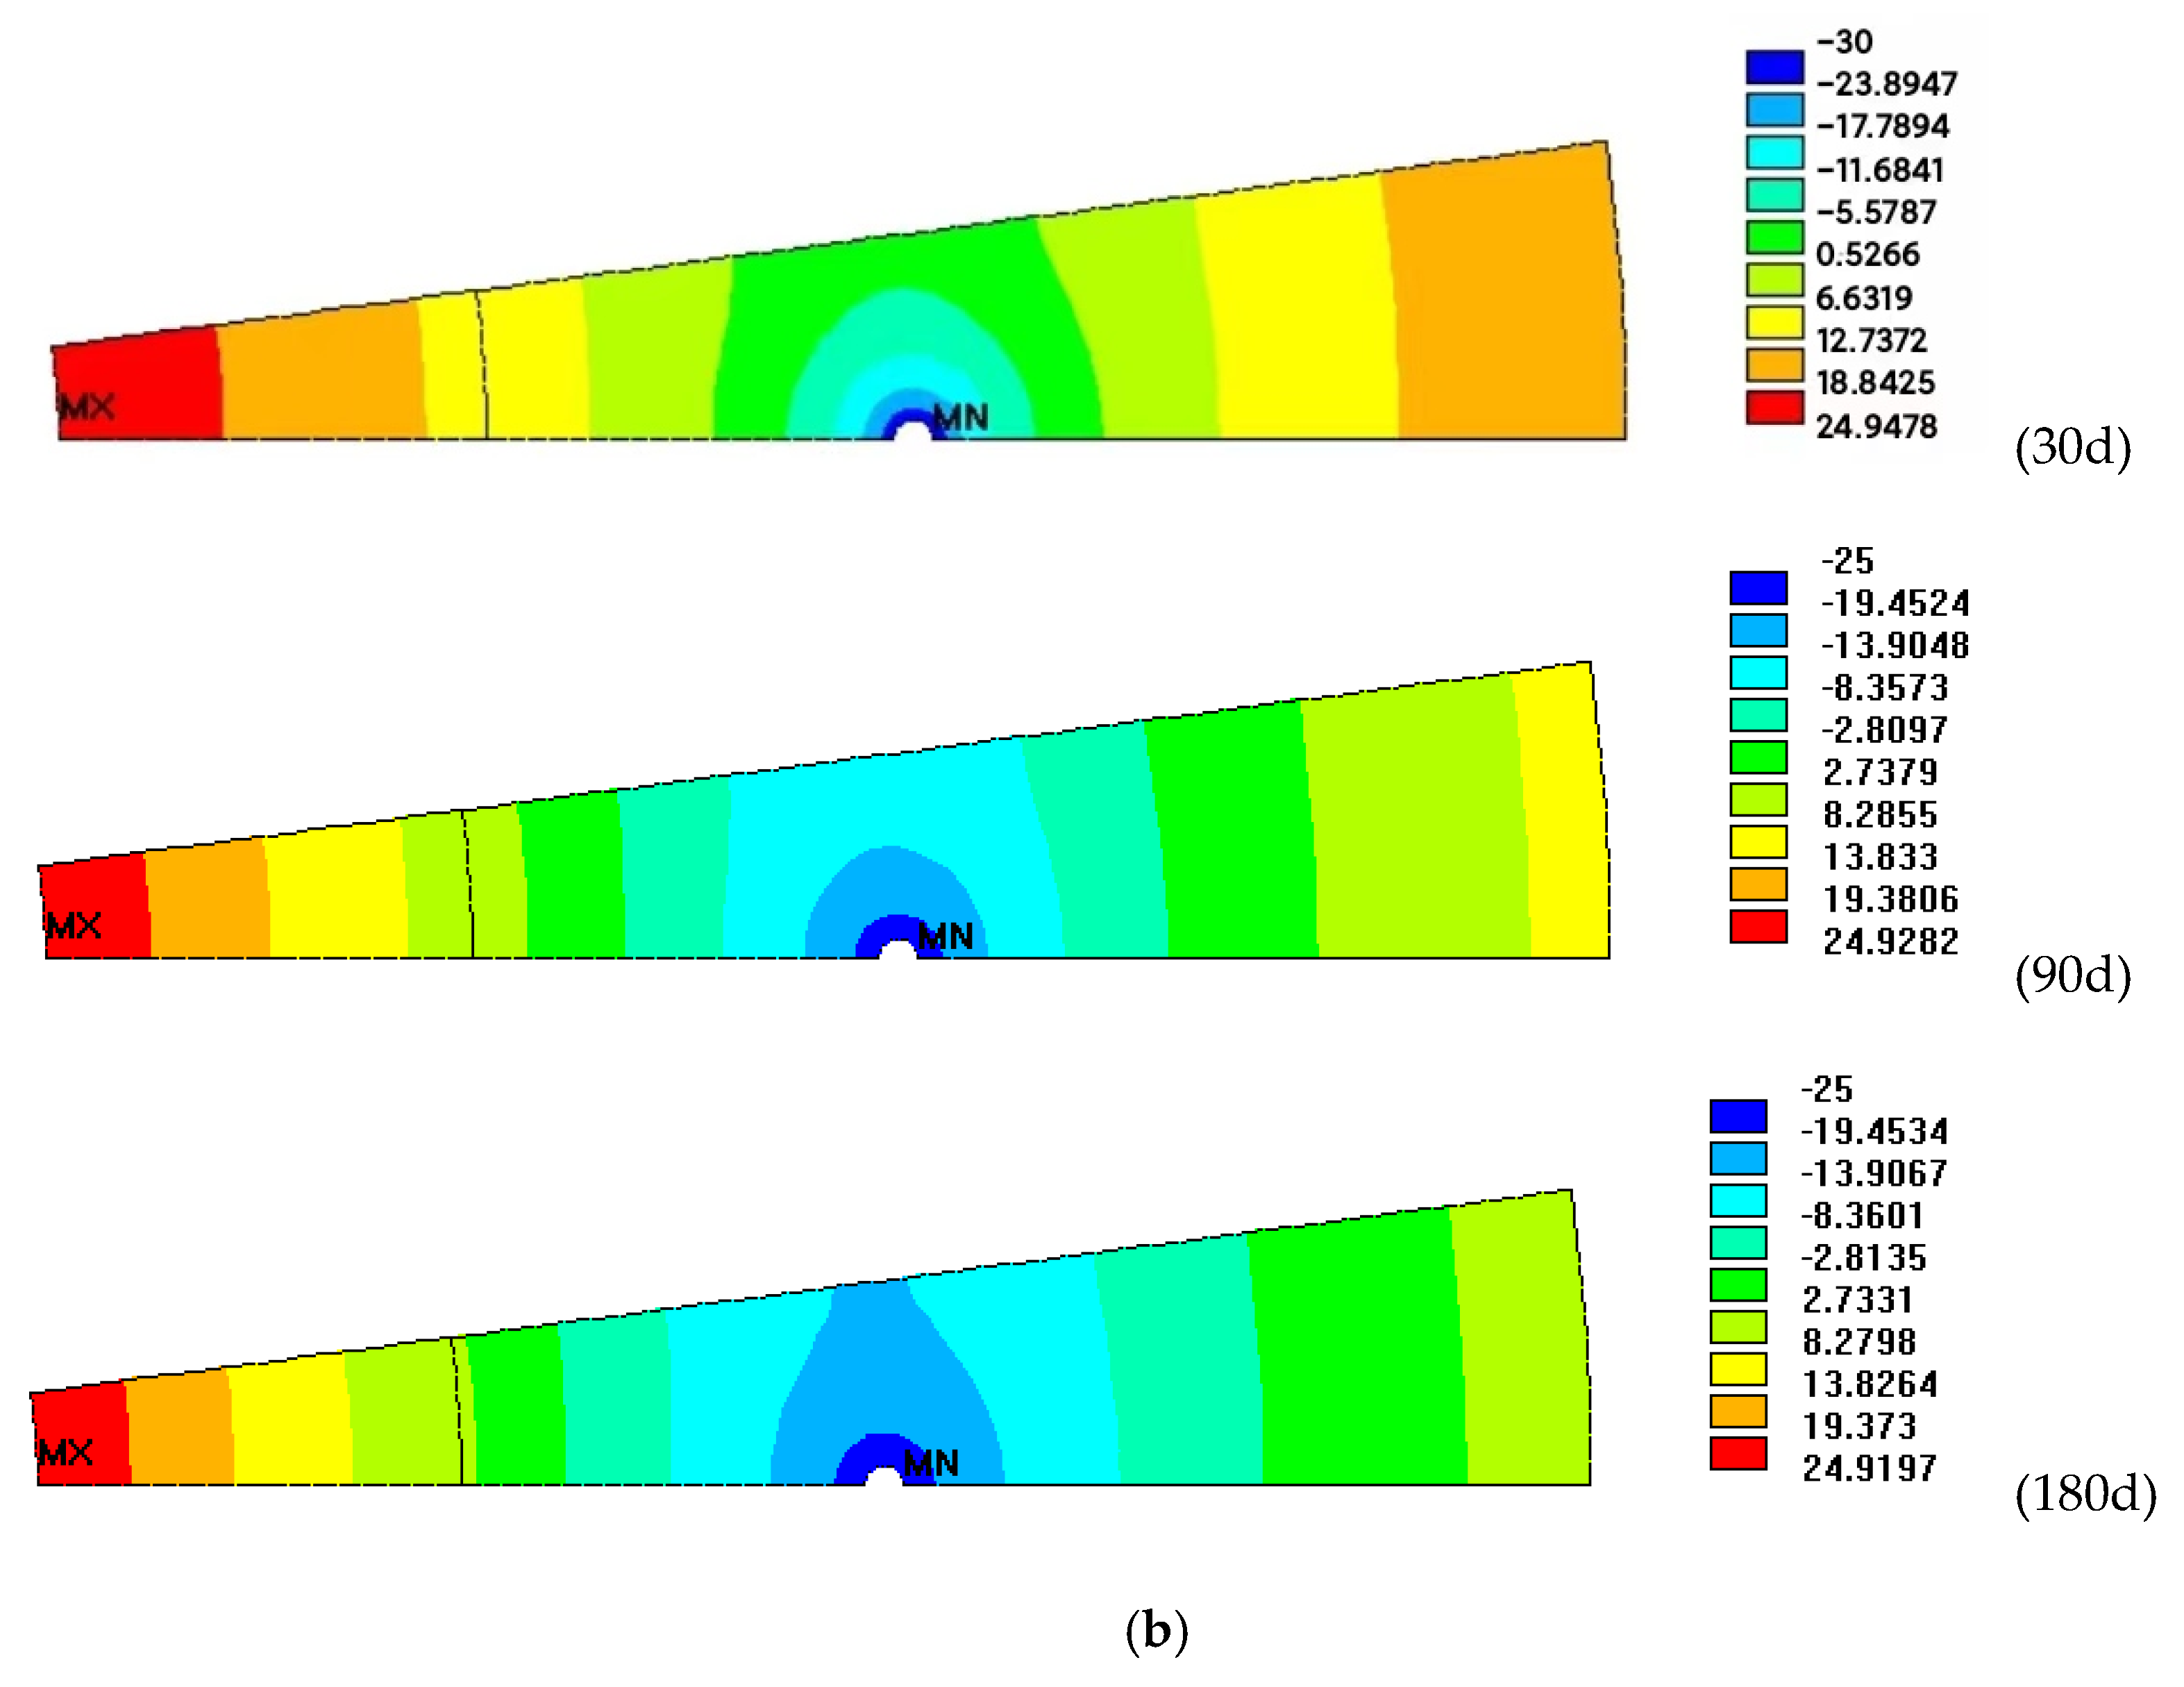
To better show the development process of the frozen soil wall, the temperature contours of the calculation analysis within 30 d, 90 d, and 180 d are drawn and shown in Figure 9. The distribution of the freezing temperature gradually changes from a circle to an oval with a decrease in temperature, as the cooling capacity in the freezing region between the two freezing tubes is the most sufficient, while the temperature drops fastest at the mid–point of the center line of the two freezing tubes and then gradually diffuses outward, with this point as the center. Thus, a bulge exists in the contour when the shape of the freezing region changes. The temperature of the freezing interface decreases from 0.5 °C to −8 °C (below 0 °C) with an increase in freezing time, which means that the frozen soil wall completed the cross-loop in 180 days under ventilation conditions. The temperature around the shaft wall decreases from 12.7 °C to 8.2 °C during freezing. The temperature region below 0 °C around the freezing tube gradually increases with an increase in freezing time, and the second low-temperature region significantly changes, gradually increasing from a small semicircle to a large shoot tip.

3.2. The Effect of the Layout Radius of the Freezing Tube

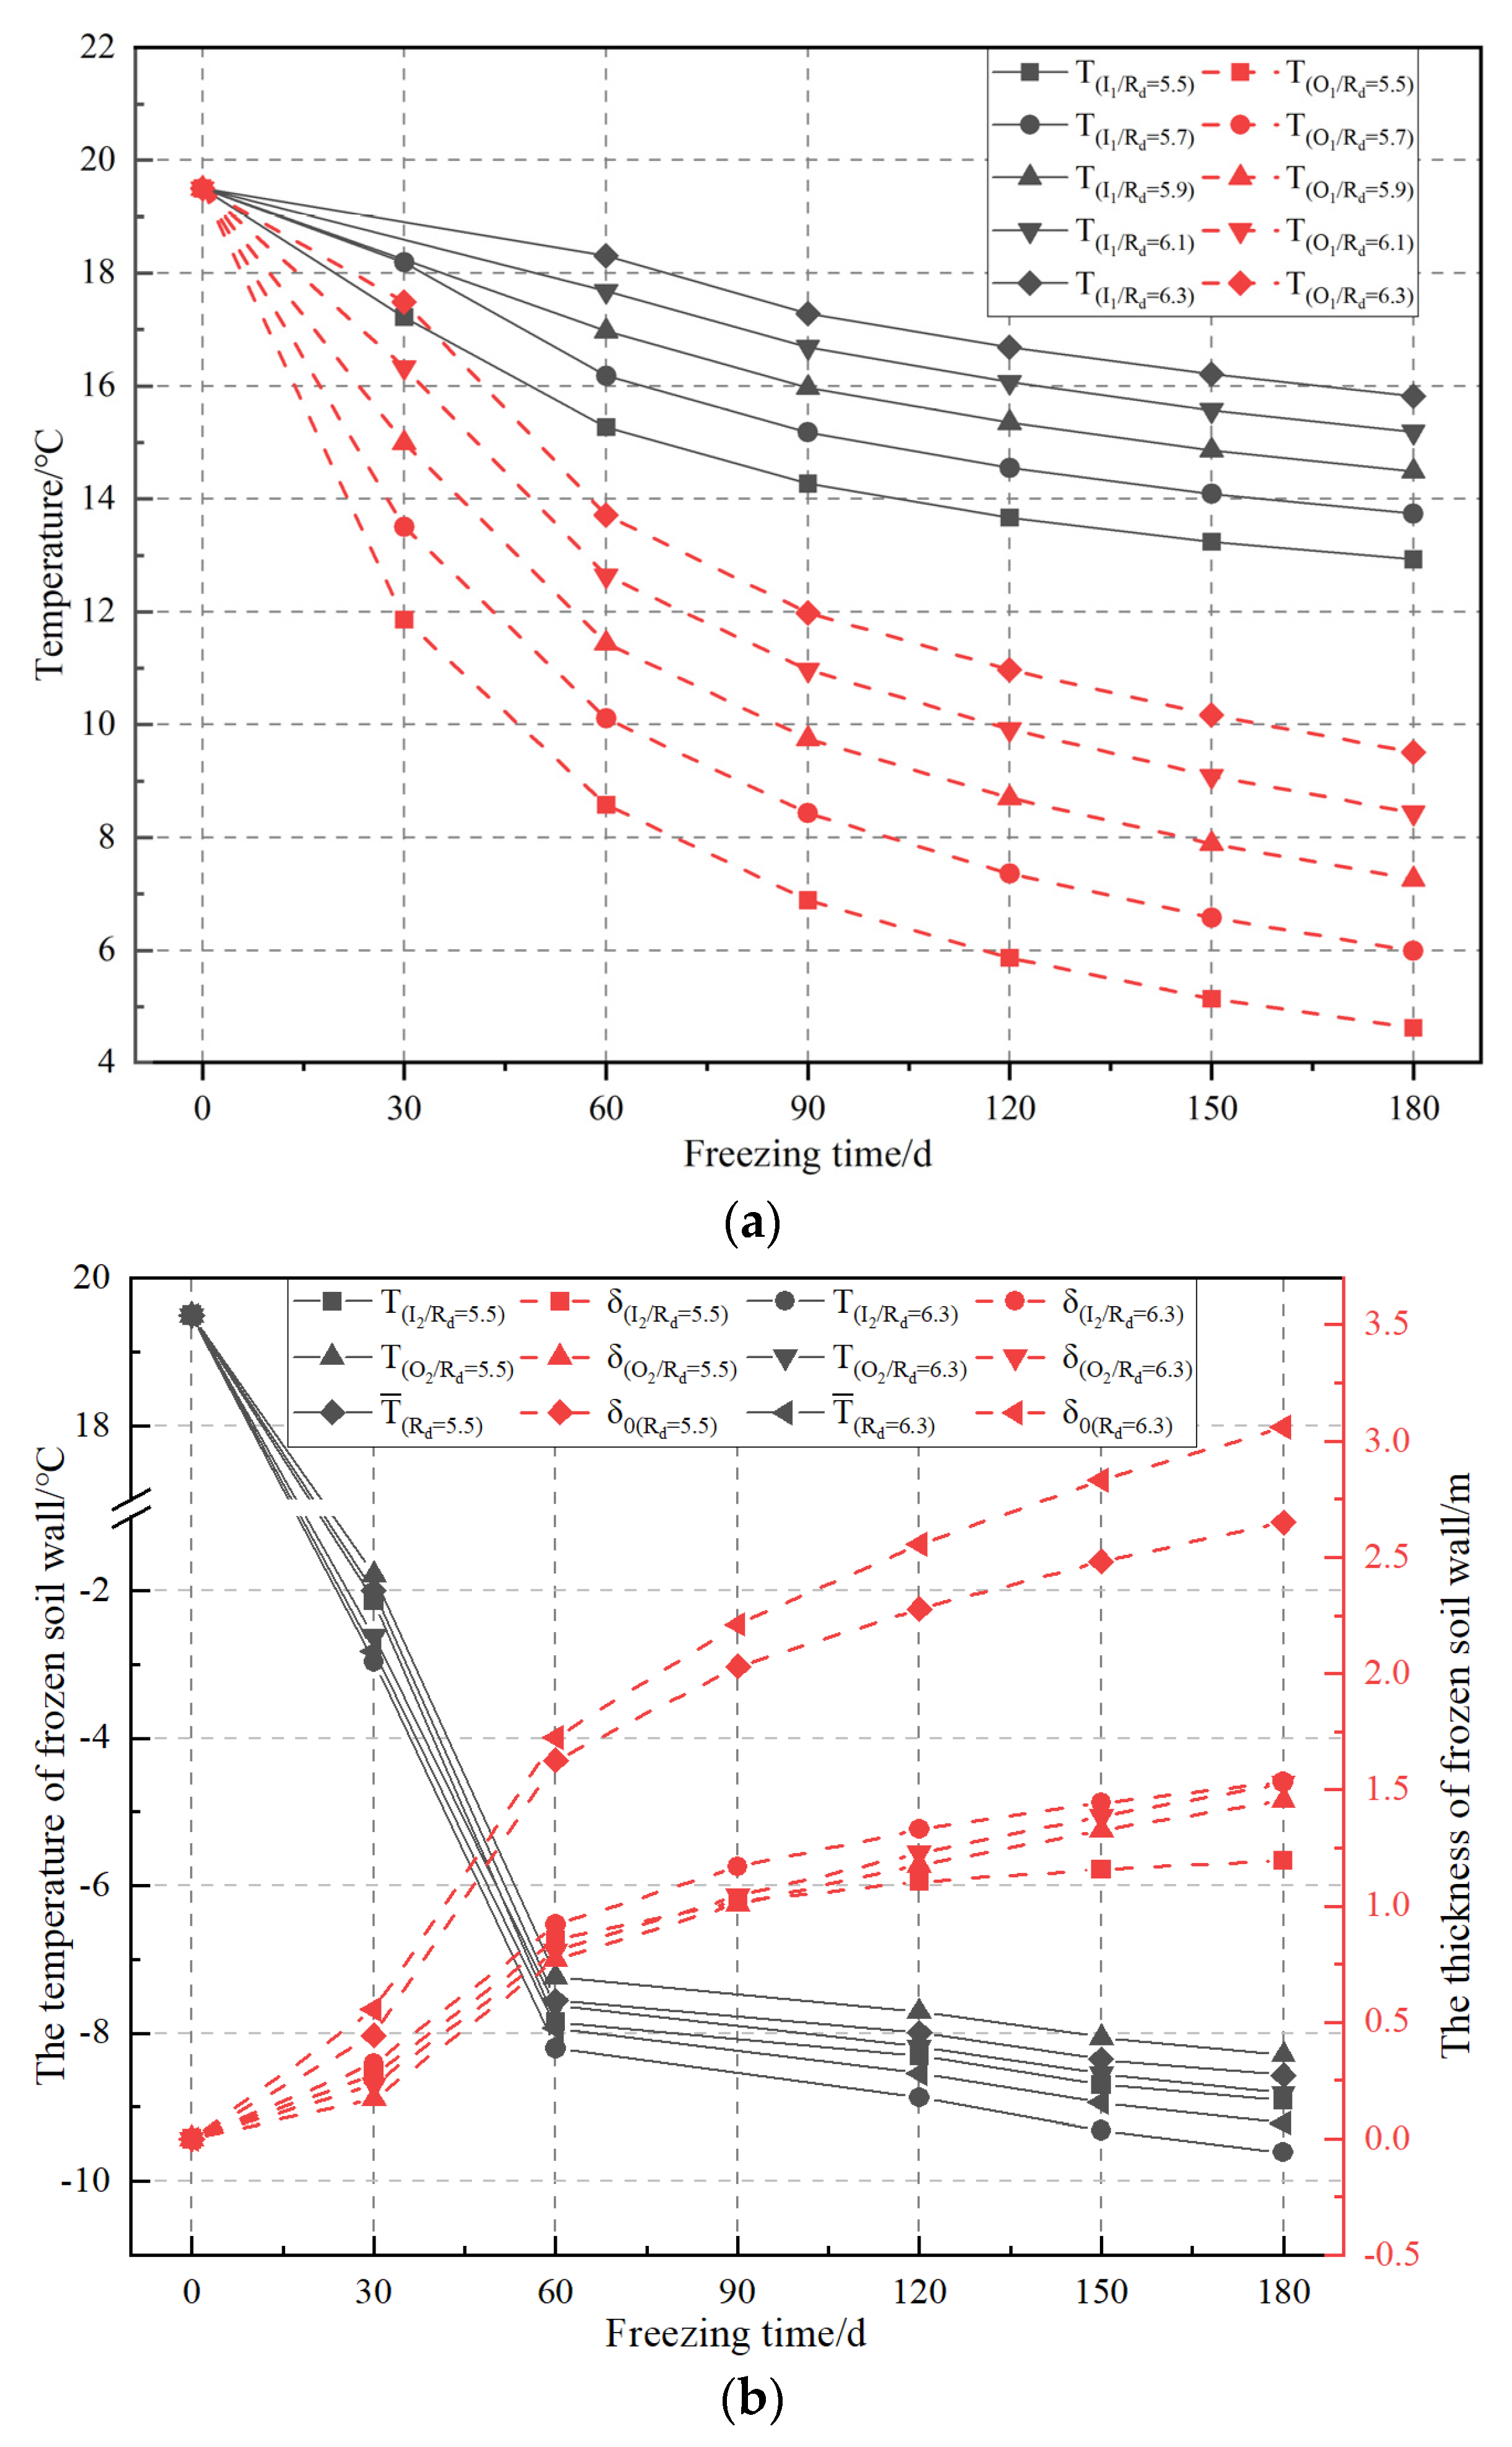
The layout radius of the freezing tube has an important effect on the freezing effect and freezing time. Figure 10a shows the temperature evolution curves in the interlayer (I1) and outside wall (O1) of the shaft wall under different layout radii of freezing tube (Rd) and different freezing time. The temperatures in the interlayer and outside position gradually decrease with an increase in freezing time, while the variance in the temperature in these two positions is relatively clear, and the amplitude of variation gradually becomes greater when the layout radius of the freezing tube slowly decreases. For example, the temperature in the interlayer position between the layout radius of the freezing tube of 5.5 m and 5.7 m is 8.3 °C and 6.7 °C, respectively, and this value decreases to 6.3 °C when the layout radius of the freezing tube ranges from 6.1 m to 6.3 m (within 180 d). The amount of cooling per unit space becomes higher and the transfer rate of cooling capacity is greater when the layout radius of the freezing tube decrease. The incremental cooling effect would also increase due to the larger temperature gradients. Thus, the value of the layout radius of the freezing tube has a greater impact on the temperature distribution of the shaft wall under ventilation conditions.
The temperature (T) and thickness (δ) evolution inside (I2) and outside (O2) the frozen soil wall and its average ( T ¯ ) or sum value (δ0) with the layout radius of the freezing tube of 5.5 m and 6.3 m are presented in Figure 10b. The decreasing trend of temperature and the increasing trend of thickness of the frozen soil wall are similar under different layout radii of freezing tubes, while the frozen soil wall thickness shows an obvious increase when the layout radius of the freezing tube increases. For example, the sum thicknesses of the frozen soil wall with the maximum and minimum layout radii of the freezing tube are 0.55 m and 0.44 m, respectively, when the freezing time reaches 30 days, and the sum thickness (δ0) of the frozen soil wall increases to 3.06 m and 2.65 m when the freezing time reaches 180 days, which means that the appropriate increase in the layout radius of the freezing tube can speed up the freezing efficiency, and the decrease in temperature and increase in thickness will make the frozen soil wall more stable and provide better shaft construction protection under ventilation conditions.
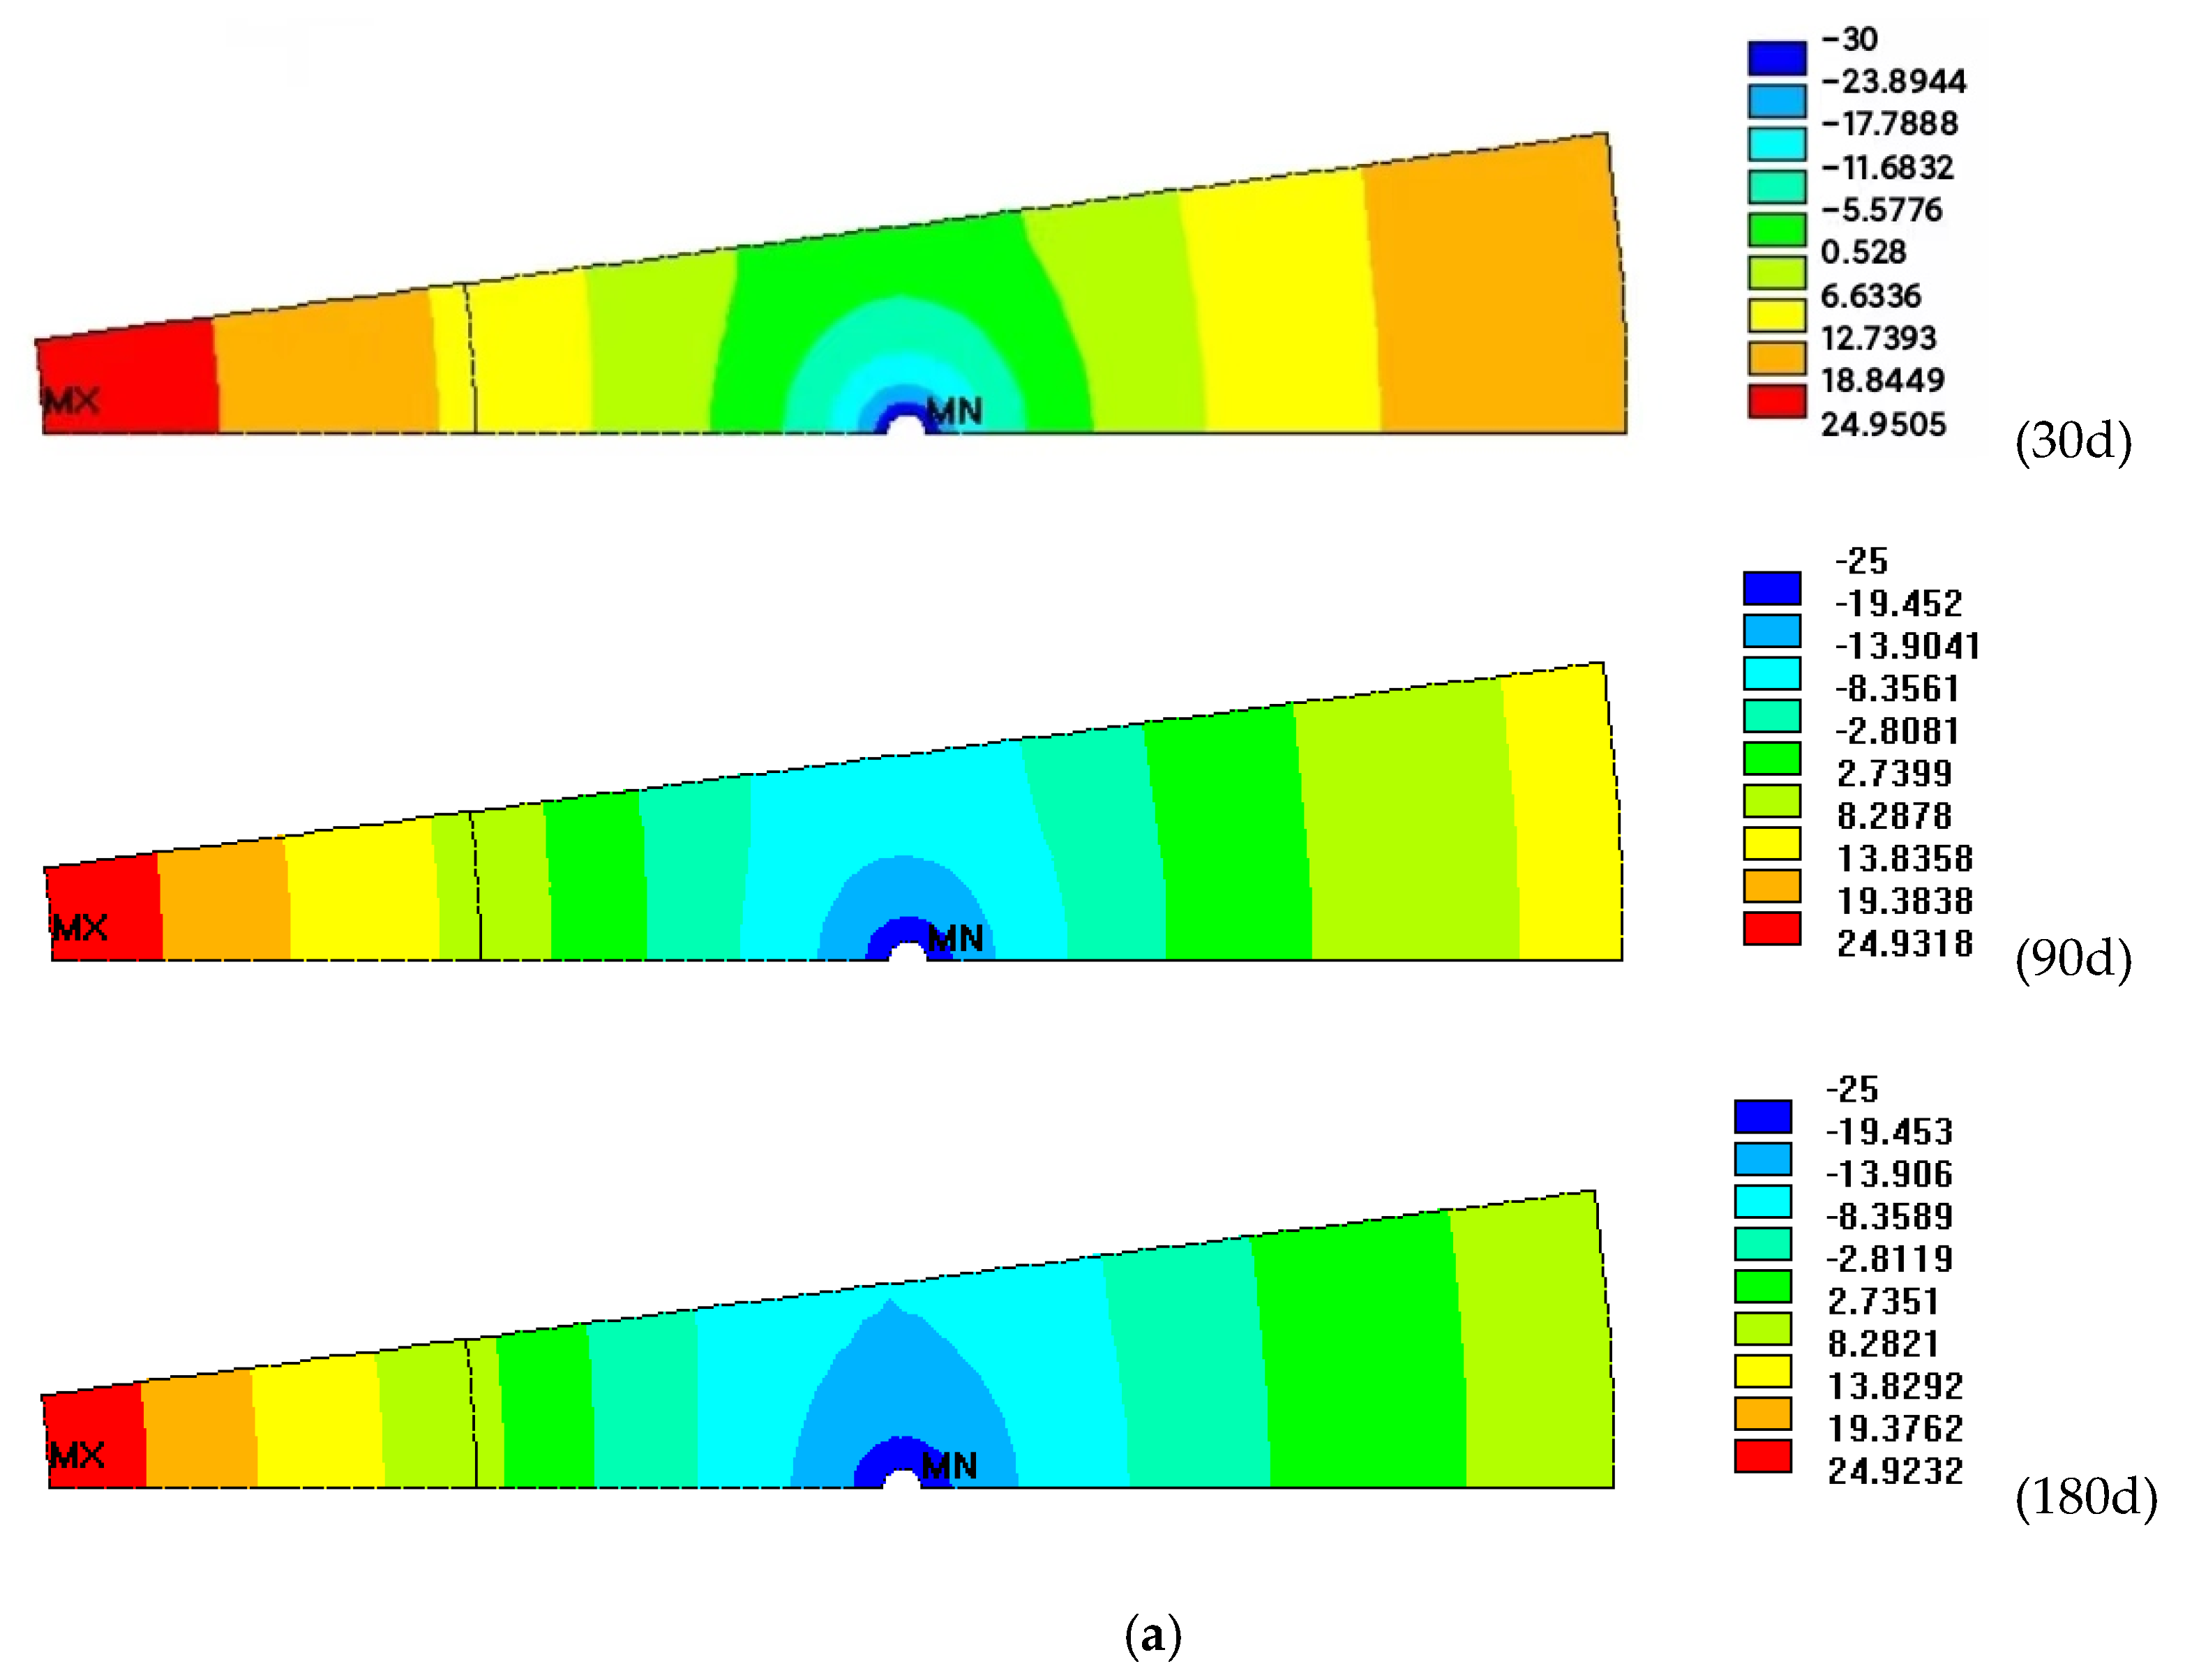
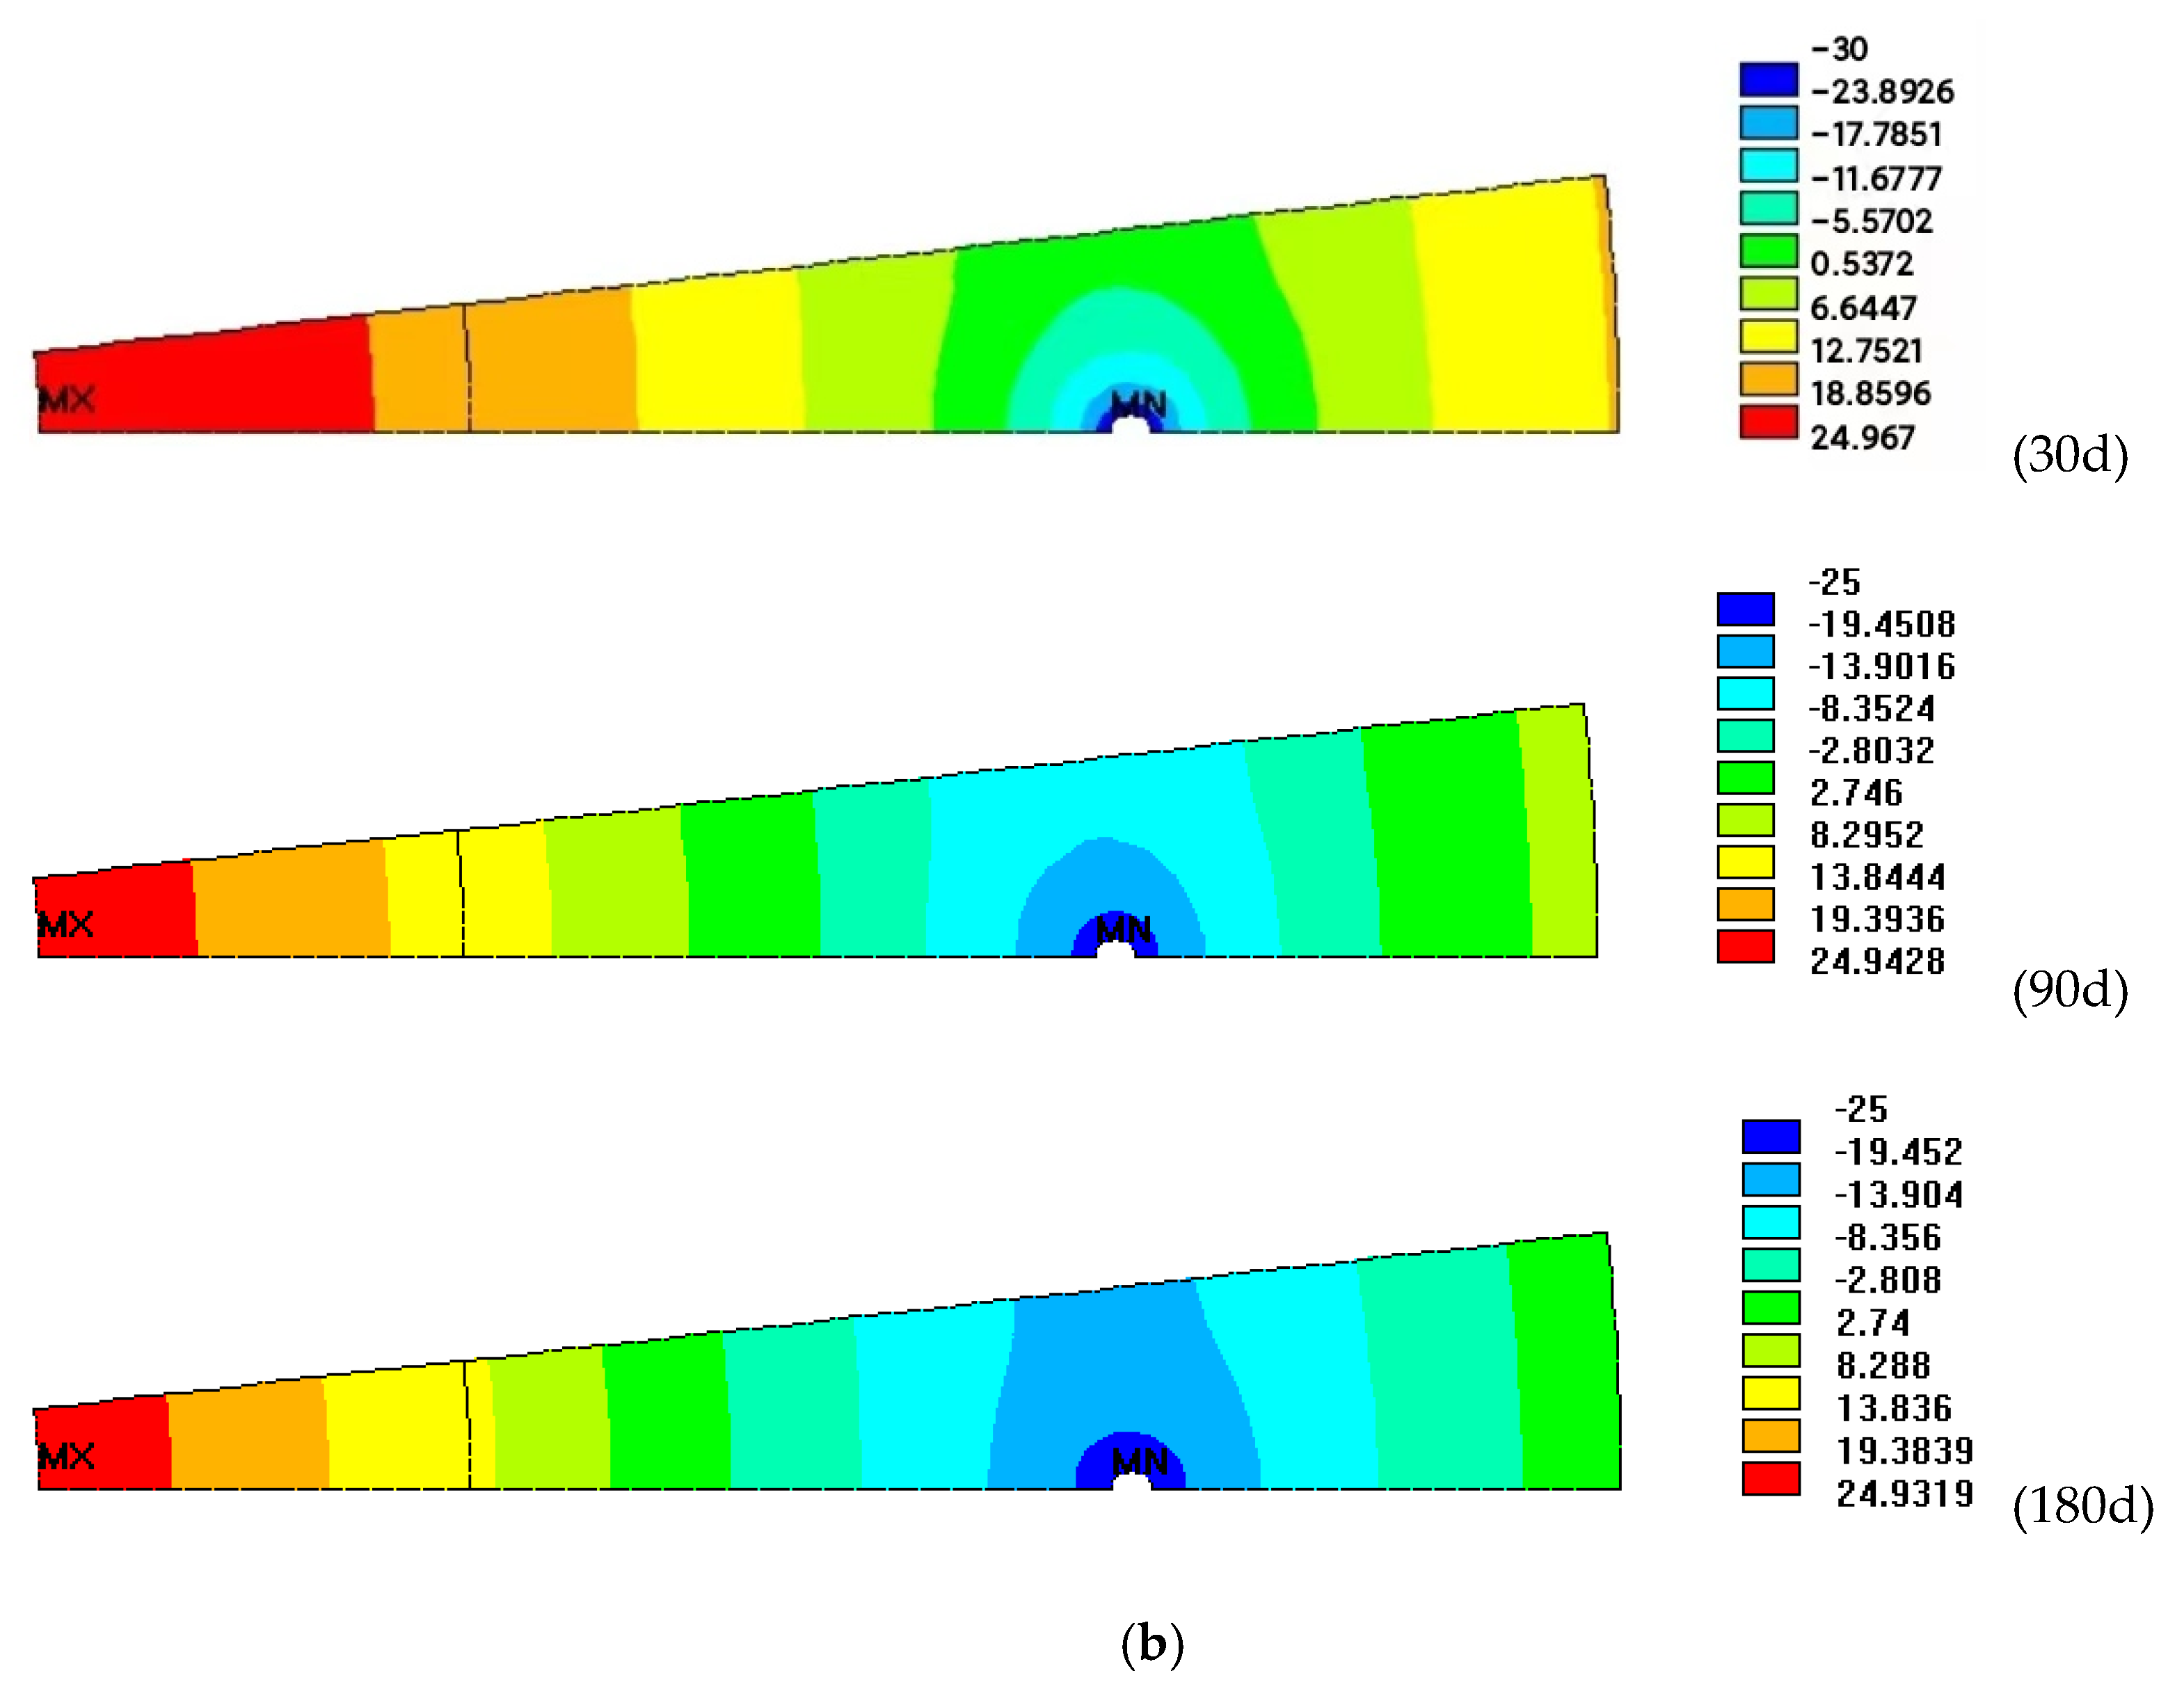
The temperature contours with the layout radius of the freezing tube of 5.5 m and 6.3 m are plotted to better demonstrate the freezing evolution laws and the effect of the layout radius of the freezing tube on this process, as shown in Figure 11a,b. The temperature of the freezing interface decreases from 0.5 °C to −8 °C (below 0 °C) as the freezing time increases when the layout radius of the freezing tube is 5.5 m, and this value decreases to −19 °C within 180 d when the layout radius of the freezing tube increases to 6.3 m, which means that the frozen soil wall completed the cross-loop in 180d under ventilation with different freezing tube layout radii. The larger layout radius of the freezing tube shows a better cross-loop effect. In addition, the temperature around the shaft wall decreases from 12.7 °C to 8.2 °C as the freezing time increases when the layout radius of the freezing tube is 5.5 m, while this temperature decreases from 18.8 °C to 13.8 °C as the freezing time increases when the layout radius of the freezing tube is 6.3 m. The second low-temperature region with a freezing tube layout radius of 6.3 m gradually increases from a small semicircle to a large ellipse, which is wider than that of 5.5 m. Thus, a low temperature distribution zone with a smaller freezing tube layout radius is relatively smaller and more concentrated due to the cooling capacity loss induced by ventilation inside the shaft.

3.3. The Effect of the Freezing Tube Pitch

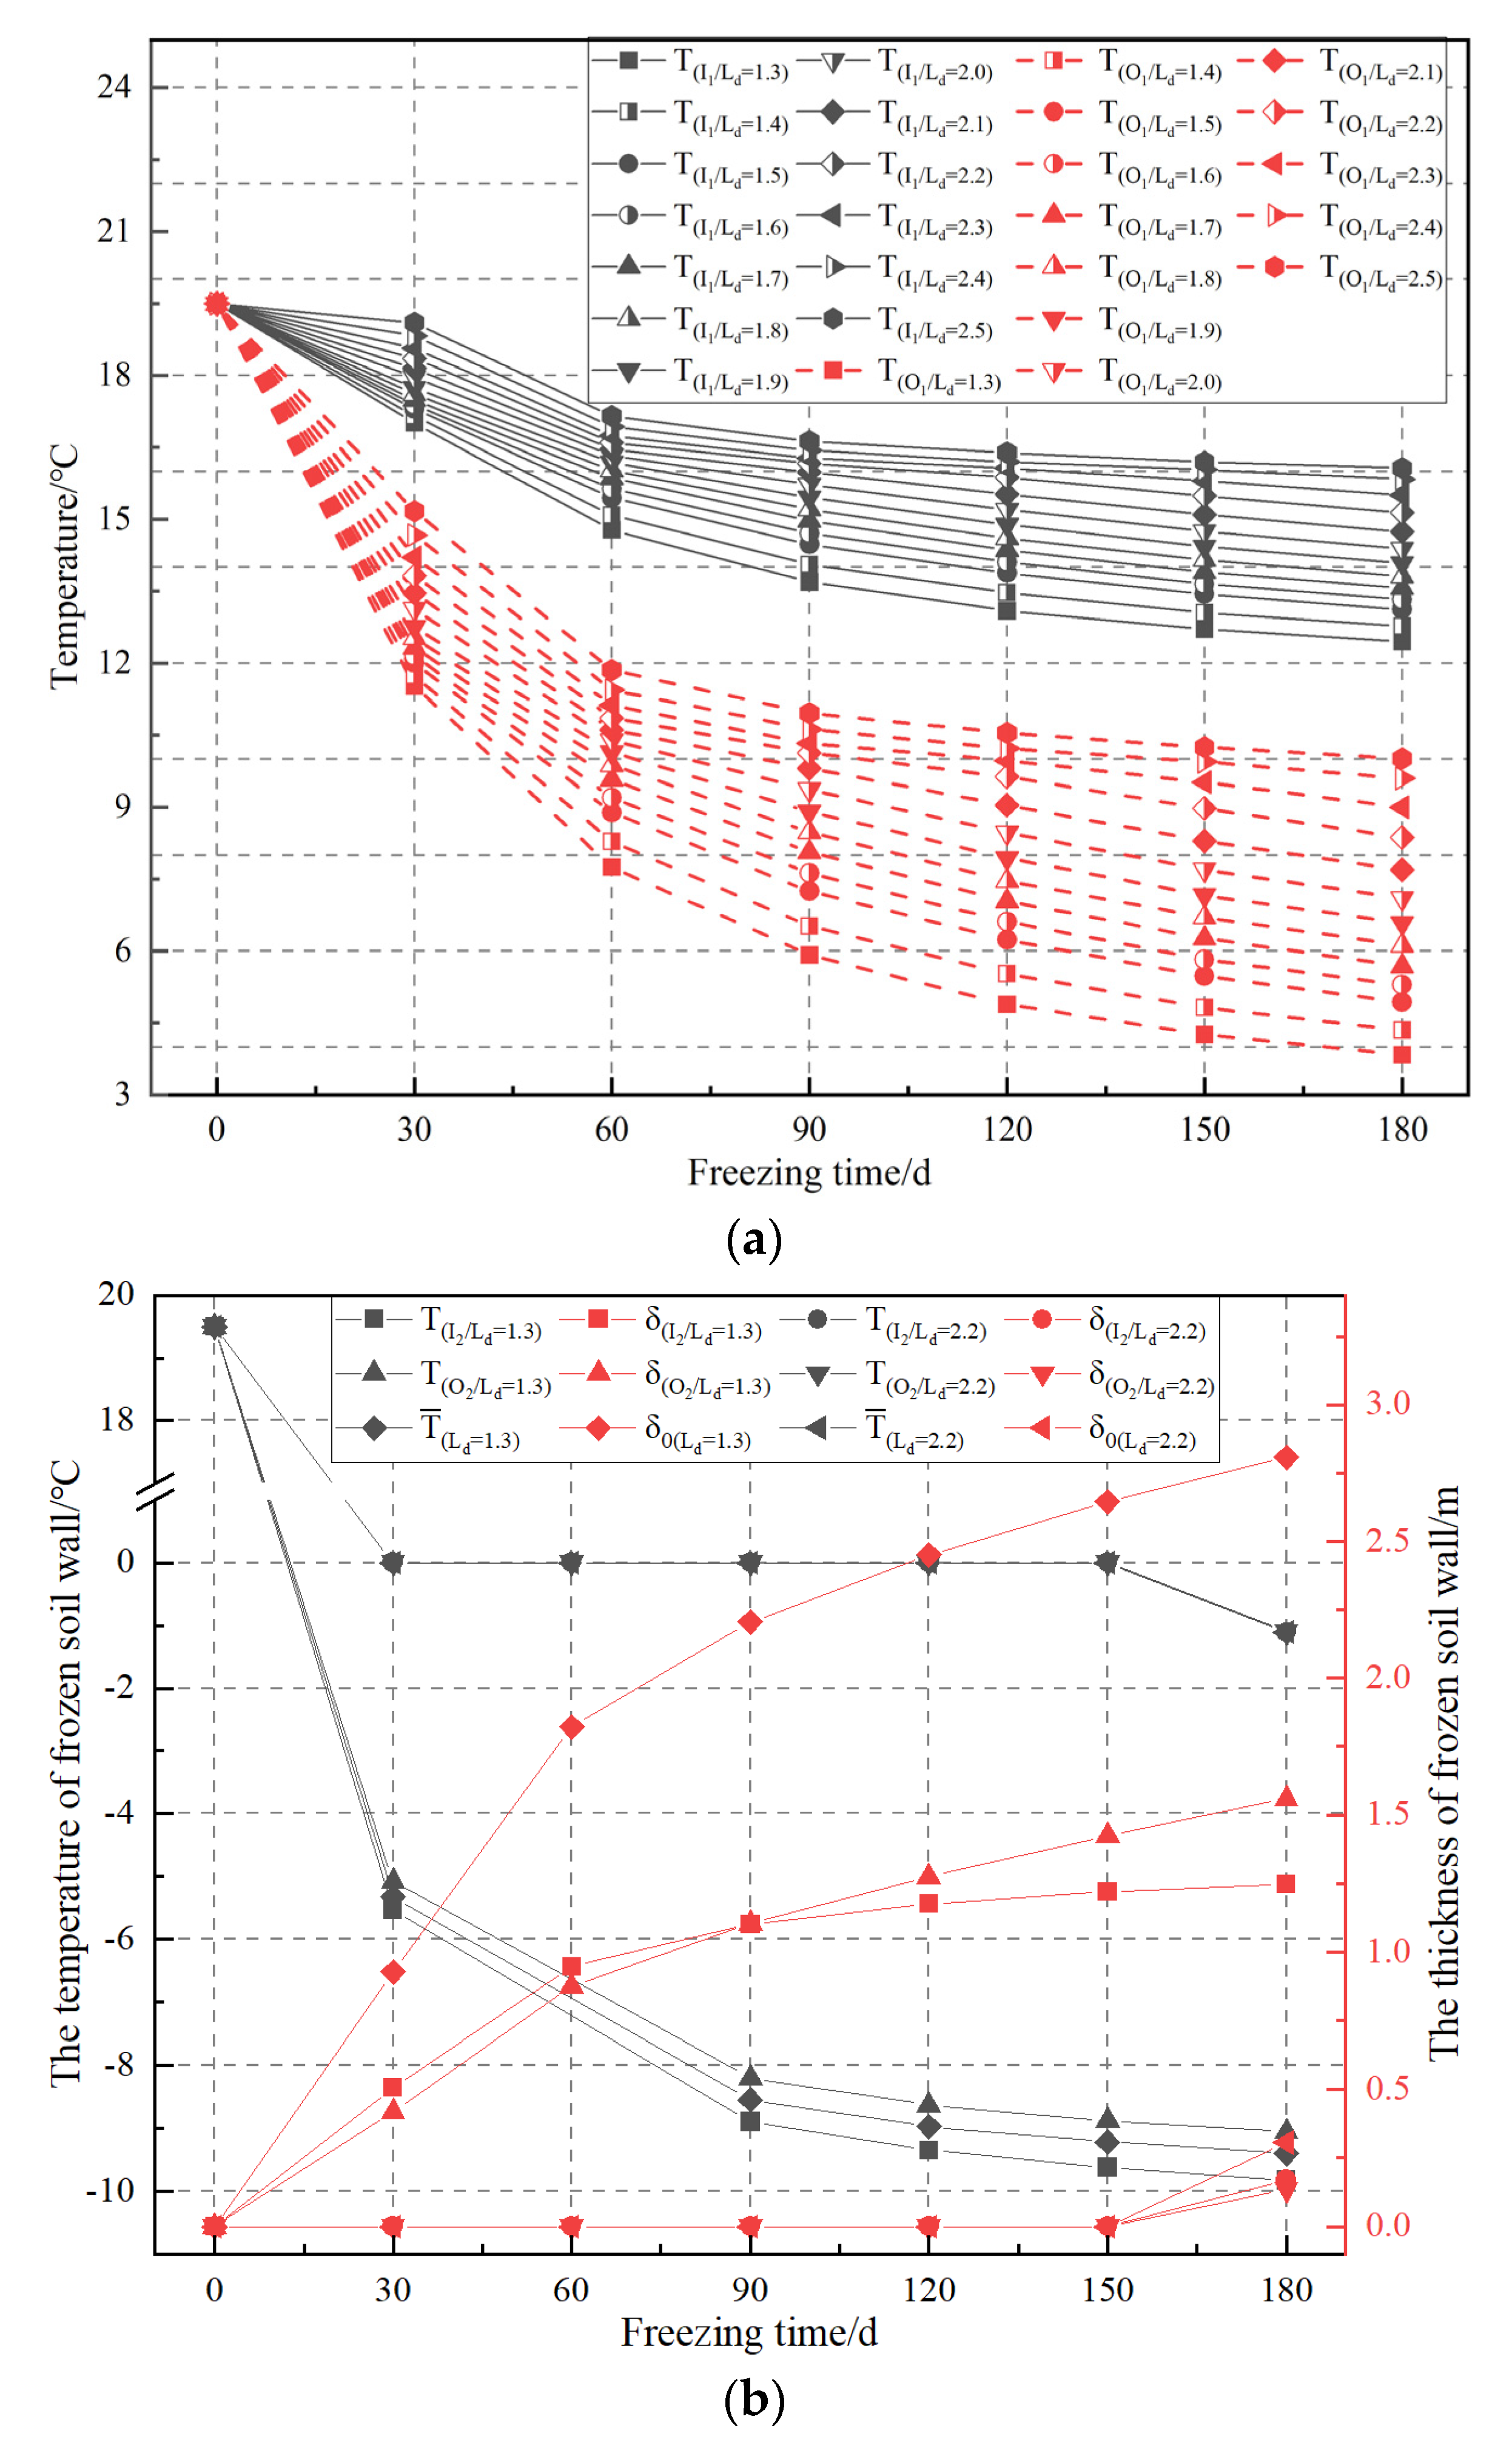
Figure 12a shows the temperature evolution curves of the interlayer (I1) and outside (O1) wall of the shaft wall with different freezing tube pitches (Ld) and freezing time (t). The temperatures in the interlayer and outside wall position rapidly decrease with an increase in freezing time, while this trend becomes less obvious when the freezing tube pitch increases. Meanwhile, the temperature difference between the interlayer and outside wall position shows a significant decrease when the freezing tube pitch is shortened. The temperature in these two positions ranges from 16.1 °C and 10 °C to 12.5 °C and 3.8 °C, respectively, when the freezing tube pitch decreases from 2.5 m to 1.3 m (within 180 d). The increasing freezing tube pitch would offer more cooling capacity and a higher heat exchange efficiency, which greatly contributes to the reduction in the shaft temperature. Meanwhile, the temperature in the interlayer and outside wall would be closer due to the rapid heat exchange and cold transfer in the inside wall of the shaft. Therefore, the value of the freezing tube pitch has a greater impact on the temperature of the interlayer and outside wall of the shaft under ventilation conditions.
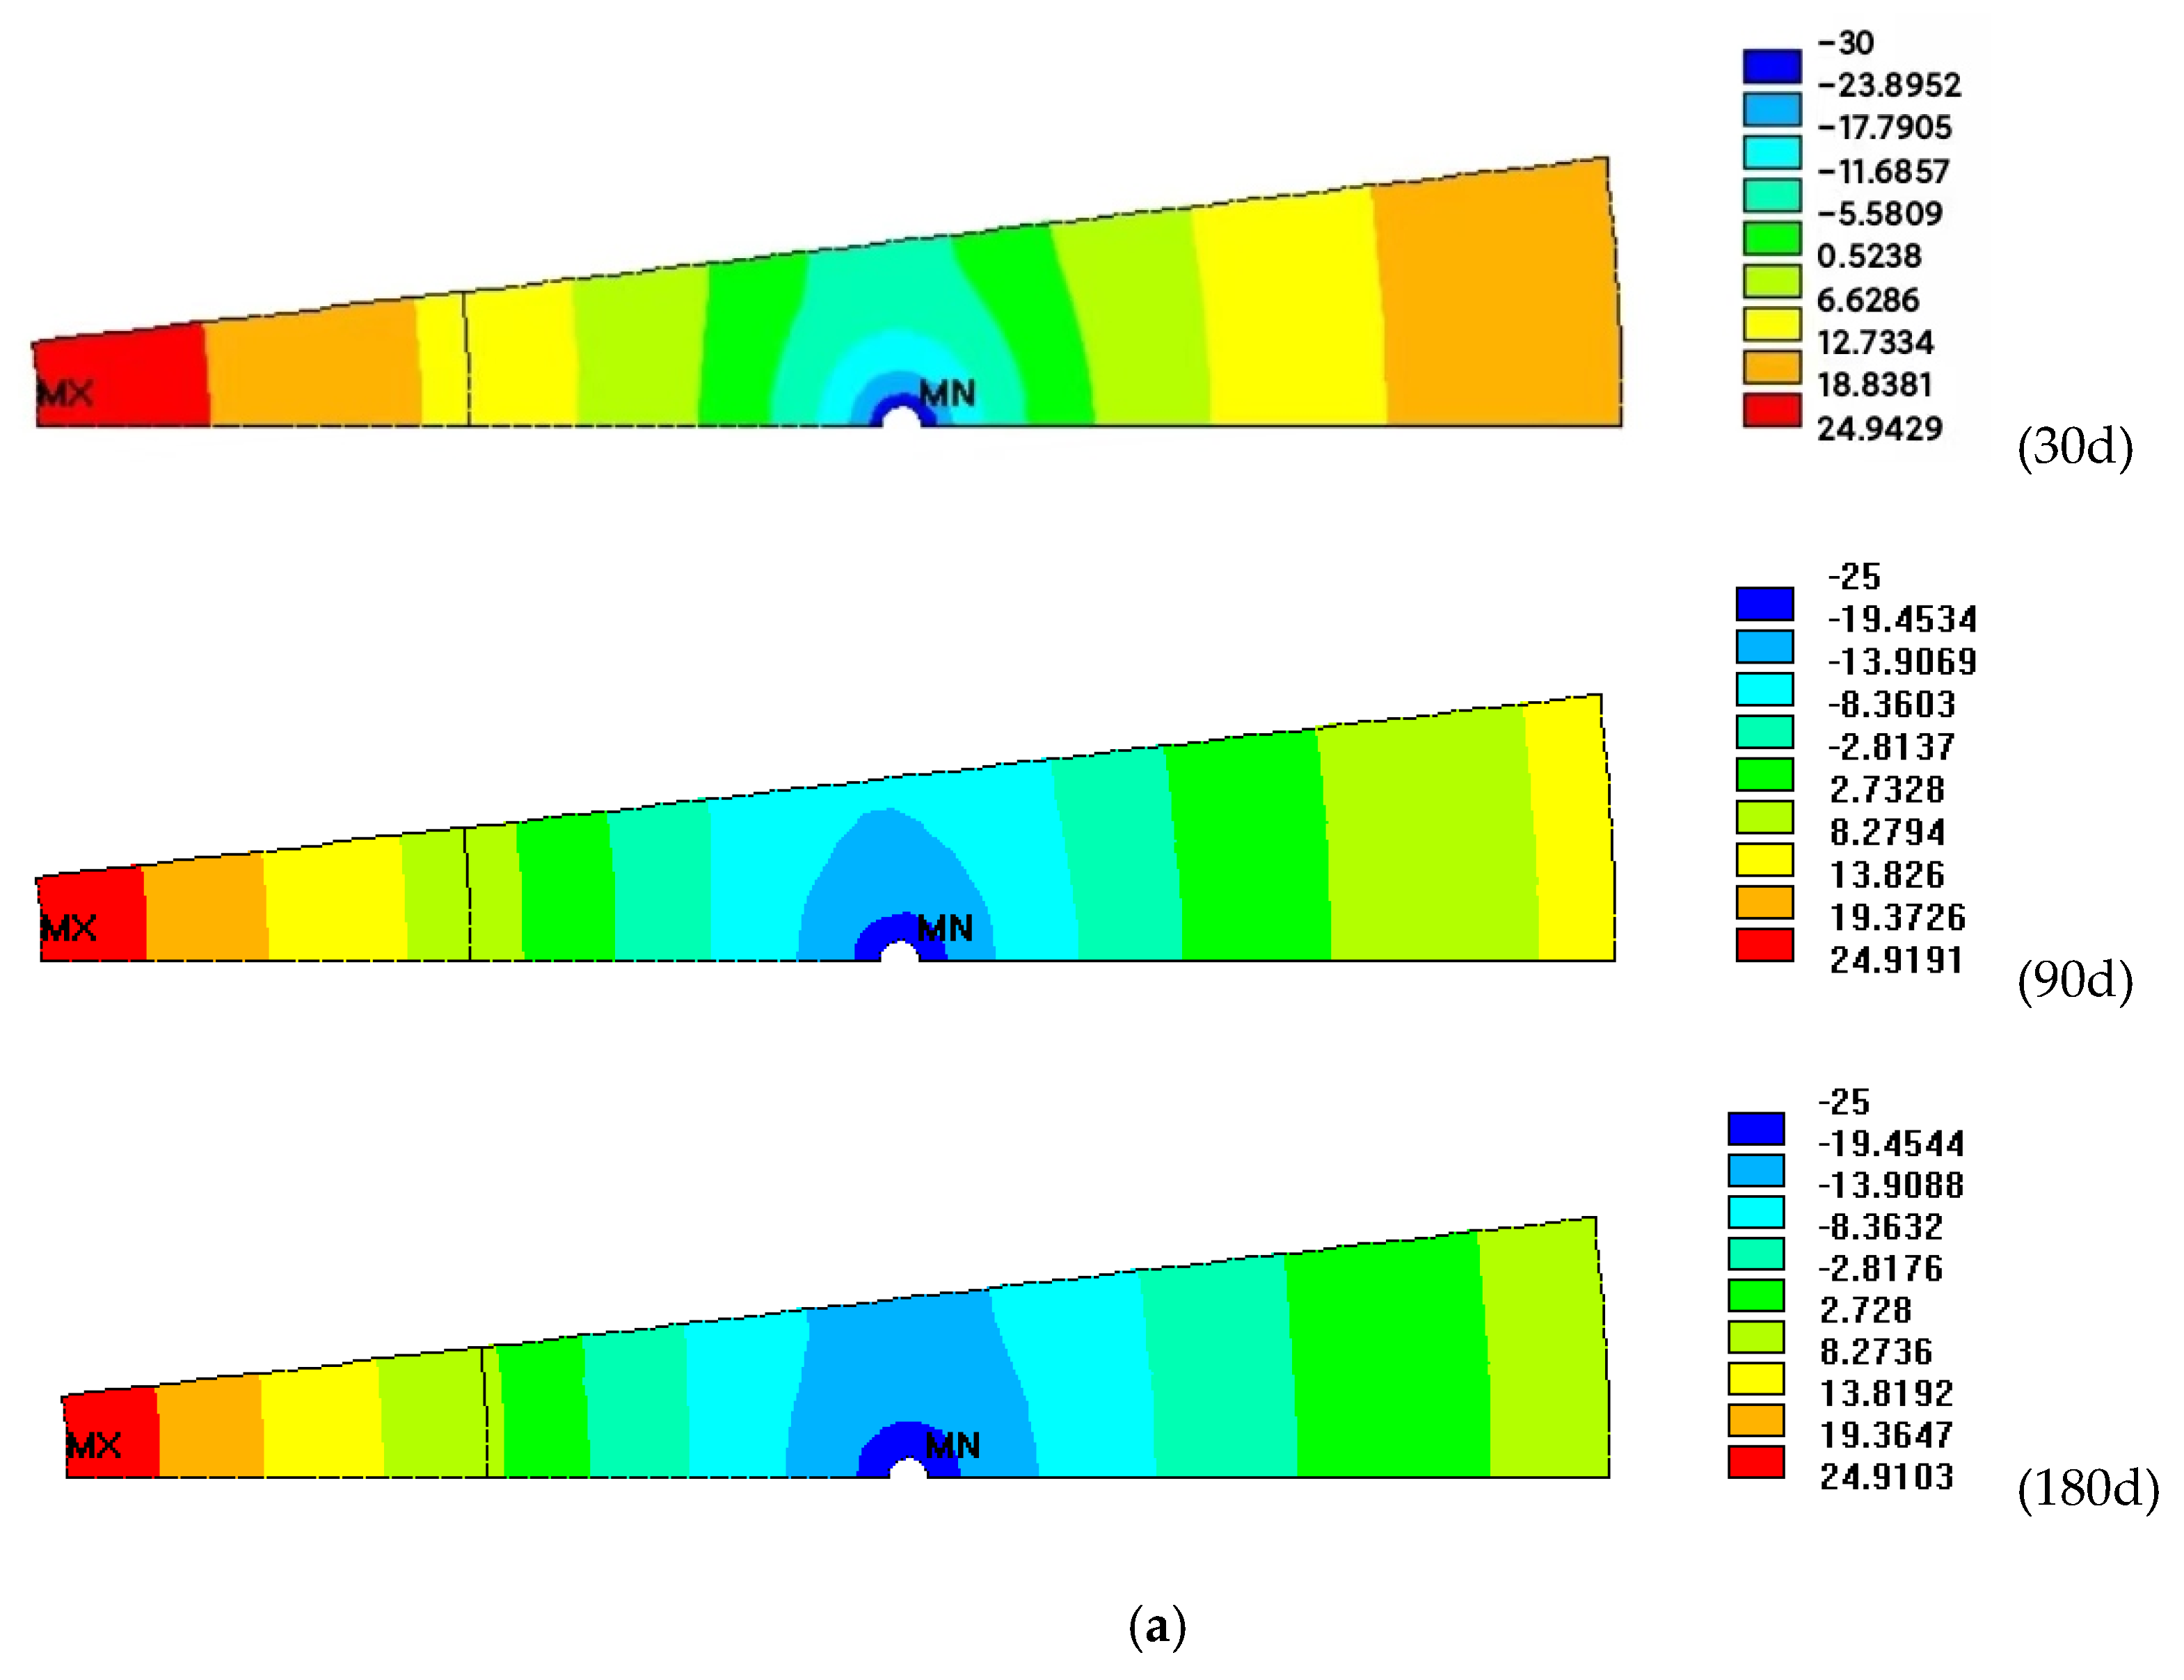
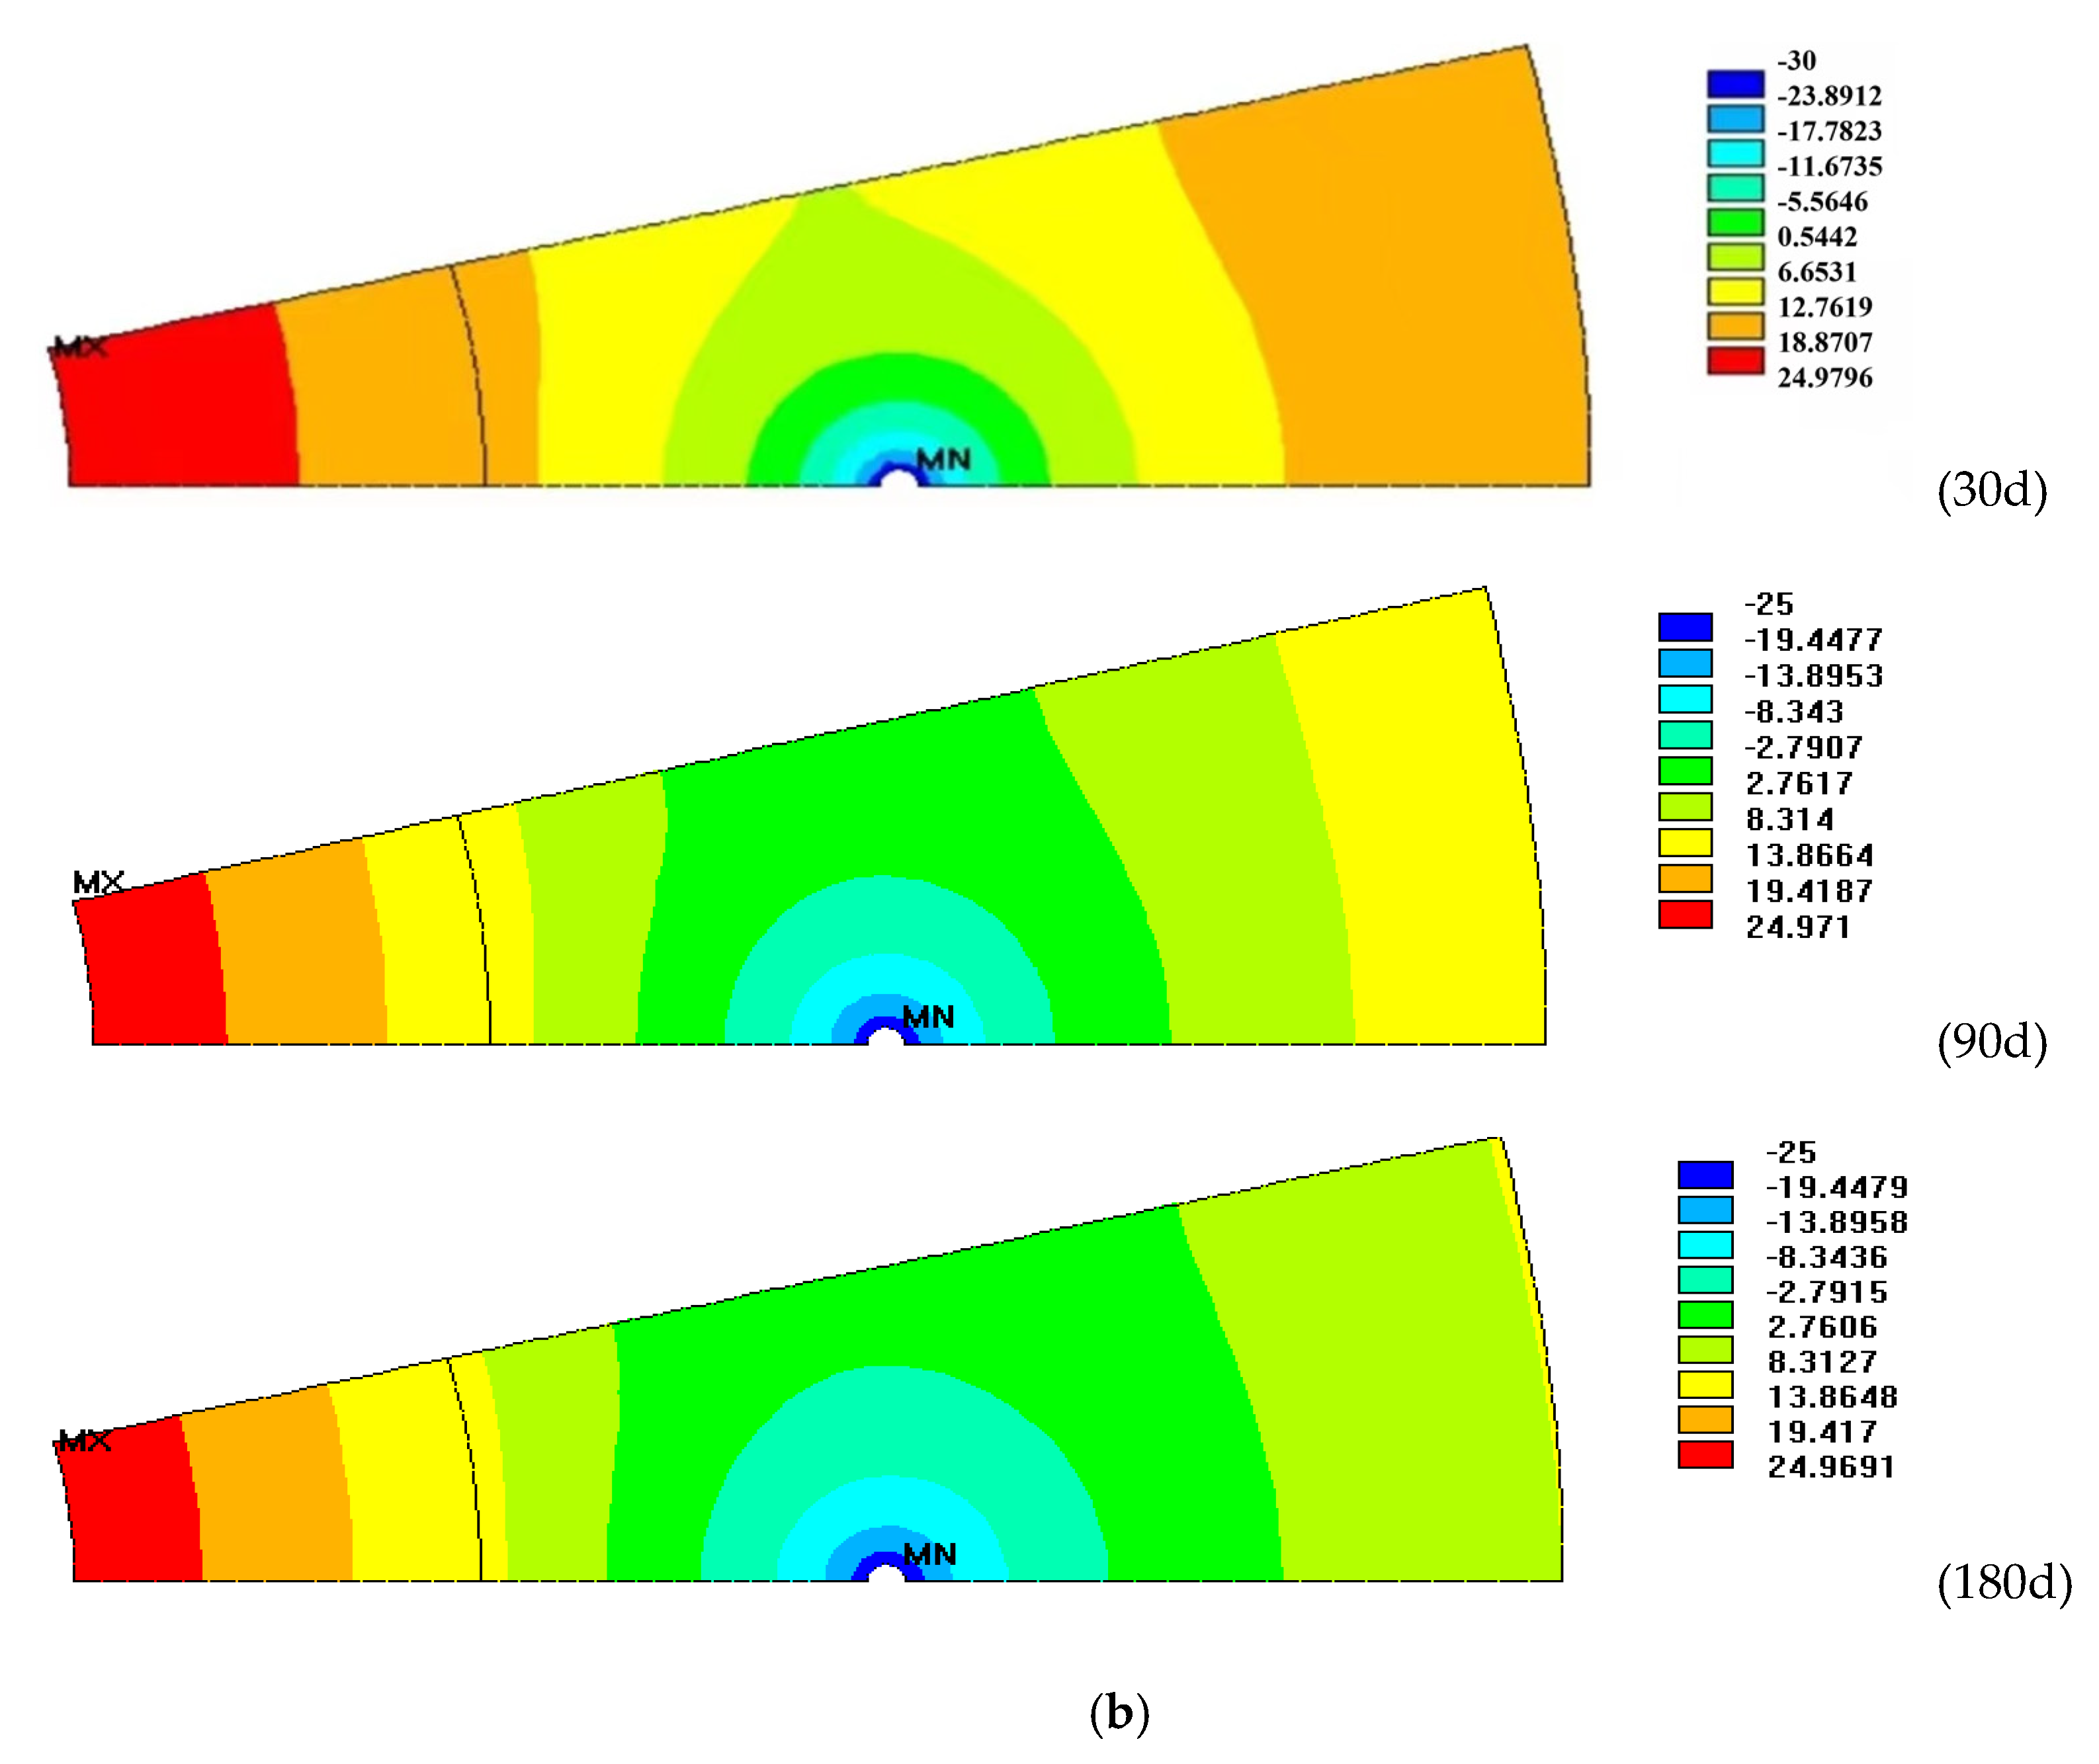
The temperature (T) and thickness (δ) evolution curves inside (I2) and outside (O2) the frozen soil wall and its average ( T ¯ ) or sum value (δ0) with different freezing tube pitches are shown in Figure 12b. The decreasing trend of temperature and the increasing trend of the thickness of the frozen soil wall can be obtained when the freezing tube pitch is 1.3 m, while these two parameters are unable to achieve the desired freezing effect. The sum thickness (δ0) of the frozen soil wall with a freezing tube pitch of 2.5 m is approximately 0 m with the freezing time increasing by 150 freezing days, and the frozen soil wall temperature of 0 °C cannot be exceeded. This value only increases to 0.31 m when the freezing time increases to 180 days. In contrast, the sum thickness of the frozen soil wall with the freezing tube pitch of 1.3 m increases to 2.81 m when the freezing time attains 180 days. The contours in Figure 13a,b clearly show the trend of temperature variation. The temperature of the freezing interface decreases from −5.6 °C to −19 °C (below 0 °C) as the freezing time increases when the freezing tube pitch is 1.3 m; however, this temperature only reaches 2.2 °C (above 0 °C) when the freezing tube pitch increases to 2.5 m, indicating that the frozen soil wall did not complete the cross-loop in 180 days under ventilation when the freezing tube pitch exceeded a certain threshold. In addition, the frozen area with a freezing tube pitch of 2.5 m is very limited, which may be because the excessive freezing tube pitch disperses the cooling volume and cannot form an effective cooling capacity transfer route, and the formation temperature cannot exceed the freezing temperature due to the considerable loss of cooling capacity, resulting in an unsatisfactory freezing effect and failure of the cross-loop. Therefore, it is important to control the deflection of the freezing tube as much as possible and reduce the freezing tube pitch to create the cross-loop of the frozen soil wall in the expected time under ventilation conditions.

3.4. The Effect of the Freezing Tube Diameter

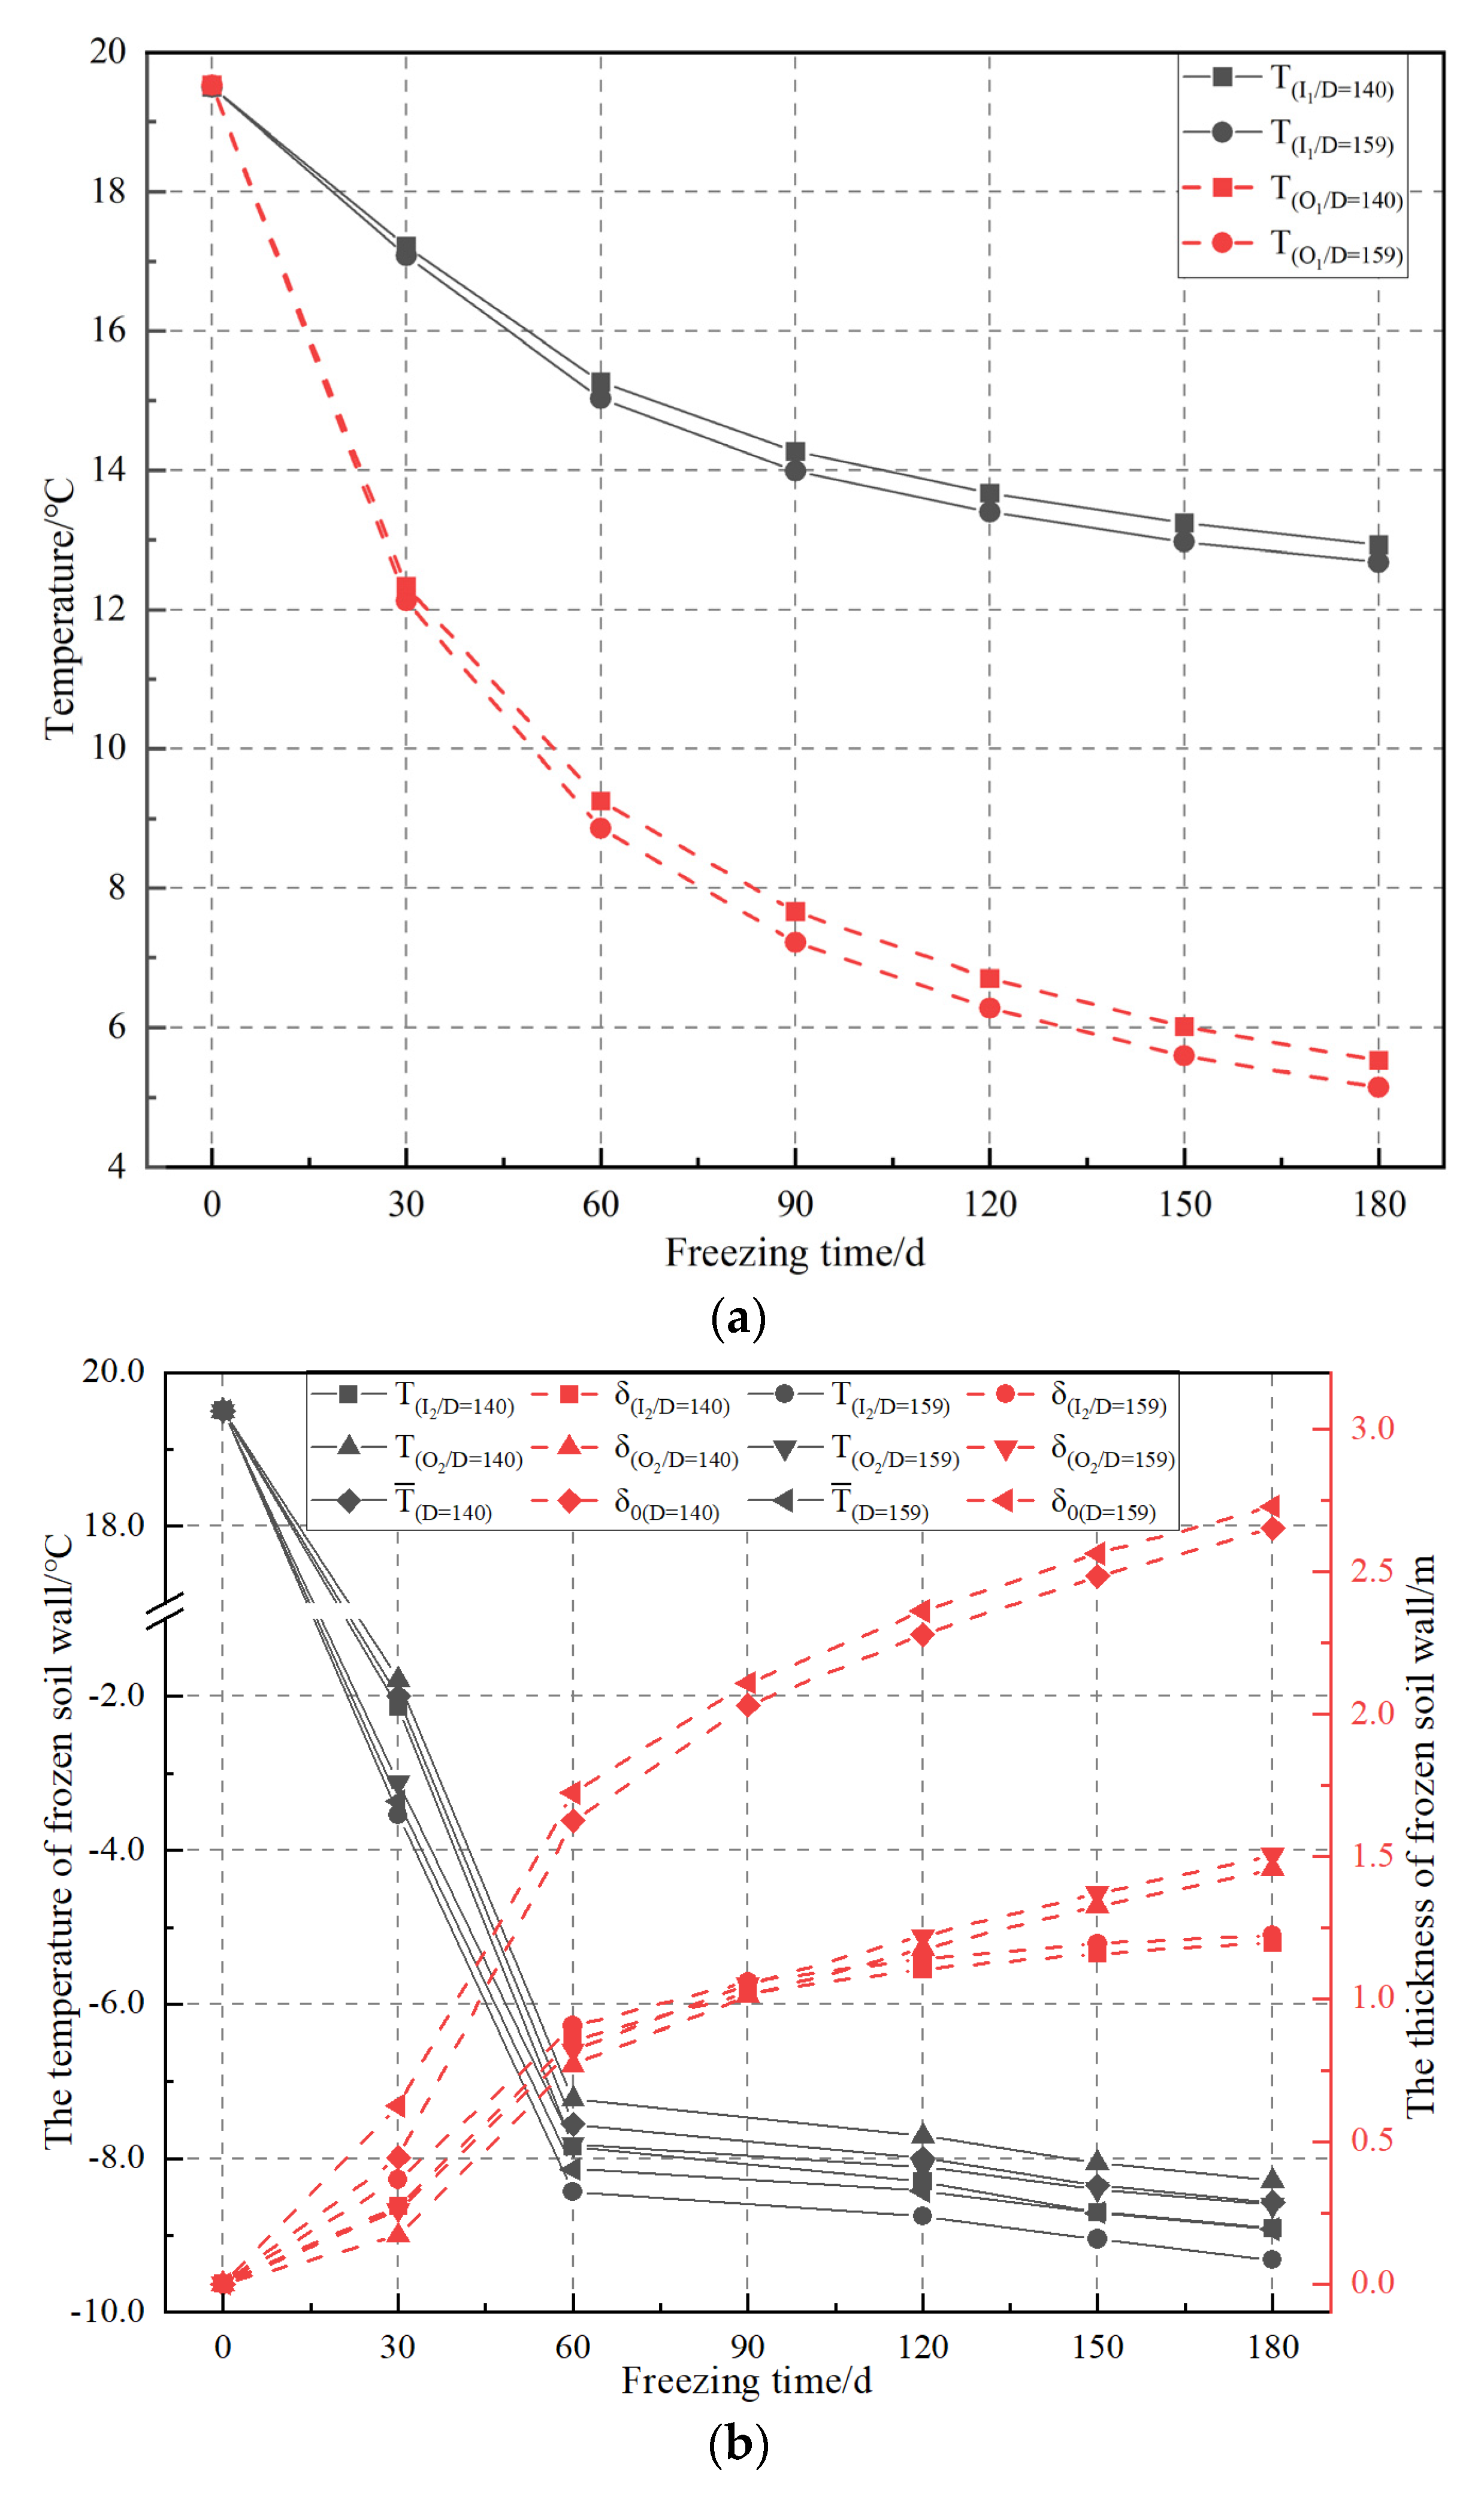
Figure 14a shows the temperature evolution curves of the interlayer (I1) and outside (O1) wall of the shaft wall with different freezing tube diameters (D) and freezing time (t). The temperatures in the interlayer and outside wall position show a decreasing trend when the freezing tube diameter increases, while the variation magnitude is smaller than that induced by other factors, such as the freezing tube pitch and layout radius. A larger amount of freezing medium will provide more cooling capacity per time unit as the freezing tube diameter increases, resulting in a higher heat exchange efficiency and greatly contributing to the reduction in the shaft temperature. Since the diameter design of the freezing tube is in accordance with certain standards, the temperature difference brought by the limited freezing tube diameter change is not as obvious; this value is approximately 8.3 °C for the 140 mm freezing tube diameter and approximately 8.4 °C for the 159 mm freezing tube diameter (within 180 d).
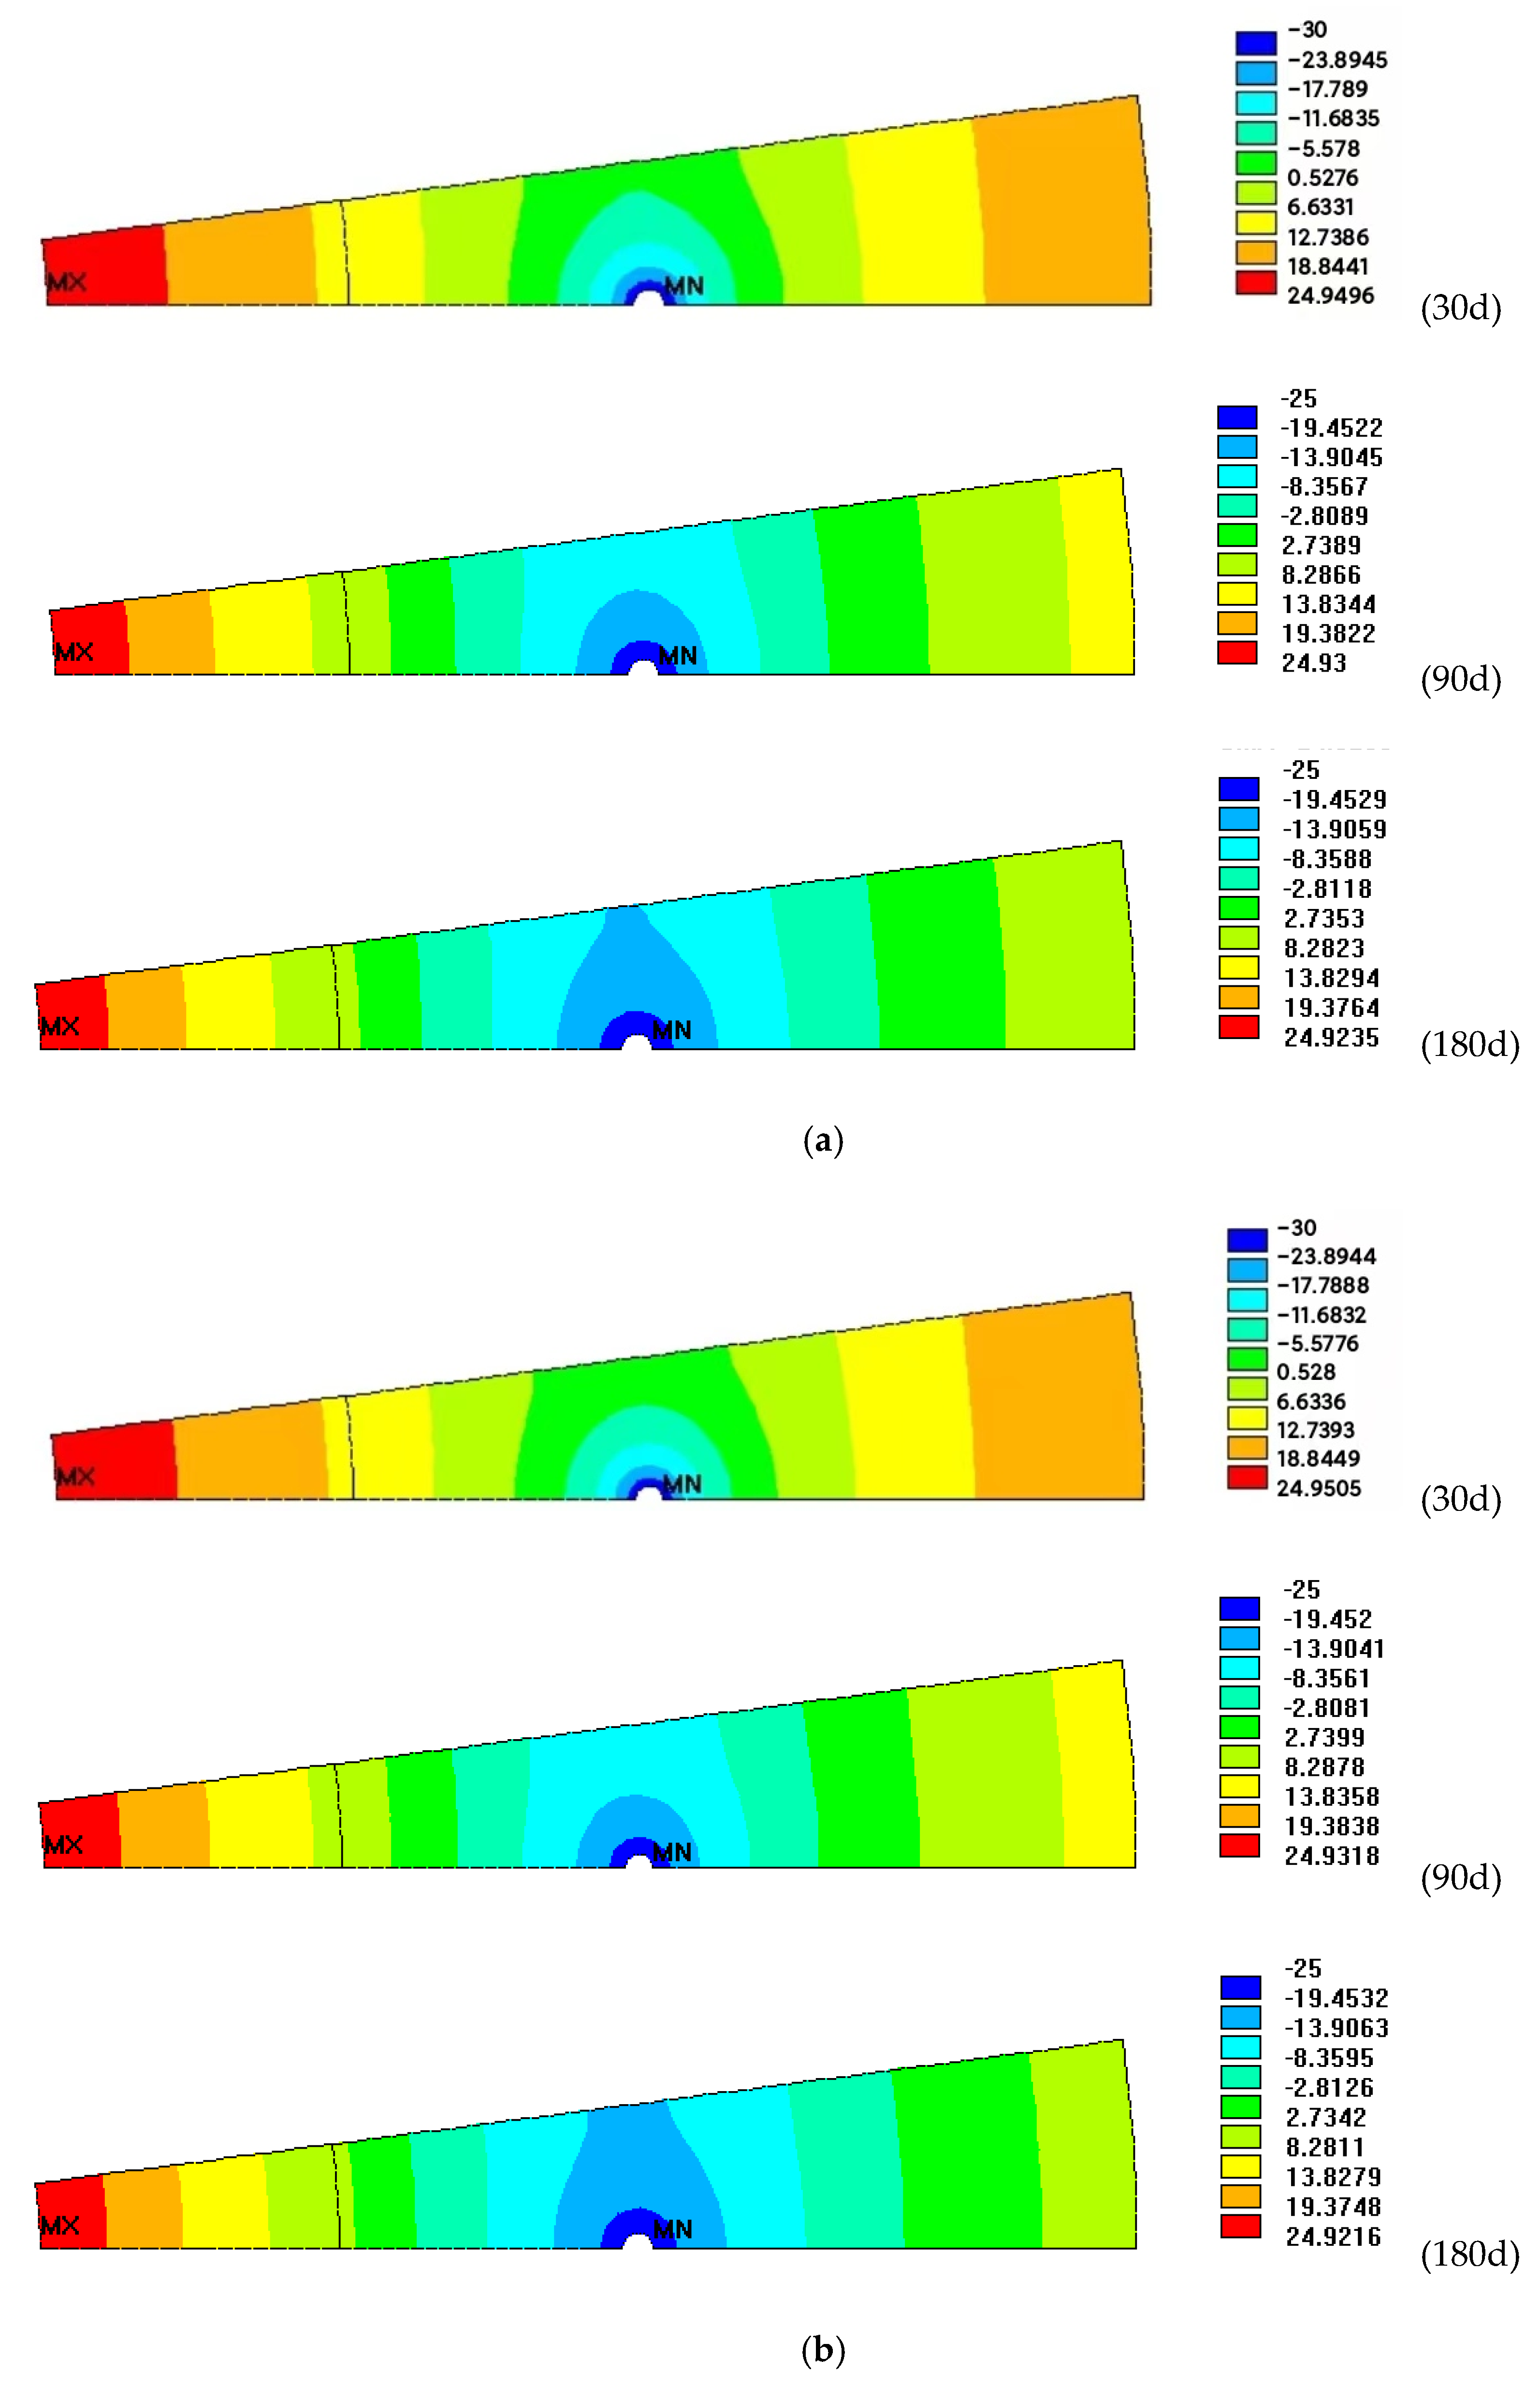
The temperature (T) and thickness (δ) evolution curves inside (I2) and outside (O2) the frozen soil wall and average ( T ¯ ) or sum value (δ0) with different freezing tube diameters of 140 mm and 159 mm are presented in Figure 14b. As expected, the increase in the freezing tube diameter will decrease the frozen soil wall temperature and increase its thickness, while this effect will gradually weaken with the increase in freezing time. For example, the sum thickness (δ0) of the frozen soil wall increases by 0.18 m within 30 d when the freezing tube diameter increases from 140 mm to 159 mm, but the increase range is only 0.08 m when the freezing time reaches 180 days. This result indicates that increasing the freezing tube diameter has relatively less effect on the cross-loop of the frozen soil wall, frozen soil wall thickness, and average temperature during long-term freezing. As shown in Figure 15a,b, the temperature of the freezing interface decreases from 0.5 °C to −13 °C (below 0 °C) as the freezing time increases, with freezing tube diameters of 140 mm and 159 mm, indicating that the cross-loop is completed in 180 d under ventilation conditions. The freezing temperature region with freezing tube diameters of 140 mm and 159 mm gradually increases from a small semicircle to a large ellipse throughout the model. Thus, the variance in the freezing tube diameter produced based on the standard may not be the main factor controlling the formation of the frozen soil wall under ventilation conditions, while the increase in freezing tube diameter can promote the frozen soil wall to a certain extent.

3.5. The Effect of the Thermal Conductivity of Unfrozen Soil

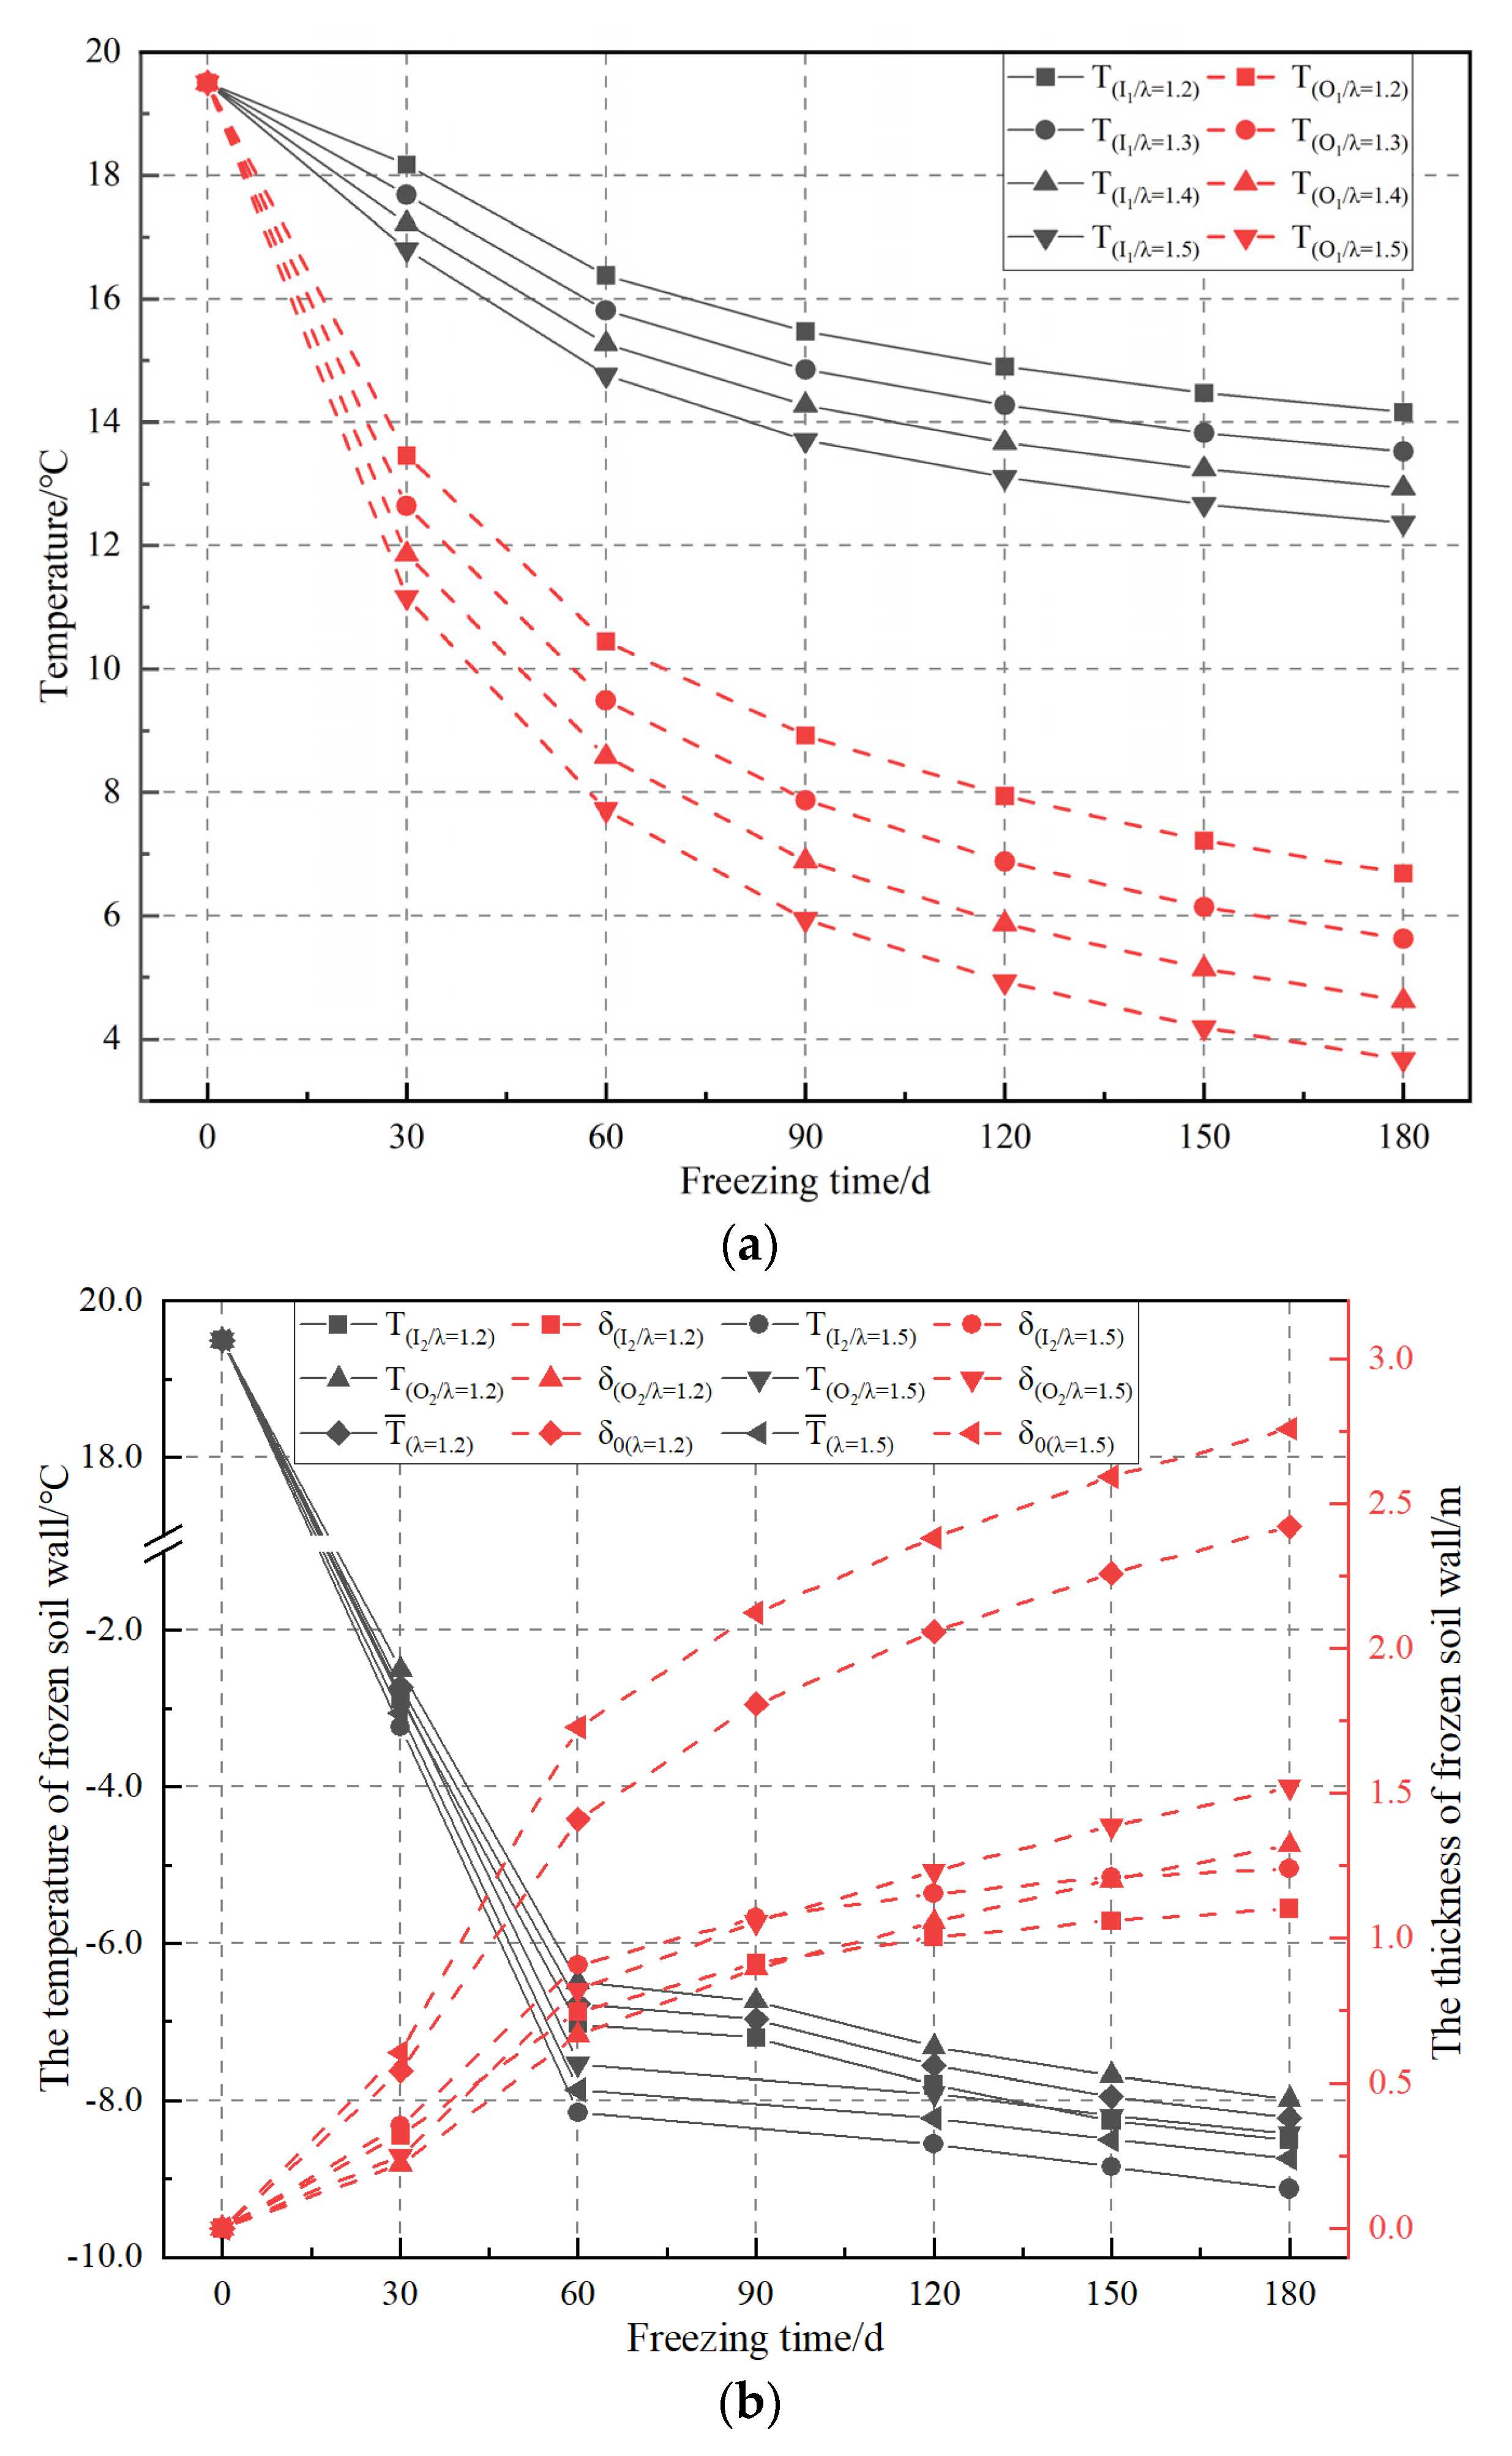
The temperature evolution curves of the interlayer (I1) and outside (O1) walls of the shaft wall with different thermal conductivity (λ) and freezing time (t) are plotted in Figure 16a. The increase in the thermal conductivity of unfrozen soil could reduce the temperature in the interlayer and outside wall position by enhancing the cooling energy transfer throughout the stratum. Meanwhile, the variance in the temperature in the interlayer and outside wall position is relatively smaller when the thermal conductivity of unfrozen soil increases from 1.2 W·m−1·°C−1· to 1.5 W·m−1·°C−1. For example, the temperature in these two positions decreases by approximately 0.5 °C and 1 °C when the thermal conductivity of unfrozen soil increases by 0.1 W·m−1·°C−1 (180 d).
As expected, the temperature difference magnitude inside (I2) and outside (O2) the frozen soil wall induced by the increase in the thermal conductivity of unfrozen soil reaches approximately 0.6 °C−1, while the sum thickness (δ0) of the frozen soil wall increases by 0.34 m when the thermal conductivity of unfrozen soil increases from 1.2 W·m−1·°C−1 to 1.5 W·m−1·°C−1 (180 d), as shown in Figure 16b. The higher thermal conductivity of unfrozen soil can clearly enhance the transfer of cooling energy from the low-temperature region to the high-temperature region, reducing the temperature and forming the frozen soil wall at a higher speed when the flow rate and temperature in the freezing tube are fixed. In addition, the average temperature ( T ¯ ) and thickness in the inside position are always below those of the outside position, while the temperature and thickness difference between these two positions increases when the thermal conductivity of unfrozen soil increases. The wider outer space provides better conditions for the formation of the frozen wall. The heat transfer efficiency would be improved when the thermal conductivity of unfrozen soil increases; thus, the conditions for the temperature reduction in the outside frozen soil wall become more favorable, the temperature increases, and then the thickness obviously increases.
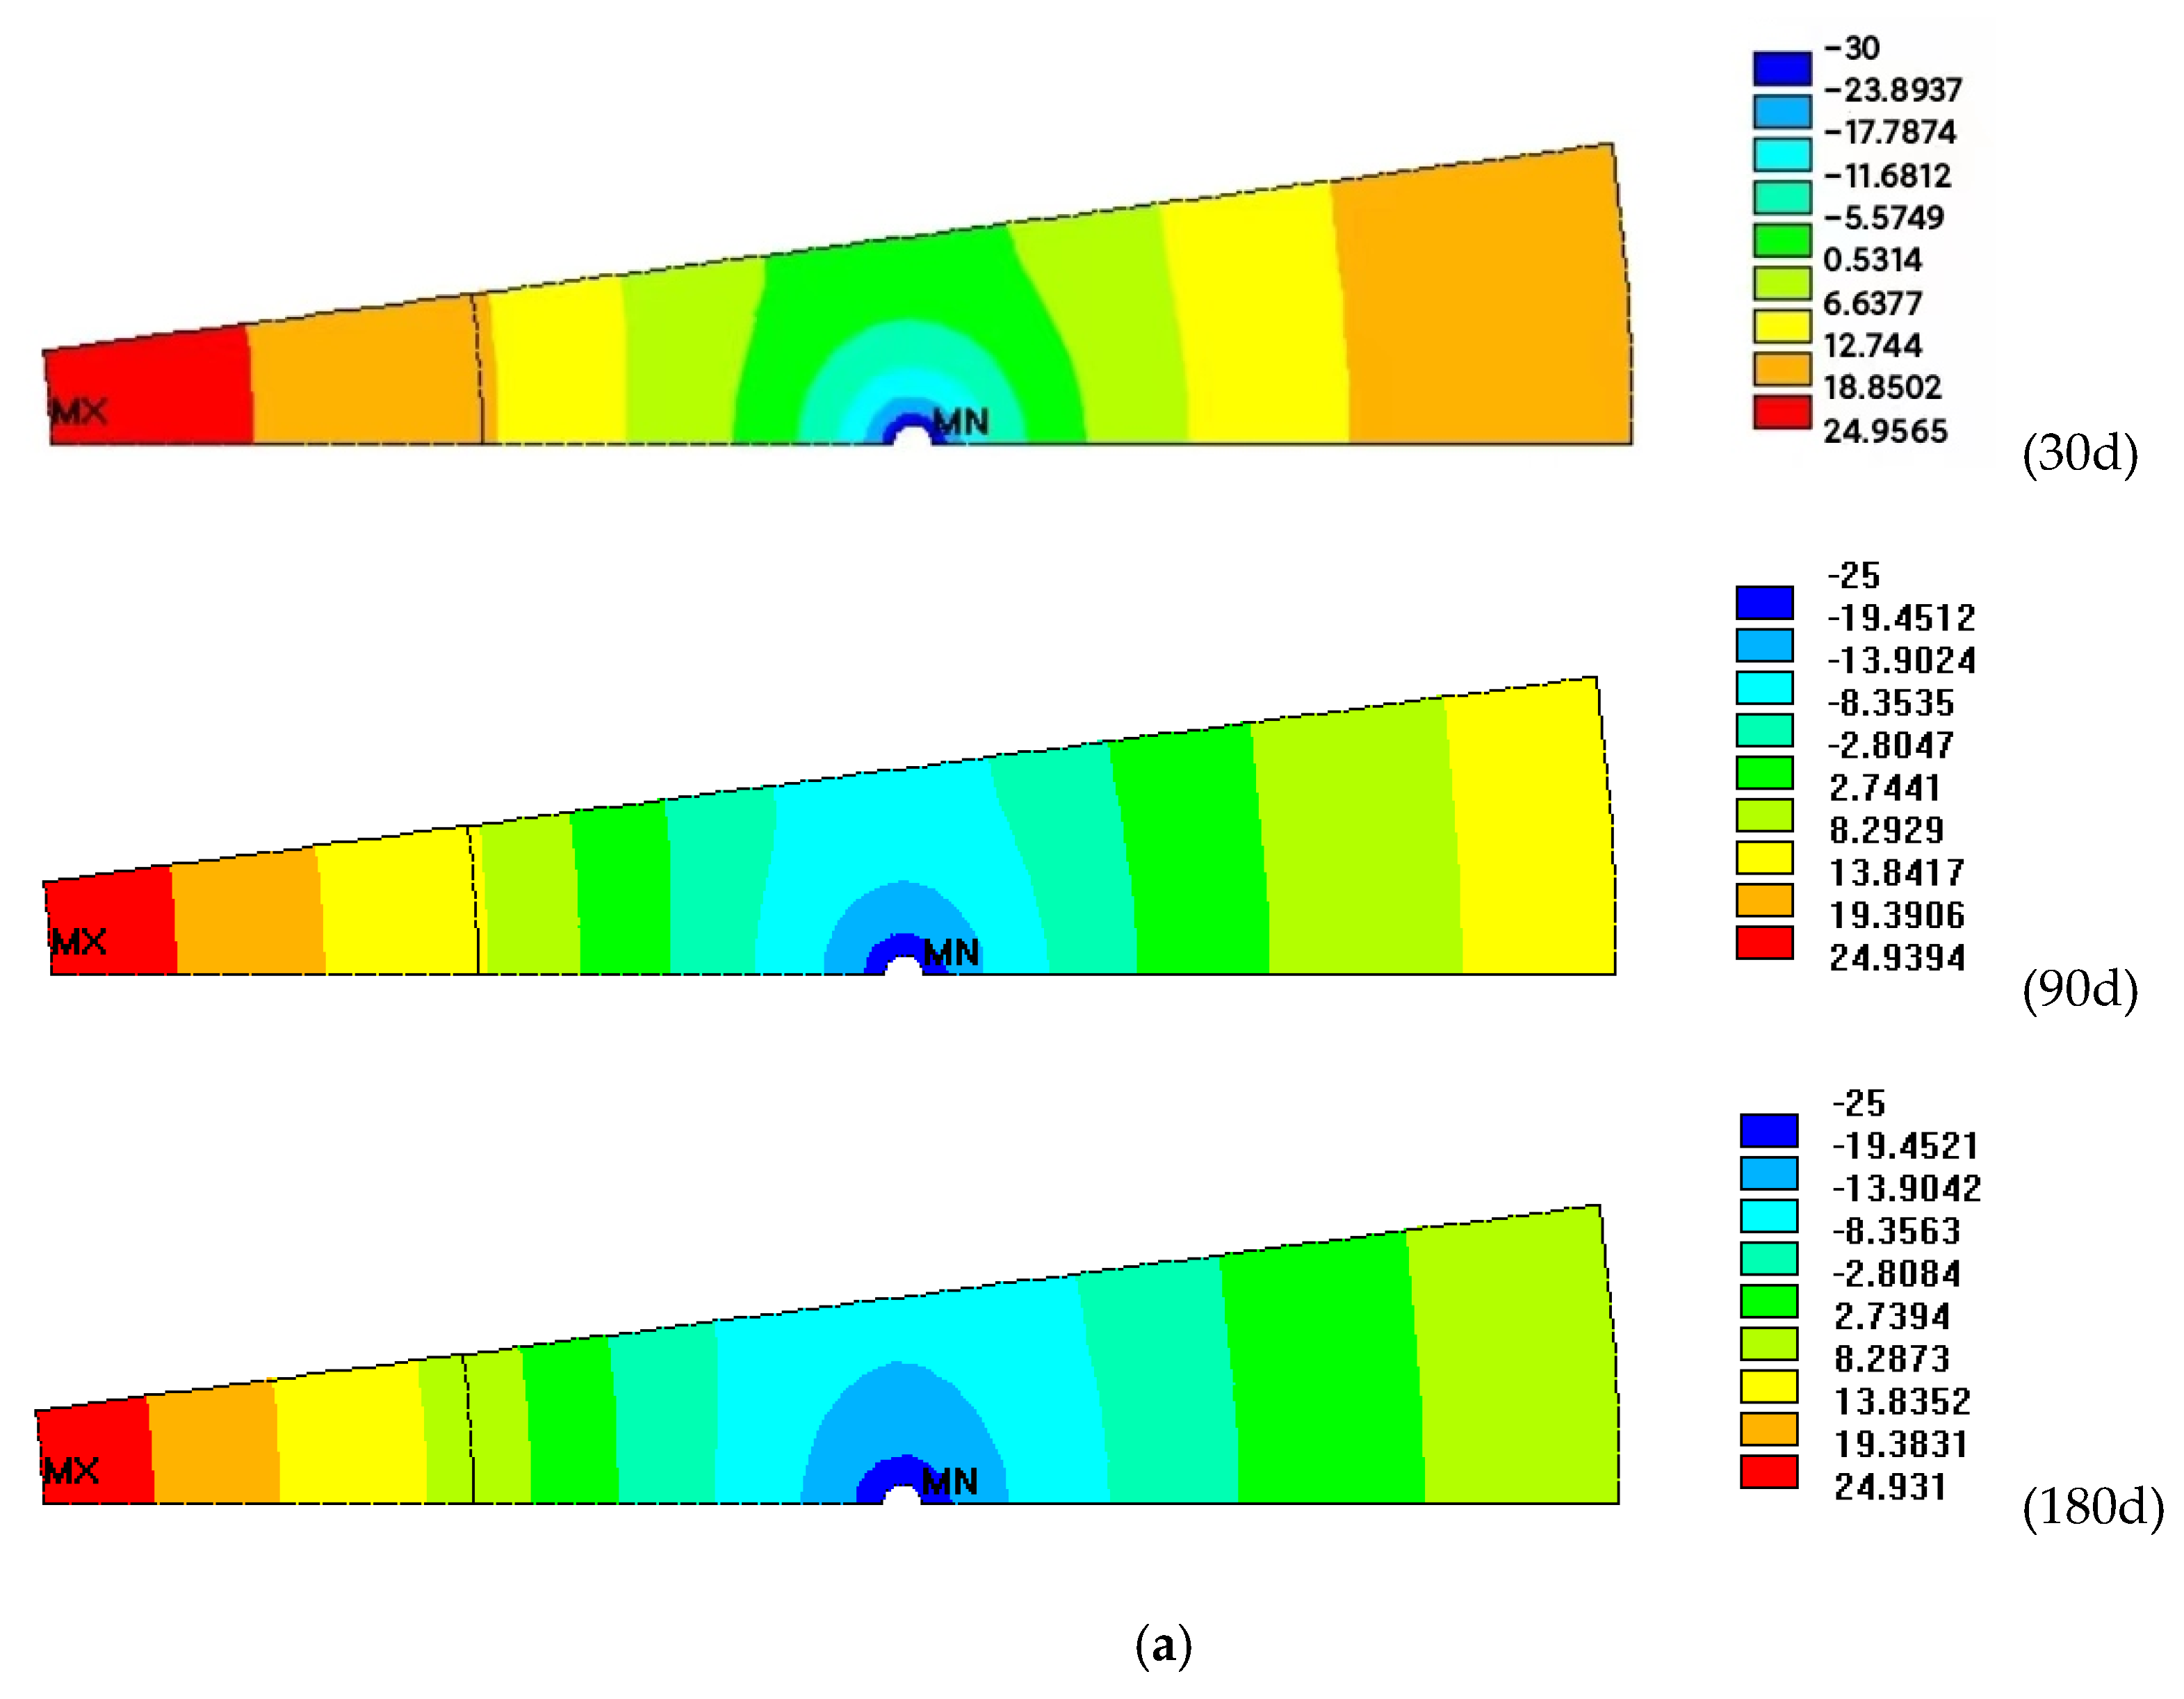
The temperature gradually decreases with the increase in freezing time, while the freezing region around the freezing tube increases with an increase in thermal conductivity of unfrozen soil, as shown in Figure 17a,b. The second low-temperature region with a thermal conductivity for unfrozen soil of 1.5 W·m−1·°C−1 gradually increases from a small semicircle to a large ellipse, which occurs throughout the whole model and is more than that of 1.2 W·m−1·°C−1. In addition, the temperature of the freezing interface decreases from 0.5 °C to −8 °C (below 0 °C) as the freezing time increases when the thermal conductivity of unfrozen soil is 1.2 W·m−1·°C−1, and this temperature decreases to approximately −14 °C at 180 d when the thermal conductivity of unfrozen soil increases to 1.5 W·m−1·°C−1. The cross-loop of the frozen soil wall is completed in 180 d under ventilation conditions. This result indicates that although the change in the thermal conductivity of unfrozen soil would influence the freezing rate and effect, the cross-loop of the frozen soil wall can be guaranteed.

3.6. The Effect of Soil Moisture Content

Figure 18a shows the temperature evolution curves of the interlayer (I1) and outside (O1) wall of the shaft wall with different soil moisture contents (ω) and freezing time. The temperature in the interlayer and outside wall positions gradually increase with an increase in soil moisture content, while the temperature variance magnitude between these two positions also increases when the soil moisture content increases from 10% to 30%. The increases in soil moisture content enhance the energy requirements for the reduction in unit temperature per unit volume of soil, particularly boosting the energy required for the latent heat of the phase transition; thus, the temperature of the shaft increases when the soil moisture content increases. In addition, the effect of the variation in the soil moisture content on the shaft wall is less than that of the change in the freezing tube parameters; the temperature in these two positions ranges from 12.5 °C and 3.7 °C to 13.7 °C and 5.9 °C, respectively, when the soil moisture content increases from 10% to 30% (the saturation ranges from approximately 33% to 100%).
The temperatures (T) of the frozen soil wall’s inside (I2) and outside (O2) positions both show increasing trends with the soil moisture content of 10% and 30%, while the time needed for the soil moisture content of 30% to freeze exceeds 30 days, as shown in Figure 18b. The thickness (δ) of the frozen soil wall with a soil moisture content of 30% gradually increases after 30 days, and the sum (δ0) thickness of this material is less than that of 10% soil moisture content. The increasing energy required for the latent heat of the phase transition with a higher soil moisture content would delay the formation of the frozen soil wall and then decrease its thickness. This result indicates that the soil moisture content plays an important role in the initial freezing generation under ventilation conditions.
The temperature contours in Figure 19a,b show that the temperature of the freezing interface decreases from −5.6 °C to −13 °C (below 0 °C) as the freezing time increases when the soil moisture content is 10%, and this temperature decreases to −8 °C at 180 d when the soil moisture content increases to 30%. The cross-loop of the frozen soil wall is completed in 180 days, even when the soil moisture content increases to 30%, indicating that the change in soil moisture content would not have an obvious effect on the cross-loop. In addition, the freezing temperature range around the freezing tube dramatically increases when the soil moisture content decreases, which also proves that the soil moisture content plays an important role in the initial freezing generation.

3.7. The Effect of the Shaft Wall Thickness

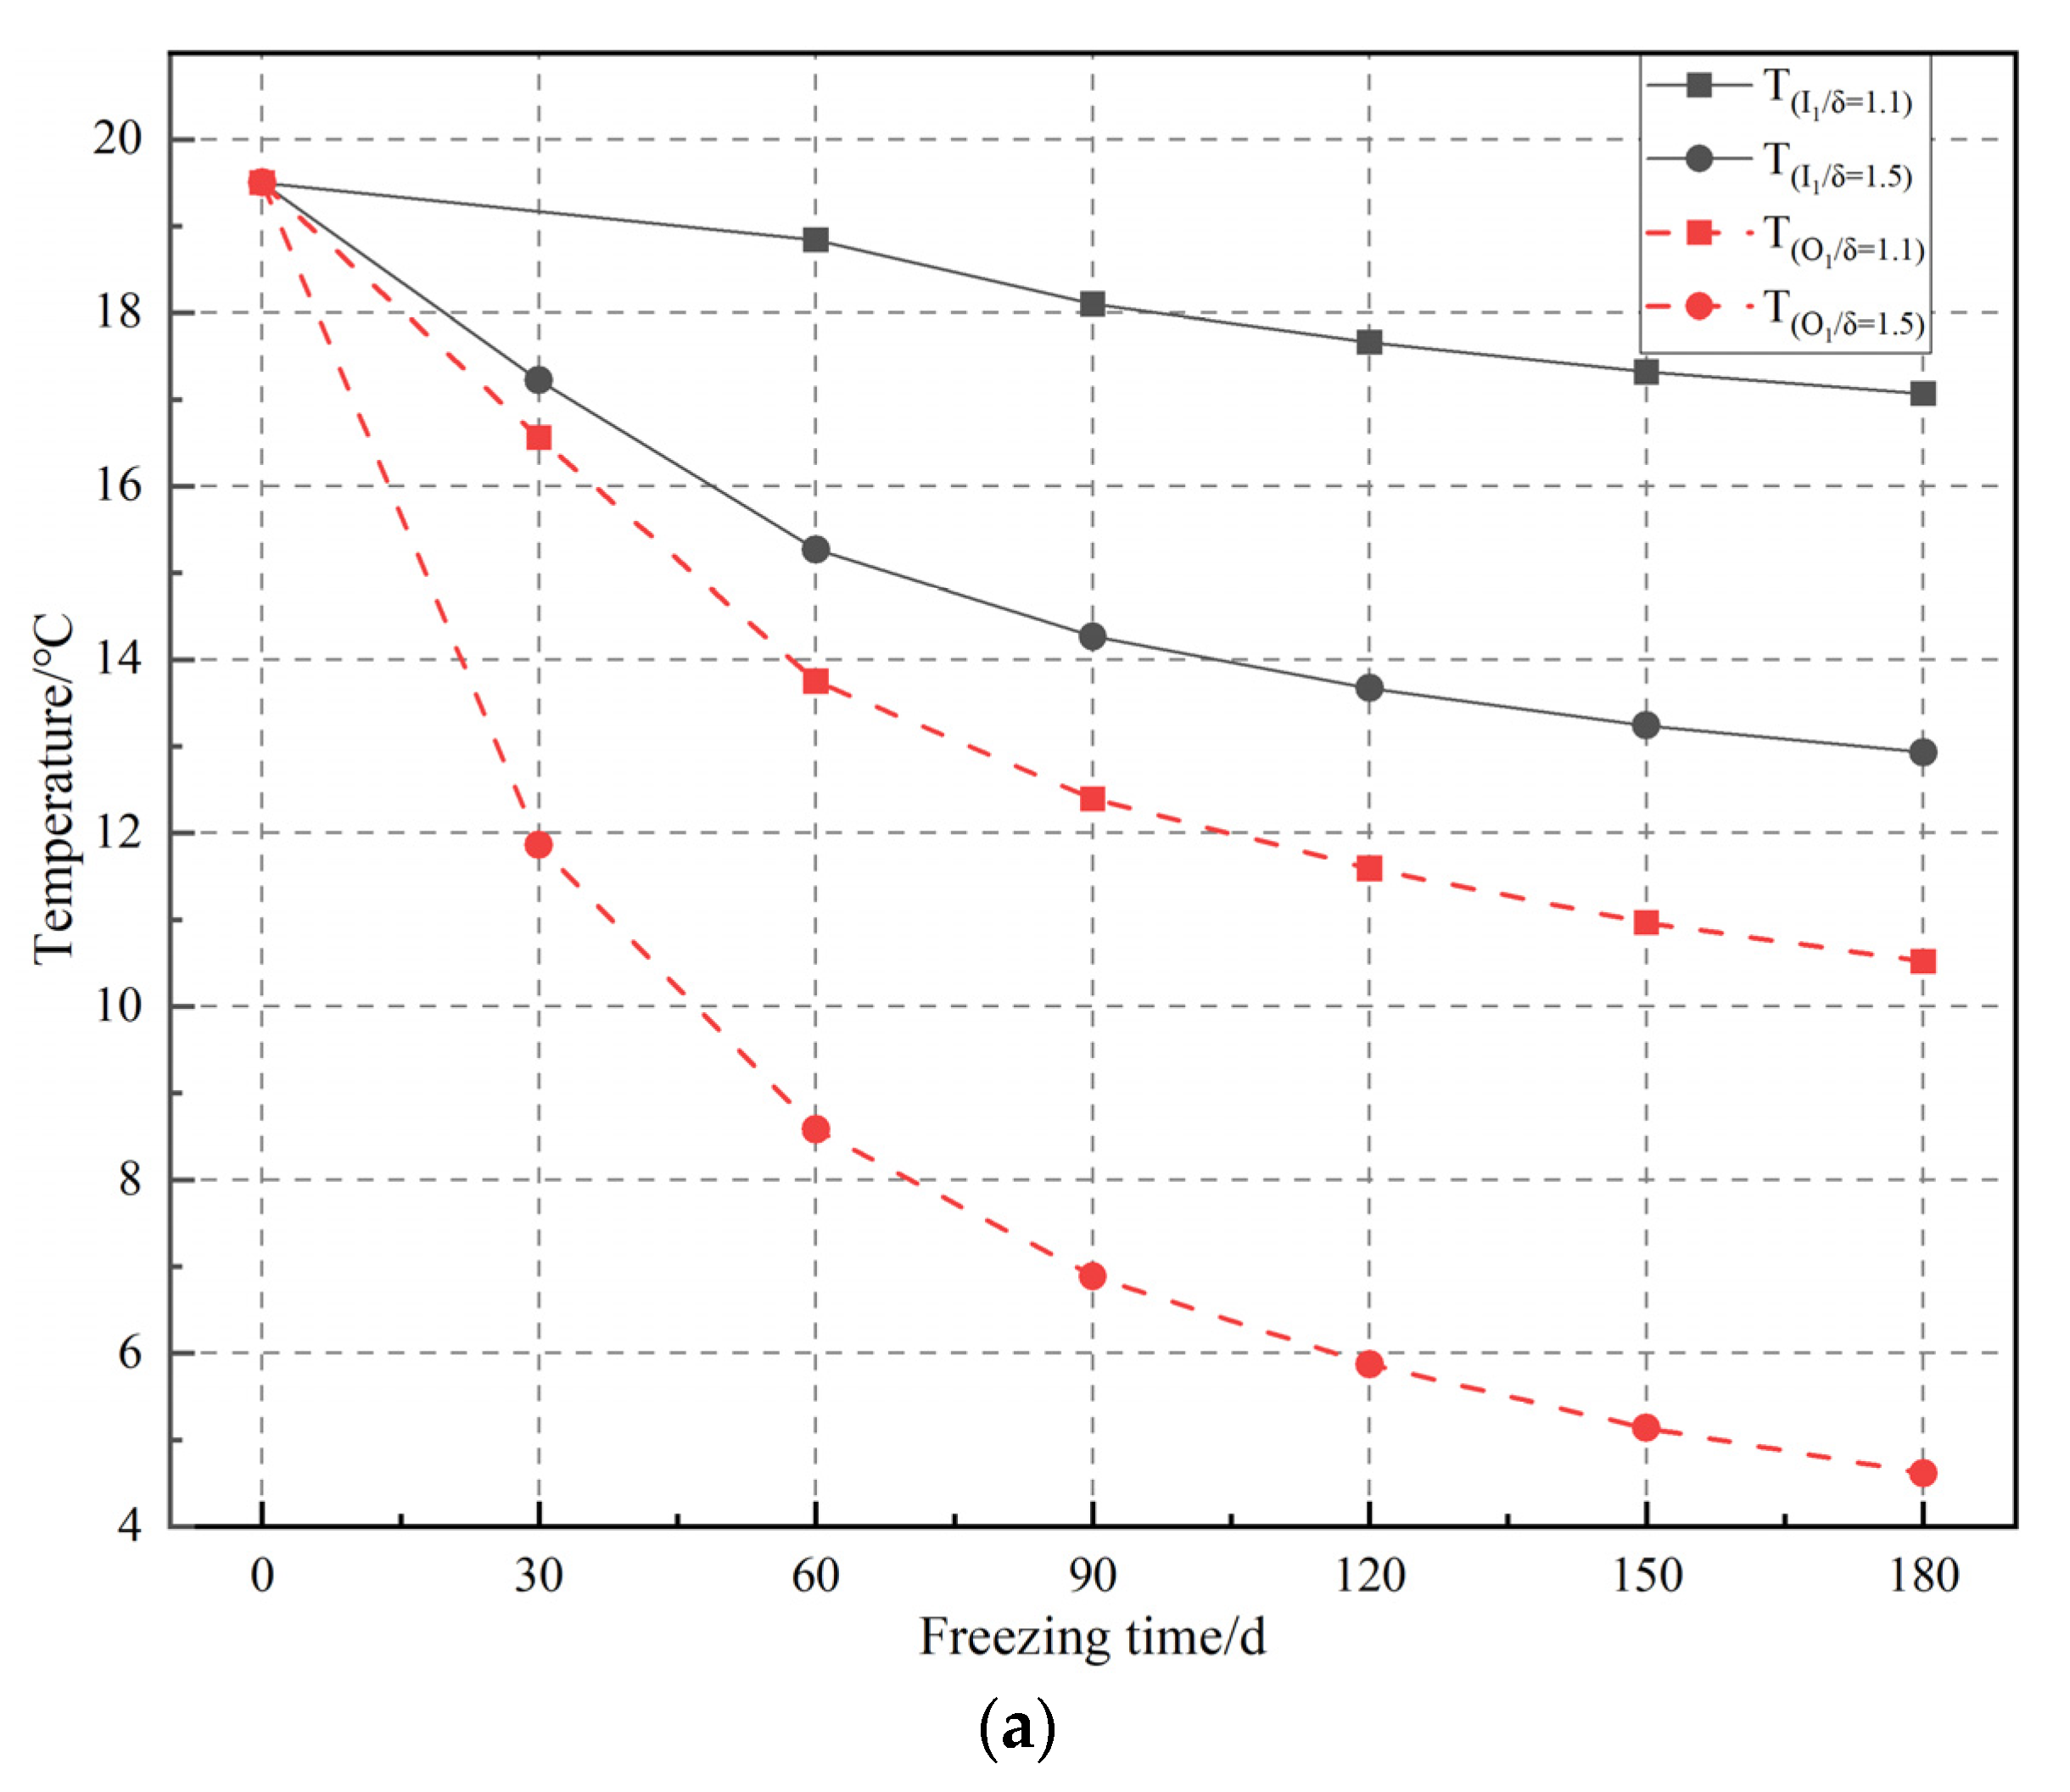
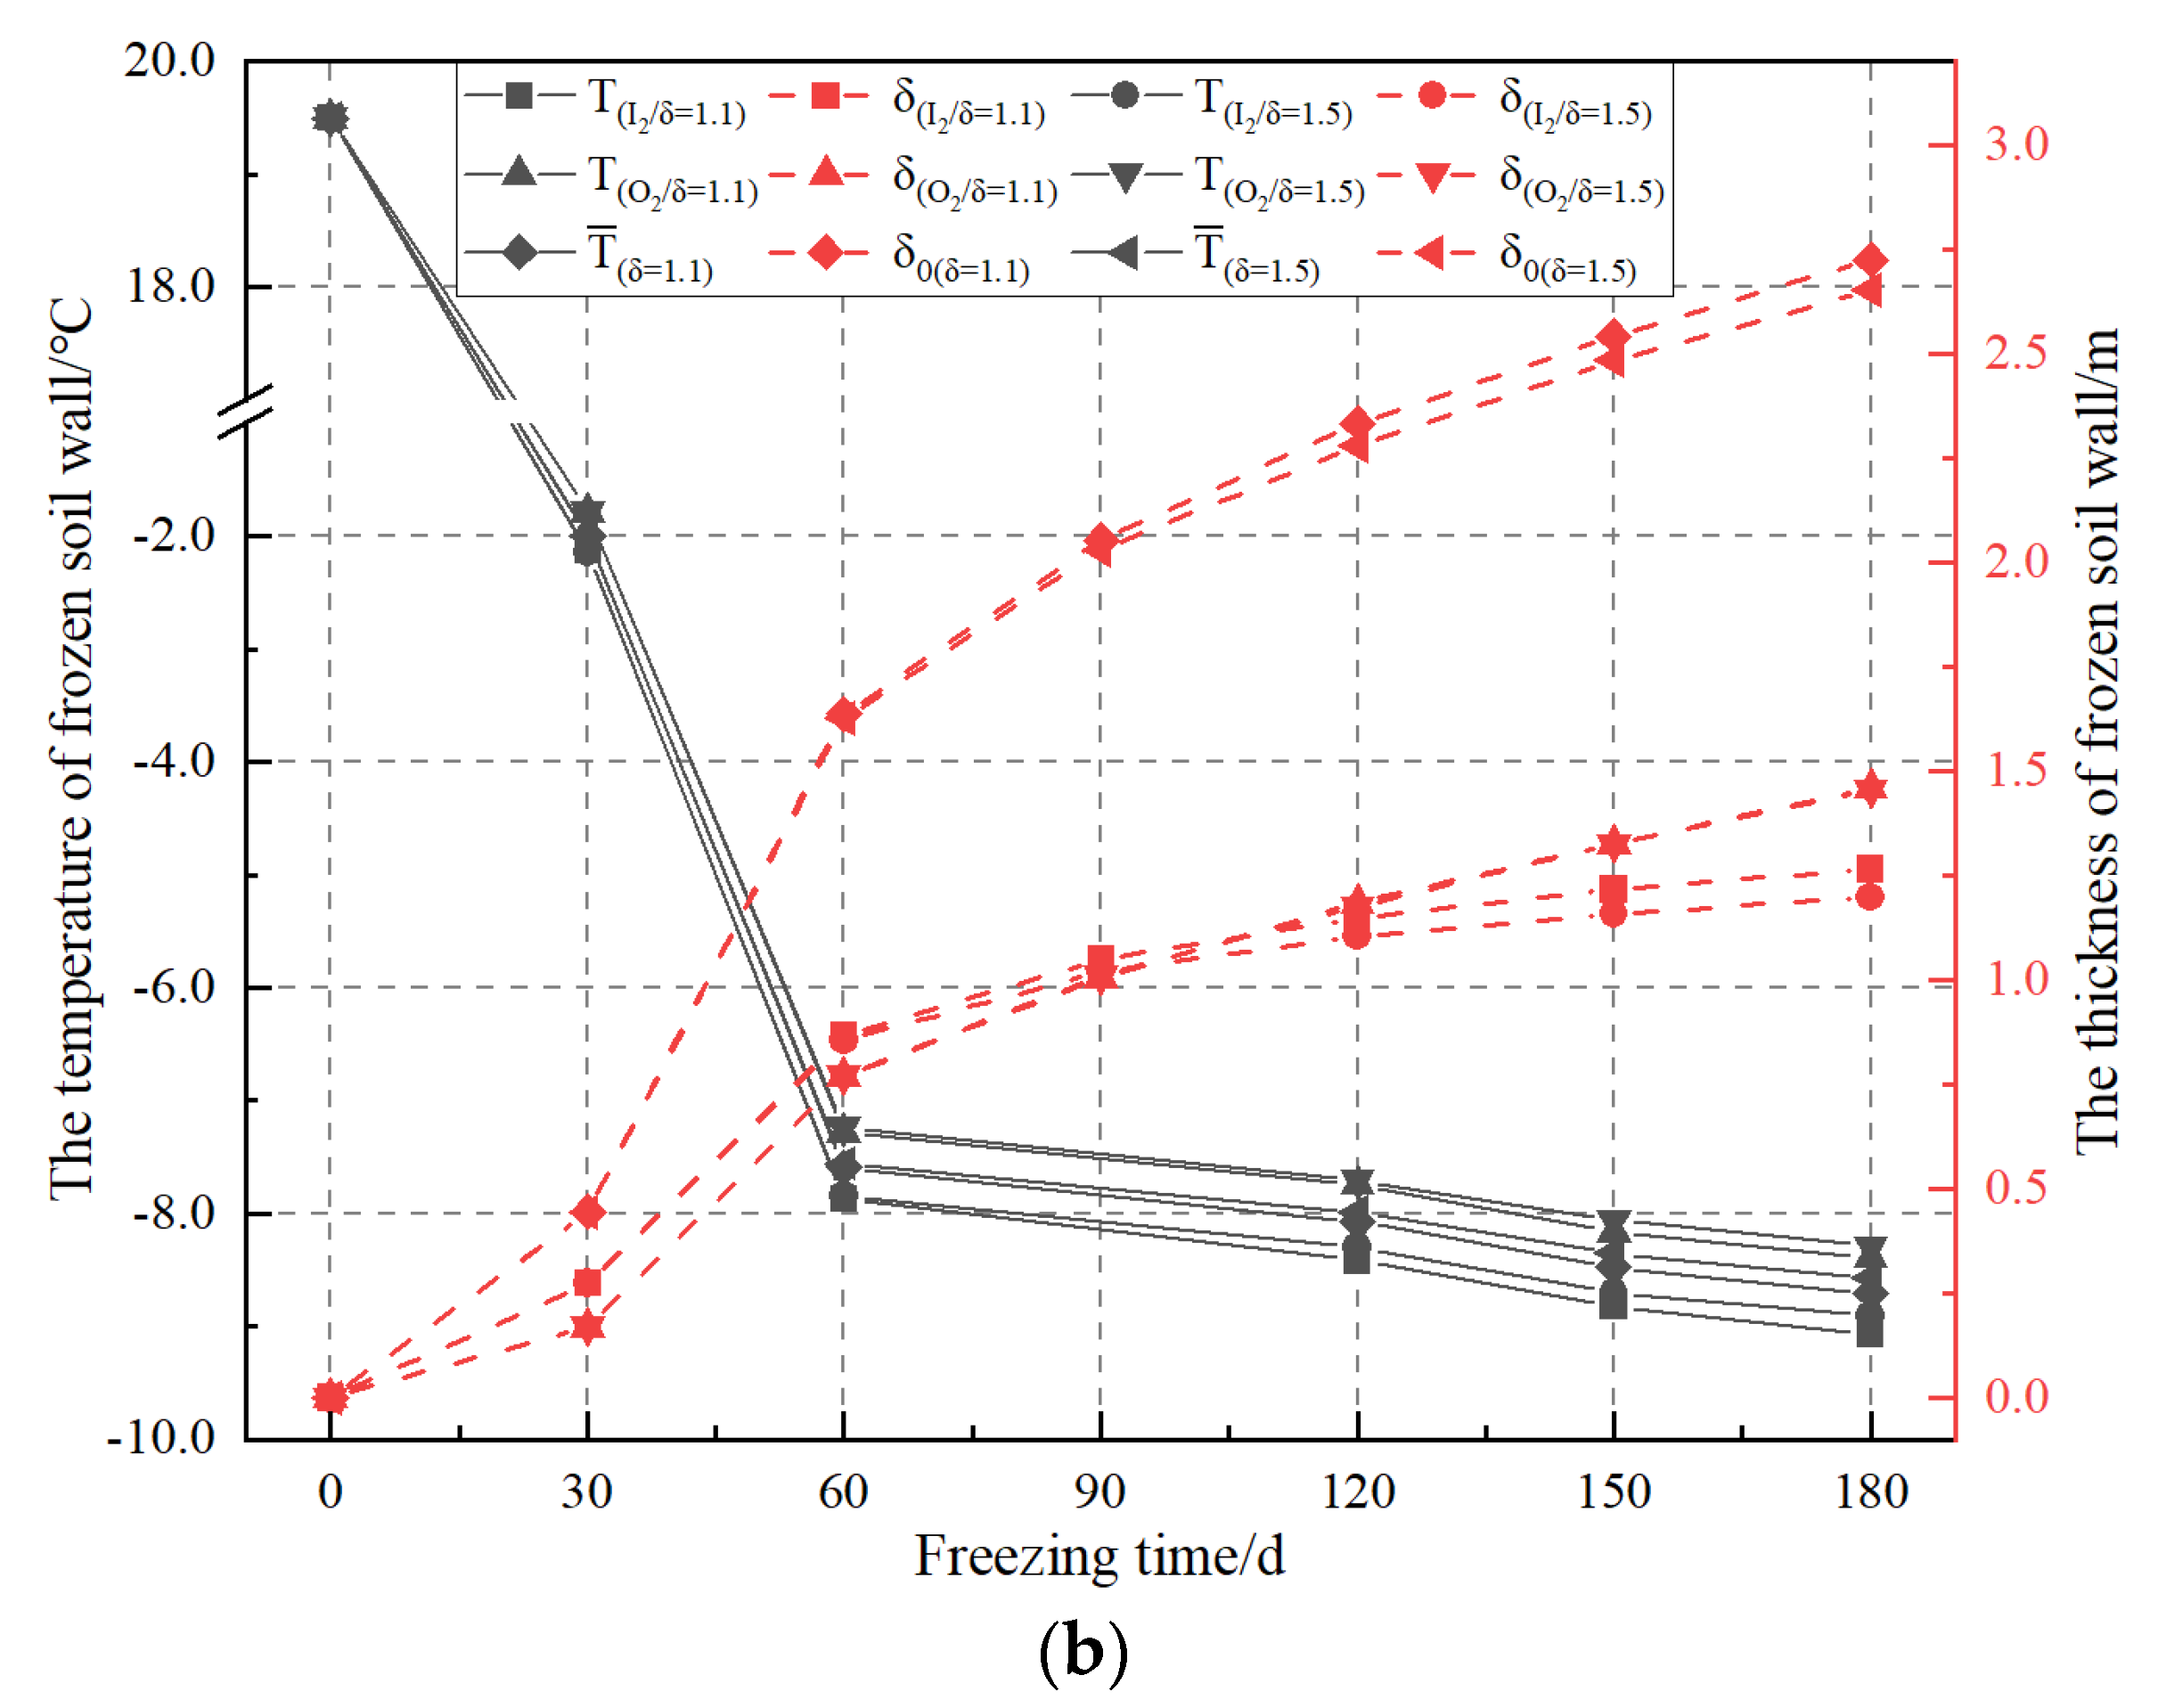
Temperature evolution curves in the interlayer (I1) and outside wall (O1) of the shaft wall with different shaft wall thicknesses (δ) and freezing time in Figure 20a. As expected, the temperature variation trends and temperature values outside the wall are very close when the shaft wall thickness increases, while the temperature value in the interlayer position shows a dramatic decrease. For example, the temperature gap in the outside position is no more than 3 °C, while the gap in the interlayer position is approximately 4 °C when the freezing time is the same (within 180 d). The increase in shaft wall thicknesses will prevent the loss of cooling energy and thus contribute to the freezing effect due to the lower heat transfer efficiency of the shaft wall, which will reduce the temperature of the whole shaft wall. In addition, the shaft wall thickness variation has little effect on the temperature (T) and thickness (δ) of the frozen soil wall in the inside (I2) and outside (O2) positions, as shown in Figure 20b. The variation in shaft wall thickness does not greatly affect the reduction in the temperature of the soil layer around the freezing tube and the production of the frozen soil wall; thus, the shaft wall thickness is not the main factor influencing the freezing efficiency.

3.8. The Comprehensive Effect of Different Parameters

To better study the influence of various factors on the frozen soil wall and shaft wall under ventilation conditions, a full combination numerical simulation of different parameters that affects the freezing temperature field is studied, which includes 384 sets of numerical experiments. The typical simulation results are extracted and analyzed as follows:
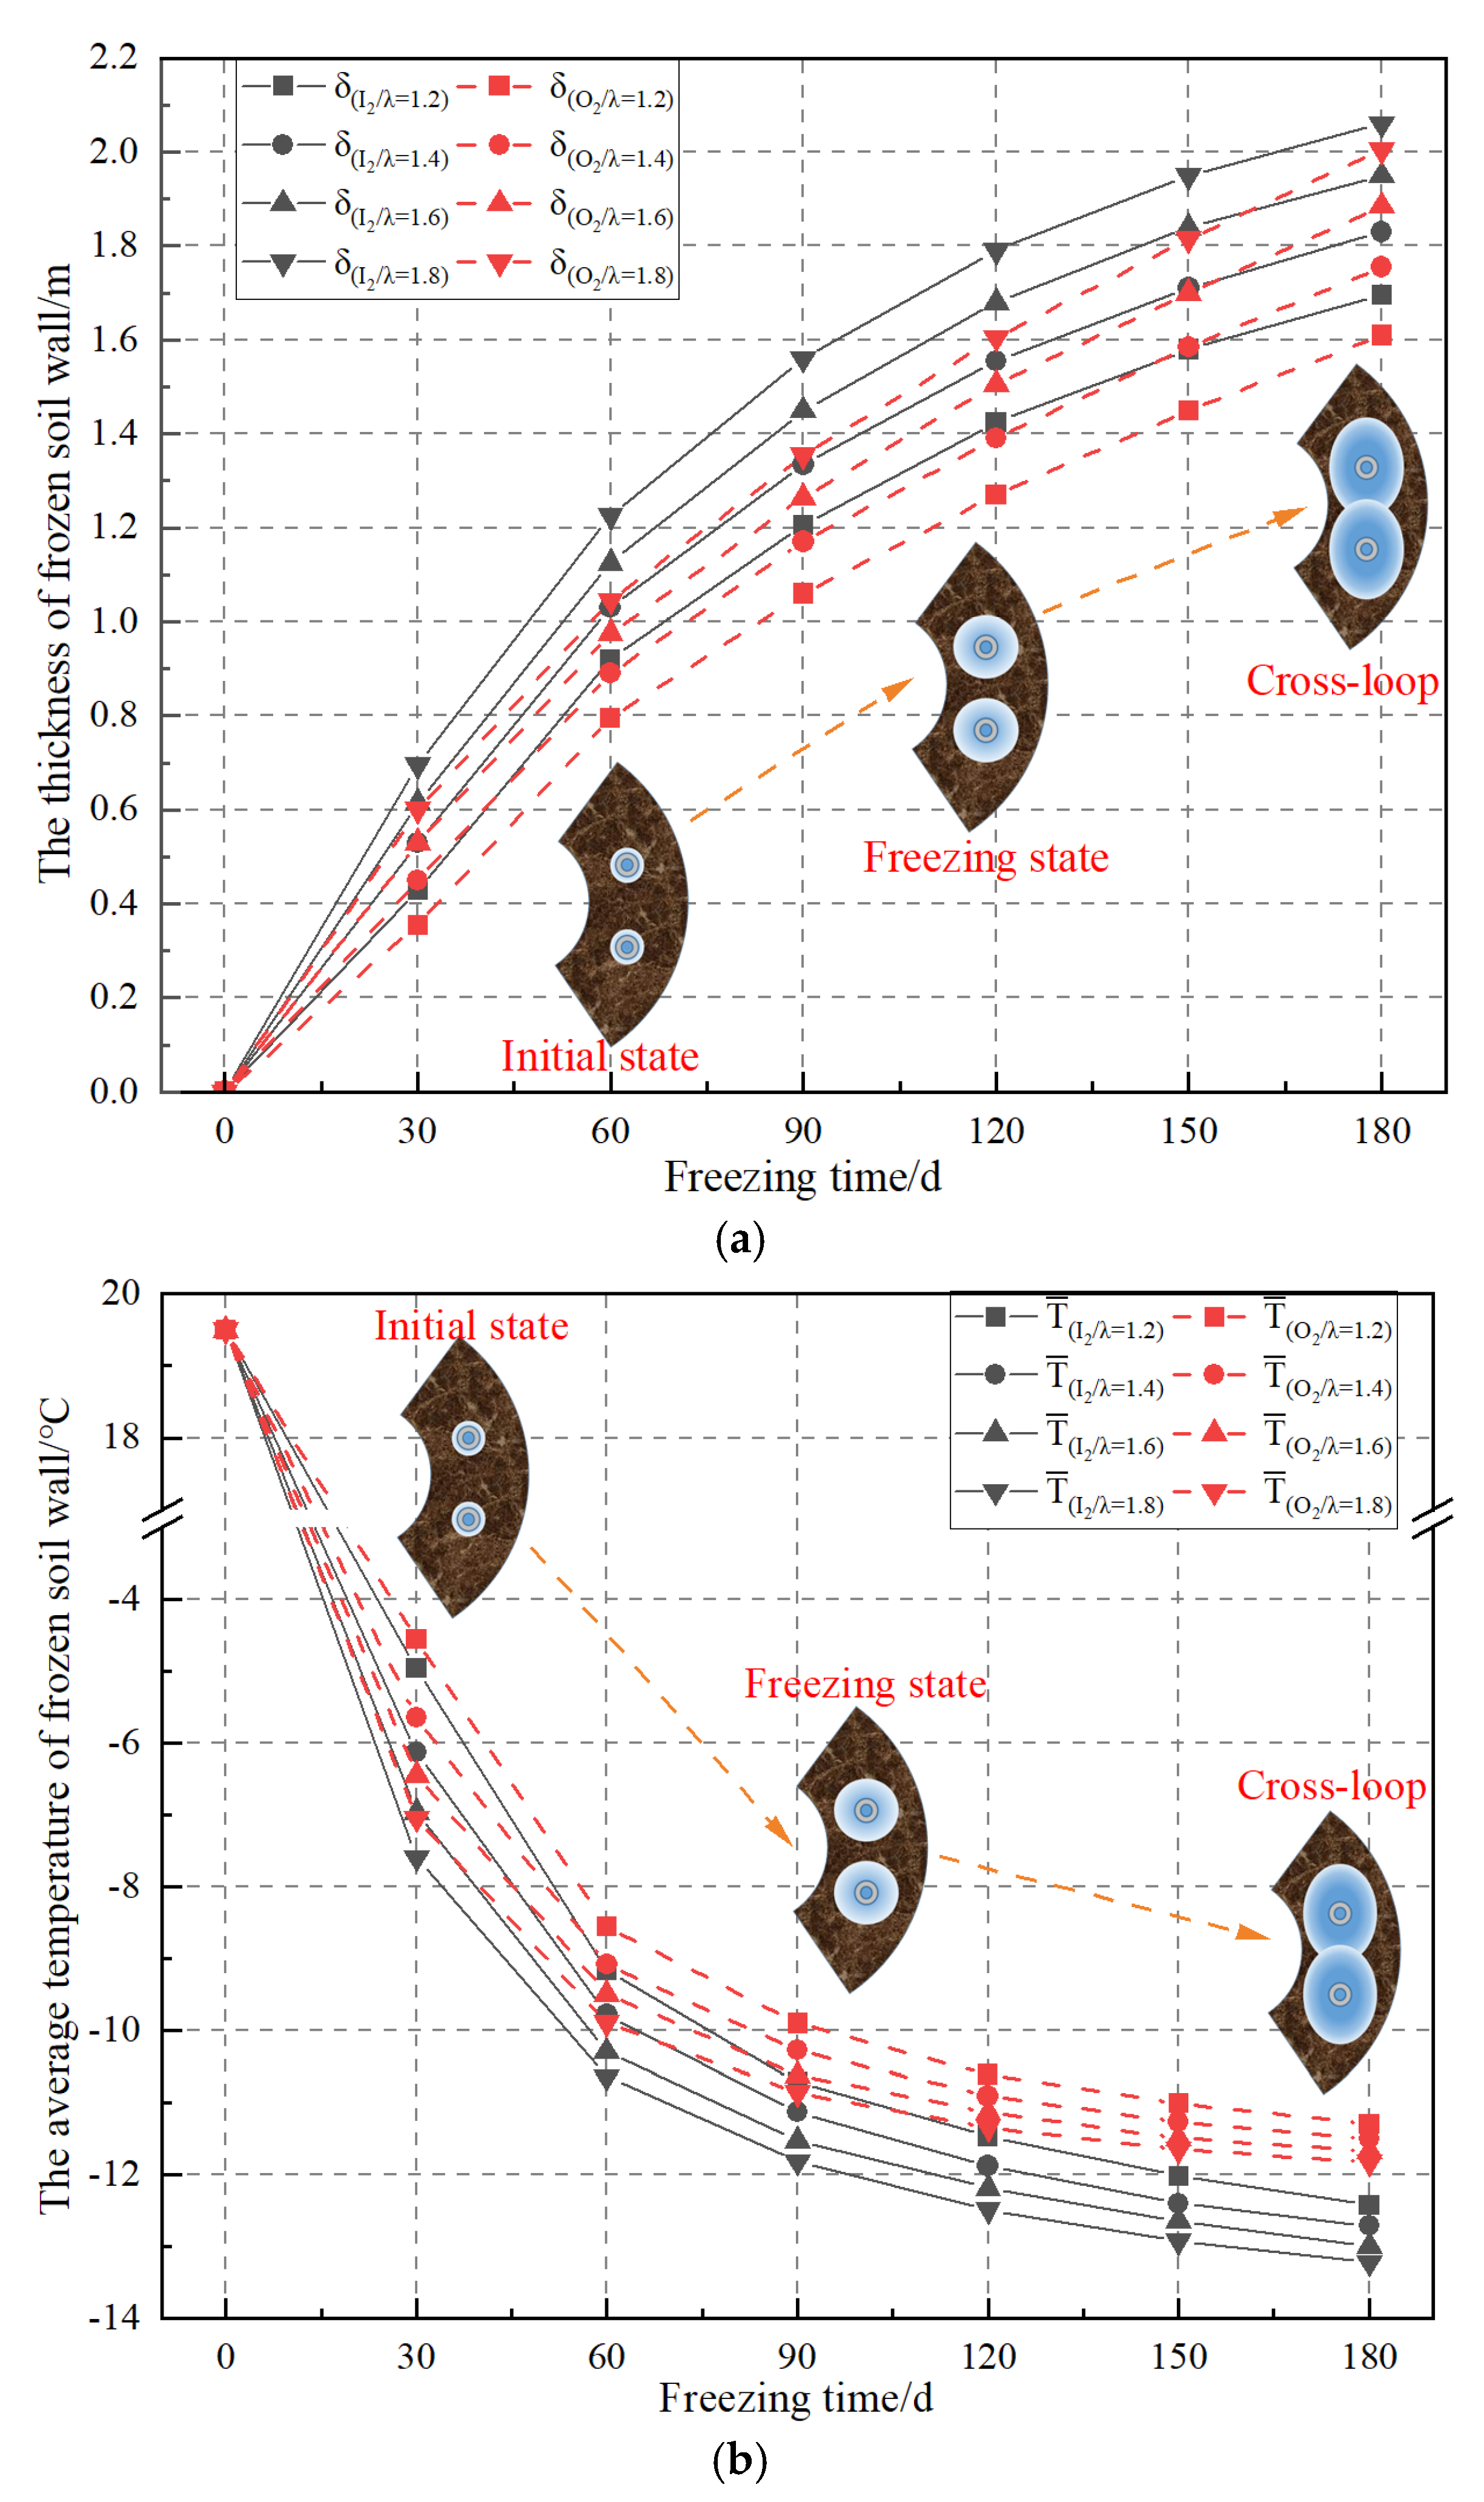
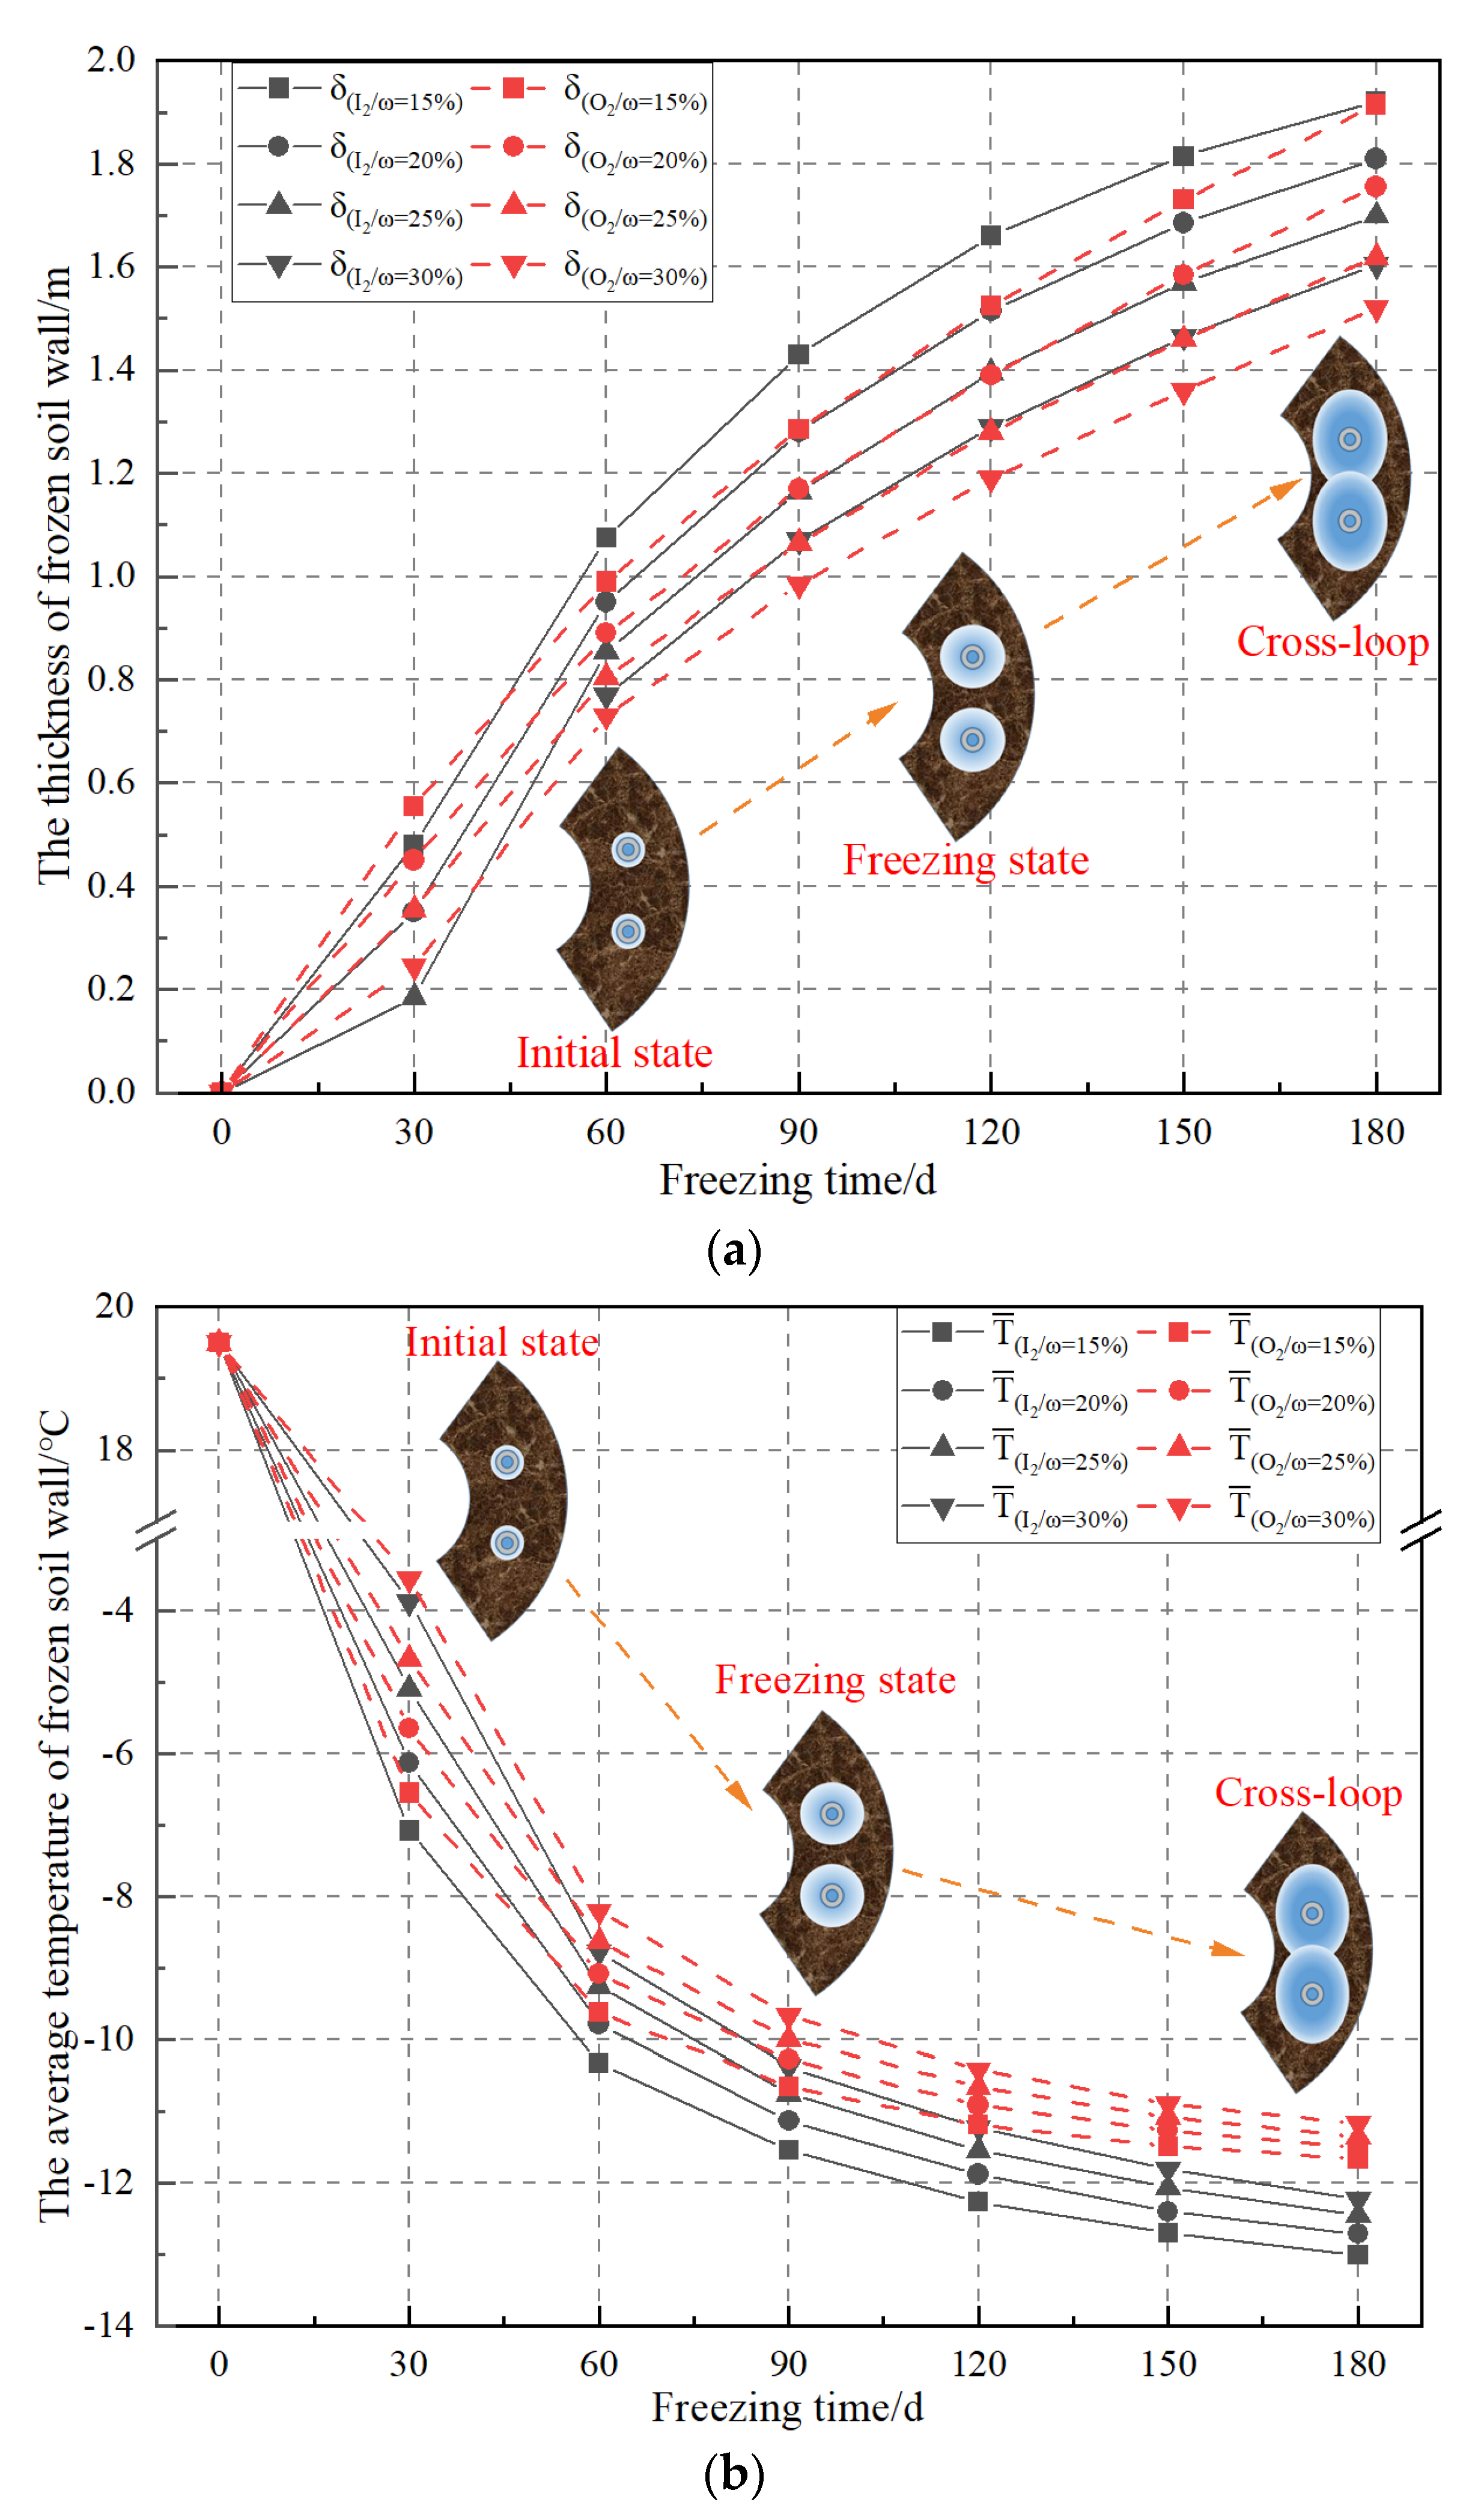
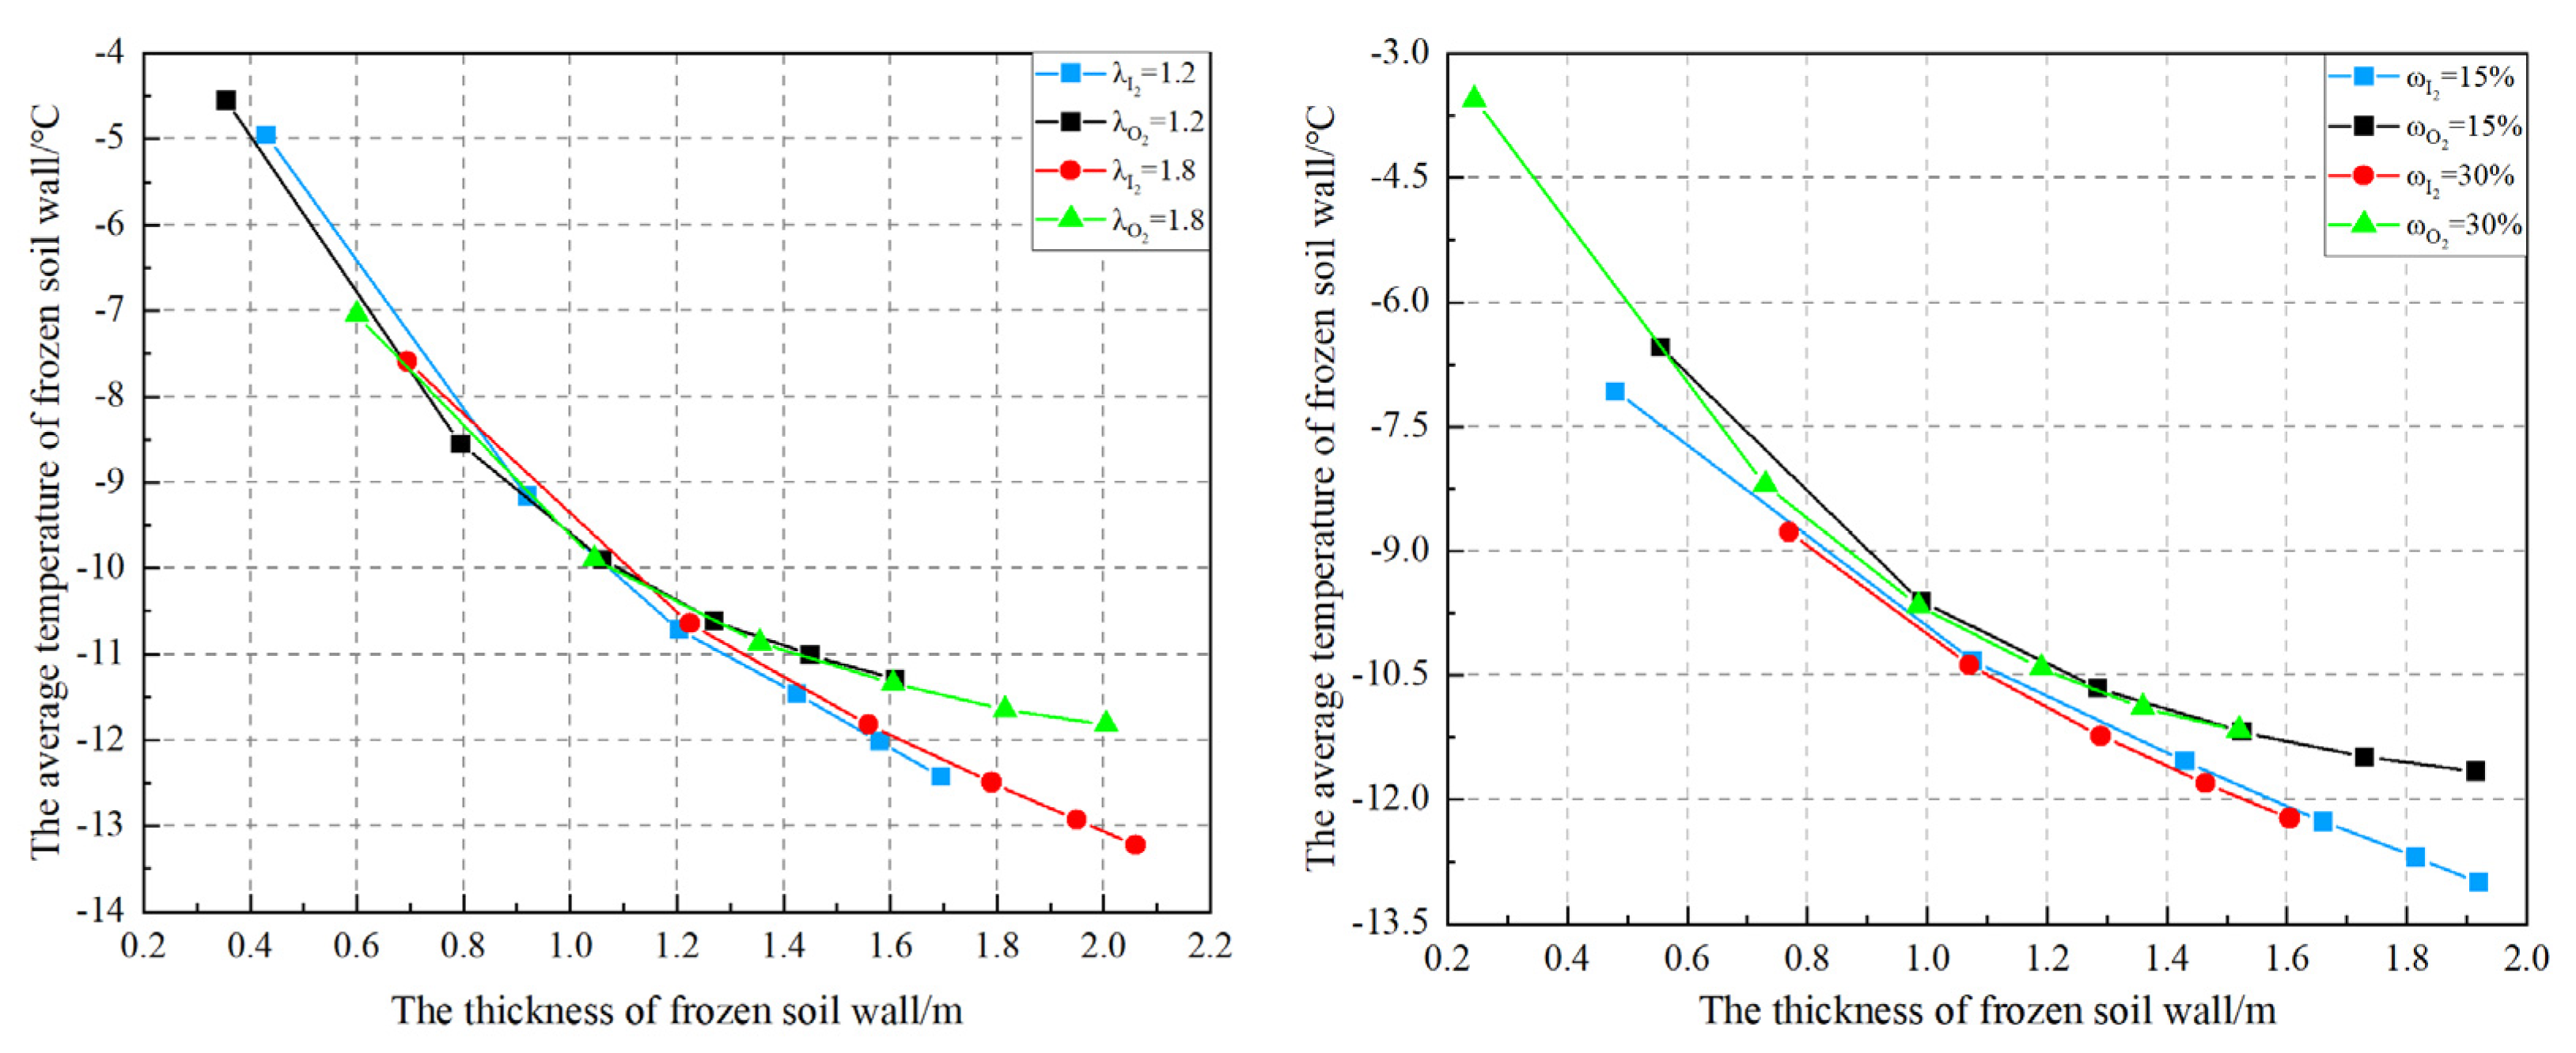
The effect of the thermal conductivity of unfrozen soil (λ) and the soil moisture content (ω) on the thickness (δ) and the average temperature ( T ¯ ) of the frozen soil wall are presented in Figure 21 and Figure 22. The change in the thicknesses in the inside (I2) and outside (O2) of frozen soil walls, caused by the variation in the thermal conductivity of unfrozen soil and the soil moisture content, are similar. These two parameters show a nearly linear relationship with the thickness (δ) and the average temperature ( T ¯ ) of the frozen soil wall when the cross-loop of the frozen soil wall is completed. The increase in the conductivity of unfrozen soil will accelerate the cross-loop of the frozen soil wall, boosting the increase in the thickness and the decrease in the temperature inside and outside the freezing tube. An increase in soil moisture content would achieve the exact opposite effect.
In addition, the thickness (δ) has a power function relationship with freezing time, while the average temperature ( T ¯ ) has a logarithmic function relationship with freezing time after the cross-loop of the adjacent frozen soil wall, as shown in Figure 23. The thickness gradually increases, and the average temperature gradually decreases in the inner and outer areas of the freezing tube with an increase in freezing time. The thickness of the outer frozen soil wall (δw) and the thickness of the inner frozen soil wall (δn) are basically the same under ventilation conditions, and the thickness of the frozen soil wall inside and outside the freezing tube remains within 1.5~2.1 m after 180 d of freezing. However, the average temperature of the outer frozen soil wall ( T ¯ w) is slightly higher than the average temperature of the inner frozen soil wall ( T ¯ n) by 1~2 °C after the cross-loop of the adjacent frozen soil wall.
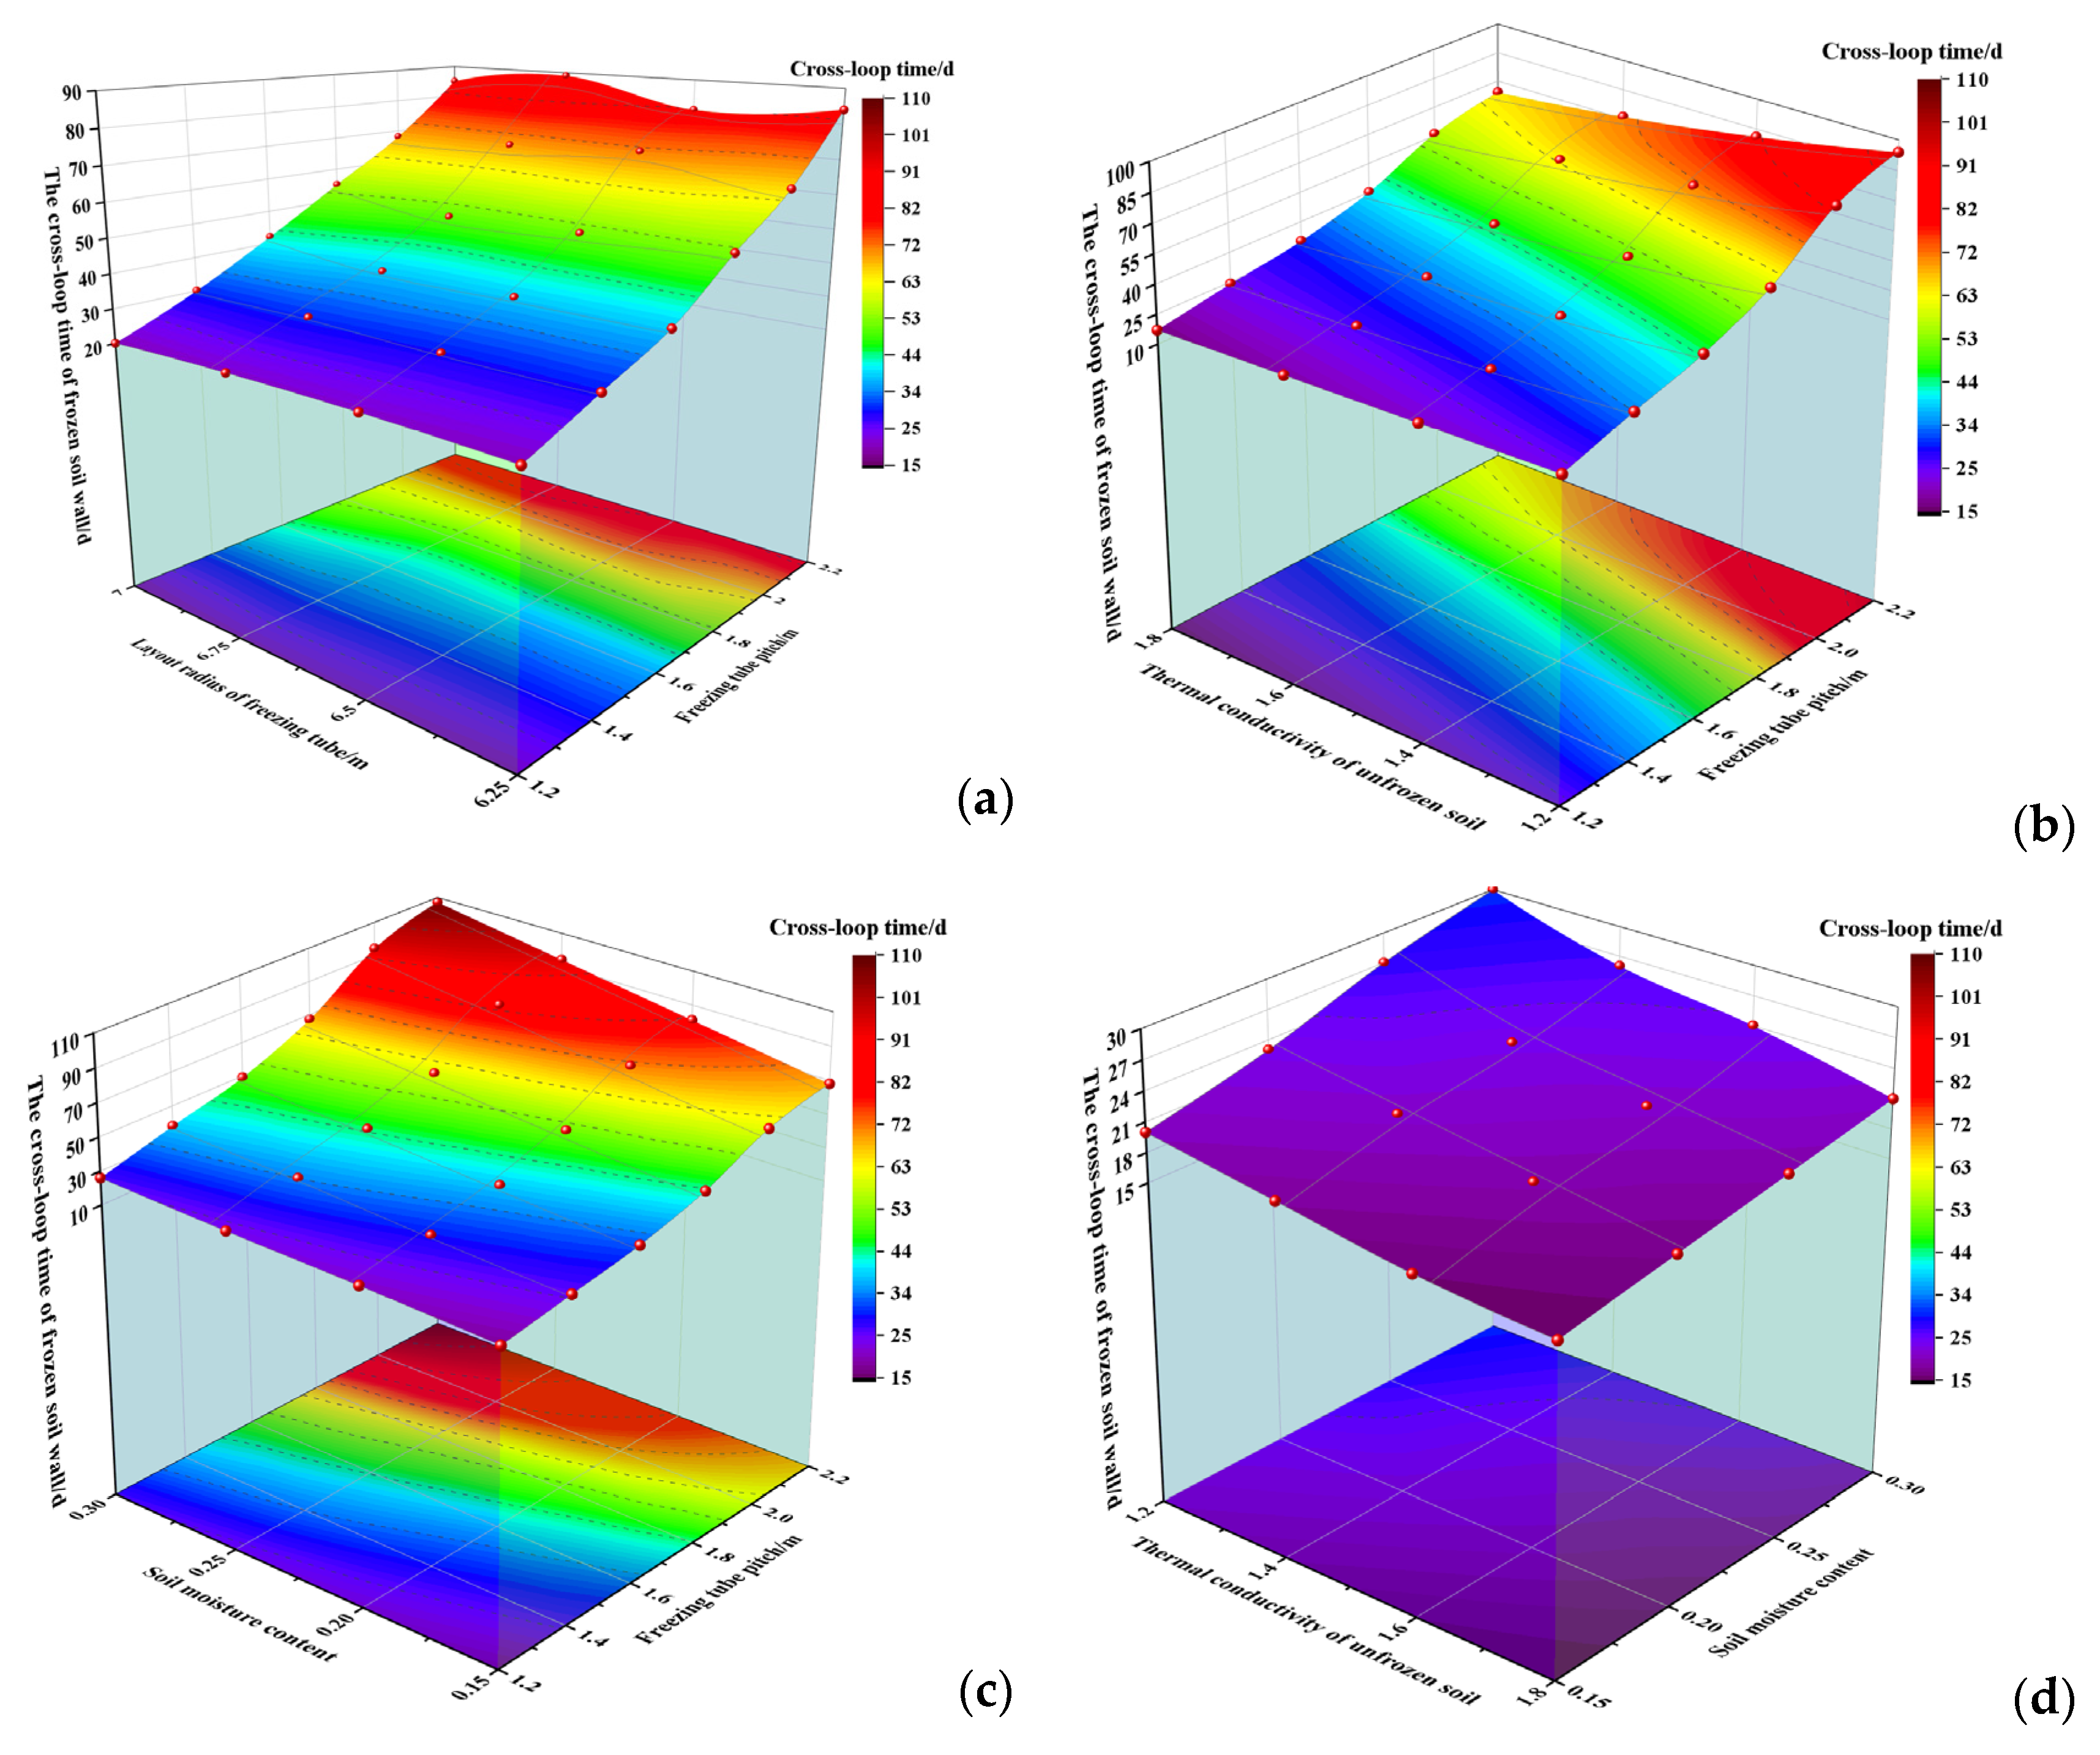
Figure 24 shows the relationship between the cross-loop time and different parameters. The layout radius of the freezing tube has a relatively small effect on the cross-loop time of the frozen soil wall when the combined effect of the layout radius of freezing tube and freezing tube pitch is considered in the full combination calculation. The thermal conductivity of unfrozen soil (λ) and soil moisture content (ω) has a linear relationship with the cross-loop time of the frozen soil wall. The cross-loop time of the frozen soil wall becomes shorter with the increase in the thermal conductivity of unfrozen soil and becomes longer with the increase in the soil moisture content when other parameters are determined.
The cross-loop of the frozen soil wall would complete at a rapid rate when the freezing tube pitch decreases, while this parameter has a power function relationship with the cross-loop time of the frozen soil wall. The frozen soil wall can reach the cross-loop state in 17~26 days when the value of the freezing tube pitch is 1.2 m, while the cross-loop time exceeds 50 days when the value of the freezing tube pitch increases to 1.8 m, and extends to 64~107 days when the value of the freezing tube pitch increases to 2.2 m, as shown in Figure 24a–d.

4. Conclusions

To study the development law of the temperature field around the frozen soil wall under ventilation conditions, a numerical calculation model of the freezing temperature field was established based on the actual conditions of the east ventilation shaft in the Chengjiao coal mine during repair by the freezing method, and the effects of various factors on the development laws regarding the temperature and thickness of the frozen soil wall were studied and analyzed. The detailed conclusions are shown below:
(1) The temperature of the frozen soil wall inside the freezing tube is higher than that outside the freezing tube due to the continuous cooling capacity loss of inner shaft wall surface induced by ventilation. The thickness of the frozen soil wall outside the freezing tube gradually exceeds that inside the freezing tube, and the difference between these two parts is approximately 0.2~0.3 m, while the temperature difference is no more than 1 °C.
(2) The layout radius of the freezing tube and the freezing tube pitch show a greater impact on the temperature distribution of the shaft wall and frozen soil wall. The decrease in these two parameters could reduce the temperature of the shaft wall and boost the variance of the temperature in the interlayer and outside surface of the shaft wall. In addition, the frozen soil wall did not complete the cross-loop in 180 d under ventilation condition when the freezing tube pitch exceeds 2.3~2.5 m, at this point, the thicker strata make it difficult for the cooling capacity to pass through.
(3) The temperature reduction of the frozen soil wall is mainly concentrated in the initial freezing stage due to the huge temperature difference between the freezing tube and topsoil. The higher thermal conductivity of unfrozen soil and the lower soil moisture content could clearly enhance the cooling capacity transfer from the low-temperature region, reducing the temperature of the frozen soil wall, and then thickening this material at a higher speed. In addition, the soil moisture content plays an important role in the initial freezing generation under ventilation conditions due to the energy required for latent heat of the phase transition.
(4) The full combination numerical simulation results present that the layout radius of the freezing tube shows relatively small effect on the cross-loop time of the frozen soil wall when the combination effect of layout radius of freezing tube and freezing tube pitch is comprehensively considered.
(5) For the artificial ground freezing project, the frozen soil wall can complete the cross-loop even if the inside surface of the shaft wall is ventilated and the cross-loop time is mainly affected by the freezing tube pitch, which is the primary factor of the freezing project.
This paper is expected to provide theoretical support in predicting the development law of the temperature field around the frozen soil wall and serving the field operation of freezing construction under ventilation conditions. Meanwhile, the findings of this study are mainly derived from numerical simulations of a certain artificial ground freezing project, and the influence of groundwater seepage and other factors has not been considered. More research methods and research factors will be considered in our future study. In addition, the artificial ground freezing method is not recommended when there is a high flow rate in groundwater, low-strength permafrost walls, and extremely low moisture content conditions.

Author Contributions

Conceptualization, T.H.; Methodology, T.Z.; Software, T.H. and T.L.; Formal analysis, Y.X. and T.L.; Resources, T.L.; Data curation, T.H. and T.Z.; Writing—original draft, Y.X.; Writing—review and editing, T.H., T.Z. and T.L. All authors have read and agreed to the published version of the manuscript.

Funding

This research was funded by [the National Key Research and Development Program of China] grant number [2016YFC0600904], [the National Natural Science Foundation of China] grant number [41501075 and 41472224] and [the Natural Science Foundation of Jiangsu Province] grant number [BK20200653].

Institutional Review Board Statement

Not applicable.

Informed Consent Statement

Not applicable.

Data Availability Statement

The data set used in this work is publicly available (from 10 March 2023) at the Digital Rocks (https://www.digitalrocksportal.org/projects/446).

Acknowledgments

We thank the anonymous reviewers for their professional suggestions in improving this submission. Thanks for the support of Yongcheng Coal & Electricity Holding Group Co., Ltd. (Yongcheng, China).

Conflicts of Interest

The authors declare no conflict of interest.

References

  1. Li, G. Research and application of key technology for drilling wells by freezing method in 600 m extra thick alluvial layer. In Proceedings of the High-level Academic Forum on the 50th Anniversary of the Chinese Coal Society, Beijing, China, 13 November 2012. [Google Scholar]
  2. Liu, Y.; Hu, J.; Xiao, H.; Chen, E.J. Effects of material and drilling uncertainties on artificial ground freezing of cement-admixed soils. Can. Geotech. J. 2017, 54, 1659–1671. [Google Scholar] [CrossRef]
  3. Liu, Y.; Li, K.; Li, D.; Tang, X.; Gu, S. Coupled thermal–hydraulic modeling of artificial ground freezing with uncertainties in pipe inclination and thermal conductivity. Acta Geotech. 2022, 17, 257–274. [Google Scholar] [CrossRef]
  4. Li, Z.; Chen, J.; Sugimoto, M.; Ge, H. Numerical simulation model of artificial ground freezing for tunneling under seepage flow conditions. Tunn. Undergr. Space Technol. 2019, 92, 103035. [Google Scholar] [CrossRef]
  5. Hou, S.; Yang, Y.; Cai, C.; Chen, Y.; Li, F.; Lei, D. Modeling heat and mass transfer during artificial ground freezing considering the influence of water seepage. Int. J. Heat Mass Transf. 2022, 194, 123053. [Google Scholar] [CrossRef]
  6. Alzoubi, M.A.; Xu, M.; Hassani, F.P.; Poncet, S.; Sasmito, A.P. Artificial ground freezing: A review of thermal and hydraulic aspects. Tunn. Undergr. Space Technol. 2020, 104, 103534. [Google Scholar] [CrossRef]
  7. Jahan, C.; Quamruzzaman, C.; Mazumder, Q.; Haque, T. Artificial ground freezing method for shaft construction in maddhapara hardrock mine, bangladesh: Minimization of its cost. Pak. J. Sci. Ind. Res. 2004, 47, 112–117. [Google Scholar]
  8. Yang, R.; Wang, Q.; Yang, L. Closed-form elastic solution for irregular frozen wall of inclined shaft considering the interaction with ground. Int. J. Rock Mech. Min. Sci. 2017, 100, 62–72. [Google Scholar] [CrossRef]
  9. Yao, Y.; Cheng, Y.; Lin, J.; Ji, J.; Zhang, Z. Fuzzy random sensitivity analysis model for reliability of freezing shaft lining structure in deep alluvium. J. Min. Saf. Eng. 2022, 39, 107–117. [Google Scholar]
  10. Zhang, J.; Li, F.; Yu, X.; Ding, H.; Kong, L. Research on evolution characteristics of early-age temperature-stress field of inner lining at deep frozen shaft. Coal Sci. Technol. 2021, 49, 69–76. [Google Scholar]
  11. Gong, Y.; Fu, C.; Wang, X. Numerical analysis of temperature field expansion law in deep frozen shaft. Coal Technol. 2020, 39, 171–173. [Google Scholar]
  12. Yao, Y.; Cheng, Y.; Rong, C.; Cai, H. Fuzzy random reliability model establishment of freezing shaft lining structure under big data environment. Coal Sci. Technol. 2019, 47, 30–35. [Google Scholar]
  13. Cui, H. Analysis of expansion law and influencing factors of shaft freezing temperature field in western water rich soft rock. Coal Technol. 2018, 37, 76–79. [Google Scholar]
  14. Cui, G.; Yang, W.; Lv, H. Freezing Walls and Shaft Walls in Deep Topsoil Layers; China University of Mining and Technology Press: Xuzhou, China, 1998. [Google Scholar]
  15. Cui, G. Progress and prospects for special constructional technique of underground engineering in complex stratum. Coal 2000, 9, 3–7+26. [Google Scholar]
  16. Yang, G.; Xi, J. Review and prospects of research on freezing design theory of coal mine shaft. Chin. J. Undergr. Space Eng. 2010, 6, 627–635. [Google Scholar]
  17. Yang, W. Development and Prospects of Freeze-Out Well Drilling Technology in China in the Past Decade. In Proceedings of the High-Level Academic Forum on the 50th Anniversary of the Chinese Coal Society, Beijing, China, 13 November 2012. [Google Scholar]
  18. Tounsi, H.; Rouabhi, A.; Jahangir, E. Thermo-hydro-mechanical modeling of artificial ground freezing taking into account the salinity of the saturating fluid. Comput. Geotech. 2019, 119, 103382. [Google Scholar] [CrossRef]
  19. Jin, H.; Go, G.-H.; Ryu, B.H.; Lee, J. Experimental and numerical investigation of closure time during artificial ground freezing with vertical flow. Geomech. Eng. 2021, 27, 433–445. [Google Scholar]
  20. Shastri, A.; Sánchez, M.; Gai, X.; Lee, M.Y.; Dewers, T. Mechanical behavior of frozen soils: Experimental investigation and numerical modeling. Comput. Geotech. 2021, 138, 104361. [Google Scholar] [CrossRef]
  21. Esmaeili-Falak, M.; Katebi, H.; Javadi, A.A. Experimental study of the mechanical behavior of frozen soils—A case study of tabriz subway. Period. Polytech. Civ. Eng. 2018, 62, 117–125. [Google Scholar] [CrossRef] [Green Version]
  22. Yang, Y.; Gao, F.; Lai, Y.; Cheng, H. Experimental and theoretical investigations on the mechanical behavior of frozen silt. Cold Reg. Sci. Technol. 2016, 130, 59–65. [Google Scholar]
  23. Yang, Y.; Gao, F.; Lai, Y.; Zhang, X. Triaxial creep characteristic and fractional order constitutive model of frozen silt. Electron. J. Geotech. Eng. 2014, 19, 3757–3768. [Google Scholar]
  24. Yang, Y.; Lai, Y.; Chang, X. Laboratory and theoretical investigations on the deformation and strength behaviors of artificial frozen soil. Cold Reg. Sci. Technol. 2010, 64, 39–45. [Google Scholar] [CrossRef]
  25. Zhang, T.; Yang, W.; Han, T.; Huang, J.; Zhang, C. Research on the single freezing pipe temperature field under the condition of foam material partial insulation. J. Min. Saf. Eng. 2015, 32, 119–125. [Google Scholar]
  26. Yang, W.; Huang, J. Numerical analysis on the heat flux density of a freezing pipe with constant outer surface temperature. J. Glaciol. Geocryol. 2006, 401–405. [Google Scholar]
  27. Chen, C.; Yang, W.; Zhang, T.; Yang, A. Study on temperature field of single freezing pipe with constant temperature around outer surface. J. Liaoning Tech. Univ. (Nat. Sci. Ed.) 2010, 29, 232–235. [Google Scholar]
  28. Yang, Z.; Che, P. Numerical simulation in horizontal freezing temperature fields of single pipe under the condition of refrigeration cycle. Jiangsu Coal 2004, 70–71. [Google Scholar]
  29. Wang, Z.; Shen, L.; Xie, J. On temperature field variation of the surrounding soil mass caused by artificial single pipeline freezing. Mod. Tunn. Technol. 2014, 51, 110–116. [Google Scholar]
  30. Vialov, S.; Gmoshinskii, V.G.; Gorodetskii, S.E.; Grigorieva, V.; Zaretskii, I. The Strength and Creep of Frozen Soils and Calculations for Ice-Soil Retaining Structures; U.S. Army Cold Regions Research and Engineering Laboratory: Hanover, NH, USA, 1965. [Google Scholar]
  31. Zhang, Y.; Sego, D.C.; Morgenstern, N.R. Deformation of Artificially Frozen Shafts during Excavation. In Proceedings of the 7th International Symposium on Ground Freezing, Nancy, France, 24 October 1994. [Google Scholar]
  32. Asgari, M.; Akhlaghi, M. Transient heat conduction in two-dimensional functionally graded hollow cylinder with finite length. Heat Mass Transf. 2009, 45, 1383–1392. [Google Scholar] [CrossRef]
  33. Yuan, Y. Study on the Freezing Pattern of Different Strata in Xinzhuang Coal Mine’s Substandard Shaft. Master’s Thesis, Xi’an University of Science and Technology, Xi’an, China, 2016. [Google Scholar]
  34. Li, K.; Miao, Z.; Li, D.; Liu, Y. Effect of mesoscale internal structure on effective thermal conductivity of anisotropic geomaterials. Acta Geotech 2022, 17, 3553–3566. [Google Scholar] [CrossRef]
  35. Li, K.; Li, D.; Liu, Y. Meso-scale investigations on the effective thermal conductivity of multi-phase materials using the finite element method. Int. J. Heat Mass Transf. 2020, 151, 119383. [Google Scholar] [CrossRef]
  36. Ding, H.; Li, F.; Cui, B. Study on formation law and influencing factors of freezing reinforcement project plastic pipe frozen wall in soft soil stratum. Urban Mass Transit 2021, 24, 187–191+201. [Google Scholar]
  37. Zhang, T.; Yang, P. Study of horizontal freezing temperature field and the effect of different factors on the freezing wall thickness at the bottom of short pipes. In Proceedings of the 3rd National Academic Conference on Engineering Safety and Protection, Wuhan, China, 16 November 2012. [Google Scholar]
  38. Wang, P. Study on the Formation Process And Influencing Factors of Freezing Temperature Field in Deep Thick Clay Layer. Master’s Thesis, Anhui University of Science and Technology, Anhui, China, 2019. [Google Scholar]
  39. Bi, Q.; Cheng, X.; Shi, L.; Ma, X. Analysis of influencing parameters of temperature field within freezing wall of subway tunnel construction with horizontal ground freezing. J. Lanzhou Univ. Technol. 2009, 35, 121–126. [Google Scholar]
  40. Li, X.; Xiao, G. Application of freezing method in shaft lining repair during operation of return air shaft. J. Henan Sci. Technol. 2020, 39, 29–32. [Google Scholar]
  41. Wu, Z.; Ding, D.; Zhang, C.; Zhang, J.; Tao, Z. Engineering Behaviour of Frozen Wall in Artificial Freezing Sinking, 1st ed.; Lanzhou University Press: Lanzhou, China, 1988; pp. 84–85. [Google Scholar]
  42. Zhang, S.; Yang, J. Construction Handbook for Ground Freezing Method; Emergency Management Press: Beijing, China, 2021.
  43. Xu, X.; Wang, J.; Zhang, L. Thermal Physics of Permafrost; Science Press: Beijing, China, 2010. [Google Scholar]
  44. Hong, Z.; Zhang, J.; Han, L.; Wu, Y. Numerical Study on Water Sealing Effect of Freeze-Sealing Pipe-Roof Method Applied in Underwater Shallow-Buried Tunnel. Front. Phys. 2021, 9, 794374. [Google Scholar] [CrossRef]
  45. Niu, Y.; Hong, Z.; Zhang, J.; Han, L. Frozen curtain characteristics during excavation of submerged shallow tunnel using Freeze-Sealing Pipe-Roof method. Res. Cold Arid Reg. 2022, 14, 267–273. [Google Scholar] [CrossRef]
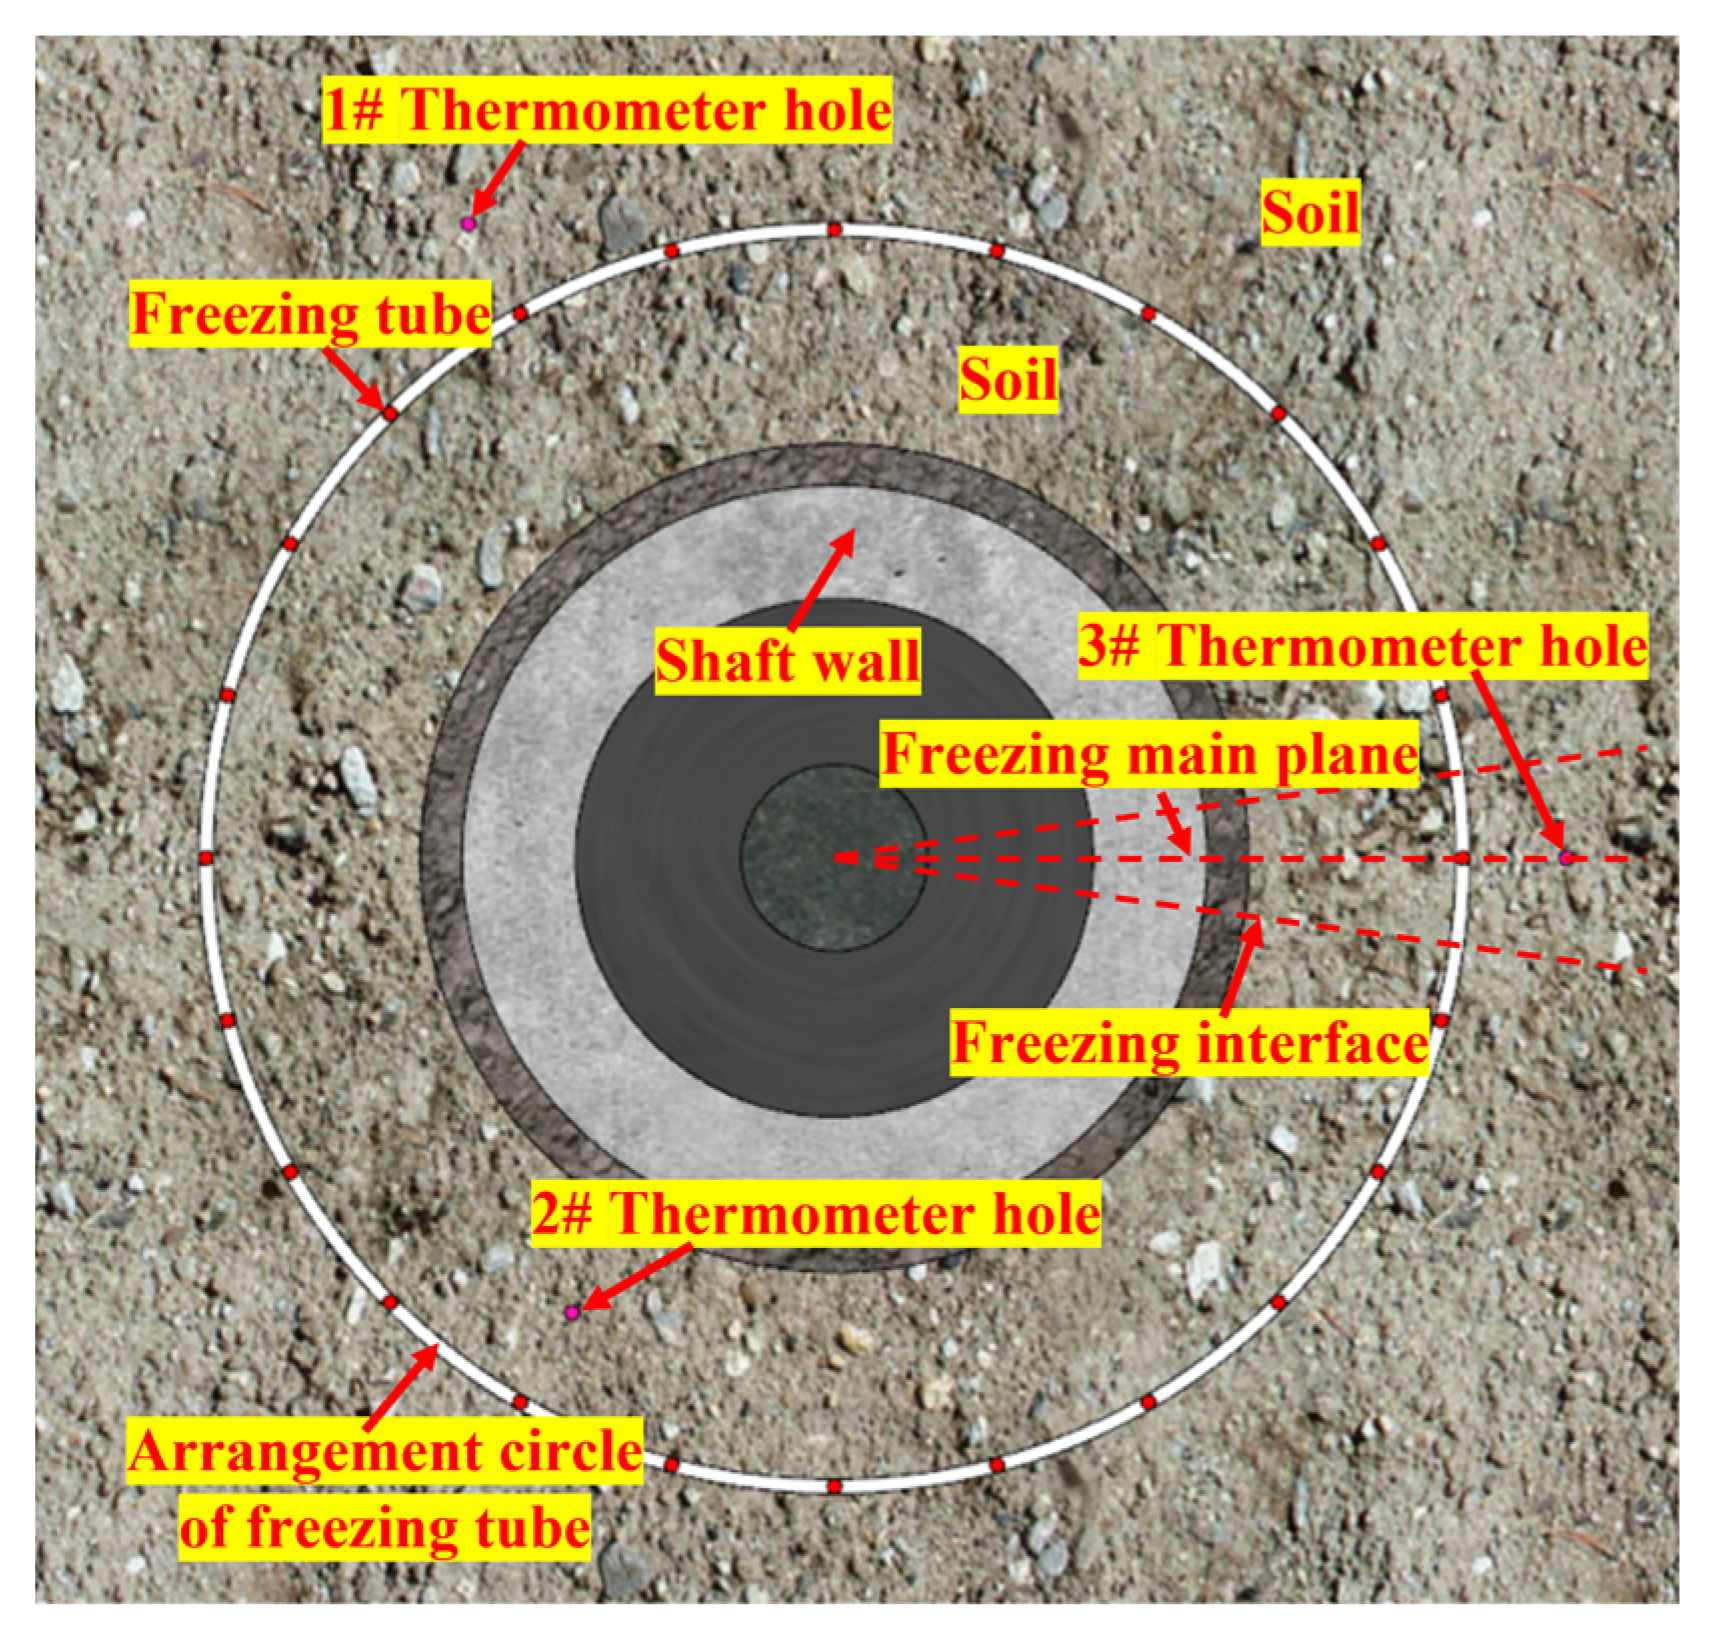
Figure 1. Schematic diagram of shaft construction by the artificial ground freezing method.
Applsci 13 03209 g001
Figure 2. Schematic diagram of cross-loop of frozen soil walls.
Applsci 13 03209 g002
Figure 3. Location of Chengjiao coal mine.
Applsci 13 03209 g003
Figure 4. The photograph appearance of the damaged wall of the east ventilation shaft: (a) −199.5 m, (b) −339.5 m.
Applsci 13 03209 g004
Figure 5. Geometric model.
Applsci 13 03209 g005
Figure 6. Meshing in the freezing temperature field calculation: (a) the general diagram, (b) the partial enlarged drawing.
Applsci 13 03209 g006
Figure 7. Verification for the numerical calculation model using the experimental measurements and the theoretical calculation temperature of frozen soil wall: (a) value comparison, (b) error analysis, (c) evaluation for the grid sensitivity test.
Applsci 13 03209 g007aApplsci 13 03209 g007b
Figure 8. Variance in temperature and thickness under convective heat transfer coefficient of 30 W·m−2·°C−1 and different freezing time: (a) temperature in interlayer and outside wall of shaft, (b) temperature and thickness in the inside and outside of frozen soil wall and its average or sum value with convective heat transfer coefficient of 30 W·m−2·°C−1.
Applsci 13 03209 g008
Figure 9. Temperature contours within 30 d, 90 d, and 180 d.
Applsci 13 03209 g009
Figure 10. Variance in temperature and thickness under different layout radii of freezing tube and freezing time: (a) temperature in interlayer and outside wall of shaft, (b) temperature and thickness in the inside and outside of frozen soil wall and its average or sum value with layout radii of 5.5 m and 6.3 m.
Applsci 13 03209 g010
Figure 11. Temperature contours within 30 d, 90 d, and 180 d: (a) layout radius of 5.5 m, (b) layout radius of 6.3 m.
Applsci 13 03209 g011aApplsci 13 03209 g011b
Figure 12. Variance in temperature and thickness under different freezing tube pitches and freezing time: (a) temperature in interlayer and outside wall of shaft, (b) temperature and thickness in the inside and outside of frozen soil wall and its average or sum value with freezing tube pitches of 1.3 m and 2.5 m.
Applsci 13 03209 g012
Figure 13. Temperature contours within 30 d, 90 d, and 180 d: (a) freezing tube pitch of 1.3 m, (b) freezing tube pitch of 2.5 m.
Applsci 13 03209 g013aApplsci 13 03209 g013b
Figure 14. Variance in temperature and thickness under different freezing tube diameters and freezing time: (a) temperature in interlayer and outside wall of shaft, (b) temperature and thickness in the inside and outside of frozen soil wall and its average or sum value with freezing tube diameters of 140 mm and 159 mm.
Applsci 13 03209 g014
Figure 15. Temperature contours within 30 d, 90 d, and 180 d: (a) freezing tube diameter of 140 mm, (b) freezing tube diameter of 159 mm.
Applsci 13 03209 g015
Figure 16. Variance in temperature and thickness under different thermal conductivities of unfrozen soil and freezing time: (a) temperature in interlayer and outside wall of shaft, (b) temperature and thickness in the inside and outside of frozen soil wall and its average or sum value with thermal conductivities of unfrozen soil of 1.2 W·m−1·°C−1 and 1.5 W·m−1·°C−1.
Applsci 13 03209 g016
Figure 17. Temperature contours within 30 d, 90 d and 180 d: (a) thermal conductivity of unfrozen soil of 1.2 W·m−1·°C−1, (b) thermal conductivity of unfrozen soil of 1.5 W·m−1·°C−1.
Applsci 13 03209 g017aApplsci 13 03209 g017b
Figure 18. Variance in temperature and thickness under different soil moisture contents and freezing time: (a) temperature in interlayer and outside wall of shaft, (b) temperature and thickness in the inside and outside of frozen soil wall and its average or sum value with soil moisture content of 10% and 30%.
Applsci 13 03209 g018
Figure 19. Temperature contours within 30 d, 90 d, and 180 d: (a) soil moisture content of 10%, (b) soil moisture content of 30%.
Applsci 13 03209 g019
Figure 20. Variance in temperature and thickness under different shaft wall thicknesses and freezing time: (a) temperature in the interlayer and outside wall of the shaft, (b) temperature and thickness in the inside and outside of frozen soil wall and its average or sum value with shaft wall thicknesses of 1.1 m and 1.5 m.
Applsci 13 03209 g020aApplsci 13 03209 g020b
Figure 21. Variance in thickness and temperature of frozen soil wall under different thermal conductivity values of unfrozen soil: (a) the effect of thermal conductivity of unfrozen soil on the thickness of frozen soil wall, (b) the effect of thermal conductivity of unfrozen soil on the temperature of frozen soil wall.
Applsci 13 03209 g021
Figure 22. Variance in thickness and temperature of frozen soil wall under different soil moisture contents: (a) the effect of soil moisture content on the thickness of frozen soil wall, (b) the effect of soil moisture content on the temperature of frozen soil wall.
Applsci 13 03209 g022
Figure 23. The relationship between thickness and the average temperature of the frozen soil wall under freezing time within 180 d.
Applsci 13 03209 g023
Figure 24. The contours of cross-loop time with different parameters.
Applsci 13 03209 g024
Table 1. The layer conditions in the topsoil around the east ventilation shaft.
Accumulative Thickness/mLayer Thickness /mLithologic ClassificationAccumulative Thickness/mLayer Thickness/mLithologic Classification
8.78.7Clays240.13Fine sands
14.25.5Clays247.57.4Bauxite clay
21.57.3Silty sands252.55Fine sands
53.932.4Clays257.65.1Clays
57.53.6Clays and silty sands260.12.5Fine sands
74.517Clays262.62.5Silty clays
77.53Fine sands2729.4Clays
83.66.1Clays277.55.5Fine sands
85.82.2Silty sands2857.5Clays
98.312.5Clays29813Clays
118.520.2Sandy clays3024Bauxite clay
1212.5Silty clays307.55.5Fine sands
129.58.5Clays312.55Clays
133.43.9Silty clays319.87.3Bauxite clay
15218.6Bauxite clay332.612.8Clays
1619Clays358.225.6Kaolinite
191.230.2Fine sands361.63.4Mudstone
202.511.3Silty clays366.54.9Fine sandstone
215.412.9Silty clays379.713.2Mudstone
220.45Clays404.524.8Sandy mudstone
235.515.1Fine sands414.710.2Fine sandstone
237.11.6Clays
Table 2. Value ranges of each parameter in the single-factor calculation.
ParameterValue RangesNumber of ValuesValue in the East Ventilation Shaft
Convective heat transfer coefficient (α)/W·m−2·°C−15, 10, 20, 30, 40, 100625
Layout radius of freezing tube (Rd)/m5.5, 5.7, 5.9, 6.1, 6.356.5
Tube pitch (Ld)/m1.3, 1.4, 1.5, 1.6, 1.7, 1.8, 1.9, 2.0, 2.1, 2.2, 2.3, 2.4, 2.5131.45
Diameter of freezing tube (D)/mm140, 1592140
Thermal conductivity of unfrozen soil (λ1)/W·m−1·°C−11.2, 1.3, 1.4, 1.541.4
Thermal conductivity of frozen soil (λ2)/W·m−1·°C−11.44, 1.56, 1.68, 1.841.68
Moisture content (ω)/%10, 15, 20, 25, 30520
The thickness of the wall (δ)/m1.1, 1.521.5
Table 3. Typical parameter values in the single-factor calculation.
ParameterValue ParameterValue
Layout radius of freezing tube (Rd)/m5.5Tube pitch (Ld)/m1.45
Thermal conductivity of unfrozen soil (λ1)/W·m−1·°C−11.4Number of freezing tubes24
Thermal conductivity of frozen soil (λ2)/W·m−1·°C−11.68Moisture content (ω)/%20
Diameter of freezing tube (D)/mm140Initial ground temperature /°C25
The thickness of the wall (δ)/m1.5Annual average temperature of wind flow in the shaft/°C25
Wet density of soil /kg·m−32000Brine temperature/°C−35
Density of concrete /kg·m−32500Outside temperature of the freezing tube/°C−30
Thermal conductivity of concrete /W·m−1·°C−12.8Inside temperature of the shaft wall/°C25
Specific heat of unfrozen soil /kJ·kg−1·°C−10.8Outside temperature of the shaft wall/°C25
Specific heat of frozen soil /kJ·kg−1·°C−10.9Specific heat of concrete /kJ·kg−1·°C−11.1
Table 4. Value ranges of each parameter in the full combination calculation.
ParameterValue RangesNumber of ValuesStep Size
Layout radius of freezing tube (Rd)/m6.25, 6.5, 6.75, 7.040.25
Tube pitch (Ld)/m1.2, 1.4, 1.6, 1.8, 2.0, 2.260.2
Thermal conductivity of unfrozen soil (λ1)/W·m−1·°C−11.2, 1.4, 1.6, 1.840.2
Moisture content (ω)/%15, 20, 25, 3045
Table 5. Typical parameter values in the full combination calculation.
ParameterValue ParameterValue
Layout radius of freezing tube (Rd)/m6.5Tube pitch (Ld)/m1.2
Thermal conductivity of unfrozen soil (λ1)/W·m−1·°C−11.4Number of freezing tubes34
Thermal conductivity of frozen soil (λ2)/W·m−1·°C−11.68Moisture content (ω)/%20
Diameter of freezing tube (D)/mm140Initial ground temperature/°C25
The thickness of the wall (δ)/m1.5Annual average temperature of wind flow in the shaft/°C25
Wet density of soil /kg·m−32000Brine temperature/°C−35
Density of concrete/kg·m−32500Outside temperature of the freezing tube/°C−30
Thermal conductivity of concrete/W·m−1·°C−12.8Inside temperature of the shaft wall/°C25
Specific heat of unfrozen soil/kJ·kg−1·°C−10.8Outside temperature of the shaft wall/°C25
Specific heat of frozen soil/kJ·kg−1·°C−10.9Specific heat of concrete /kJ·kg−1·°C−11.1
Disclaimer/Publisher’s Note: The statements, opinions and data contained in all publications are solely those of the individual author(s) and contributor(s) and not of MDPI and/or the editor(s). MDPI and/or the editor(s) disclaim responsibility for any injury to people or property resulting from any ideas, methods, instructions or products referred to in the content.