Article

Discrete Wavelet Transform—Based Metal Material Analysis Model by Constant Phase Angle Pulse Eddy Current Method

1
School of Mechanical and Electrical Engineering, University of Electronic Science and Technology, Chengdu 611731, China
2
Shanghai Lanbao Sensing Technology Co., Ltd., Shanghai 201404, China
3
Key Laboratory of Traction Power, Southwest Jiaotong University, Chengdu 610031, China
*
Author to whom correspondence should be addressed.
Appl. Sci. 2023, 13(5), 3207; https://doi.org/10.3390/app13053207
Submission received: 18 January 2023 / Revised: 23 February 2023 / Accepted: 25 February 2023 / Published: 2 March 2023
(This article belongs to the Special Issue Trends and Prospects in Applied Electromagnetics)

Abstract

:
Traditional eddy current technology identifies metal information with information of single frequency of limited frequency spectrum. To solve existing problems, this paper proposes a discrete wavelet transform-based metal material analysis model by using a constant phase angle pulse eddy current (CPA-PEC) sensor which collects and depicts metal feature information from multiple dimensions; then, the quantification calculation model of metal material by CPA-PEC feature is presented; finally, an experimental platform is built to collect the CPA-PEC features of various metal samples and verify recognition accuracy of the proposed metal material analysis model. In the investigation, 1000 eddy current signals from four standard metals (Cu, Fe, Al, St) and three types of metallic irons (Fe-K162, Fe-K163, Fe-K240) are measured and the features are identified by discrete wavelet transform. The feature correlation and significance are determined by regression analysis. Finally, the calculation model of feature evaluation index is present. The experimental analysis indicates that the stability of the quantitative evaluation index of eddy current features reaches 97.1%, the comprehensive accuracy error is less than 0.32% and the average measurement speed is about 50 ms for 1000 random sampling tests on standard metals.

1. Introduction

Materials are an important support for industrial development; metallic materials are particularly important. The consistency of metallic materials seriously affects the development of high-end industries. In order to test the consistency of metallic materials, titrimetric [1] and spectroscopic methods [2] are usually presented to detect the elemental composition of samples and thus determine the material properties. However, these methods are complex in operation process, destructive, costly in instrument and inconvenient for applications in the material production site, which greatly constrains the rapid identification of metallic materials.
The eddy current technique is one of the nondestructive testing methods that is widely applied in metal material inspection, such as material integrity testing and material characterization [3,4,5,6,7,8]. The single-frequency eddy current technique is suitable for classifying metals because different metals are made of materials with different electrical conductivity and magnetic permeability; thus, their absorptions of eddy currents are different. Consequently, eddy current detection for metals can replace the expensive spectral scanning method, since it reduces the detection time and improves the detection efficiency [9]. However, compared with the pulsed eddy current technique, single-frequency eddy current signals cannot express frequency domain information. The pulsed eddy current technique has a wide frequency spectrum, and the time domain signal can be filtered for multiple estimation of the electromagnetic parameters of the material from different frequency characteristics during the measurement. Yu et al. put forward the method of quantitative calculation of metal defects by using eddy current nondestructive testing to establish a finite element model, semi-analytical method, etc. [10,11,12,13]; Chen et al. developed a model of the time domain induced voltage and the electromagnetic parameters of the material based on the pulsed signal. They demonstrated the effectiveness of the multi-frequency method in detecting the electromagnetic parameters of the material [14,15]. Wang et al. investigated the phase log-based of conductivity measurements. The results showed that the relationship between the logarithm of the phase and the variation of the conductivity was linear [16]. Lu et al. proposed a model to reconstruct the magnetic permeability, conductivity, and thickness of the sample. The reconstruction error was 5% [17].
When using the eddy current technique to detect the electromagnetic properties of metallic materials, lift-off is one of the important factors affecting the accuracy of the measurement [18,19,20]. As such, eliminating the effect of lift-off is of great importance for metallic material identification. By varying the relative spatial positions of the receiving and transmitting coils, Jin et al. achieved accurate measurements of the sample conductivity within a few millimeters, with a maximum error of 2.68% [21]. Ivan Rep et al. proposed a stochastic inversion method with multi-frequency excitation to simultaneously determine the magnitude of lift-off as well as the conductivity and permeability of the sample; the inversion of these data resulted in a significant reduction in the a priori uncertainty of all model parameters [22]. Lu et al. found that the dual-frequency signal was linearly related to lift-off. By applying different frequencies through the calculation, it was possible to reconstruct the variation of the lift-off of the signal and to reconstruct the electromagnetic properties of the material with an error of 1.4% within 12 mm [23].
In addition, the signal processing method also determines the accuracy of the eddy current method to identify material properties. Yang et al. presented the wavelet transform method to process the eddy current signal of ferromagnetic metal. The weak defective magnetic field signal inside the ferromagnetic metal plate can be identified because of the interference of magnetic domains [24]. Bolos et al. introduced a new wavelet tool, windowed scale index, that is suitable for studying the aperiodic degree of signal, such as the volatility in crude oil and gold prices [25]. Lepicka et al. applied windowed scale index into tribological behavior analysis of titanium nitride-coated stainless steel, successfully proving that the windowed scale index has a great ability to distinguish different tribological states [26]. Silipigni et al. adopted the pulse compression algorithm to compress other forms of signals into a signal similar to the impulse response. They then processed the corresponding signal of the pulse using the time domain algorithm. Compared to the frequency domain signal, the time domain signal is much smoother and less noisy, facilitating signal analysis [27]. Tamhanne et al. analyzed the degree of corrosion of a 20 mm diameter steel bar by the principal component analysis, allowing the lift-off of 55 mm for corrosion detection [28]. Empirical modal decomposition and a non-smooth signal processing method can efficiently remove the noise from the signal. Liu et al. proposed an improved differential empirical modal decomposition method that can effectively suppress signal aliasing and distortion and significantly improve signal accuracy [29]. Likewise, neural network-based classification has better recognition of signals with low signal-to-noise ratios [30,31,32,33].
However, for the metal material consistency issue, metal alloy classification with similar components is still a problem to be solved. More attention should be paid on metal alloy identification with similar components using multi-frequency or magnetic spectrum information.
This paper proposes a technical method of metal material analysis model based on the discrete wavelet transform of eddy current method. The eddy current characteristic information of the metals is collected and described in multiple dimensions, the quantitative calculation model of metal material eddy current characteristic is proposed, and a standard metal material eddy current feature sample library is established to provide a new method for accurate description of metal material features.

2. Principle and Methods

The material characteristics technology with eddy current method is based on the constant phase angle pulse eddy current (CPA-PEC) sensor. The metal material properties sample is formed by extracting the frequency variation and attenuation characteristics of the eddy current field using a discrete wavelet transform model.
The CPA-PEC sensor is an eddy current sensor with a dual coil probe structure, as shown in Figure 1, in which the excitation coil is fed with a periodic ramp signal with a constant change in current to generate the magnetic field. The receiving coil is placed outside the excitation coil to measure the change in the magnetic field. According to the law of electromagnetic induction, it is known that the voltage across the receiving coil is proportional to the rate of change of the magnetic flux at the coil location. The magnetic flux at the receiving coil is related to the material, thickness, lift-off and shape of the detected metal. Different frequencies of the magnetic field in the metals to be measured attenuate the energy differently, so that the corresponding time domain signal in the receiving coil changes. It can then be extracted from the detection target material, thickness, lift-off, shape and other information through data processing. The working principle is described as follows.
The model is simplified for better analysis: the coils are considered as a clingy excitation-receiving system without volume. The excitation source used in this paper is a ramp signal as shown in Figure 1, i.e., I S E = k 1 t , where k 1 is constant. Then, the magnetic field at its axial position x from the center is
B = N 1 μ 0 I S E R 2 2 ( R 2 + x 2 ) 3 / 2
where N1 is the turns of the excitation coil, μ 0 is the vacuum magnetic permeability and R is the coil radius; I S E is the current amplitude of the excitation source.
Then, the voltage across the induction coil U s should be
U s = N 2 d d t = N 1 N 2 S μ 0 R 2 k 2 2 ( R 2 + x 2 ) 3 / 2
where Φ is the magnetic flux flows through the coil, S is the induction area of the coil and N2 is the number of turns of the receiving coil. k 2 is a scale factor of the central magnetic field to the detected magnetic field. From Equation (2), it can be seen that the voltage in the induction coil should be constant when the excitation field is a ramp signal. That is, in free space, the voltage across the induction coil is a constant value.
Assuming an infinite plane current magnetic field source with a magnetic field H 0 z , the solution for the magnetic field in the conductor located at x is
H z = H 0 z e 1 + j 2 ω μ σ x
where H z is the z-directional component of the magnetic field in the metal, x is the location of H z in the conductor, ω is the angular frequency, μ is the magnetic permeability and σ is the electrical conductivity.
It is clear that the current inside the conductor is related to the magnetic field frequency ω and the conductor’s electromagnetic properties μ , σ . The intensity of eddy currents in the conductor increases with frequency within a certain range, but the eddy currents become more and more concentrated in the center of the magnetic field with increasing frequency. Since the magnitude of the magnetic field is proportional to the product of the induced current and its loop area, the magnetic field decreases with increasing frequency within a certain range. It means that there is an optimal magnetic field frequency in detection. The optimal frequency point is dependent of the conductor properties μ , σ in Equation (1).
The wavelet decomposition of the ramp signal shows that the ramp signal corresponds to different spectra at different times in the time domain. The frequency spectrum of the induced voltage of the coil is different at different moments. By combining Equations (1)–(3), the optimal magnetic field frequency for detecting different metals is different, meaning that the time domain signal intensity of the induced voltage at both ends of the coils should be different at different time points when detecting different metals. By analyzing the time domain characteristics of the induction signal of the coil, the material type of the metal can be identified.
The constant parameters used in this paper are shown in Table 1.

3. Experiment and Results

3.1. Experimental Setup

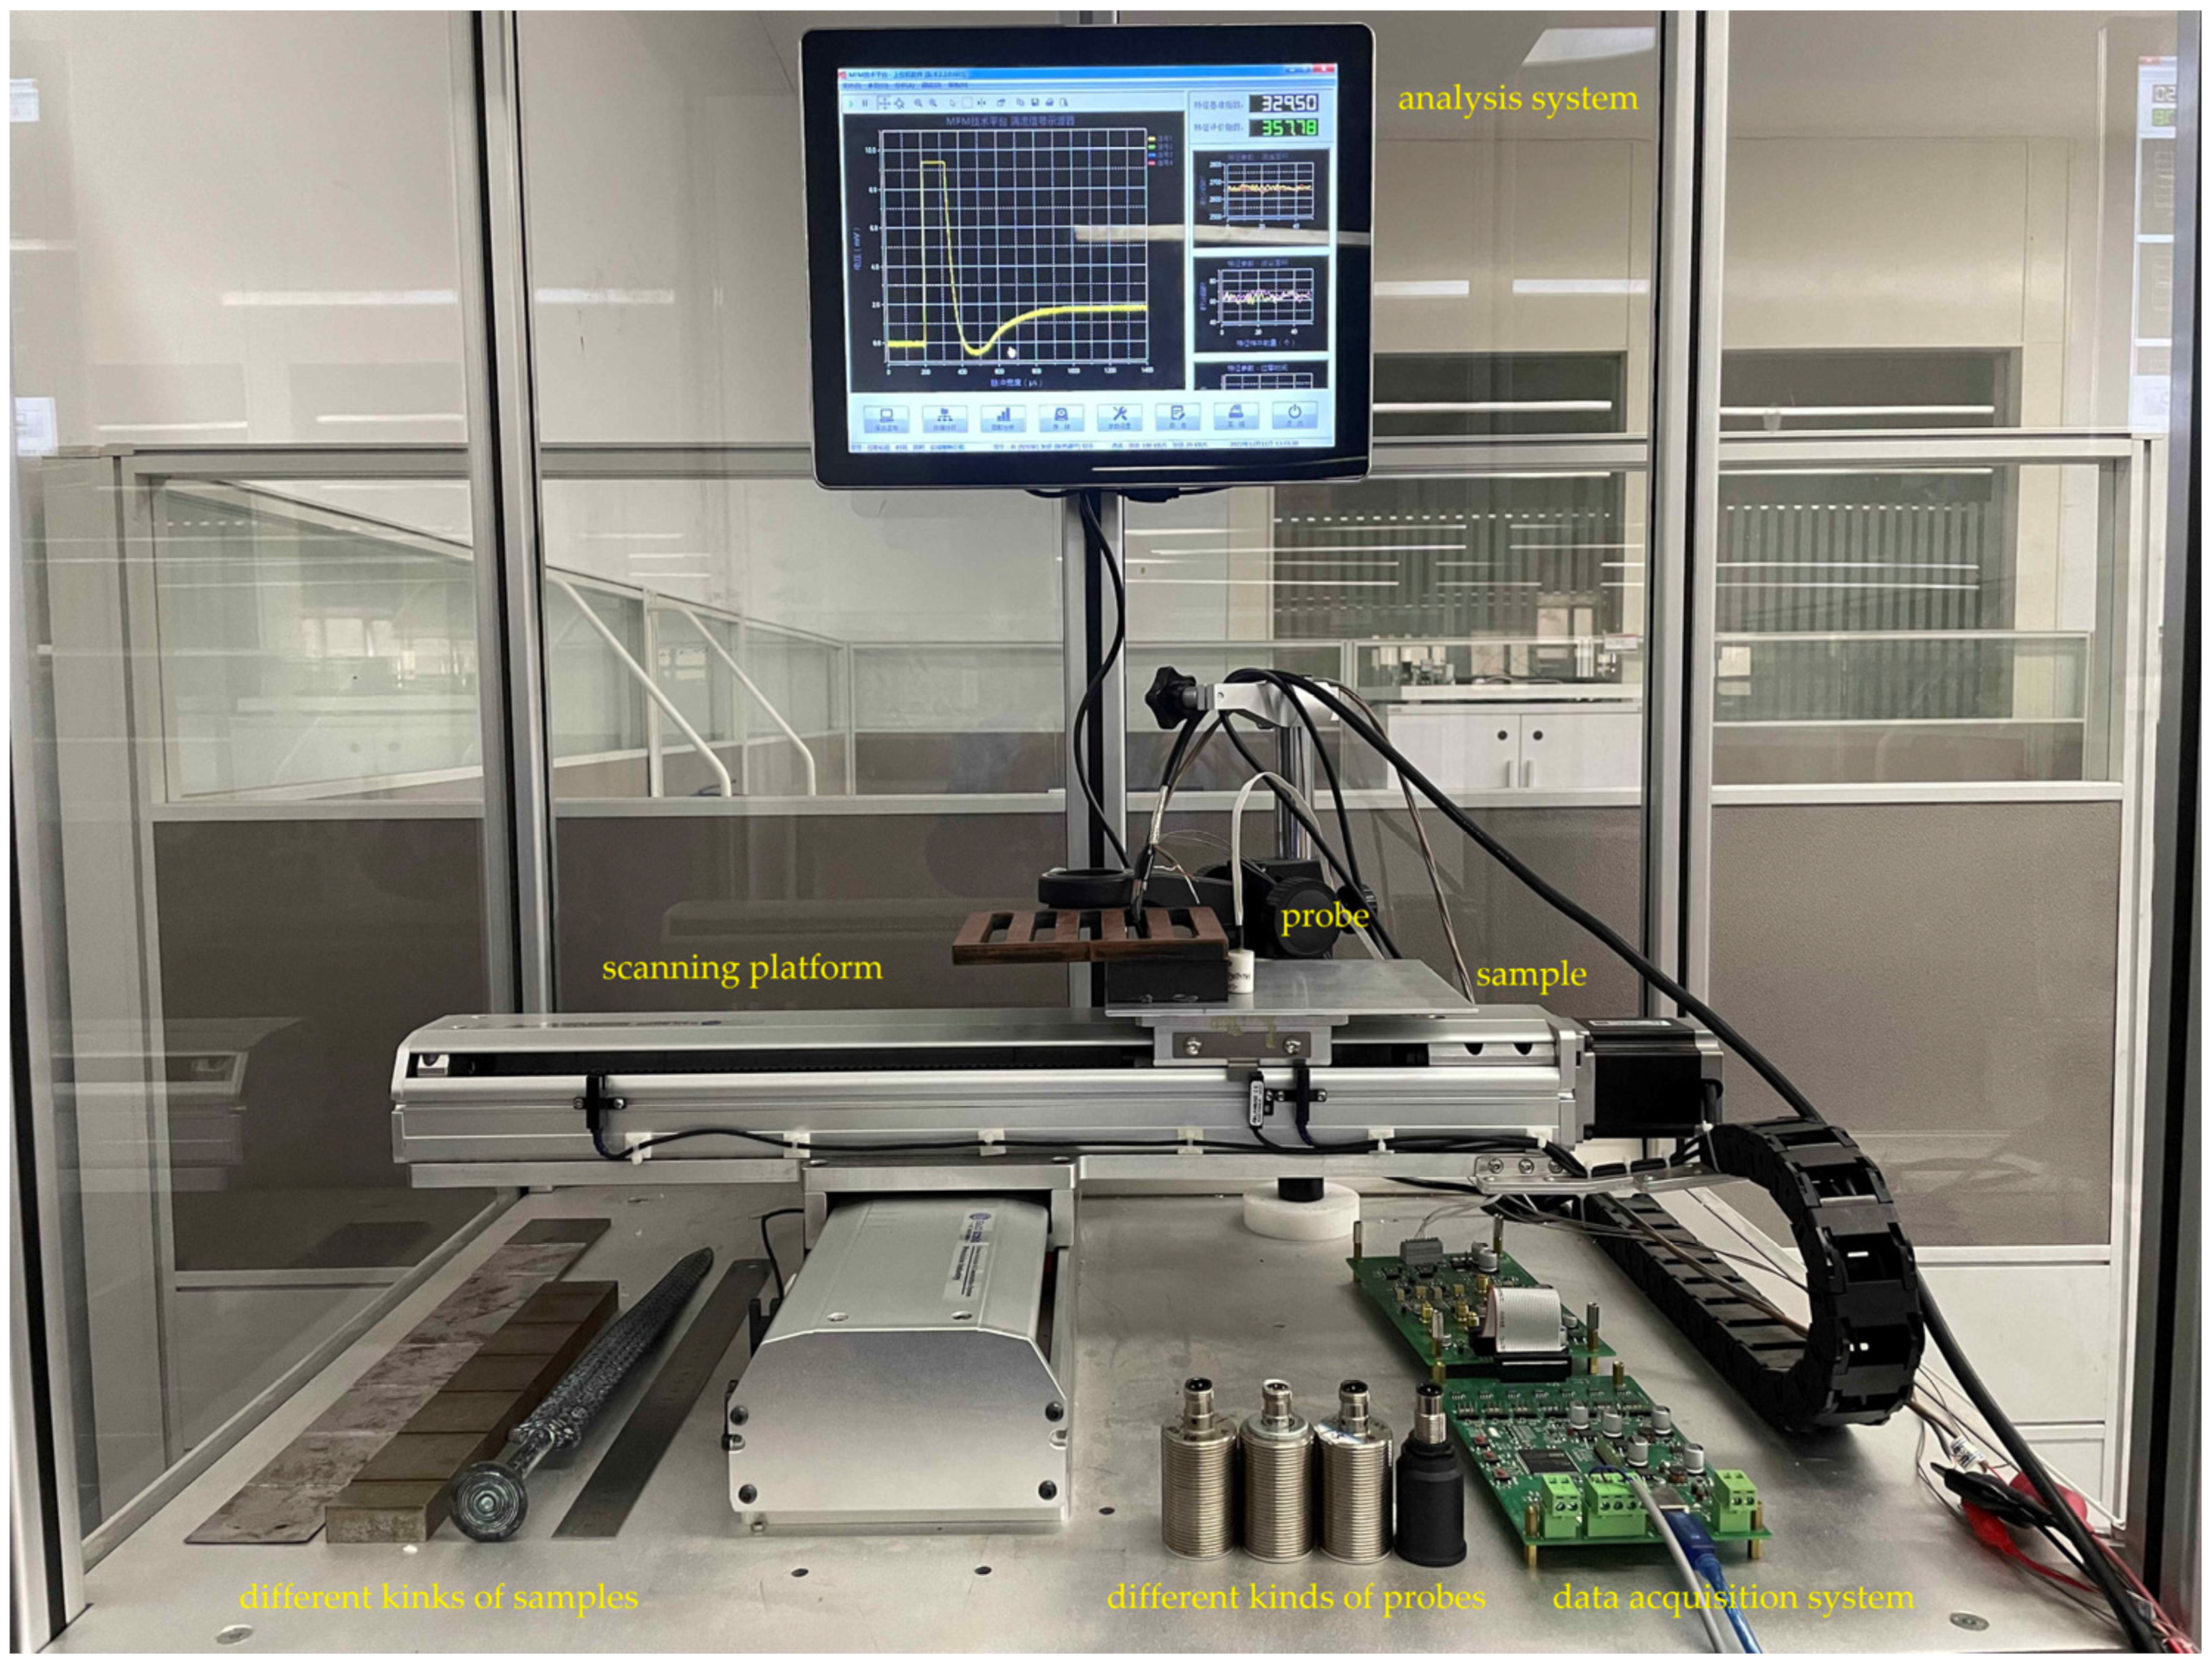
In this section, a system with CPA-PEC is built and shown in Figure 2. The eddy current metal material analysis experimental platform mainly consists of the CPA-PEC probe, the signal generation module, the signal amplification module, the signal receiving module, the 2D scanning platform, the computer and the analysis software of the upper computer.
The signal generation module is used to control the excitation coil to send out the ramp excitation signal. A microcontroller-controlled gate circuit is used for generating a periodic square wave. Then, the CPA-PEC voltage signal is generated by charging and discharging to a capacitor. After that, the voltage on the capacitor is converted to a current signal which is connected to the excitation coil. The receiving coil is used to collect the characteristic signal of metal induced eddy current field when the probe is close to the samples. The signal is fed into a signal amplification and filtering system and then converted into a digital signal by a 10-bit AD.
A discrete wavelet transform model is used to transform the signal. The eddy current characteristic index is calculated by the discrete signal characteristic analysis model, which can quickly identify the metal to be measured. The experimental data are based on 100 replicate measurement sampling with the CPA-PEC probe. The detection results of metal samples Cu, Fe, Al, St, Fe-K162, Fe-K163 and Fe-K240 were analyzed by feature extraction of the data. The proportion of the elements in metallic alloys Fe-K162, Fe-K163 and Fe-K240 are listed in Table 2.
The amplitude of the ramp signal is 825 mV, the width of the signal is 20 us and the repeat frequency is 1 kHz.

3.2. Discrete Wavelet Transform—Based Metal Material Analysis Model

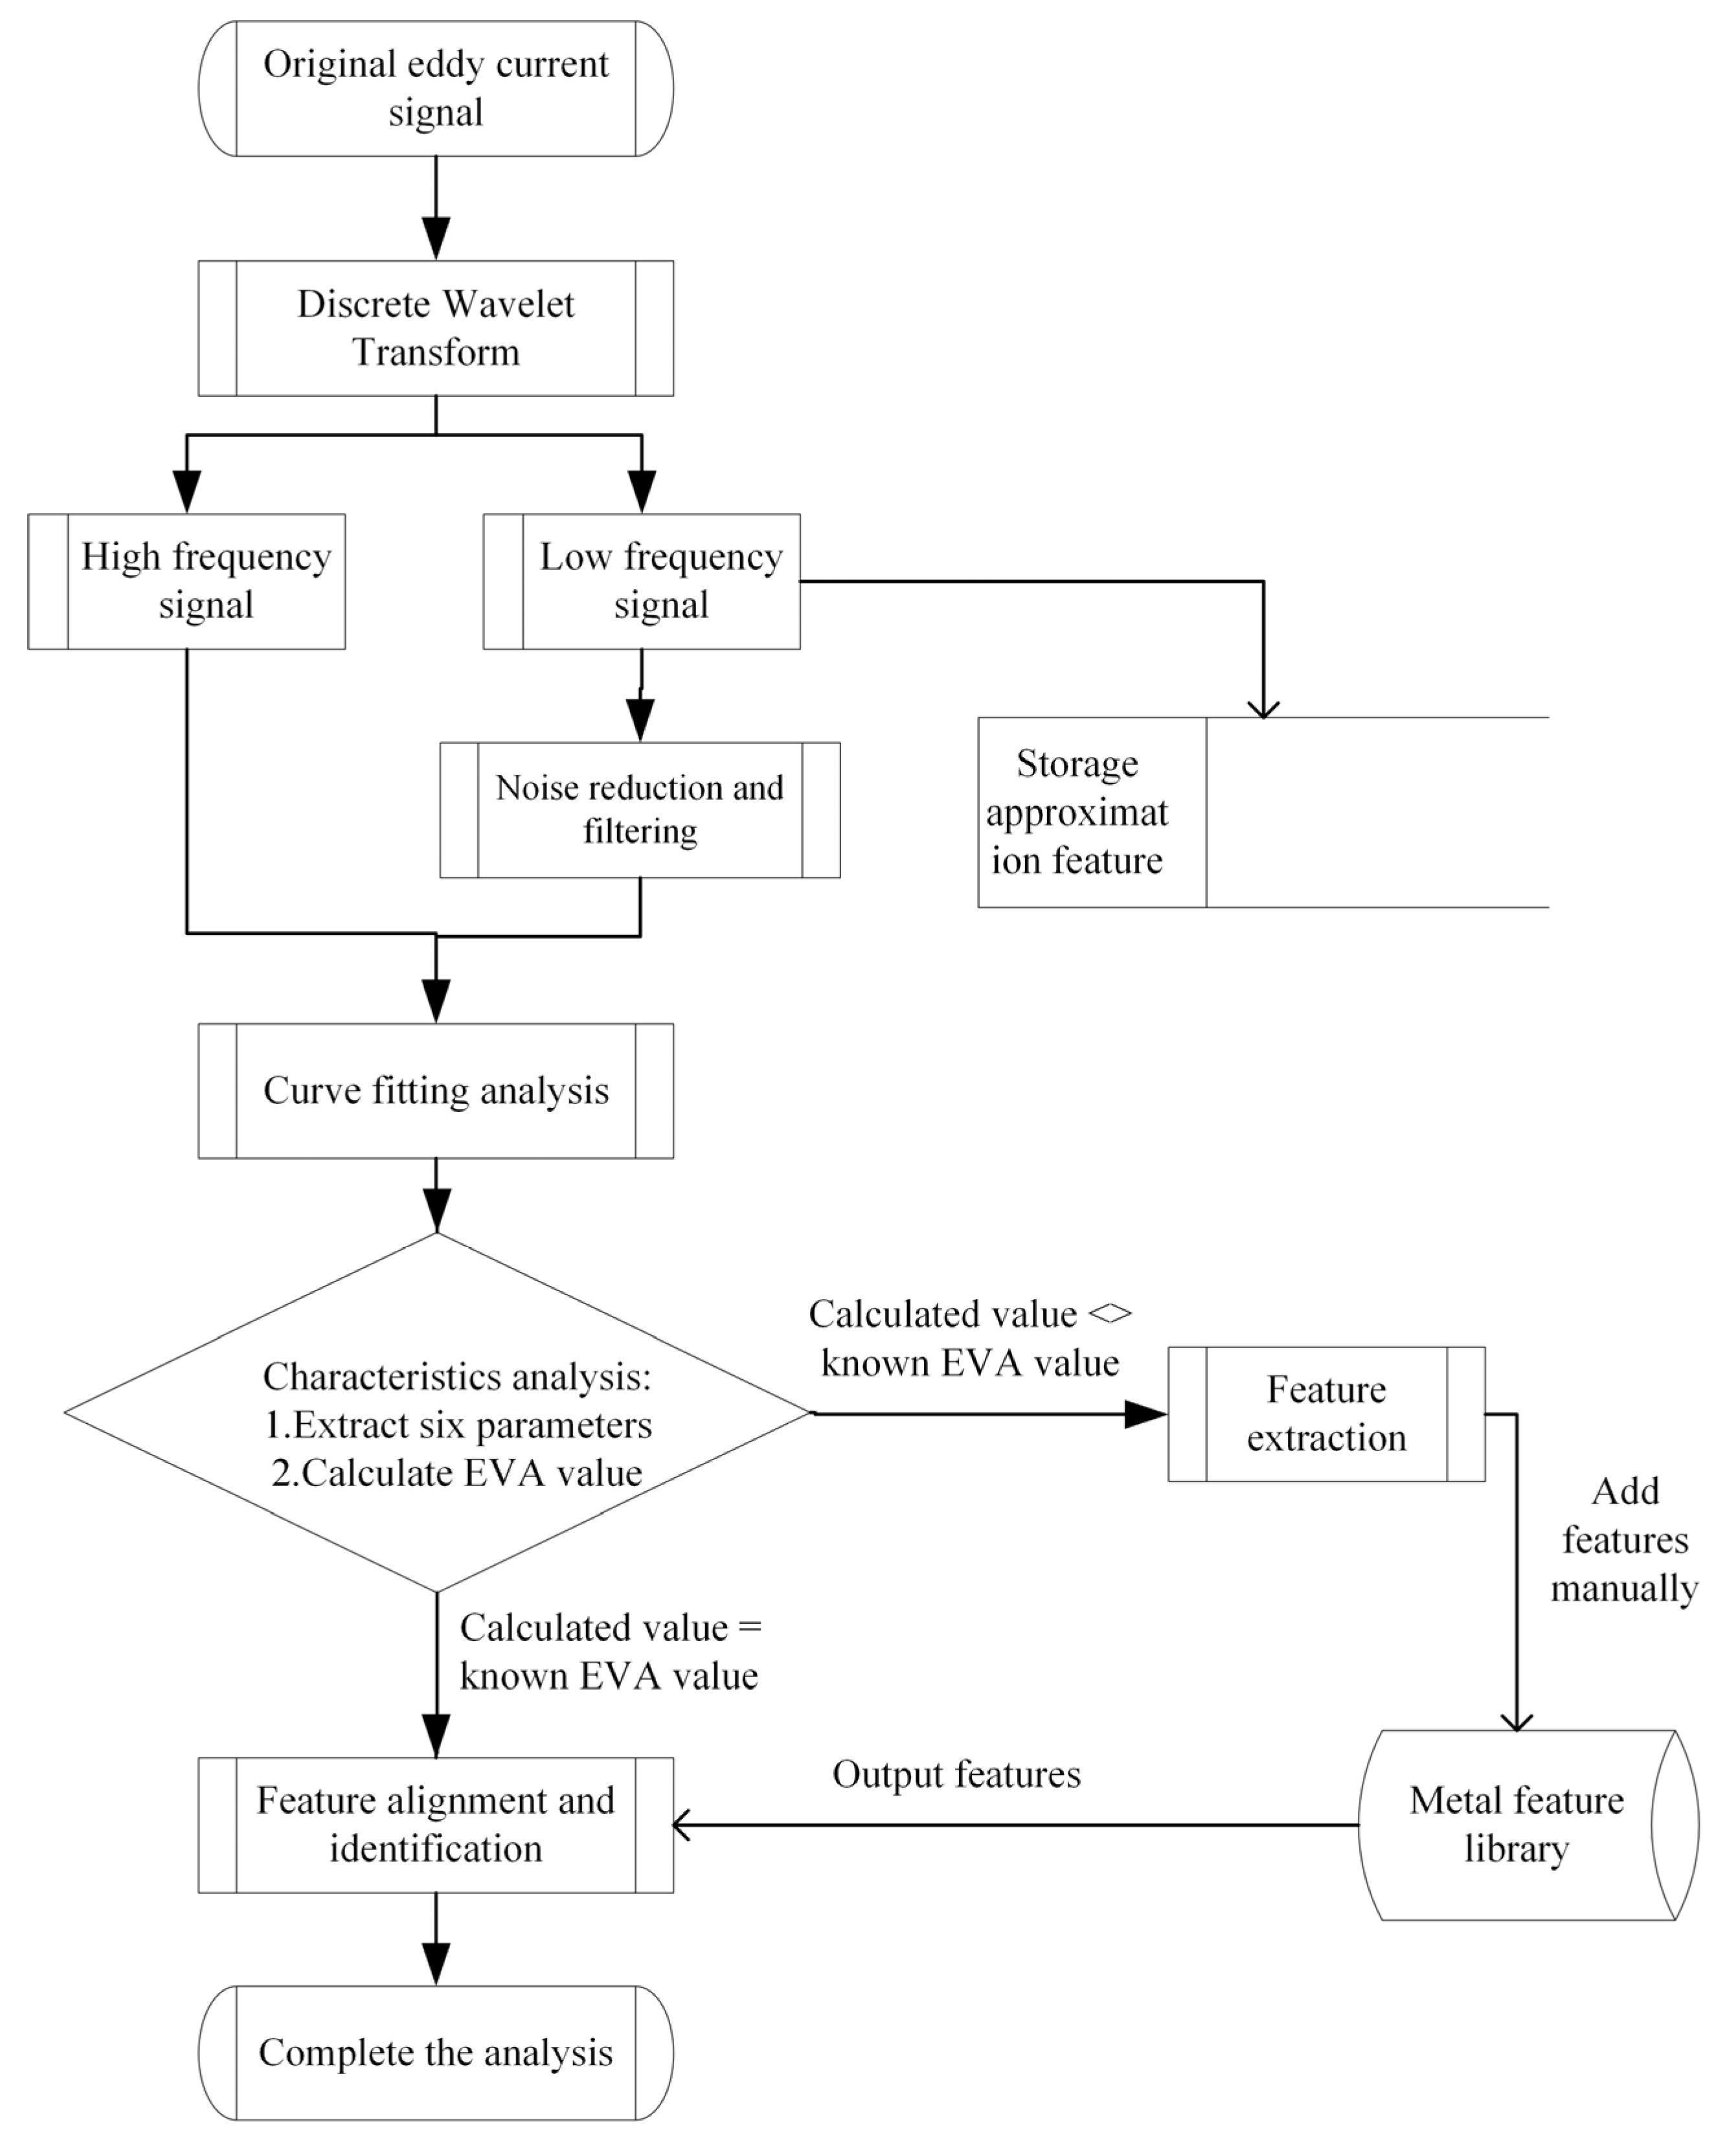
The identification method and steps of the metal material analysis model are shown in Figure 3.
In this paper, the characteristics of the signal in the time domain and frequency domain are analyzed, different eddy current characteristics are extracted from time and frequency domain, and the calculation model of the characteristic evaluation index is constructed to calculate the eddy current characteristic index. The consistency between the measured metal and the known metal materials is judged by comparing the metal eddy current characteristic database.
Wavelet transform is an algorithm suitable for non-smooth signal analysis. It can decompose a given time-domain signal into several sets of wavelets carrying different frequency information. That means that the wavelet transform analysis method can be used to control the frequency components in the signal very well. It should be noticed that, when the wavelet reconstruction is performed, the reconstruction coefficients should be optimized for the specific length of the data. If too much low-frequency information is retained in the reconstructed signal, the jitter from signal acquisition cannot be removed. If the reconstructed signal retains too much high-frequency information, the effect of high frequency noise on the signal cannot be removed. However, if too little high-frequency or low-frequency information is retained, the signal will be severely distorted, affecting the feature extraction of the signal.
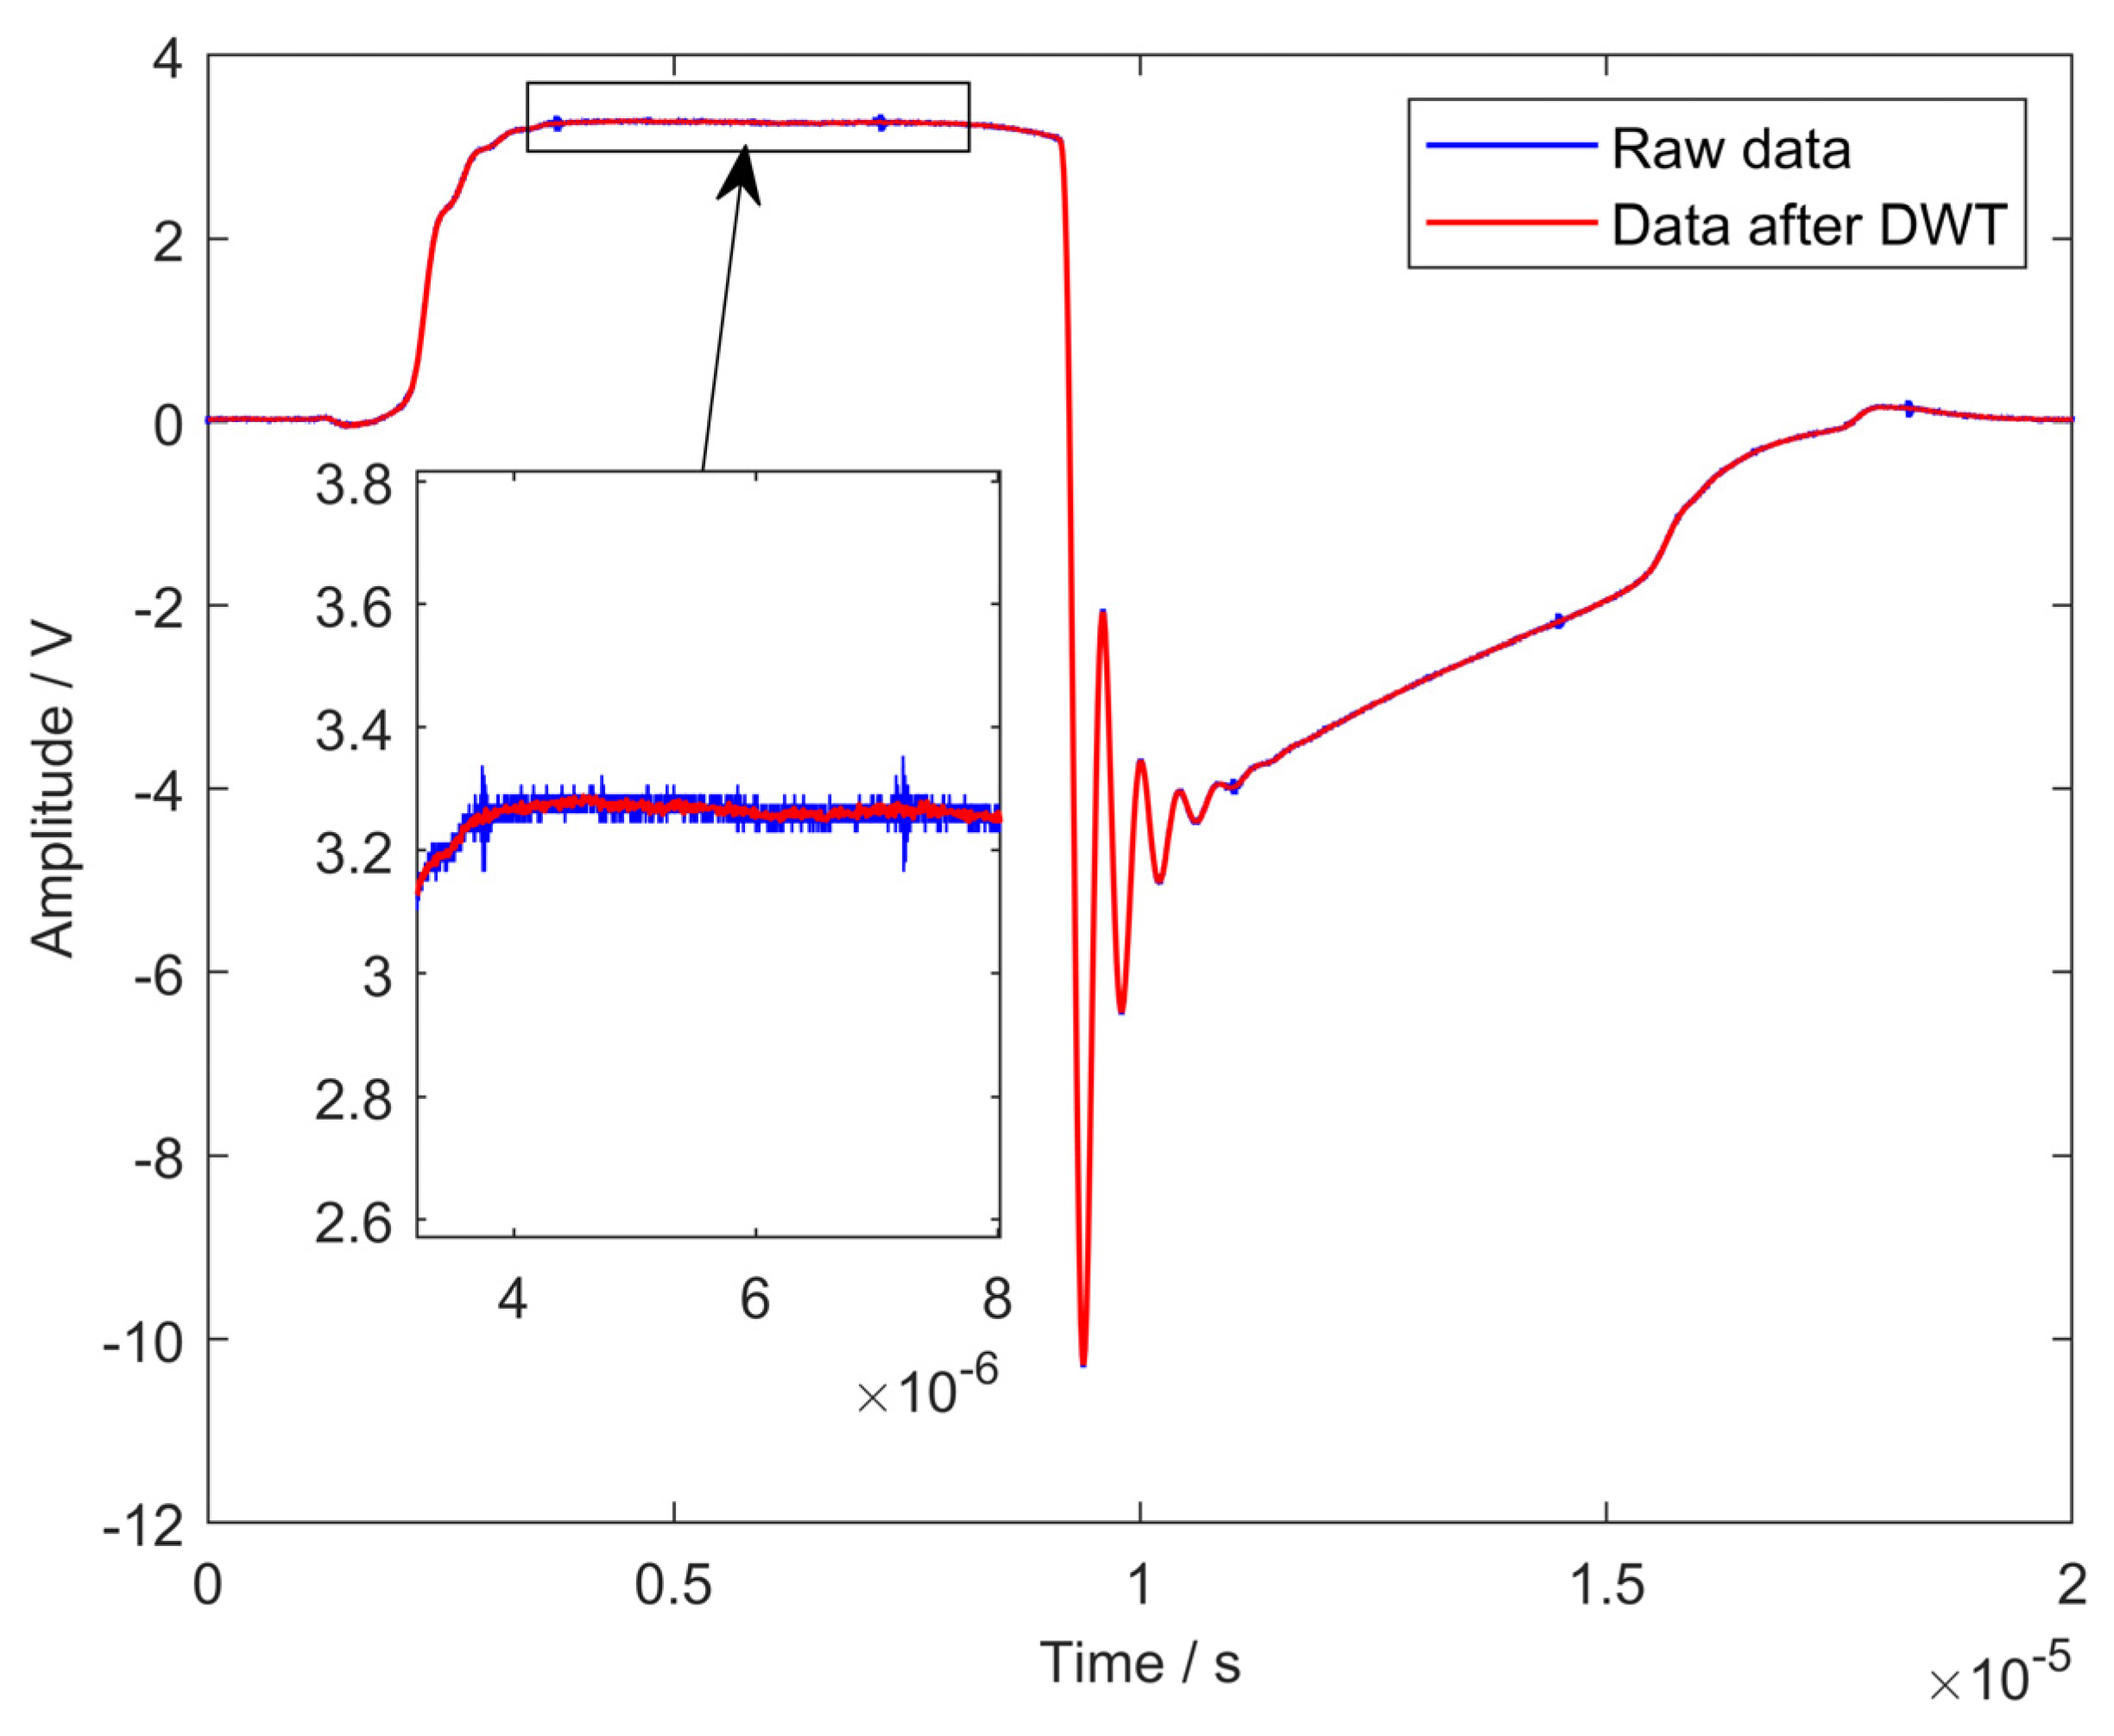
The dbN wavelet has a better regularity: that is, the smooth error introduced by this wavelet is not easily detected as a sparse basis, making the signal reconstruction process relatively smooth. The characteristic of the dbN wavelet is that the order of vanishing moment increases with the increase of order (sequence N). The higher the vanishing moment, the better the smoothness, the stronger the localization ability of frequency domain, and the better the division effect of the frequency band [34]. In this paper, the wavelet base adopted in the experiment is db4; the approximate coefficient in level six is used for signal reconstruction with better signal-to-noise ratio (SNR). All the parameters used in the following analysis are based on the approximate coefficient at level six in db4. A comparison chart of the raw signal measured in air and the signal after wavelet transformed is show in Figure 4. It can be seen that high frequency noise has been filtered; this will affect classification accuracy.
In this paper, the signals are evaluated in terms of peak frequency, peak time, zero crossing time, time of decay, main peak area and amplitude of attenuation, respectively. In selecting the characteristic parameters, 1000 independent measurements of the metal under test were performed in a random scan to obtain eddy current characteristic samples for the four standard metals (Cu, Fe, Al and St) and three standard metals of Fe (Fe-K162, Fe-K163 and Fe-K240) studied in this paper.
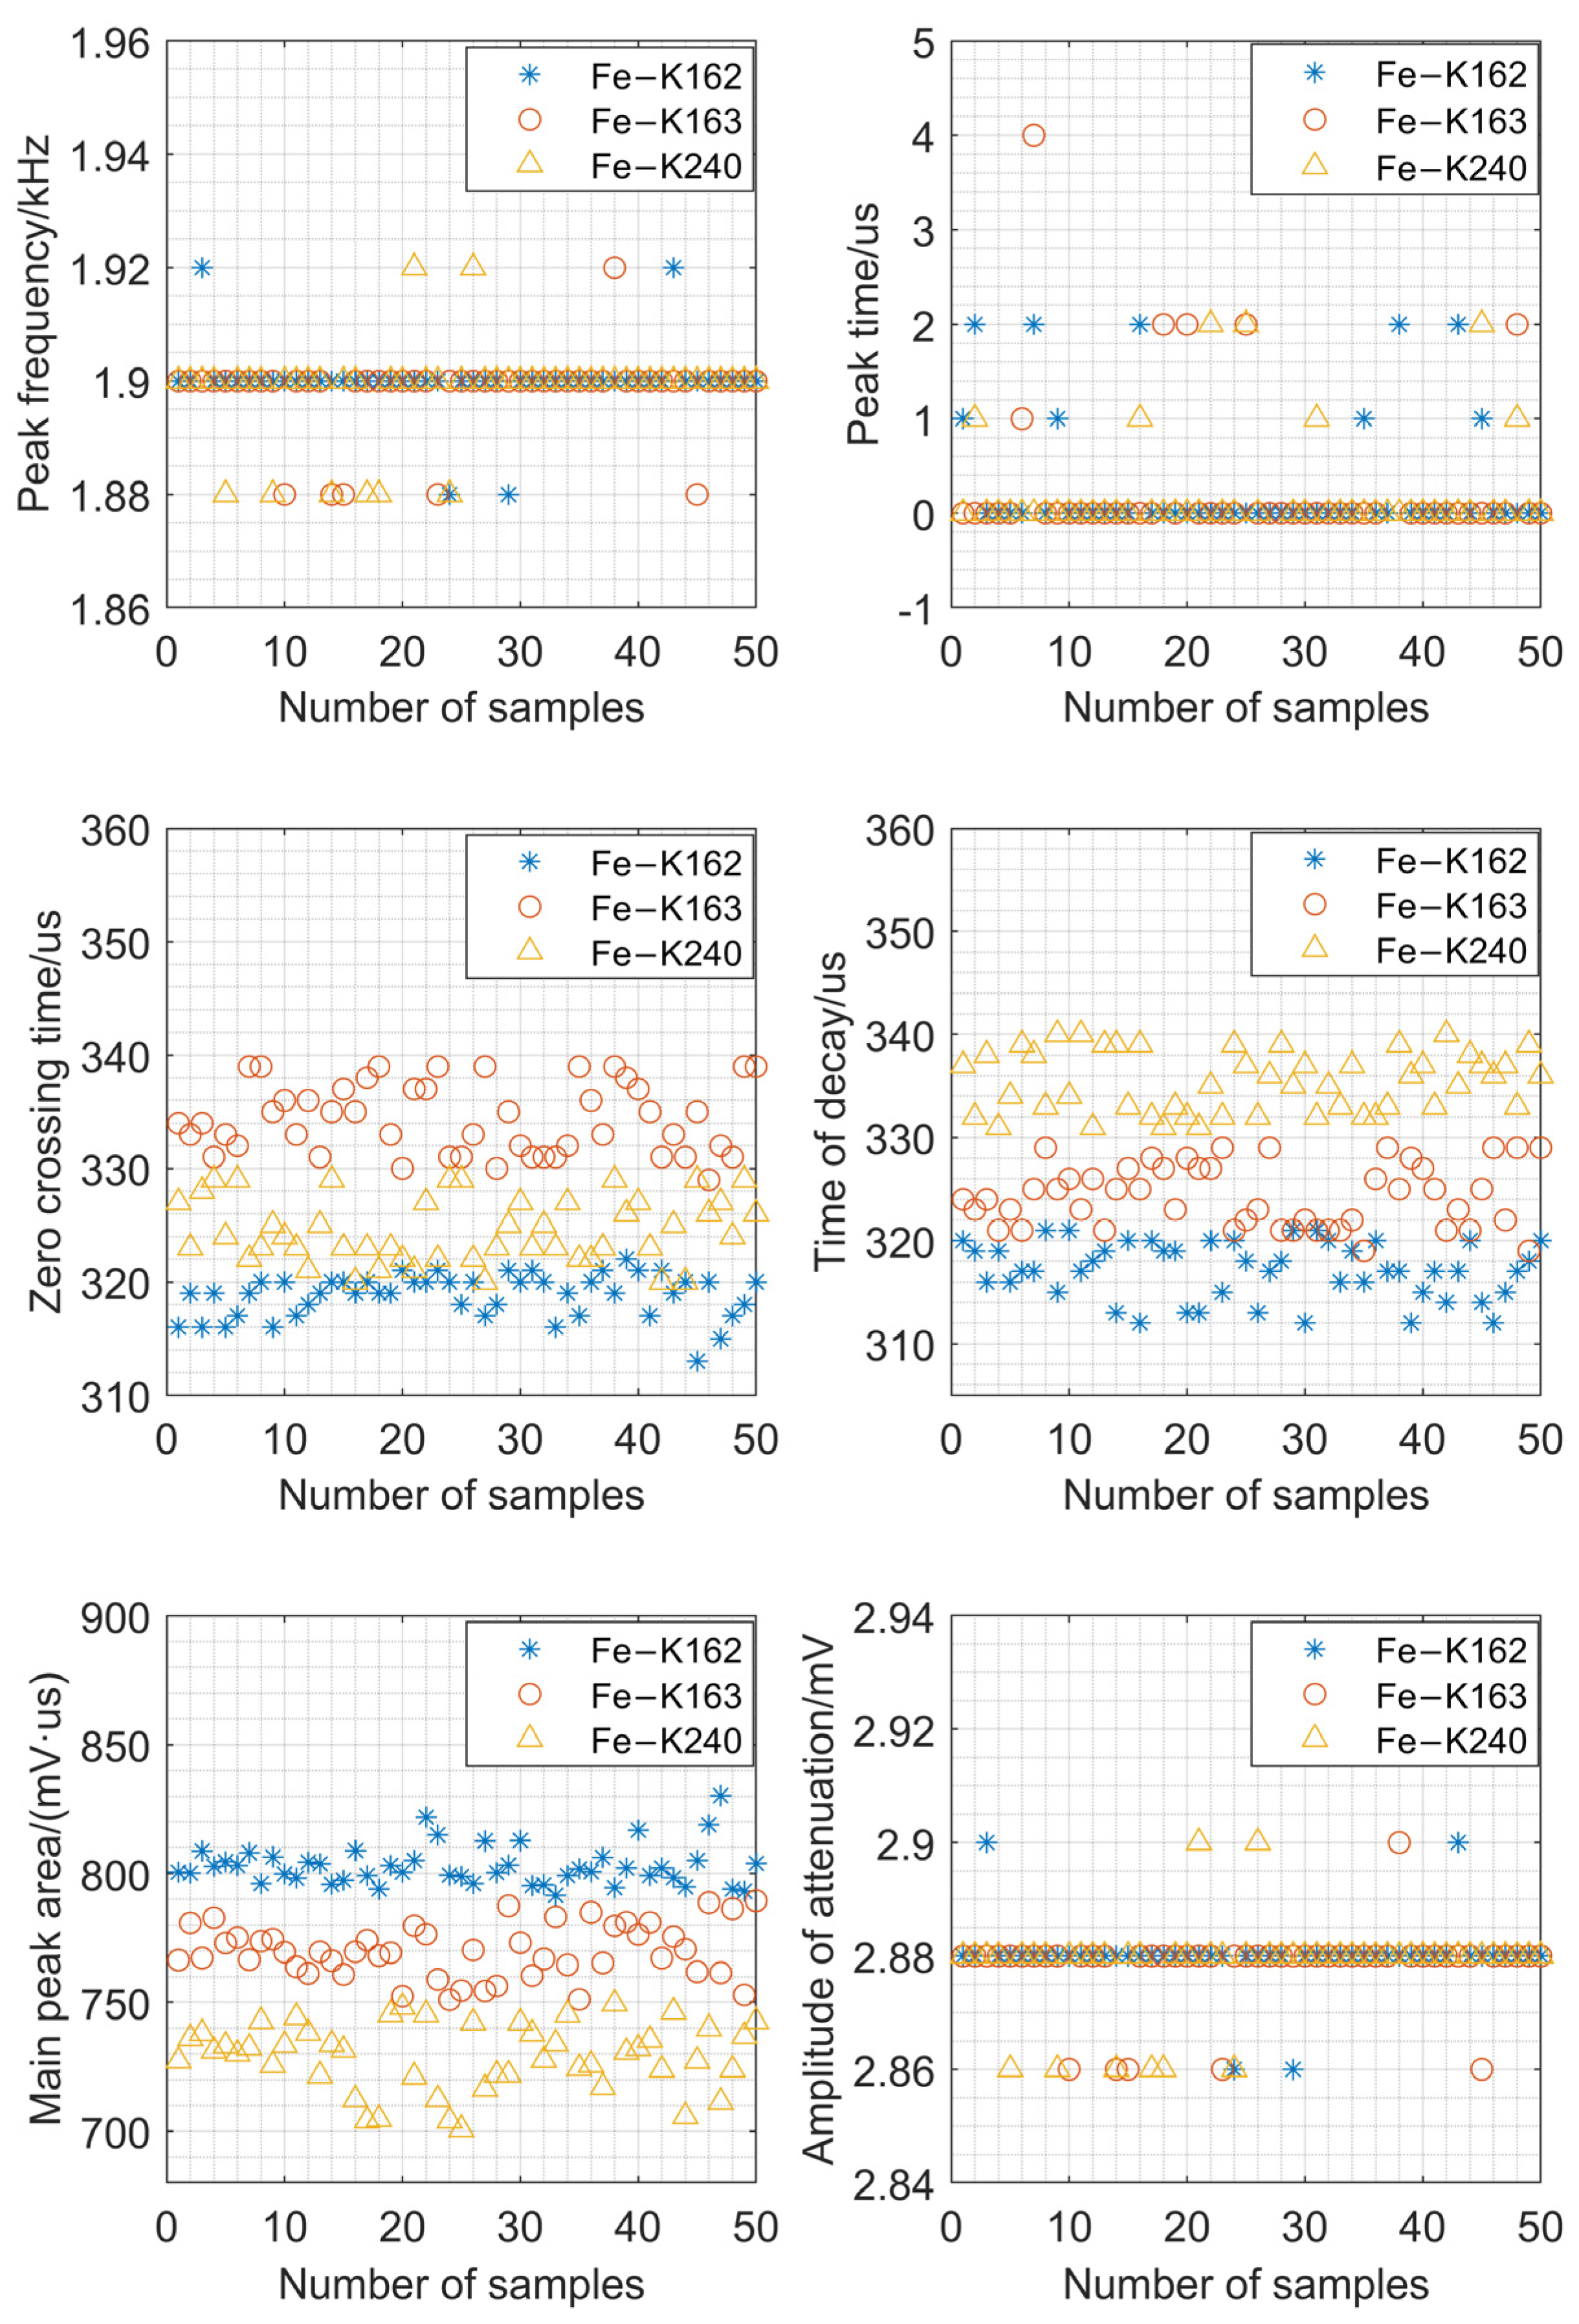
Six extracted parameters of Fe samples are shown in Figure 5. It can be seen that Fe-K162, Fe-K163 and Fe-K240 can be well classified with parameters of zero crossing time, time of decay and main peak area. However, Fe-K162, Fe-K163 and Fe-K240 have a light overlap in the feature of zero crossing time and time of decay. It is seen that, for each extracted feature, the tendency of the feature values varies with the material is different. This may be affected by the content of the elements in metallic alloys. From Table 1, it is seen that the iron element proportions of Fe-K162, Fe-K163 and Fe-K240 are 93.97%, 93.994% and 94.326%, respectively. The average values of the time of delay feature corresponding with iron element proportions are 318, 324 and 335, respectively; these have the same monotonicity compared to iron element proportions. The average values of the main peak area feature corresponding with iron element proportions are 803, 770 and 730, respectively; these have an opposite monotonicity compared to iron element proportions. It seems that the features of time of decay and main peak area are highly related with the iron element proportions and have high sensitivity to small content changes in ferroalloys.
Similar experiments have been applied to Cu, Fe, Al and St, as shown in Figure 6. It can be seen that the features of peak frequency and peak time are meaningless for metal recognition combined with the results of Figure 4. Different from Figure 4, the feature of amplitude of attenuation has contribution in Cu, Fe, Al and St identification. It should be noticed that Cu and Al are easily distinguished by the zero crossing time feature; Fe and St are also easily distinguished by the zero crossing time feature. However, the results in the time of decay feature are the opposite; the feature value is far less distinguishable than the feature of zero crossing time. However, the feature of main peak area is perfect for metal classification: there is no need to make a joint judgment with other features. That is because the four metals differ greatly in electrical and magnetic permeability.
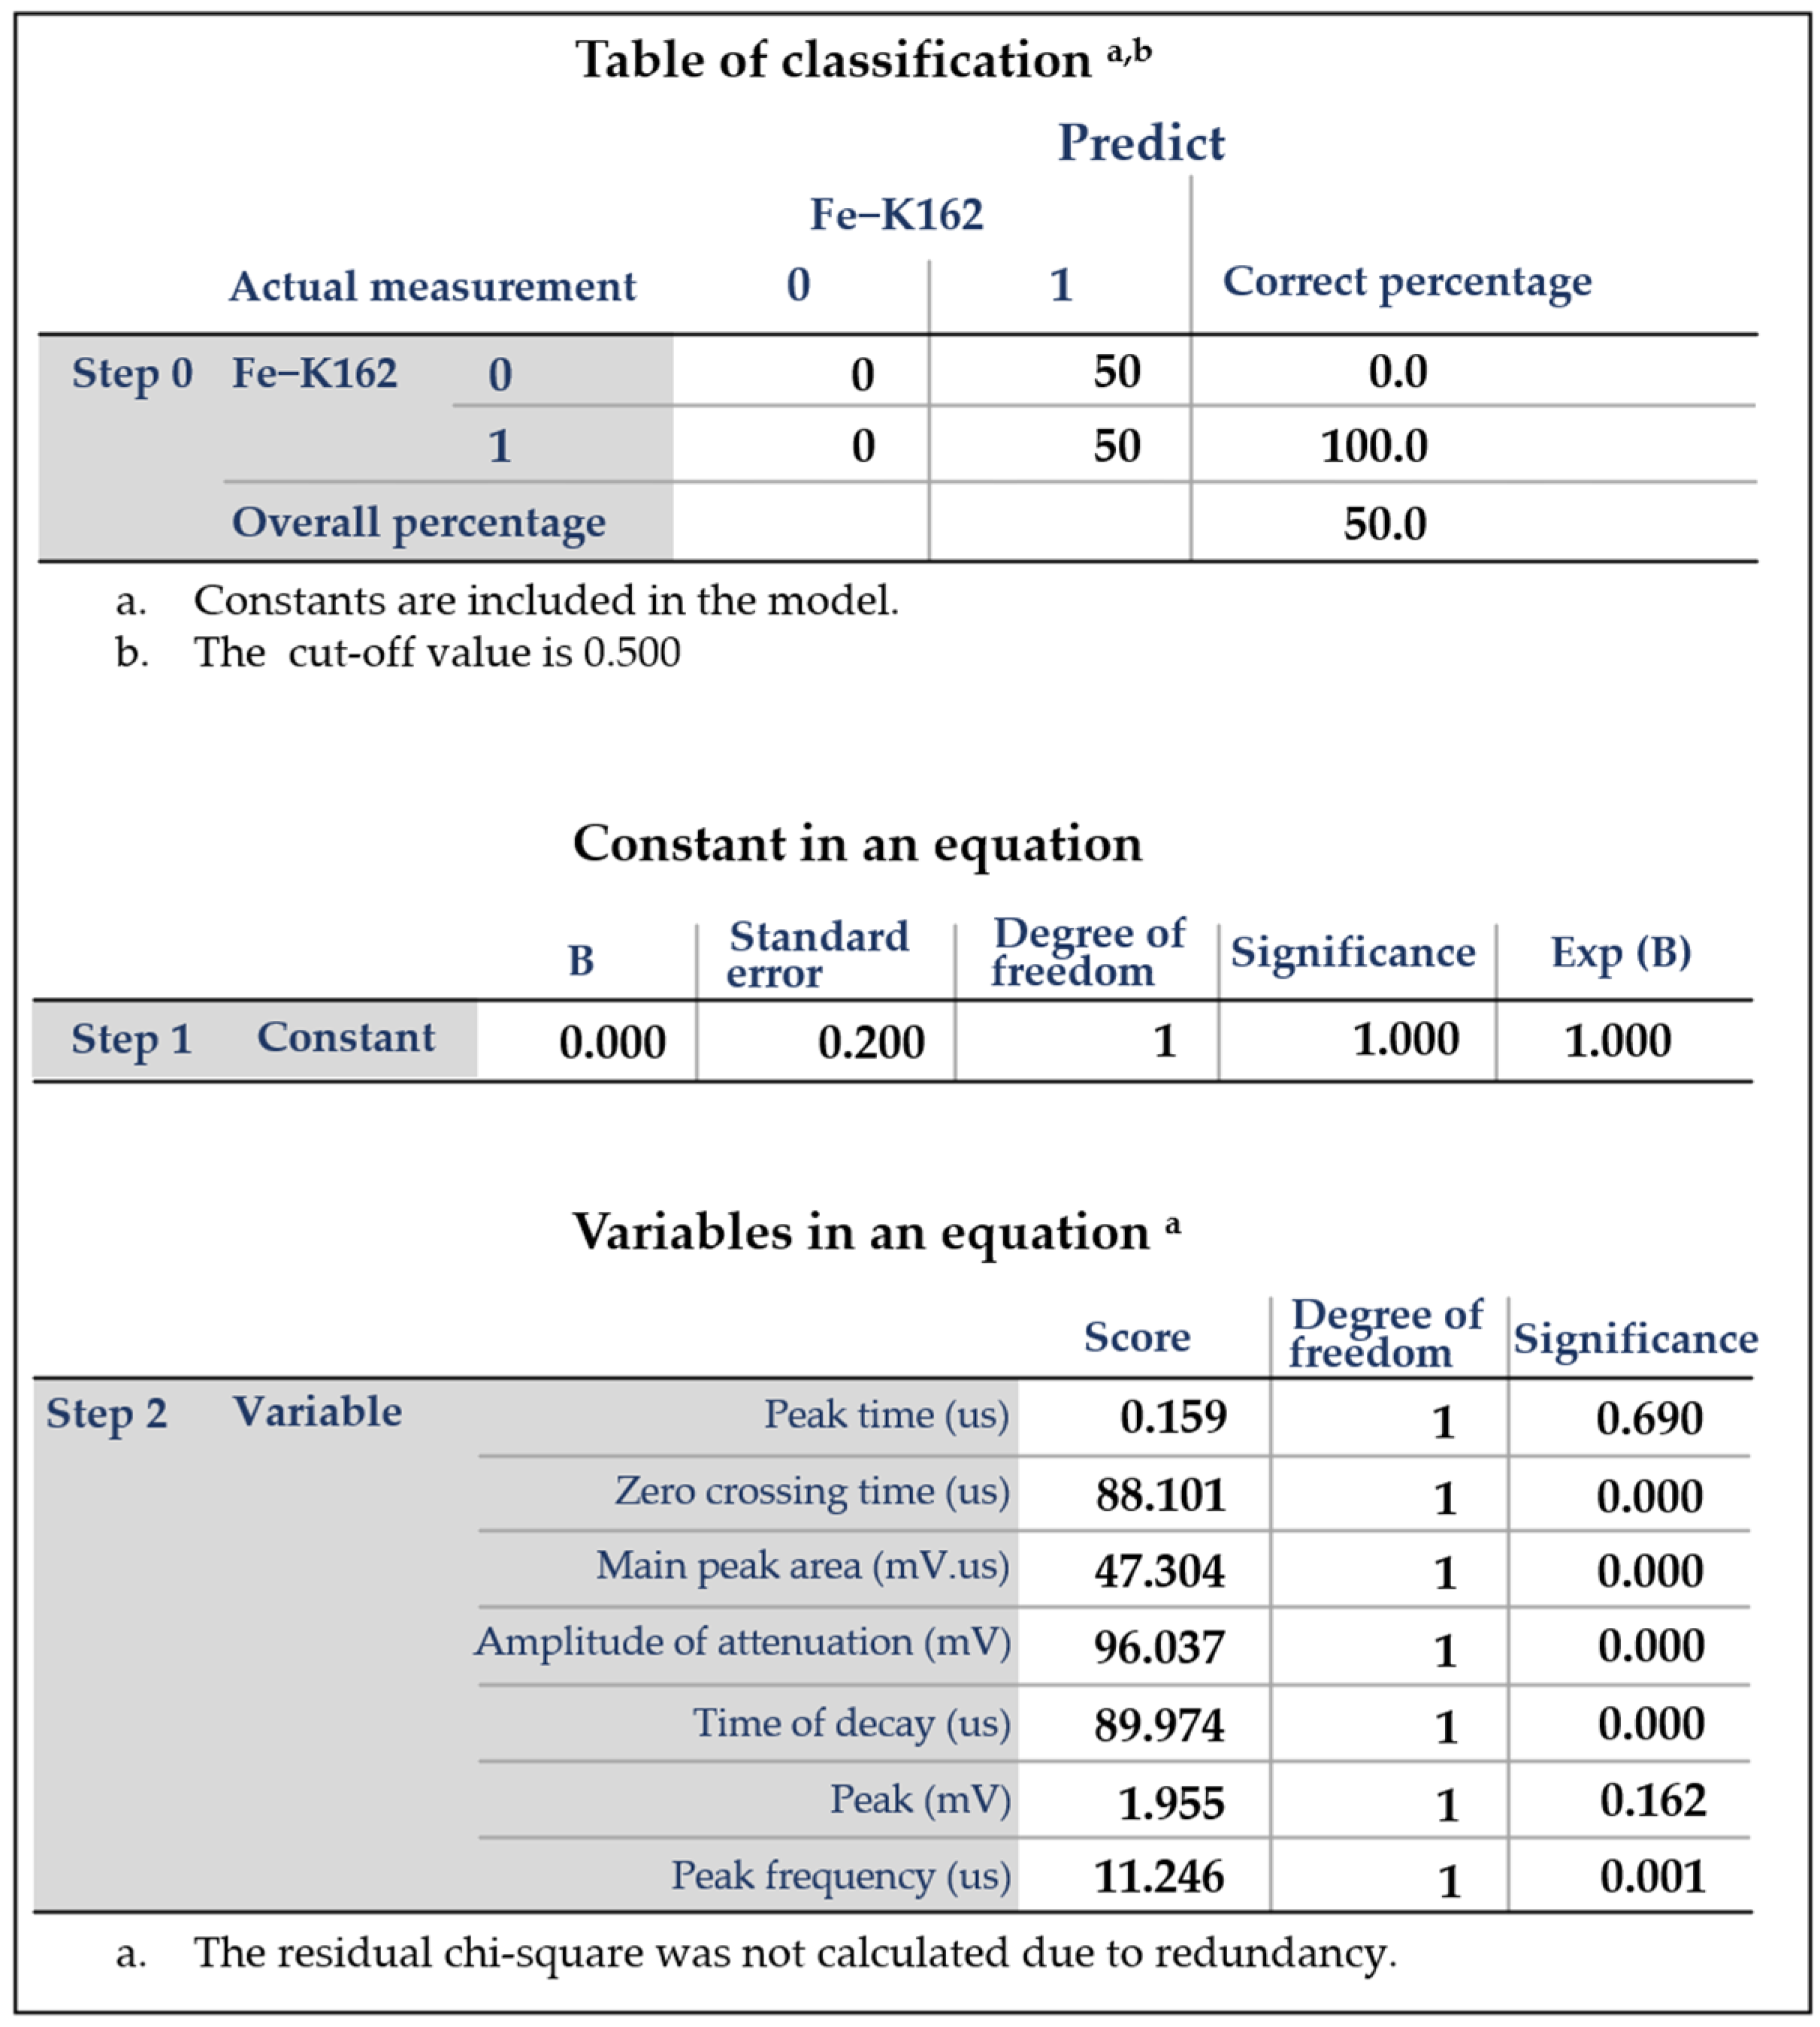
A fast logistic regression analysis was performed using 50 independent data samples to calculate feature correlations and significance to verify the accuracy of eddy current feature parameter selection. A binary regression analysis of eddy current signal feature correlation was established to validate the data samples using 50 groups of Fe-K162 gray cast iron metal samples against 50 groups of non-Fe-K162 metal samples, and the results of the regression analysis are shown in Figure 7.
The classification map and the Hosmer–Lemeshaw goodness of fit were performed according to the six features mentioned previously. The number of iterations was set to 20; the predicted value probability, group membership, influence factor and leverage values were turned on; and the residuals of the criteria are analyzed. Then, the Statistical Product Service Solutions (SPSS) correlation and significance of metal signal characteristics can be analyzed.
This paper adopts the binary logistic regression model of the IBM SPSS software and takes the characteristic data of Fe-K162 eddy current signal as an example to identify the correlation and significance of the characteristic parameters of the above samples.
According to the significance analysis setting, if the significant p value of variable X shows significance, it means that X has an influential relationship on Y. If it is not significant, the variable should be excluded. From the results of the grouped experimental data, it can be seen that there are four explanatory variables in the model with significance analysis p-values less than 0.001 for Fe-K162 recognition rate, indicating that all X factors have a significant influence relationship on Y.
The impact of the correlation of X–Y was compared based on the regression analysis scores. From the regression analysis scores, the four explanatory variables in the model, such as zero crossing time, main peak area, amplitude of attenuation and time of decay, had scores of 88.101, 47.304, 96.037 and 89.974, respectively, indicating that all variables showed significant positive influence relationships on the Fe-K162 recognition rate.
In summary, combining the feature screening results and correlation verification conclusions, it is determined that the main feature parameters such as main peak area, time of decay and zero crossing time are selected. The amplitude of attenuation is selected as an auxiliary feature parameter to establish a functional mapping relationship with the metal eddy current signal. Multiple groups of feature parameters can be combined for simultaneous discrimination, which can improve the metal identification accuracy and expand the identification range.
In order to analyze the effectiveness of the described method more intuitively, an evaluation index is proposed and its stability and accuracy are analyzed based on experiments. The evaluation index is defined as
E V A m e t a l = k = 1 j ( 1 m n = 1 m ( c k × P C A ( D W T ( S n , d b 4 ) , c h a r a c t e r k ) ) )
where characterk is the extracted parameter defined from peak frequency, peak time, zero crossing time, time of decay, main peak area and amplitude of attenuation; Sn is the signal amplitude in time domain; m is the number of times the experiment was repeated; and ck is a balanced value for each extracted parameter, which is positively correlated with the score in Figure 7.
The model and calculation equation are tested by 1000 independent sampling, from which 100 random samples are used in the accuracy verification. The results are shown in Table 3. It is clear that the eight chosen kinds of metal are all well categorized. The EVA value for each metal is extremely stable, except the first value for air condition. It can be seen that the EVA values of Fe-K162, Fe-K163, Fe-K240 and Fe are very close, which means that iron-based metal materials are more difficult to classify. When using the EVA value in air as the standard, it can be seen that the EVA values of metals with magnetism are bigger than the EVA value of air. The EVA values of metals without magnetism are smaller than the EVA value of air.
The sensor, model and calculation equations were tested by 1000 independent samples, among which 100 random samples were selected to verify the identification rate, stability and accuracy. The results are shown in Table 4. It can be seen that the identification rates for all the metals are 100%. The stability of the sensor for all metals classification are greater than 97.10%. The metal material with the least stability during measurement is Fe, and the metal material with the greatest stability during measurement is Fe-K240. The confidence interval has a mean value of ± 0.33‰. According to the statistics without anomalies, the relative error of the EVA value is less than 0.32%. The minimum relative error is only 0.03%.
Based on the experimental data validation results, when the excitation parameters are fixed, four kinds of standard metal materials and three kinds of gray cast iron materials of the same type are measured, respectively, and the evaluation indexes of metal eddy current characteristics are calculated. The results can be distinguished one by one. Through 1000 repeated experiments, the recognition rate of the sensor reaches 100%, the stability of the calculation model is more than 97.1%, the comprehensive accuracy error is less than 0.32%, and the average measurement speed is about 50 ms.

4. Conclusions

To deal with the issue of metal alloys classification with similar components, a discrete wavelet transform-based metal material analysis model by CPA-PEC method is proposed in this paper, and performances are verified by a series of experiments.
The CPA-PEC sensor is excited by a constant phase angle pulse eddy current, and the eddy current signal is analyzed by the discrete wavelet transform. Compared with conventional sine wave excitation, constant phase angle pulse eddy current has a wider spectrum, which may have benefit for spectrum measurement of different metals. Therefore, the proposed method has fast discrimination capability for various metal materials and has good discrimination capability for comprehensive evaluation and quantitative analysis of the subtle differences in metal composition through the discrete signal feature analysis model.
Experimental investigations show that the CPA-PEC sensor with metal eddy current feature library and metal material feature identification algorithm can effectively improve the capability of eddy current sensor to identify metal material consistency in application environments such as qualitative determination of special metal material components and dynamic monitoring of metal consistency. The proposed evaluation index can accurately discriminate metals. The identification rates are 100% for all the metals, the stability is greater than 97.10% for all metals, and the relative errors are less than 0.32% for all metals.
Compared with other metal identification techniques, such as spectral analysis, the CPA-PEC technique can quickly determine the metal material characteristic index by a simple detection device and achieve higher accuracy and a wider range of metal identification by continuously expanding the eddy current characteristic library. This has higher practicality and a wide application value in the application scenario of rapid nondestructive testing of metal material composition. However, an obvious limitation exists: the CPA-PEC technique is more suitable for qualitative analysis of alloy components, such as measurement of the change in the content of a component in the production of an alloy. In the future, the influence of different components on the electromagnetic properties of the alloy should be fully analyzed, more data should be expanded to the metal eddy current feature library by collecting the experimental signals from more types of the samples, and the performance of the proposed metal material feature identification algorithm should be verified by the different metal categories.

Author Contributions

Conceptualization, Y.Y.; Formal analysis, Y.X.; Investigation, L.L.; Methodology, Y.X. and Y.Y.; Software, L.L.; Validation, Y.X. and L.L.; Writing—original draft, Y.X. and L.L.; Writing—review & editing, Y.Y. All authors have read and agreed to the published version of the manuscript.

Funding

This work was supported by the National Nature Science Foundation of China [grant numbers 52275522 and 61960206010], the Sichuan Science and Technology Program [grant number 2022NSFSC032], and the Open Fund of Key Laboratory of Traction Power [grant number TPL2206].

Institutional Review Board Statement

Not applicable.

Informed Consent Statement

Not applicable.

Data Availability Statement

No new data were created or analyzed in this study. Data sharing is not applicable to this article.

Conflicts of Interest

The authors declare no conflict of interest.

References

  1. Ďuriš, S.; Ďurišová, Z.; Wimmer, G.; Dovica, M. Stability Check of Certified Reference Materials of Carbon and Sulphur Content in Steel Used for Analysis of Low-Alloyed Steels. In Proceedings of the 2019 12th International Conference on Measurement, Smolenice, Slovakia, 27–29 May 2019; pp. 331–334. [Google Scholar] [CrossRef]
  2. Liu, L.; Huan, H.; Zhang, M.; Shao, X.; Zhao, B.; Cui, X.; Zhu, L. Photoacoustic Spectrometric Evaluation of Soil Heavy Metal Contaminants. IEEE Photonics J. 2019, 11, 1–7. [Google Scholar] [CrossRef]
  3. Ye, C.; Laureti, S.; Malekmohammadi, H.; Wang, Y.; Ricci, M. Swept-Frequency eddy current excitation for TMR array sensor and Pulse-Compression: Feasibility study and quantitative comparison of time and frequency domains processing. Measurement 2022, 187, 110249. [Google Scholar] [CrossRef]
  4. Wang, Y.; Niu, Y.; Wei, Y.; Ye, C. Multi-frequency imaging with non-linear calibration of magnetoresistance sensors for surface and buried defects inspection. NDT E Int. 2022, 132, 102706. [Google Scholar] [CrossRef]
  5. Avila, J.R.S.; How, K.Y.; Lu, M.; Yin, W. A Novel Dual Modality Sensor With Sensitivities to Permittivity, Conductivity, and Permeability. IEEE Sens. J. 2018, 18, 356–362. [Google Scholar] [CrossRef] [Green Version]
  6. Yuan, F.; Yu, Y.; Wang, W.; Xue, K.; Tian, G. Pulsed eddy current array design and electromagnetic imaging for defects detection in metallic materials. Nondestruct. Test. Eval. 2021, 37, 81–99. [Google Scholar] [CrossRef]
  7. Yuan, F.; Yu, Y.; Wang, W.; Tian, G. A Novel Probe of DC Electromagnetic NDT Based on Drag Effect: Design and Application in Crack Characterization of High-Speed Moving Ferromagnetic Material. IEEE Trans. Instrum. Meas. 2021, 70, 1. [Google Scholar] [CrossRef]
  8. Yuan, F.; Yu, Y.; Li, L.; Tian, G. Investigation of DC Electromagnetic-Based Motion Induced Eddy Current on NDT for Crack Detection. IEEE Sens. J. 2021, 21, 1. [Google Scholar] [CrossRef]
  9. Wang, D.; Zhang, Z.; Yin, W.; Chen, H.; Ma, H.; Zhou, G.; Zhang, Y. Linear Characteristics of the Differences in Phase Tangents of Triple-Coil Electromagnetic Sensors and Their Application in Nonmagnetic Metal Classification. Sensors 2022, 22, 7511. [Google Scholar] [CrossRef]
  10. Yu, Y.; Li, X.; Simm, A.; Tian, G. Theoretical model-based quantitative optimisation of numerical modelling for eddy current NDT. Nondestruct. Test. Eval. 2011, 26, 129–140. [Google Scholar] [CrossRef]
  11. Yu, Y.; Li, Y.; Qin, H.; Cheng, X. Microwave measurement and imaging for multiple corrosion cracks in planar metals. Mater. Des. 2020, 196, 109151. [Google Scholar] [CrossRef]
  12. Yu, Y.; Gao, K.; Theodoulidis, T.; Yuan, F. Analytical solution for magnetic field of cylindrical defect in eddy current nondestructive testing. Phys. Scr. 2020, 95, 015501. [Google Scholar] [CrossRef]
  13. Yu, Y.; Gao, K.; Liu, B.; Li, L. Semi-analytical method for characterization slit defects in conducting metal by Eddy current nondestructive technique. Sens. Actuators Phys. 2020, 301, 111739. [Google Scholar] [CrossRef]
  14. Chen, X.; Liu, X. Pulsed Eddy Current-Based Method for Electromagnetic Parameters of Ferromagnetic Materials. IEEE Sens. J. 2021, 21, 6376–6383. [Google Scholar] [CrossRef]
  15. XChen, X.; Lei, Y. Electrical conductivity measurement of ferromagnetic metallic materials using pulsed eddy current method. NDT E Int. 2015, 75, 33–38. [Google Scholar] [CrossRef]
  16. Wang, C.; Fan, M.; Cao, B.; Ye, B.; Li, W. Novel Noncontact Eddy Current Measurement of Electrical Conductivity. IEEE Sens. J. 2018, 18, 9352–9359. [Google Scholar] [CrossRef]
  17. Lu, M.; Xie, Y.; Zhu, W.; Peyton, A.J.; Yin, W. Determination of the Magnetic Permeability, Electrical Conductivity, and Thickness of Ferrite Metallic Plates Using a Multifrequency Electromagnetic Sensing System. IEEE Trans. Ind. Inform. 2019, 15, 4111–4119. [Google Scholar] [CrossRef] [Green Version]
  18. Sreevatsan, S.; George, B. Simultaneous Detection of Defect and Lift-off Using a Modified Pulsed Eddy Current Probe. IEEE Sens. J. 2020, 20, 2156–2163. [Google Scholar] [CrossRef]
  19. Meng, X.; Lu, M.; Yin, W.; Bennecer, A.; Kirk, K.J. Inversion of Lift-Off Distance and Thickness for Nonmagnetic Metal Using Eddy Current Testing. IEEE Trans. Instrum. Meas. 2021, 70, 1–8. [Google Scholar] [CrossRef]
  20. Long, Y.; Huang, S.; Peng, L.; Wang, S.; Zhao, W. A New Dual Magnetic Sensor Probe for Lift-off Compensation in Magnetic Flux Leakage Detection. In Proceedings of the 2020 IEEE International Instrumentation and Measurement Technology Conference (I2MTC), Dubrovnik, Croatia, 25–28 May 2020; pp. 1–6. [Google Scholar] [CrossRef]
  21. Jin, Z.; Meng, Y.; Yu, R.; Huang, R.; Lu, M.; Xu, H.; Meng, X.; Zhao, Q.; Zhang, Z.; Peyton, A.; et al. Methods of Controlling Lift-Off in Conductivity Invariance Phenomenon for Eddy Current Testing. IEEE Access 2020, 8, 122413–122421. [Google Scholar] [CrossRef]
  22. Rep, I.; Spikic, D.; Vasic, D. Eddy Current Inversion of Lift-off, Conductivity and Permeability Relaxation. In Proceedings of the 2021 44th International Convention on Information, Communication and Electronic Technology (MIPRO), Opatija, Croatia, 27 September–1 October 2021; pp. 136–140. [Google Scholar] [CrossRef]
  23. Lu, M.; Meng, X.; Huang, R.; Chen, L.; Peyton, A.; Yin, W. Measuring Lift-Off Distance and Electromagnetic Property of Metal Using Dual-Frequency Linearity Feature. IEEE Trans. Instrum. Meas. 2021, 70, 1–9. [Google Scholar] [CrossRef]
  24. Wang, Y.; Nie, Y.; Qi, P.; Zhang, N.; Ye, C. Inspection of Defect Under Thick Insulation Based on Magnetic Imaging With TMR Array Sensors. IEEE Trans. Magn. 2022, 58, 1–10. [Google Scholar] [CrossRef]
  25. Bolós, V.J.; Benítez, R.; Ferrer, R. A New Wavelet Tool to Quantify Non-Periodicity of Non-Stationary Economic Time Series. Mathematics 2020, 8, 844. [Google Scholar] [CrossRef]
  26. Łępicka, M.; Górski, G.; Grądzka-Dahlke, M.; Litak, G.; Ambrożkiewicz, B. Analysis of tribological behaviour of titanium nitride-coated stainless steel with the use of wavelet-based methods. Arch. Appl. Mech. 2021, 91, 4475–4483. [Google Scholar] [CrossRef]
  27. Silipigni, G.; Burrascano, P.; Hutchins, D.A.; Laureti, S.; Petrucci, R.; Senni, L.; Torre, L.; Ricci, M. Optimization of the pulse-compression technique applied to the infrared thermography nondestructive evaluation. NDT E Int. 2017, 87, 100–110. [Google Scholar] [CrossRef]
  28. Tamhane, D.; Patil, J.; Banerjee, S.; Tallur, S. Feature Engineering of Time-Domain Signals Based on Principal Component Analysis for Rebar Corrosion Assessment Using Pulse Eddy Current. IEEE Sens. J. 2021, 21, 22086–22093. [Google Scholar] [CrossRef]
  29. Liu, X.; Shi, G.; Liu, W. An Improved Empirical Mode Decomposition Method for Vibration Signal. Wirel. Commun. Mob. Comput. 2021, 2021, 5525270. [Google Scholar] [CrossRef]
  30. Wang, S.; Xiao, S.; Huang, Z.; Xu, Z.; Chen, W. Improved One-Dimensional Convolutional Neural Networks for Human Motion Recognition. In Proceedings of the 2020 IEEE International Conference on Bioinformatics and Biomedicine (BIBM), Seoul, Korea, 16–19 December 2020; pp. 2544–2547. [Google Scholar] [CrossRef]
  31. Huang, W.; Oh, S.-K.; Pedrycz, W. Hybrid Fuzzy Wavelet Neural Networks Architecture Based on Polynomial Neural Networks and Fuzzy Set/Relation Inference-Based Wavelet Neurons. IEEE Trans. Neural Netw. Learn. Syst. 2018, 29, 3452–3462. [Google Scholar] [CrossRef]
  32. Subbotin, A.N.; Zhukova, N.A.; Anaam, F. Application of Recurrent Neural Networks with Controlled Elements for Accuracy Enhancement in Recognition of Sound Events in a Fog Computing Environment. In Proceedings of the 2022 III International Conference on Neural Networks and Neurotechnologies (NeuroNT), Saint Petersburg, Russian Federation, 16 June 2022; pp. 47–50. [Google Scholar] [CrossRef]
  33. Yu, Y.; Cheng, X.; Wang, L.; Wang, C. Convolutional Neural Network-Based Quantitative Evaluation for Corrosion Cracks in Oil/Gas Pipeline by Millimeter-Wave Imaging. IEEE Trans. Instrum. Meas. 2022, 71, 1–9. [Google Scholar] [CrossRef]
  34. Shah, M.; Vakharia, V.; Chaudhari, R.; Vora, J.; Pimenov, D.Y.; Giasin, K. Tool wear prediction in face milling of stainless steel using singular generative adversarial network and LSTM deep learning models. Int. J. Adv. Manuf. Technol. 2022, 121, 723–736. [Google Scholar] [CrossRef]
Figure 1. The structure of CPA-PEC sensor.
Applsci 13 03207 g001
Figure 2. Photograph of the experimental setup.
Applsci 13 03207 g002
Figure 3. Identification method and steps of the eddy current method metal material analysis model.
Applsci 13 03207 g003
Figure 4. Comparison of the signals before and after wavelet transformed.
Applsci 13 03207 g004
Figure 5. Signal characteristic distribution of Fe-K162, Fe-K163 and Fe-K240.
Applsci 13 03207 g005
Figure 6. Signal characteristic distribution of air, Cu, Fe, Al and St.
Applsci 13 03207 g006
Figure 7. IBM Statistical Product Service Solutions Software statistics binary logistic regression analysis results.
Applsci 13 03207 g007
Table 1. The constant parameters used in this paper.
Constant ParameterValue
k1 (A/us)~0.09
μ0 (N/A2)4π × 10−7
N136
N2360
e~2.718
Table 2. Proportion of the elements in metallic alloys.
Fe-K162Fe-K163Fe-K240
Fe93.97%93.994%94.326%
C3.21%3.30%3.81%
Si1.28%1.25%1.23%
Mn1.05%1.16%0.319%
P0.075%0.065%0.044%
S0.045%0.055%0.026%
Cr0.24%0.1%0.037%
Ni0.09%0.036%0.009%
Mo0.001%0.002%0.026%
V0.012%0.011%0.017%
Cu0.014%0.012%0.142%
Ti0.013%0.015%0.014%
Table 3. The quantization index of the model was verified repeatedly with 100 random samples per group.
Repeat 1Repeat 2Repeat 3Repeat 4Repeat 5
K16229662966296529652966
K16329562956295529562955
K24029462946294529452946
Fe29512951295129512951
Air30803090309030903090
Cu32103210321132113210
Al32213221322132253221
St31253125312531263125
Table 4. The identification rate of the sensor, the stability of the calculation model and the accuracy of the evaluation index.
Identification Rate *Stability *Relative Error *
K162100%98.80%0.03%
K163100%98.90%0.03%
K240100%99.12%0.03%
Fe100%97.10%0.31%
Air100%97.45%0.32%
Cu100%98.11%0.03%
Al100%98.10%0.12%
St100%97.45%0.03%
* Identification rate = (identified samples/total samples) × 100%. * Stability is the samples that were within the confidence interval. * Relative error = (| EVA metal − mean( EVA metal )|/max( EVA metal )) × 100%.
Disclaimer/Publisher’s Note: The statements, opinions and data contained in all publications are solely those of the individual author(s) and contributor(s) and not of MDPI and/or the editor(s). MDPI and/or the editor(s) disclaim responsibility for any injury to people or property resulting from any ideas, methods, instructions or products referred to in the content.