1. Introduction
Existing masonry arch bridges are of great importance for road and rail networks and are also invaluable as they are part of architectural and cultural heritage. These ancient structures were designed many years ago according to semi-empirical rules based on a few simplified mechanical principles; however, their structural performance is exceptional in most cases [
1]. However, at present, the safety and utilization of these existing bridges are in danger due to several factors. The performance deficit may be due to progressive damage from external actions, natural deterioration including material decay, structural inadequacy, events such as earthquakes, but also increased loads and vehicle speeds to which bridges originally designed for wagon passage are subjected. Therefore, a realistic and rigorous seismic structural assessment of masonry arch bridges is essential to preserve their functionality and cultural, economic, and strategic importance and vulnerability. It is necessary to carry out a seismic vulnerability analysis of these structures in order to upgrade them to the safety standard required by current codes if necessary. The relevance and effects of this problem are better highlighted if we consider the number of existing masonry arch bridges in the national and international territory that are used by the railway network. In Italy alone, there are about 56,000 of them, differentiated by arch type, number, and span length. Currently, there is a large body of literature analyzing the collapse of masonry arch bridges and masonry arches in general [
2,
3,
4], reporting different structural models built according to different levels of accuracy and simplifications. In fact, the difficulty of representing the behavior of the resisting material and skeleton sometimes requires the use of a simplified but effective structural model suitable for the specific case. The methodologies developed can be based on limit analysis, nonlinear incremental techniques for two-dimensional arches, and Finite Element Models (FEMs) for three-dimensional arches, which allow both a complete description of the bridge geometry and detailed constitutive models.
This paper falls within the field of engineering applications aimed at infrastructure engineering and proposes a methodology of analysis for seismic vulnerability assessment and suggests a valid and effective solution for the structural rehabilitation of an Italian masonry arch railway bridge. A structural analysis of the arch bridge under static and seismic actions in the current and future strengthened state was carried out on a three-dimensional FEM generated using Midas FEA NX software [
5]. The detailed FE model is essential for conducting the nonlinear nonadaptive static analysis (pushover), which also takes into account uncertainties in the material properties and seismic input of the masonry arch bridge [
6,
7]. Pushover analyses are common and widely used to evaluate global structure response and nonlinear collapse mechanisms because they are less complex than nonlinear dynamic analysis [
8]. In fact, the latter is considerably computationally expensive and requires careful selection of seismic input data, since the results are strictly influenced by their choice.
Therefore, this study shows a useful methodology of analysis for the seismic performance evaluation of an existing masonry arch bridge and proposes a viable structural rehabilitation solution by using traditional materials and techniques.
2. Materials and Methods
2.1. Bridge Location and Historical Background
The masonry arch bridge situated on the Altamura-Avigliano Lucania-Potenza railway line, managed by Ferrovie Appulo Lucane, is located at 84 + 703 km. It is in Potenza (PZ) and it crosses the Tiera stream, a tributary of the Basento river.
It has proved impossible to correctly trace the construction history of this work due to inadequate, vague, and contradictory information. However, it is certain that the history of the Appulo Lucane railway began in 1915, initially called Mediterranea Calabro Lucane. The Acerenza–Avigliano Lucania line (
Figure 1a), where the bridge is located, was opened on 26 May 1930. Over the years, concrete plasterwork on the intrados of the vault and on the archivolt was made (
Figure 1b). There are no reports concerning this work that can explain the reason for this added plasterwork and the exact period of its realization.
2.2. Geometrical Data and Materials
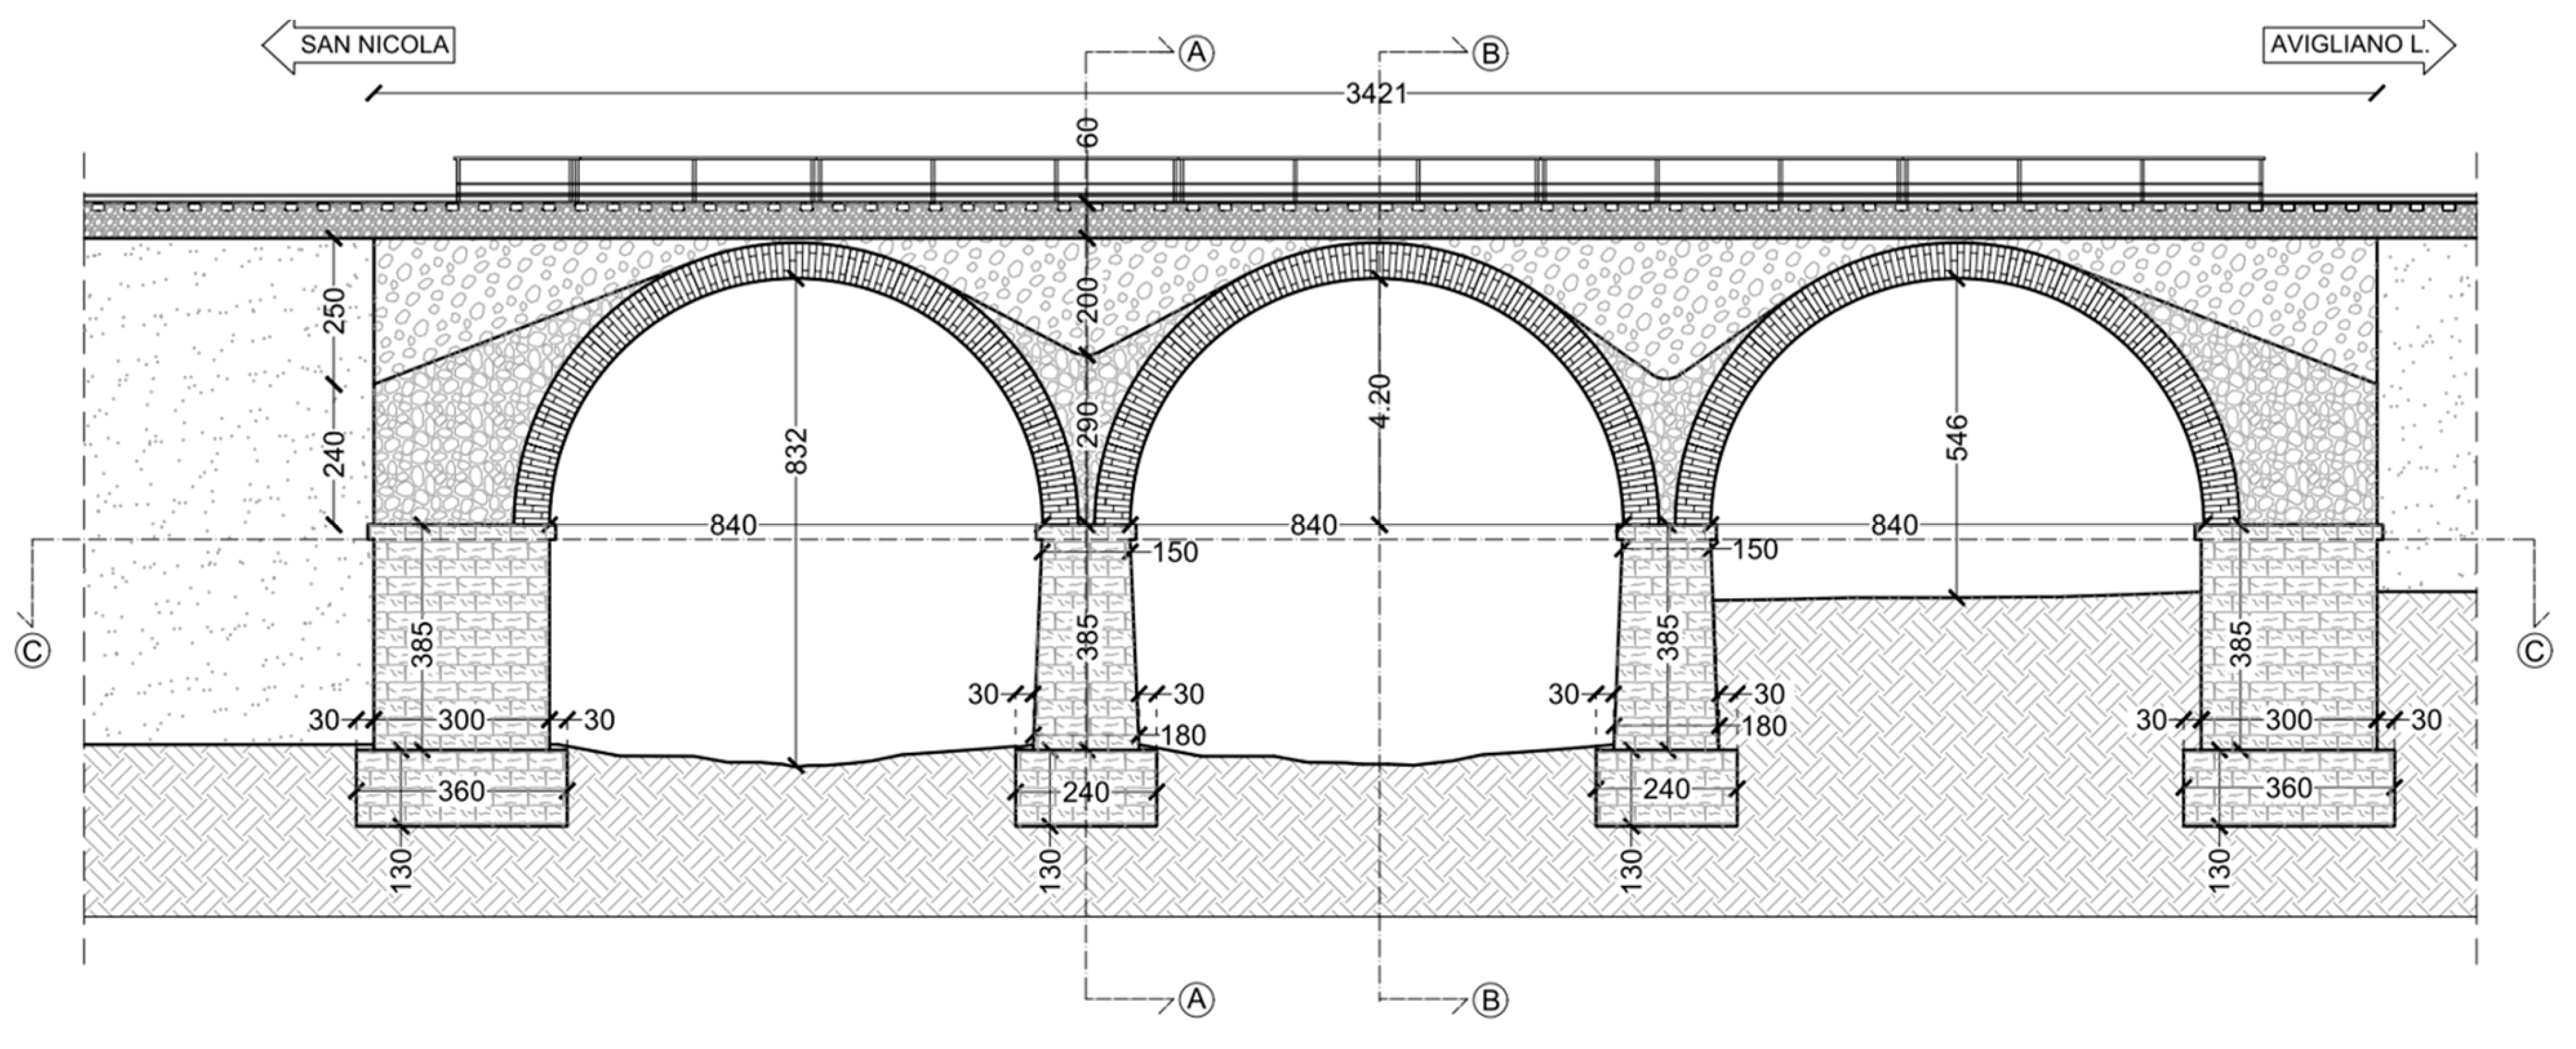
A complete new geometric survey was carried out, allowing defining the entire geometry of the bridge and the type of materials used to produce parts and components. The bridge (
Figure 2a) is overall 30.25 m long and it extends on three round arched spans, each span being 8.40 m with a rise of 4.20 m. In the transversal direction, the spans have a deck of 4.60 m. The arches are 0.60 m thick and are made of solid brick masonry and lime mortar (
Figure 2b). The piers measure 3.85 m from the foundation to the springing. In the longitudinal direction, they are 1.80 m thick corresponding to the ground level and 1.50 m corresponding to the springing section. In the transversal direction, they have a constant length of 4.00 m. Moreover, they are equipped with semi-circular upstream and downstream rostrum of 0.75 m radius. Both rostrum and piers are made of squared stone blocks. The abutments have the same height as the piers; they are 3.00 m in the longitudinal direction and 4.00 m in the transversal direction. The abutments of the bridge, like the piers, are made of squared stone blocks. The spandrels have a minimum height of 0.40 m at the keystone and a maximum height of 5.20 m at the piers and abutments.
The thickness is constant and it is 1.00 m. The spandrels are made of masonry with square stone blocks (
Figure 2b). The abutments and backfill consist of messy stone masonry. The shallow foundations consist of pads formed by parallelepipeds masonry squared stone blocks. They have a height of 1.30 m and a cantilever with respect to the piers and abutments of 0.30 m both in the longitudinal and transversal directions.
A frontal view of the bridge is given in
Figure 3 and the section in the longitudinal direction is given in
Figure 4.
2.3. Mechanical Properties of Materials
The geometric survey was accompanied by extensive investigations and tests in order to reach a knowledge level (KL2), which indicates a normal knowledge of geometry, materials, and details according to Eurocode 8 [
10]. This KL2 corresponds to a confidence factor CF = 1.20 (as specified in Table 3.1 of the Eurocode 8, Part 3 [
10]).
The design values of the mechanical parameters used in the analyses were calculated by dividing the average values, obtained from Table C8.5.1 chapter 8 of the Italian Standard [
11], by CF = 1.20. The design values are given in
Table 1. For the purpose of the calculation, the abutments were considered only in terms of mass, neglecting their possible seismic-resistant capacity.
2.4. Modeling Assumptions
Using Finite Element Analysis (FEA) software, predictive computational models of actual structure can be built. The knowledge of various information, such as material properties, applied loads, and constraints, makes it possible to predict the behavior of existing structures, often with high accuracy levels. The accuracy that can be achieved is closely related to the used FE mesh; this procedure is called mesh refinement metric.
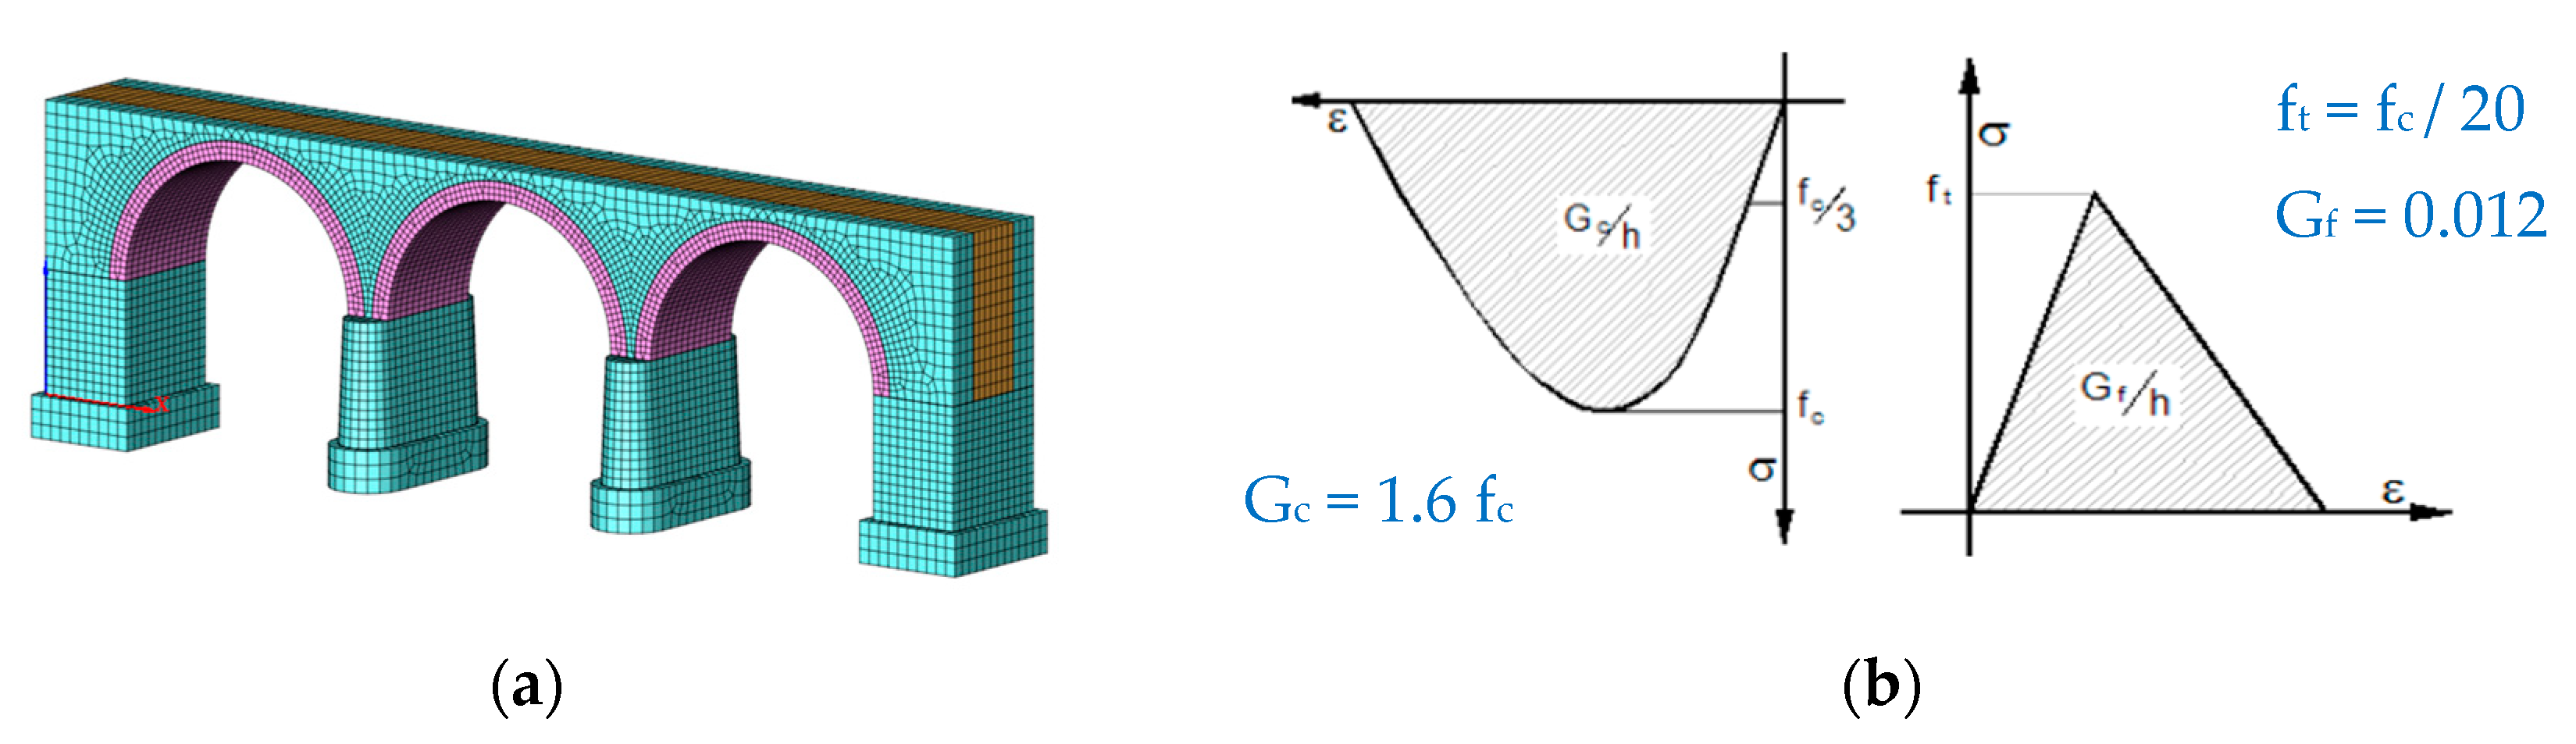
In this case, the bridge has been modeled using an appropriate FE mesh with an 8-node solid brick finite elements, with refinement at the vaults (
Figure 5a), in order to reduce the error in these particular regions and obtain a sufficiently accurate mesh without overburdening the model.
The masonry was modeled using the Total Strain Crack Model (TSC), which is suitable for simulating the behavior of brittle materials such as masonry or concrete. Specifically, it was decided to use a linear constitutive model for the tensile behavior and a parabolic constitutive model for the compression behavior (
Figure 5b). These constitutive models are uniquely defined once the following parameters are assigned: tensile strength (f
t) and compressive strength (f
c) of squared stone block masonry and solid brick and lime mortar masonry; compressive fracture energy (G
c); tensile fracture energy (G
f); mesh size (h).
3. Seismic Vulnerability Analysis and Results
For the assessment of the global seismic behavior of the bridge, it was decided to perform the nonlinear non-adaptive static analysis (pushover). The latter is the most comprehensive procedure to study the complex structural behavior during an earthquake, since more information can be obtained than conventional linear approaches [
13]. An in-depth review of the research on nonlinear static seismic analysis procedures can be found in the FEMA 440 document [
14].
The analysis of the Italian masonry arch railway bridge was carried out considering the two main directions of the bridge according to the dominant bridge behavior and mode shapes: the longitudinal one, i.e., parallel to the axis of the tracks, and the transversal one, orthogonal to the previous one.
For each direction, two force distributions were considered, proportional to the main modal shape (Group1) and proportional to the mass (Group2), as required by Norme Tecniche per le Costruzioni, chapter 7 [
15].
The capacity curve of the structure is described by the base shear force versus displacement at a suitable control point. In this case study, only one control point was considered. Then, the complex structural behavior analyzed with the MDOF (multi-degree-of-freedom) capacity curves are converted into the response of an equivalent bilinear SDOF (single-degree-of-freedom) system.
3.1. Modal Analysis
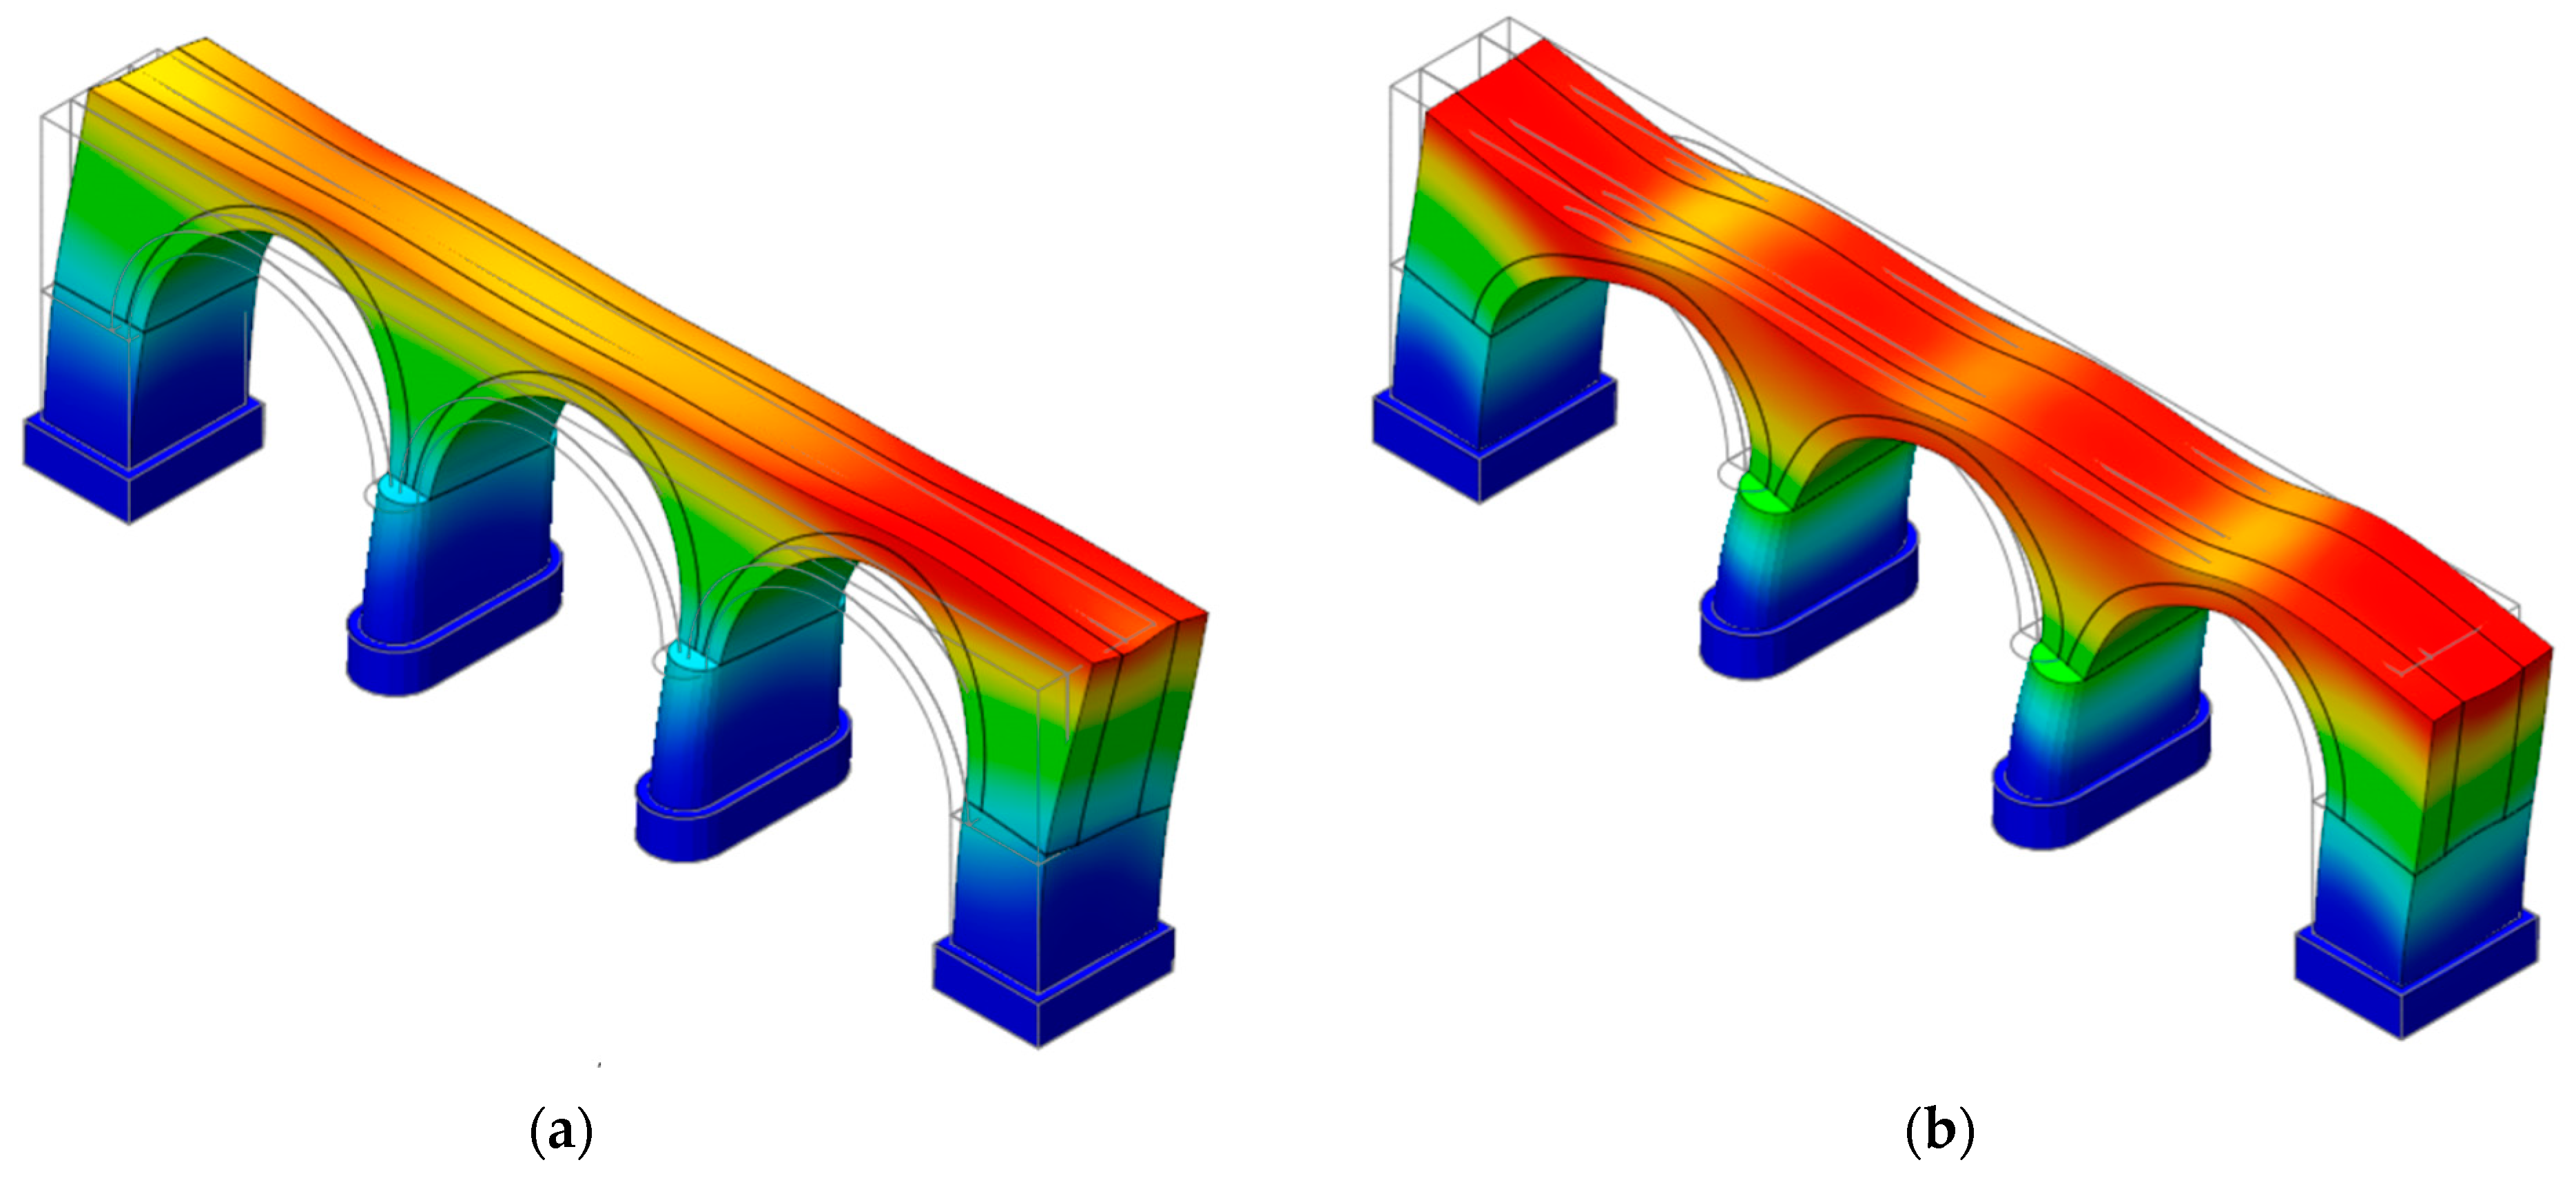
The basic assumption is that the response of the structure is dominated by a single mode of vibration for each of the two main directions. Therefore, in order to identify the main mode shape, for each considered direction, the first step was a modal analysis.
Figure 6 shows the main mode shape in the longitudinal and transverse directions.
3.2. Pushover Analysis
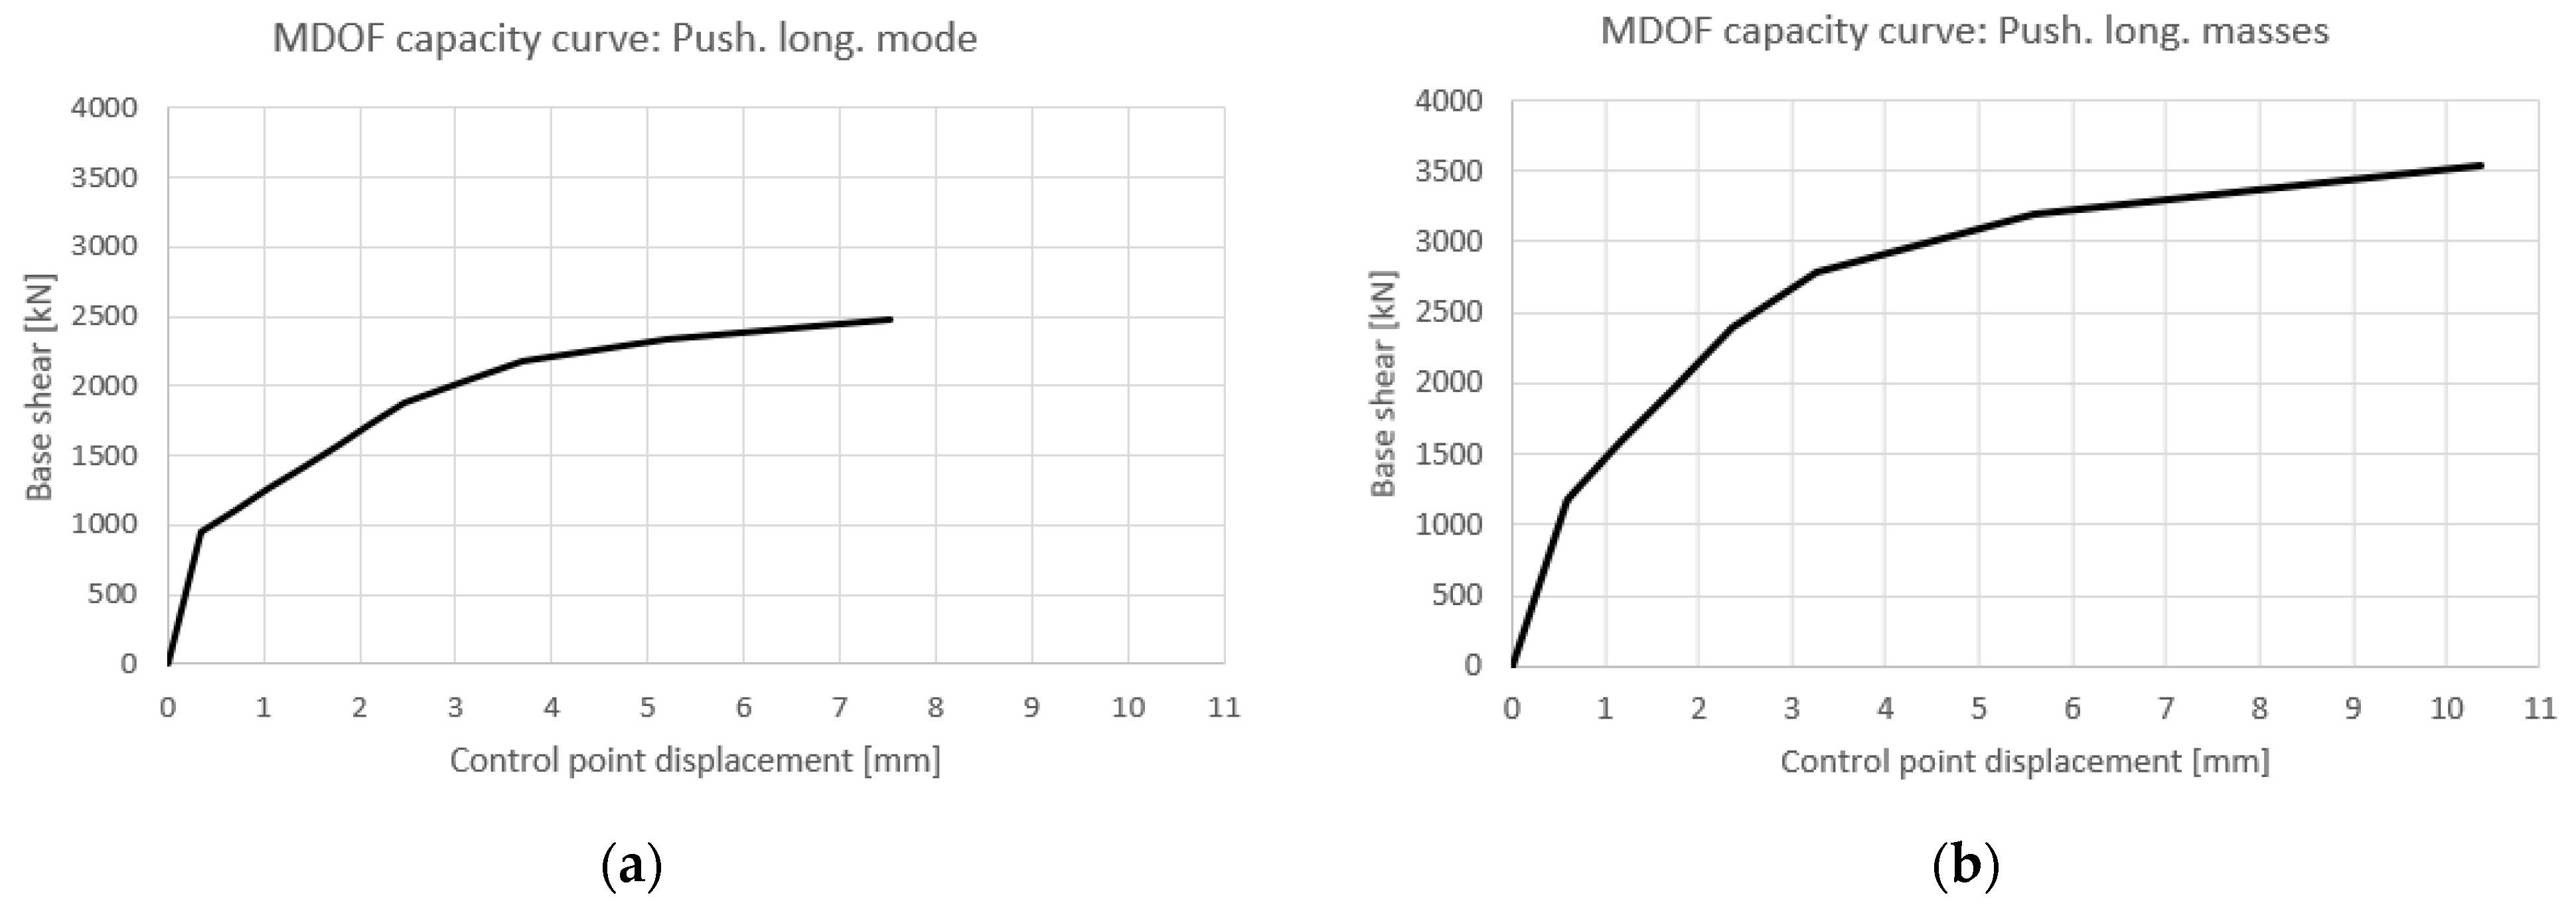
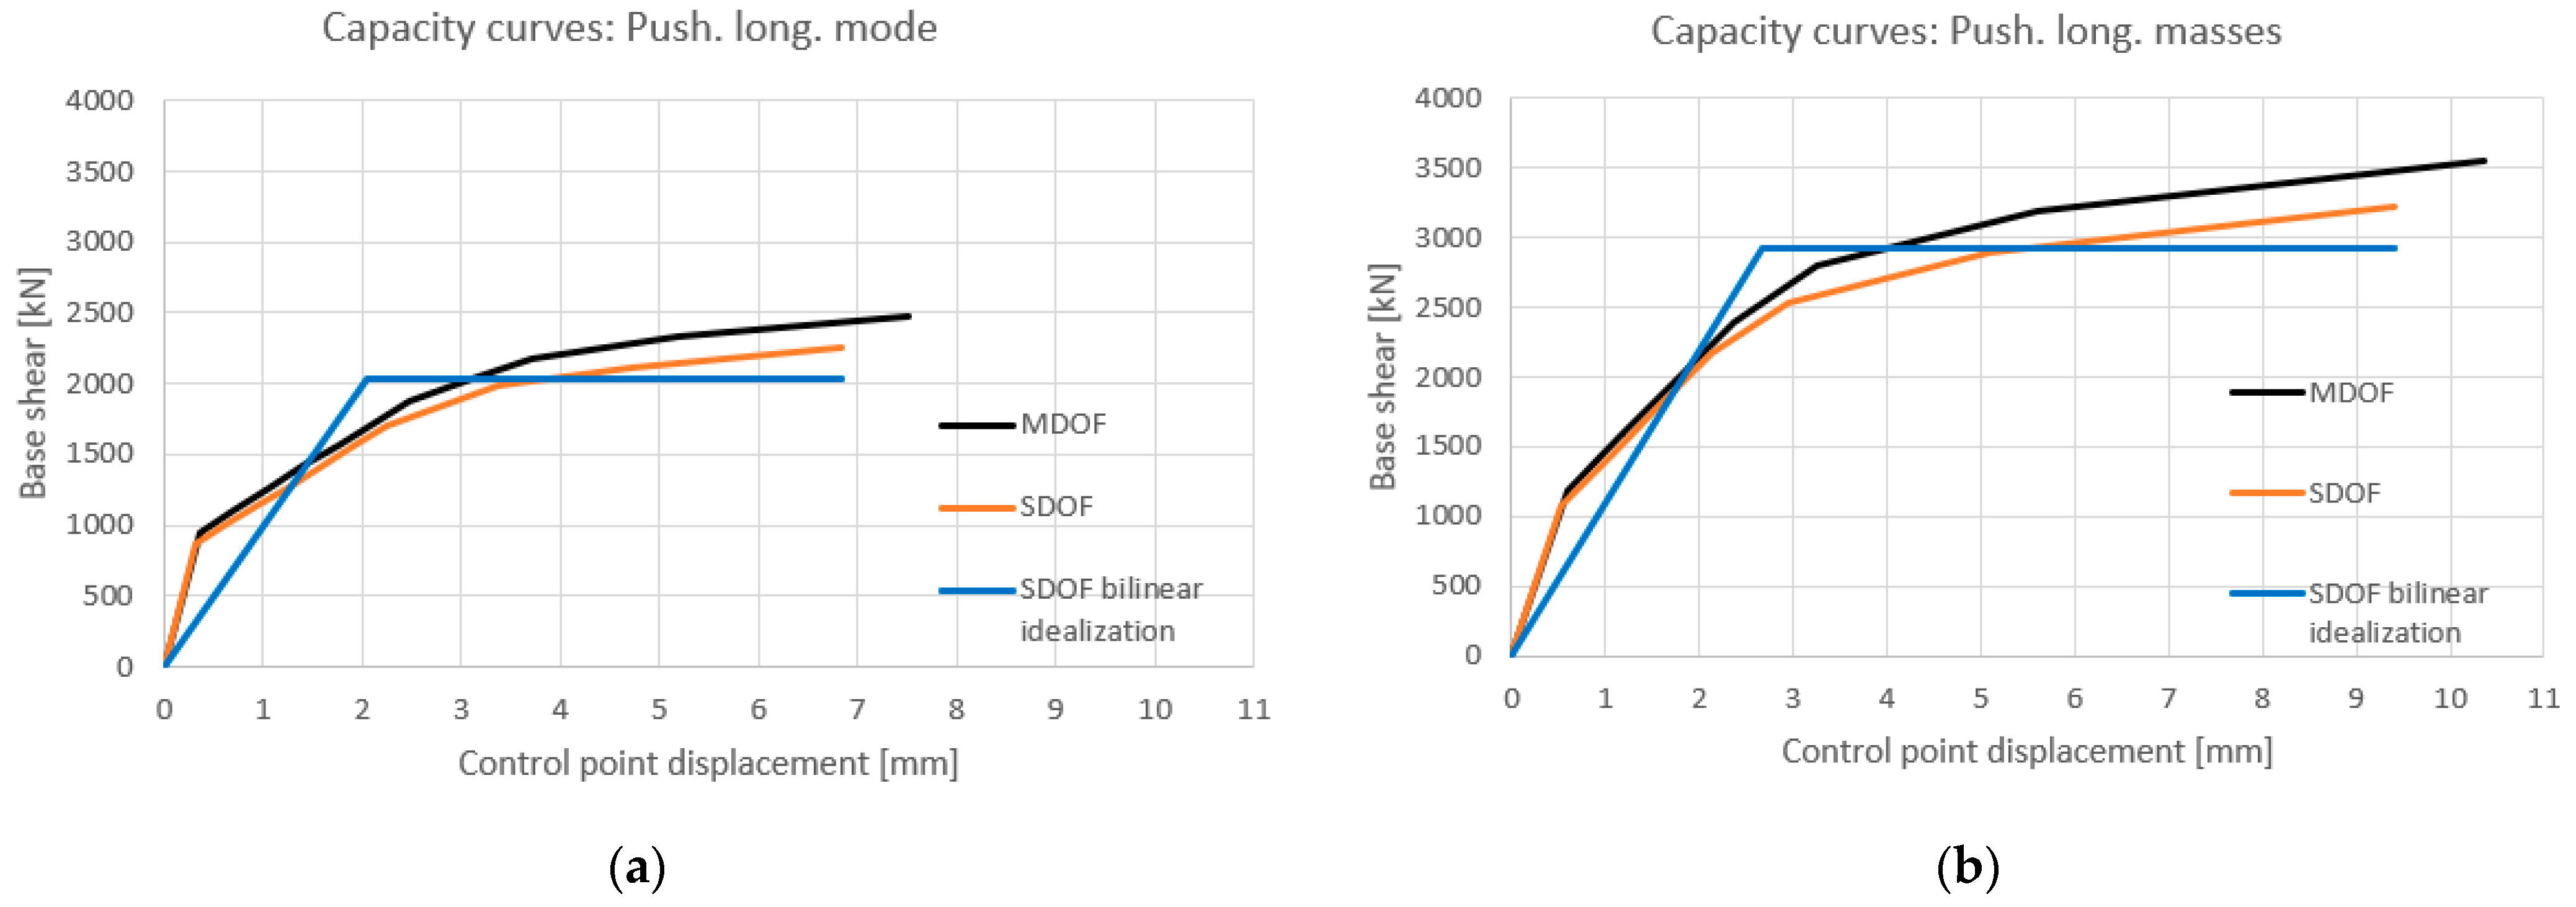
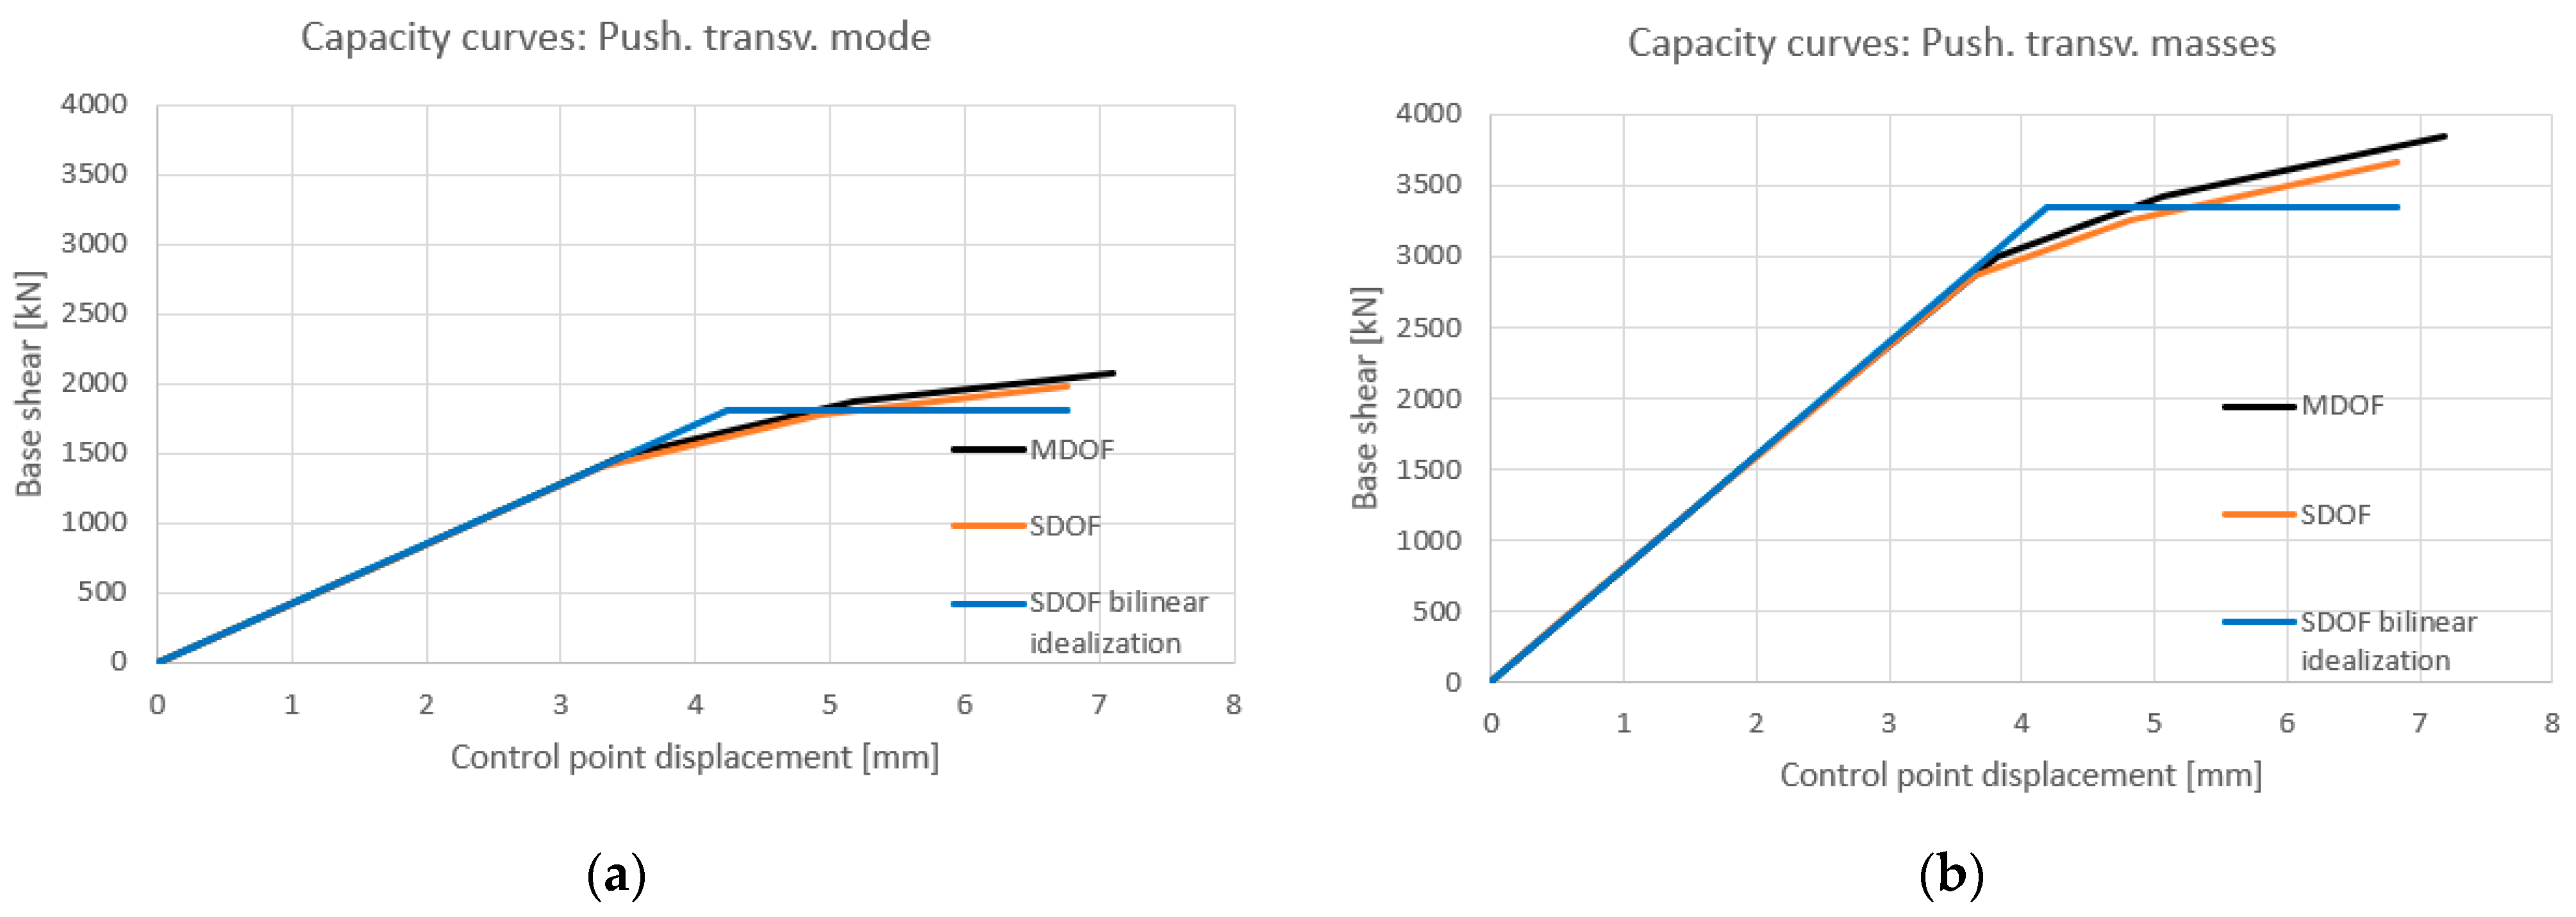
Once the main mode shapes were known, four separate pushover analyses were performed: the first in the longitudinal direction, proportional to the mode (Push. long. mode); the second in the longitudinal direction, proportional to the masses (Push. long. masses); the third in the transversal direction, proportional to the mode (Push. transv. mode); the fourth in the transversal direction, proportional to the masses (Push. transv. masses). Each analysis provides an ante operam capacity curve (
Figure 7 and
Figure 8). Having identified the MDOF capacity curves, these were transformed into bilinear SDOF curves using the peak areas equivalence criterion (
Figure 9 and
Figure 10). Indeed, the area of the capacity curve of the SDOF system exactly reproduces the strain energy of the MDOF system.
3.3. Result of Pushover Analysis
According to current codes [
10,
11], verification of the nonlinear static analysis is satisfied if the following relation (1) is valid for each performed analysis:
where U
max is the displacement capacity of the structure and d
max is the required displacement of the actual MDOF system. This displacement is obtained by multiplying the required displacement of the equivalent system
by the modal participation factor Γ (d
max = Γ
). The required displacement of the equivalent system is a function of the initial proper period associated with the elastic range T* and it is evaluated using Equation (2) if T* ≥ T
c or Equation (3) if T* ≤ T
c:
According to the Italian Standard [
11], the behavior factor q* must be less than 3 for life-saving limit state (SLV); otherwise, the assessment result must be considered negative.
The obtained values of Umax for the four MDOF capacity curves are the following:
MDOF Capacity Curve Push. long. mode: Umax = 7.6 mm;
MDOF Capacity Curve Push. long. masses: Umax = 10.4 mm;
MDOF Capacity Curve Push. trans. mode: Umax = 7.1 mm;
MDOF Capacity Curve Push. trans. masses: Umax = 7.2 mm.
To evaluate , the q* values were calculated:
equivalent bilinear Push. long. mode: q* = 2.2 < 3;
equivalent bilinear Push. long. masses: q* = 1.53 < 3;
equivalent bilinear Push. trans. mode: q* = 3.88 > 3;
equivalent bilinear Push. trans. masses: q* = 1.25 < 3.
Because in the case of Push. trans. mode q* = 3.88 > 3, the verification in terms of displacement is “not satisfied”.
3.4. Seismic Vulnerability in Terms of Acceleration
According to chapter 2.12.3.2 of the RFI (Rete Ferroviaria Italiana) Manual [
16] and Italian Standard (Cir. no. 7, chapter 8) [
11], seismic vulnerability verification is satisfied if:
where ζ
E,min is the minimum seismic risk index among those associated with local and global collapse mechanisms.
3.4.1. Global Risk Indexes
The generic risk index is given by the ratio of the peak ground acceleration leading to the collapse of the bridge, ag,C (seismic capacity), to the peak ground acceleration at the site where the structure rises, ag,D (seismic demand). To assess the seismic capacity, an iterative procedure was performed to identify, for the four pushover analyses, the seismic spectrum for which the demand dmax equals the displacement capacity Umax (capacity spectrum) and the corresponding value of the behavior factor q*.
The obtained results are reported in
Table 2.
3.4.2. Local Risk Indexes
Local collapse mechanisms are not identified by the global analysis; consequently, they must be verified separately. In the present case, one possible local mechanism is spandrel walls overturning. The calculation of the risk index associated with this mechanism was conducted using the linear kinematic approach and reference was made only to the SLV (life-saving limit state) as allowed by Italian Standards [
11,
15].
To simplify the calculation, as suggested in chapter 2.12.3.2.2.5 of the RFI Manual [
15], the spandrel wall was transformed into an equivalent rectangular wall (
Figure 11) with length L = 30.25 m, equal to the effective length of the spandrel, and height h
m equal to the ratio between the area of the spandrel A
t = 46.6 m
2 and its length L. After performing the calculations, a risk index associated with the overturning mechanism of the spandrel wall 𝜁
E, loc = 3.9 was obtained.
3.4.3. Seismic Vulnerability Verification
Once the global and local seismic risk indexes were known, it was possible to apply the above Equation (5), obtaining 𝜁E,min = 0.51 < 1. Since 𝜁E,min < 1, the seismic vulnerability verification of the bridge ante operam is “not satisfied”.
4. Design of Structural Rehabilitation
The risk index obtained was less than the unit, meaning that the existing structure, in its ante operam configuration, is unable to withstand the design seismic action.
Therefore, the need arises to design reinforcement interventions in order to achieve a seismic upgrading of the bridge obtaining a risk index greater than or equal to the unit.
After a careful evaluation of different possible reinforcement techniques, the following traditional types of reinforced concrete (RC) interventions were selected:
RC linings 30 cm thick on the intrados of the arches and on the vertical load-bearing elements (
Figure 12 and
Figure 13);
In order to ensure the functionality of the structural intervention, the linings and jacketing will be connected to the existing structure using steel bars with a diameter of 14 mm (ϕ 14), chemically anchored using cement-based resin.
4.1. New Modeling Assumption
The linings and jacketing were modeled using FE solid of the 8-node brick type to which the mechanical properties of class C25/30 concrete were assigned (
Figure 14a). The steel reinforcements (of the linings and jacketing) and the anchor bars to the existing structure (ϕ 14) were modeled through the use of one-dimensional FE called strengthening elements (
Figure 14b) which are able to be “embedded” in the FE solids, representing concrete and masonry.
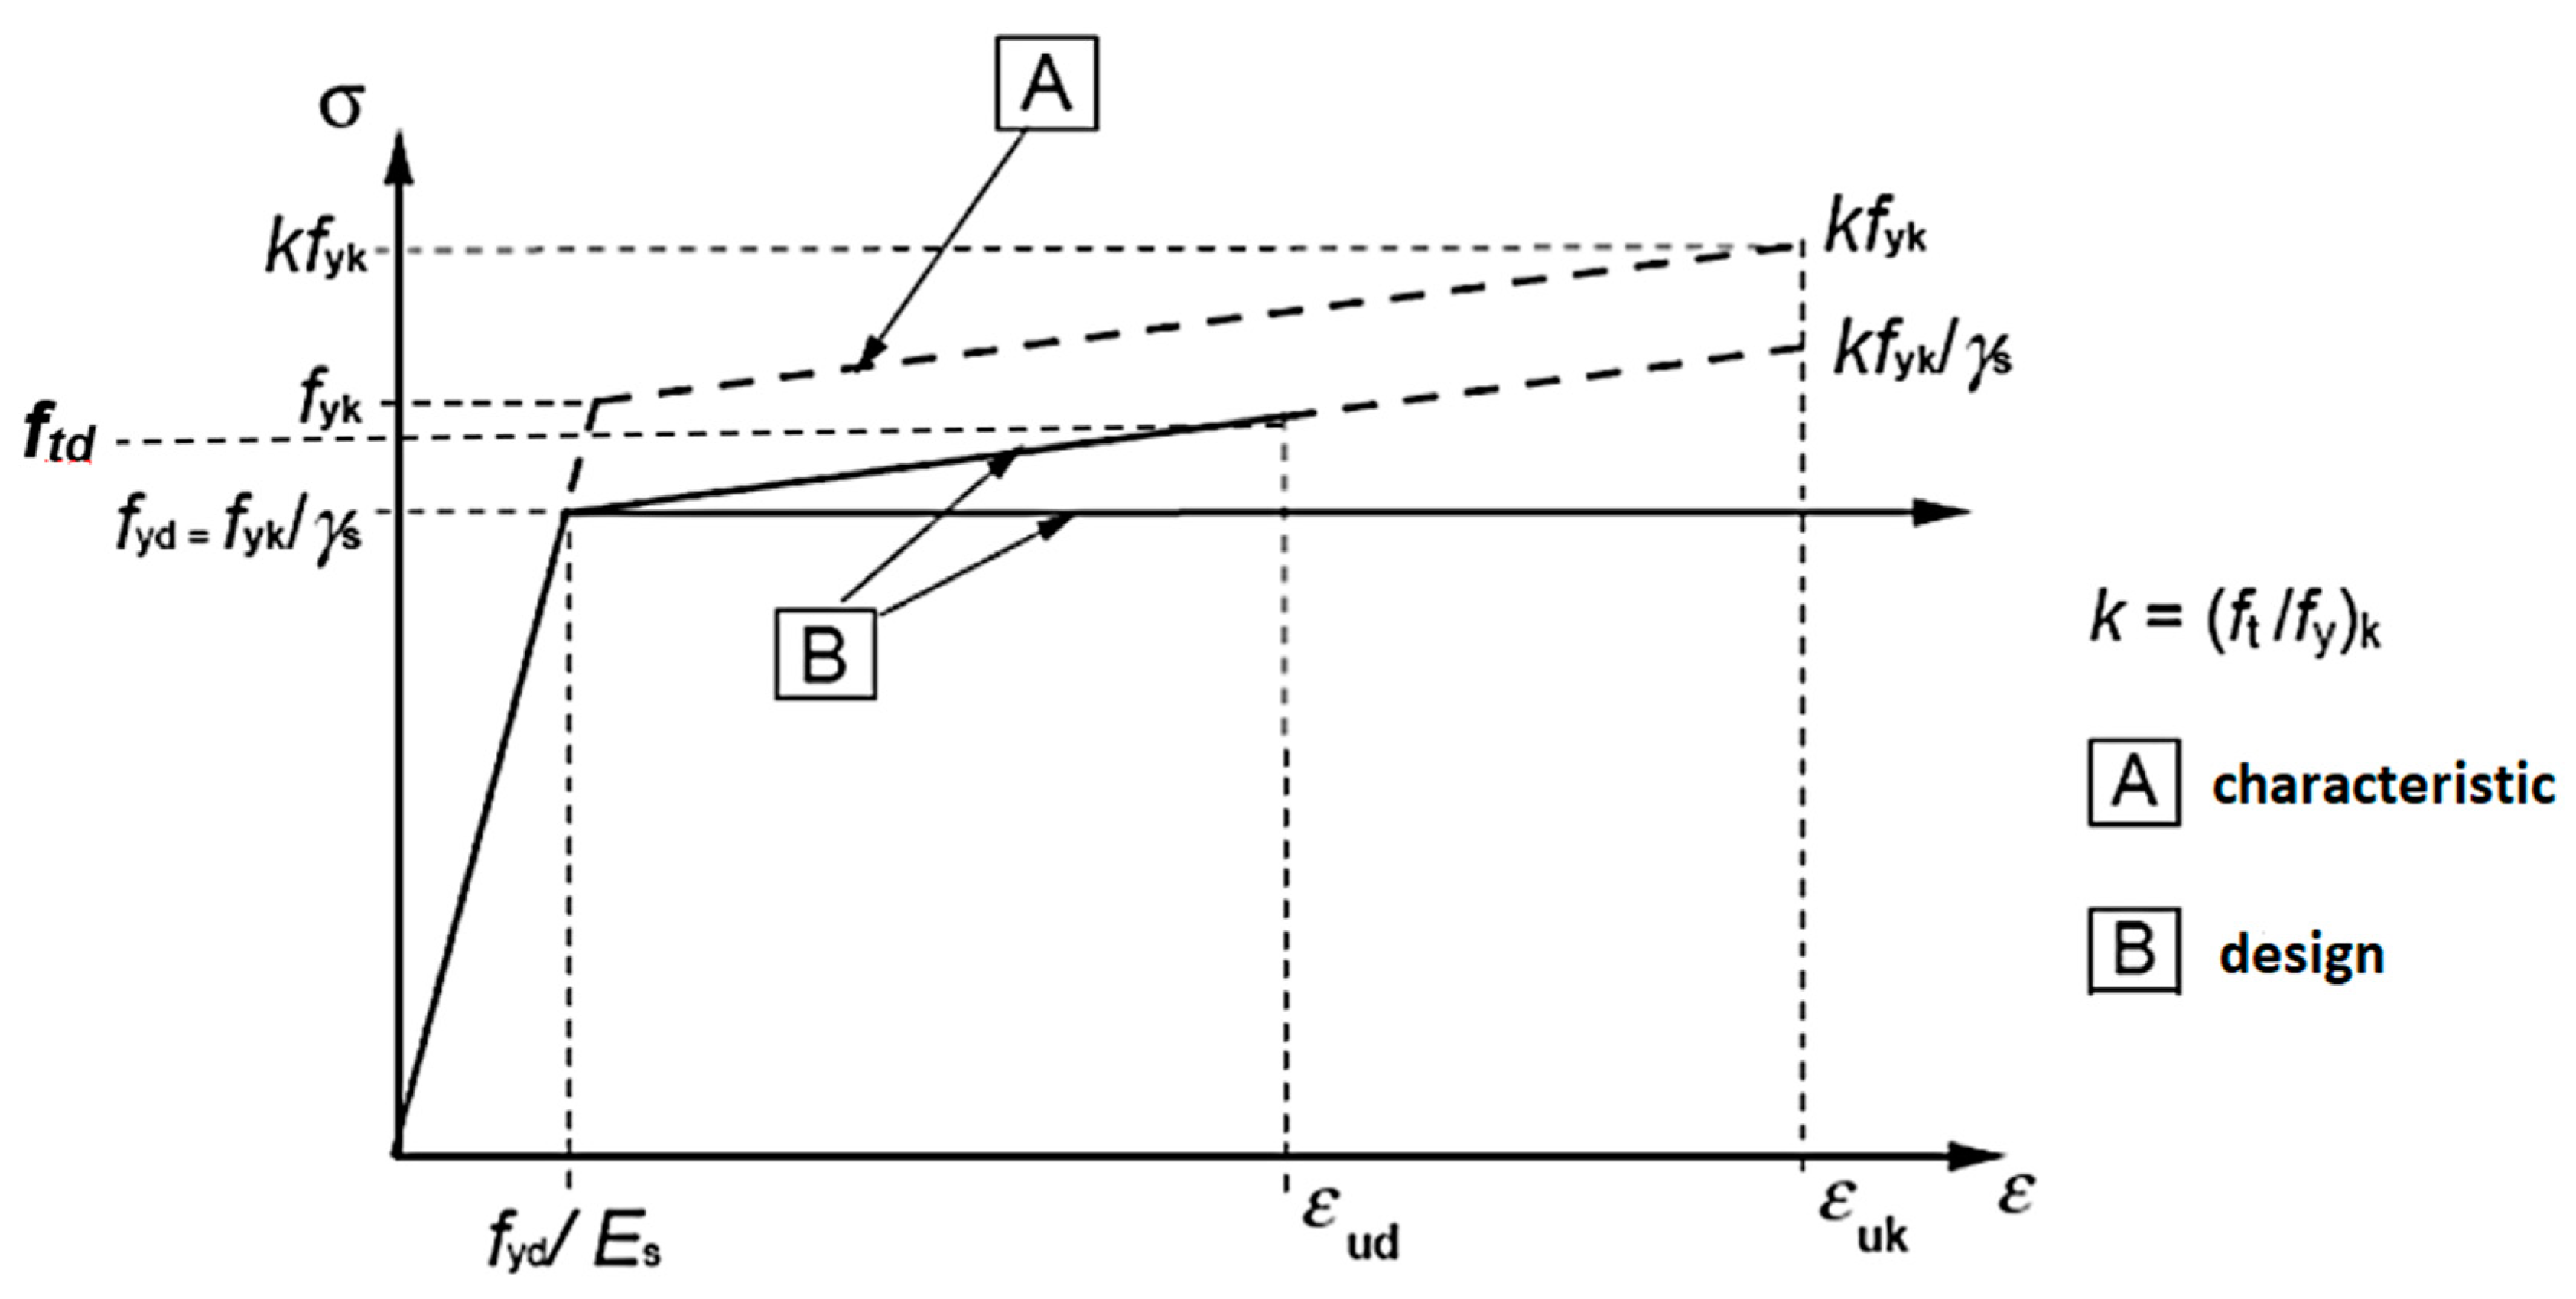
To the one-dimensional FE were assigned the mechanical properties of B450C steel (f
yk = 450 N/mm
2: characteristic yield strength; γ
s = 1.15: partial factor for reinforcing steel; f
yd = 391.3 N/mm
2: design yield strength; k: ratio of tensile strength to the yield stress of the steel; E
s = 200 GPa: design value of the elasticity modulus; f
td: design value of tensile strength; ε
uk: characteristic strain of steel reinforcement at maximum force; ε
ud: design strain of steel reinforcement at maximum force, according to Eurocode 2 [
17] and shown in
Figure 15).
4.2. Constitutive Models
The same constitutive model used for the masonry was assigned to the concrete; in particular, a linear law for the tension behavior and a parabolic law for the compression behavior (
Figure 5b). This choice is appropriate because the TSC model is suitable for simulating the behavior of brittle materials such as concrete and masonry. As for steel a bilinear hardening, the constitutive model was used both in tension and compression (
Figure 15).
4.3. Post Operam Modal Analysis
The seismic rehabilitation intervention was implemented in the FE model and a modal analysis of the post operam bridge was carried out in order to identify the new main modal shape for each of the two considered directions (
Figure 16).
4.4. Post Operam Pushover Analysis
Once the new main mode shapes were known, the four post operam pushover analyses were carried out. The four obtained capacity curves compared with those obtained before rehabilitation are shown in
Figure 17 and
Figure 18. As can be seen, the rehabilitation intervention leads to an improvement in both strength and ultimate displacement. Having identified the post operam MDOF capacity curves, these were transformed into the post operam bilinear SDOF curves through the peak areas equivalence criterion (
Figure 19 and
Figure 20).
4.5. Check Post Operam Pushover Analysis
In order to identify the
values, the bilinear capacity curves were compared with the ADRS (Acceleration Displacement Response Spectrum) seismic spectrum. This comparison shows that for the four post operam pushover analyses, T* < T
B. Therefore, for all cases, Equation (3) should be used for seismic verification.
Table 3 shows the verification results. As required by current codes, having obtained U
max > d
max for each pushover analysis performed, the verification in terms of displacement is “satisfied”.
4.6. Post Operam Seismic Vulnerability
For the calculation of the global post operam risk indexes, the same iterative procedure used previously was carried out, obtaining 𝜁E,min = 1.38 at the push analysis. transv. mode. Since no spandrel wall reinforcement interventions were performed, as they were not necessary, the post operam local risk index is the same as the ante operam one.
Result of the Post Operam Assessment
Once the post operam risk indexes were known, Equation (5) was reapplied, obtaining 𝜁E,min = 1.38 > 1. With 𝜁E,min > 1, the seismic vulnerability check of the upgraded bridge is “satisfied”.
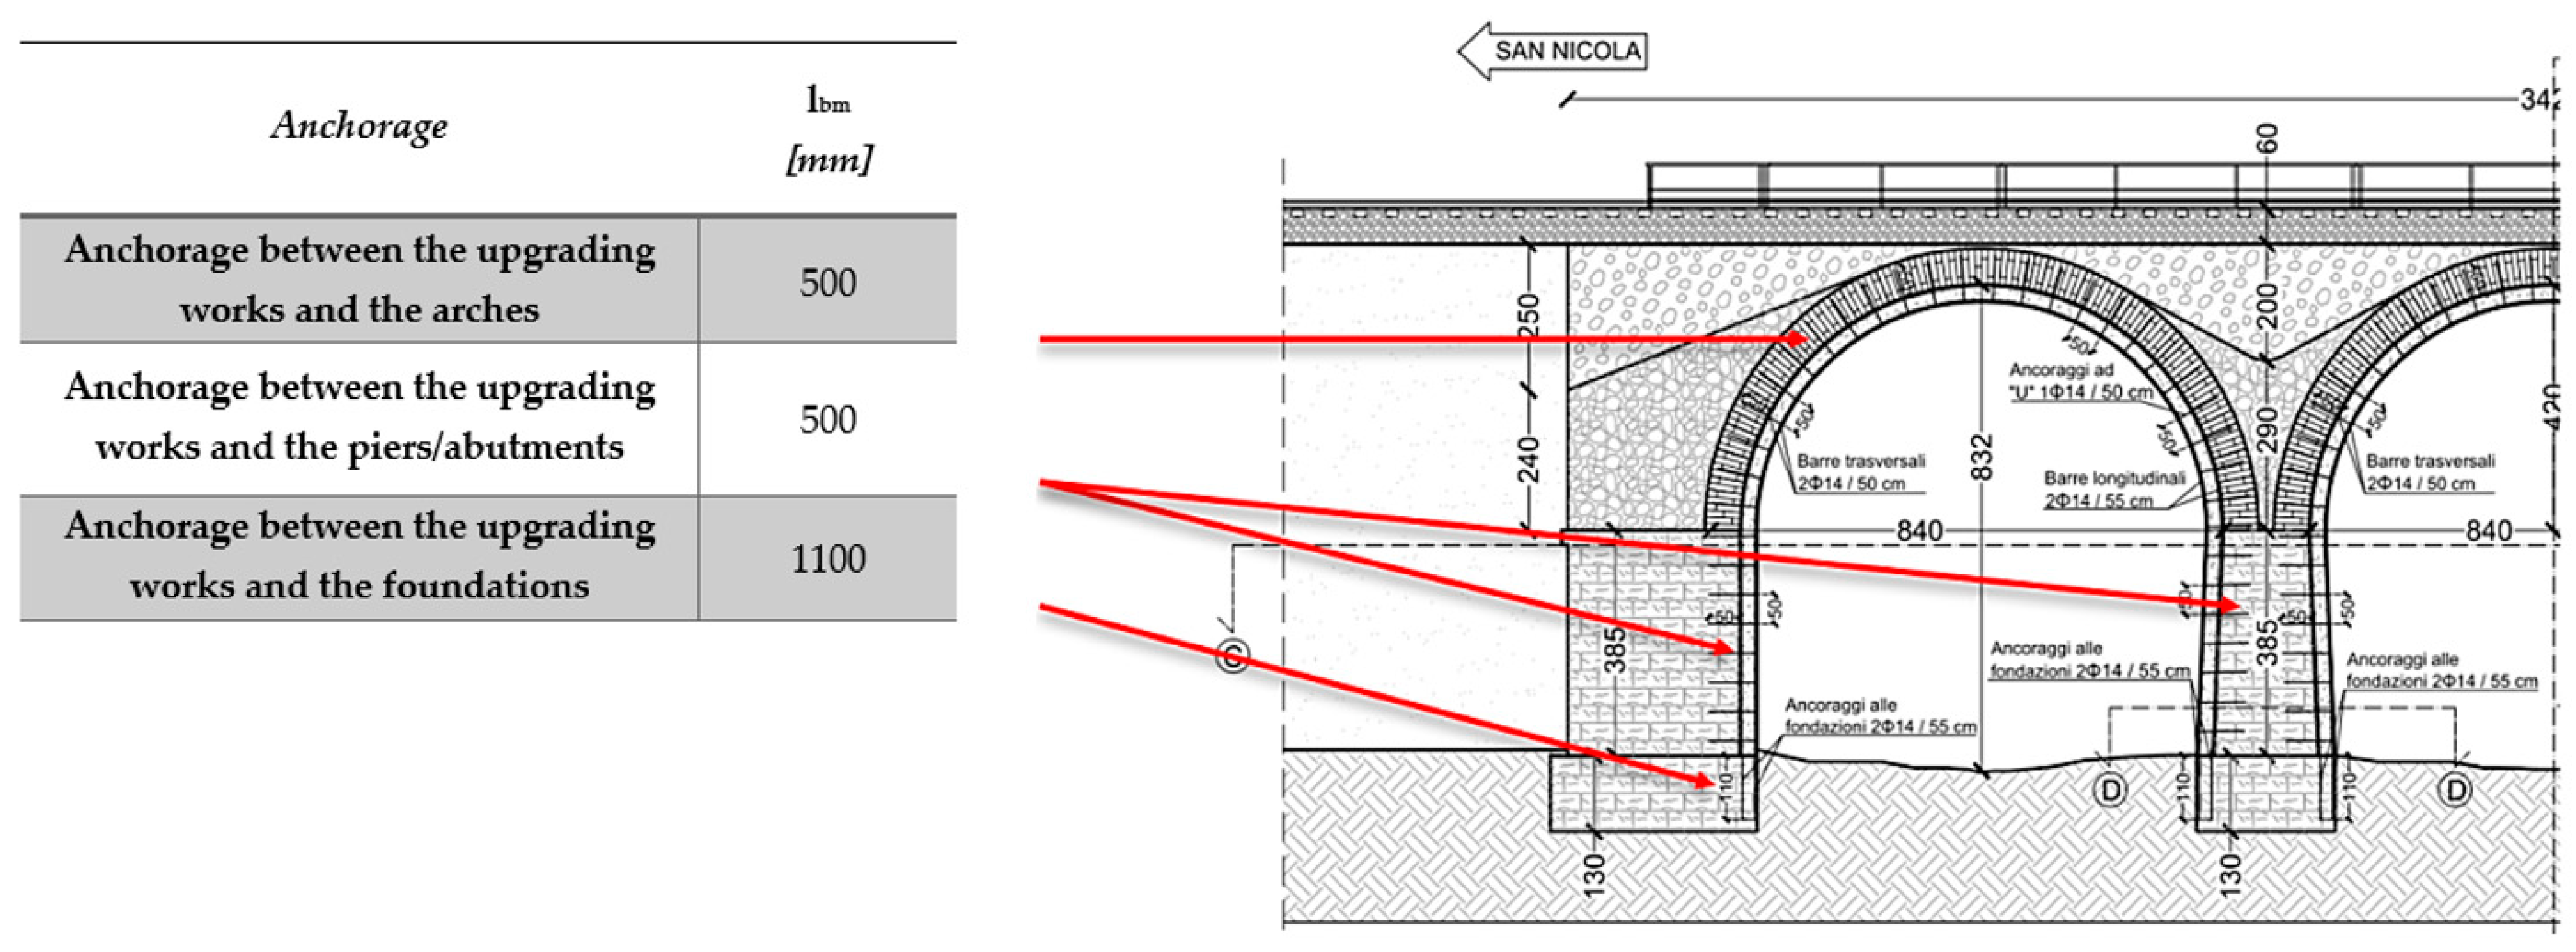
4.7. Checking of the Injected Anchors
Finally, the check of the injected anchors was performed. The strength of these depends on the mechanical properties of the used mortar, the characteristics of the steel bar, the anchorage length, the diameter of the hole, and the mechanical properties of the masonry. Different failure mechanisms can be developed: collapse by sliding of the bar, collapse by sliding of the mortar bulb, or collapse by detachment of the masonry cone [
18]. The assessment of the anchorages can be considered satisfied if the anchorage length is sufficient to avoid the activation of these mechanisms. This result was achieved assuming the anchorage lengths (l
bm) shown in
Figure 21.
5. Conclusions
In this paper, a practical procedure has been used in order to evaluate the seismic safety level of existing masonry arch railway bridges. Specifically, the aim of the research was to conduct a seismic vulnerability study of the arch bridge located on the San Nicola–Avignano Lucania line. After taking appropriate measurements to acquire the necessary information on geometry, materials, and details to obtain a normal knowledge level (KL2), a three-dimensional model was created with the aid of suitable FE software.
The tools available in the software made it possible to model the geometry of the bridge quickly and easily, to create an accurate mesh without overweighting the model, and to adopt a constitutive model suitable for simulating the behavior of brittle materials such as masonry. The seismic performance of the existing masonry arch railway bridge was evaluated using nonlinear non-adaptive static analysis (pushover). The results of the analysis provided risk indexes that did not meet the minimums required by the current codes.
In this regard, an intervention on the existing structure was studied, modeled, and analyzed using traditional rehabilitation techniques. The proposed seismic rehabilitation solution proved to be valid and effective, leading to the verification of the seismic performance. The linings and the jacketing work in tension; the former counteract hinge opening at the intrados due to actions in the longitudinal plane, and the latter counteract hinge opening at the base of the piers due to actions in the transversal plane.
The proposed structural analysis methodology proved to be a valid tool, able to carry out a judgment of the seismic performance of an existing masonry arch bridge using a suitable risk index.
The authors want to highlight that the possible solutions for seismic rehabilitation through the use of traditional and/or innovative materials and techniques are different and each requires specific modeling and analyses. For these reasons, the proposed solution, which is not unique, cannot be generalized for every existing bridge, because the various characteristics and problems must be properly analyzed to identify and define the appropriate methodology.
Author Contributions
Conceptualization, F.B.; Validation, R.C. and V.S.; Formal analysis, F.B., R.C. and V.S.; Investigation, V.S.; Data curation, F.B.; Writing—original draft, R.C. and V.S.; Writing—review & editing, F.B.; Supervision, F.B. All authors have read and agreed to the published version of the manuscript.
Funding
This research received no external funding. The activities developed in this scientific work were carried out during the PhD course XXXVII cycle (R. Curto), PON R&I 2014-2020, Azione IV.5 “Green”.
Institutional Review Board Statement
Not applicable.
Informed Consent Statement
Not applicable.
Data Availability Statement
Data are contained within the article.
Acknowledgments
The study developed in this scientific work was carried out during a master’s degree thesis (V. Scavelli) at the University of Calabria.
Conflicts of Interest
The authors declare no conflict of interest.
References
- Brencich, A.; Morbiducci, R. Masonry Arches: Historical Rules and Modern Mechanics. Int. J. Archit. Herit. Conserv. Anal. Restor. 2007, 1, 165–189. [Google Scholar] [CrossRef]
- Zampieri, P.; Zanini, M.A.; Modena, C. Simplified seismic assessment of multi-span masonry arch bridges. Bull Earthq. Eng. 2015, 13, 2629–2646. [Google Scholar] [CrossRef]
- Aoki, T.; Sabia, D. Collapse Analysis of Masonry Arch Bridges. In Proceedings of the Ninth International Conference on Civil and Structural Engineering Computing, B.H.V. Topping, Egmond-aan-Zee, The Netherlands, 2–4 September 2003; Civil-Comp Press: Stirling, Scotland, 2003. [Google Scholar] [CrossRef]
- Sarhosis, V.; De Santis, S.; de Felice, G. A review of experimental investigations and assessment methods for masonry arch bridges. In Structure and Infrastructure Engineering; Taylor & Francis: Abingdon, UK, 2016. [Google Scholar] [CrossRef]
- Midas. Advanced Nonlinear and Detail Analysis System; FEA NX 2021 (v. 1.1); CSPFEA Engineering Solutions: Este, Italy, 2021. [Google Scholar]
- Pelà, L.; Aprile, A.; Benedetti, A. Seismic assessment of masonry arch bridges. Eng. Struct. 2009, 31, 1777–1788. [Google Scholar] [CrossRef]
- Gönen, S.; Soyöz, S. Reliability-based seismic performance of masonry arch bridges. Struct. Infrastruct. Eng. Maint. Manag. Life-–Cycle Des. Perform. 2022, 18, 1658–1673. [Google Scholar] [CrossRef]
- Addessi, D.; Gatta, C.; Nocera, M.; Liberatore, D. Nonlinear Dynamic Analysis of a Masonry Arch Bridge Accounting for Damage Evolution. Geosciences 2021, 11, 343. [Google Scholar] [CrossRef]
- Available online: www.ferrovieappulolucane.it (accessed on 1 June 2020).
- EN 1998-3:2005; Eurocode 8: Design of structures for earthquake resistance—Part 3: Assessment and retrofitting of buildings. European Standard: Brussels, Belgium, 2005.
- DM 17 Gennaio 2018; Istruzioni per l’applicazione dell’aggiornamento delle Norme Tecniche per le Costruzioni. Cir. no 7, 21 Gennaio, 2019; Italian Standard. Il Ministro delle Infrastrutture e dei Trasporti: Rome, Italy, 2019.
- Angelillo, M.; Lourenco, P.B.; Milani, G. Masonry behaviour and modelling. In Mechanics of Masonry Structures; CISM International Centre for Mechanical Sciences; Springer: Vienna, Austria, 2014; Volume 551. [Google Scholar] [CrossRef]
- EN 1998-2:2005; Eurocode 8: Design of structures for earthquake resistance–Part 2: Bridges. European Standard: Brussels, Belgium, 2005.
- FEMA 440; Improvement of nonlinear static seismic analysis procedures. Federal Emergency Management Agency: Washington, DC, USA, 2005.
- DM 17 Gennaio 2018; Norme Tecniche per le Costruzioni. Gazzetta Ufficiale della Repubblica Italiana, Il Ministro delle Infrastrutture e dei Trasporti: Rome, Italy, 2018.
- Manuale RFI di Progettazione delle Opere Civili, Parte II–Sezione II, Ponti e Strutture, Rev. E; RFI: Rome, Italy, 2020.
- EN 1992-1-1:2004; Eurocode 2: Design of concrete structures–Part 1-1: General rules and rules for buildings. European Standard: Brussels, Belgium, 2004.
- Tomasoni, E. Analisi, Verifiche e Consolidamento Strutturale di Archi e Volte; Dario Flaccovio Editore: Palermo, Italy, 2018. [Google Scholar]
Figure 1.
(
a) Acerenza–Avigliano Lucania line inaugurated on 26 May 1930 [
9]. (
b) Concrete coating at the bottom of the vault.
Figure 1.
(
a) Acerenza–Avigliano Lucania line inaugurated on 26 May 1930 [
9]. (
b) Concrete coating at the bottom of the vault.
Figure 2.
(a) Photo of the arch bridge. (b) Building materials of piers, spandrels, and arches.
Figure 2.
(a) Photo of the arch bridge. (b) Building materials of piers, spandrels, and arches.
Figure 3.
Frontal view of the bridge.
Figure 3.
Frontal view of the bridge.
Figure 4.
Longitudinal section.
Figure 4.
Longitudinal section.
Figure 5.
(
a) Geometric model of the bridge. (
b) Parabolic (
left) and linear (
right) constitutive model [
12].
Figure 5.
(
a) Geometric model of the bridge. (
b) Parabolic (
left) and linear (
right) constitutive model [
12].
Figure 6.
(a) Main mode shape in longitudinal direction (T = 0.25 s). (b) Main mode shape in transverse direction (T = 0.24 s).
Figure 6.
(a) Main mode shape in longitudinal direction (T = 0.25 s). (b) Main mode shape in transverse direction (T = 0.24 s).
Figure 7.
(a) Push. long. mode: Pre operam MDOF capacity curve. (b) Push. long. masses: Pre operam MDOF capacity curve.
Figure 7.
(a) Push. long. mode: Pre operam MDOF capacity curve. (b) Push. long. masses: Pre operam MDOF capacity curve.
Figure 8.
(a) Push. transv. mode: Pre operam MDOF capacity curve. (b) Push. transv. masses: Pre operam MDOF capacity curve.
Figure 8.
(a) Push. transv. mode: Pre operam MDOF capacity curve. (b) Push. transv. masses: Pre operam MDOF capacity curve.
Figure 9.
(a) Push. long. mode: Pre operam equivalent bilinear. (b) Push. long. masses: Pre operam equivalent bilinear.
Figure 9.
(a) Push. long. mode: Pre operam equivalent bilinear. (b) Push. long. masses: Pre operam equivalent bilinear.
Figure 10.
(a) Push. transv. mode: Pre operam equivalent bilinear. (b) Push. transv. masses: Pre operam equivalent bilinear.
Figure 10.
(a) Push. transv. mode: Pre operam equivalent bilinear. (b) Push. transv. masses: Pre operam equivalent bilinear.
Figure 11.
Schematization of the forces acting on the spandrel wall during the seismic event.
Figure 11.
Schematization of the forces acting on the spandrel wall during the seismic event.
Figure 12.
Frontal view of the post operam bridge.
Figure 12.
Frontal view of the post operam bridge.
Figure 13.
Section in longitudinal direction post operam.
Figure 13.
Section in longitudinal direction post operam.
Figure 14.
(a) Geometric model of the post operam bridge. (b) Geometric model of the reinforcements and anchors.
Figure 14.
(a) Geometric model of the post operam bridge. (b) Geometric model of the reinforcements and anchors.
Figure 15.
Idealized and design stress–strain diagrams for reinforcing steel.
Figure 15.
Idealized and design stress–strain diagrams for reinforcing steel.
Figure 16.
(a) Post operam main mode shape in longitudinal direction (T = 0.158 s); (b) post operam main mode shape in transverse direction (T = 0.147 s).
Figure 16.
(a) Post operam main mode shape in longitudinal direction (T = 0.158 s); (b) post operam main mode shape in transverse direction (T = 0.147 s).
Figure 17.
(a) Push. long. mode: pre and post operam MDOF capacity curve. (b) Push. long. masses: pre and post operam MDOF capacity curve.
Figure 17.
(a) Push. long. mode: pre and post operam MDOF capacity curve. (b) Push. long. masses: pre and post operam MDOF capacity curve.
Figure 18.
(a) Push. trans. mode: pre and post operam MDOF capacity curve. (b) Push. trans. masses: pre and post operam MDOF capacity curve.
Figure 18.
(a) Push. trans. mode: pre and post operam MDOF capacity curve. (b) Push. trans. masses: pre and post operam MDOF capacity curve.
Figure 19.
(a) Push. long. mode: post operam equivalent bilinear. (b) Push. long. masses: post operam equivalent bilinear.
Figure 19.
(a) Push. long. mode: post operam equivalent bilinear. (b) Push. long. masses: post operam equivalent bilinear.
Figure 20.
(a) Push. trans. mode: post operam equivalent bilinear. (b) Push. trans. masses: post operam equivalent bilinear.
Figure 20.
(a) Push. trans. mode: post operam equivalent bilinear. (b) Push. trans. masses: post operam equivalent bilinear.
Figure 21.
Anchor length values.
Figure 21.
Anchor length values.
Table 1.
Design values of mechanical parameters of masonry elements.
Table 1.
Design values of mechanical parameters of masonry elements.
| Element | Masonry Typology | fd
(N/mm2) | τ0d
(N/mm2) | fv0d
(N/mm2) | Ed
(N/mm2) | Gd
(N/mm2) | w
(kN/m3) |
|---|
| Abutment, piles, spandrels, foundations | square stone block masonry | 5.83 | 0.09 | 0.19 | 2375 | 793 | 22 |
| Arches | solid brick masonry and lime mortar | 2.88 | 0.08 | 0.17 | 1250 | 417 | 18 |
| Backfill | disordered rubble stone masonry | 1.25 | 0.02 | - | 725 | 263 | 19 |
Table 2.
Capacity spectrum parameters and risk indexes.
Table 2.
Capacity spectrum parameters and risk indexes.
| Pushover Analysis | TR (a)
(Years) | q* | F0 (b) | TC*
(s) | ag,C
(g) | ag,D
(g) | ζE |
|---|
| Push. long. mode | 299 | 1.81 | 2.415 | 0.355 | 0.167 | 0.202 | 0.83 |
| Push. long. masses | 816 | 1.78 | 2.439 | 0.394 | 0.246 | 0.202 | 1.22 |
| Push. trans. mode | 104 | 1.94 | 2.389 | 0.333 | 0.103 | 0.202 | 0.51 |
| Push. trans. masses | 465 | 1.24 | 2.445 | 0.363 | 0.200 | 0.202 | 0.99 |
Table 3.
Results check of post operam pushover analysis.
Table 3.
Results check of post operam pushover analysis.
| Pushover Analysis | q* | (a) | Displacement Demand |
(mm)
| dmax
(mm) | Umax
(mm) |
|---|
| Push. long. mode | 1.13 | 1.13 | | 4.48 | 5.65 | 10.4 |
| Push. long. masses | 0.80 | 1.00 | 4.52 | 5.70 | 13.5 |
| Push. trans. mode | 1.26 | 1.26 | 5.92 | 6.81 | 11.0 |
| Push. trans. masses | 0.68 | 1.00 | 2.28 | 2.62 | 12.3 |
| Disclaimer/Publisher’s Note: The statements, opinions and data contained in all publications are solely those of the individual author(s) and contributor(s) and not of MDPI and/or the editor(s). MDPI and/or the editor(s) disclaim responsibility for any injury to people or property resulting from any ideas, methods, instructions or products referred to in the content. |
© 2023 by the authors. Licensee MDPI, Basel, Switzerland. This article is an open access article distributed under the terms and conditions of the Creative Commons Attribution (CC BY) license (https://creativecommons.org/licenses/by/4.0/).


