1. Introduction
The relationship between business and sustainability, covered by the term “sustainable business,” has recently highlighted that the most innovative businesses have started to consistently manage their impact on social and natural ecosystems. On the one hand, it is true that implementing sustainability principles for businesses entails expenses, investments, adjustments, and innovation efforts that do not always result in quick financial gains. On the other hand, a sustainable approach is viewed as a tactical opportunity for growth because it satisfies present-day needs without endangering the ecosystem for future generations. As a result, a significant proportion of forward-thinking businesses are introducing a variety of products with incredibly low environmental impact while simultaneously guaranteeing the same functional and aesthetic features. Furthermore, recovering materials and energy at the end of a product’s life is considered a requirement. Paying attention to the development of eco-sustainable systems is a trump card for attracting expanding markets that are now aware of the ecological challenges that society expects in the future, especially in light of the recent focus on environmental sustainability, eco-design, and, above all, the circular economy. In this scenario, the textile and apparel industry is not an exception and, rather, it is in the process of transitioning from conventional production methods to ones that take into account the circular economy, such as efficient use of natural resources, use of renewable energy sources, reduced or nonexistent production of waste, and management of product lifecycles.
In the textile district of Prato (Italy), the predominant actions taken with the circular economy and green economy in mind have traditionally been process-related, with particular reference to the mechanical and thermal recycling of textile products. This is due, in part, to the typical organizational structure of small and medium-sized enterprises interconnected within the district. Considering the mechanical recycling of fabrics, one of the core businesses in the district is the creation of new fabrics from regenerated wool. The standard procedure for businesses that recycle wool is to provide the customer with a catalog of colors offered. Depending on the consumer’s request, the organization begins to look through its inventory for appropriately colored clothing. Unfortunately, there is always a mismatch between the color of the recycled wool and the desired color. For this reason, two main aspects are considered in current practice: (1) correct classification of the recycled wool in terms of color, and (2) determination of the correct proportion of differently colored fibers to obtain a desired color. Skilled operators typically evaluate both actions manually and visually. Considering proportion assessment, “computer color matching” (CCM) describes a range of semi-automated methods in the literature that mainly deal with the spectrophotometric prediction of dyed fabrics and they are particularly focused on the color-mixing model. These techniques can be broadly categorized into two groups: theoretical and ANN-based techniques. The analysis of diffuse reflectance spectra obtained from weakly absorbing samples is typically performed using theoretical methods, which are primarily based on the well-known Kubelka-Munk (K-M) theory [
1,
2].
With the help of these techniques, it is possible to predict the spectral reflectance of a mixture of components (colorants) once the absorption (K) and scattering (S) coefficients are measured. By blending pre-dyed fibers with CIELAB color differences under 0.8, a tristimulus-matching algorithm based on the Stearns-Noechel model (and its implementations [
3,
4,
5]) allow a reliable prediction (approximately 90%) of the formula for matching a given color standard. Furthermore, a color-matching system based on the Friele theoretical model was proposed and tested for cotton blends [
6], with a classification accuracy varying in the range of 70–90%. Unfortunately, the theoretical approaches described above provide excellent results for predicting the color of turbid media but can lead to improper results in predicting the reflectance factors of mixtures obtained by mixing pre-colored fibers, such as in the case of regenerated wool fabrics. Moreover, they require spectrophotometry as an elective technique for evaluating the absorption and scattering coefficients, leading to excessively long procedures to derive an appropriate classification and thus leaving manual classification still more convenient. To partially solve these issues, a number of ANN- and deep learning-based methods have been explored in the literature in recent years. Such methods have provided reliable and very practical approaches to help the colorist in color matching. For instance, in ref. [
7,
8,
9,
10], a transfer function was derived by connecting the measured reflectance values of a first-attempt blend with the color spectrum obtained by a linear combination of the spectra of each component. Since the average color difference between the expected spectra and the actual carded fiber spectra was less than 0.55 for the CMC (2:1) tolerance method with an experimental collection of blends, the mentioned method proved to be successful for blends made up of more than 15 components.
The main flaw of the suggested solution is that only one material was used and it was only accurate for 5% of recipe variations (e.g., wool). Furthermore, the aforementioned method also made use of spectrophotometry for the color classification. In ref. [
11], a new deep learning-based approach for fabric color identification was proposed to overcome the drawbacks of the previously mentioned methods. In fact, it allowed for precise color identification varying in the range of 58–95%, depending on the color class, with an average precision of 80%, which was considered a good result for this kind of application in practice. In the same paper, the authors compared the performance of their method with the performance of those using several other convolutional neural networks, demonstrating that the proposed approach outperformed the previously proposed methods [
12].
Machine vision (MV)-based color sorting systems have also been used in a number of industrial sorting systems, such as cotton seed sorting [
13], oil ripening estimation [
14], fruit sorting [
15,
16] and leather shoe components [
17]. However, reports of unique color sorting methods for recycled textiles are rare. One of the first attempts to create a reliable sorting system was provided in ref. [
18], where an appositely devised tool used the combination of a statistical method (called the matrix approach), a self-organizing feature map (SOFM), and a feed-forward backpropagation artificial neural network (FFBP ANN)-based approach to correctly classify clothes by respecting the selection criteria provided by human know-how. Despite the promising outcomes of this work, the tool specifically called for the spectrophotometric preliminary classification of the fabric samples. This task is not trivial since calibrated equipment is required and dataset creation takes a long time. Not by chance, some researchers have used cameras to gather data about the color of the recycled samples and carry out the color sorting process. In particular, the authors in ref. [
12] devised a computer vision-based color-sorting system for waste textile recycling. They tested the devised architecture to classify samples of colored fabrics according to the Panton TPX color series, obtaining excellent results. The average accuracy for color classification varied in the range of 62–100%. The classification carried out in this relevant paper was intended to categorize fabrics in accordance with the unique colors supplied by a textile company, which were sorted based on expert knowledge. This last aspect entailed the need to discard purely deterministic methods for the color categorization of fabrics since company experts could group differently colored fabrics in the same class while apparently similar ones could be separated.
Despite that the aforementioned approaches are extremely useful and reliable, classification is still manually performed today and no mature technology can be automatically used. Consequently, sorting efficiency is quite low and guaranteeing the consistency of sorting quality is challenging due to long-term, continuous, manual work [
12].
Based on the relevant literature and taking into account the main drawbacks of previously devised approaches, the aim of the present paper was to devise a simple, yet effective, tool for carrying out reliable color classification of plain, colored, regenerated wool fabrics. The devised tool combined image acquisition with the use of a probabilistic neural network (PNN), which is considered a viable solution for mimicking the color classification visually performed by textile experts. Therefore, the method can be considered a “personalized” color classification.
2. Materials and Methods
With the aim of developing a color classification tool able to automatically perform reliable and human-like sorting of fabrics on the basis of color, the present work encompassed the following main phases:
Definition of a set of color classes against which to classify recycled wool fabrics;
Color data collection of a number of fabric samples by means of an MV system;
Training of PNN-based algorithm to properly classify the fabric samples.
2.1. Definition of a Set of Color Classes
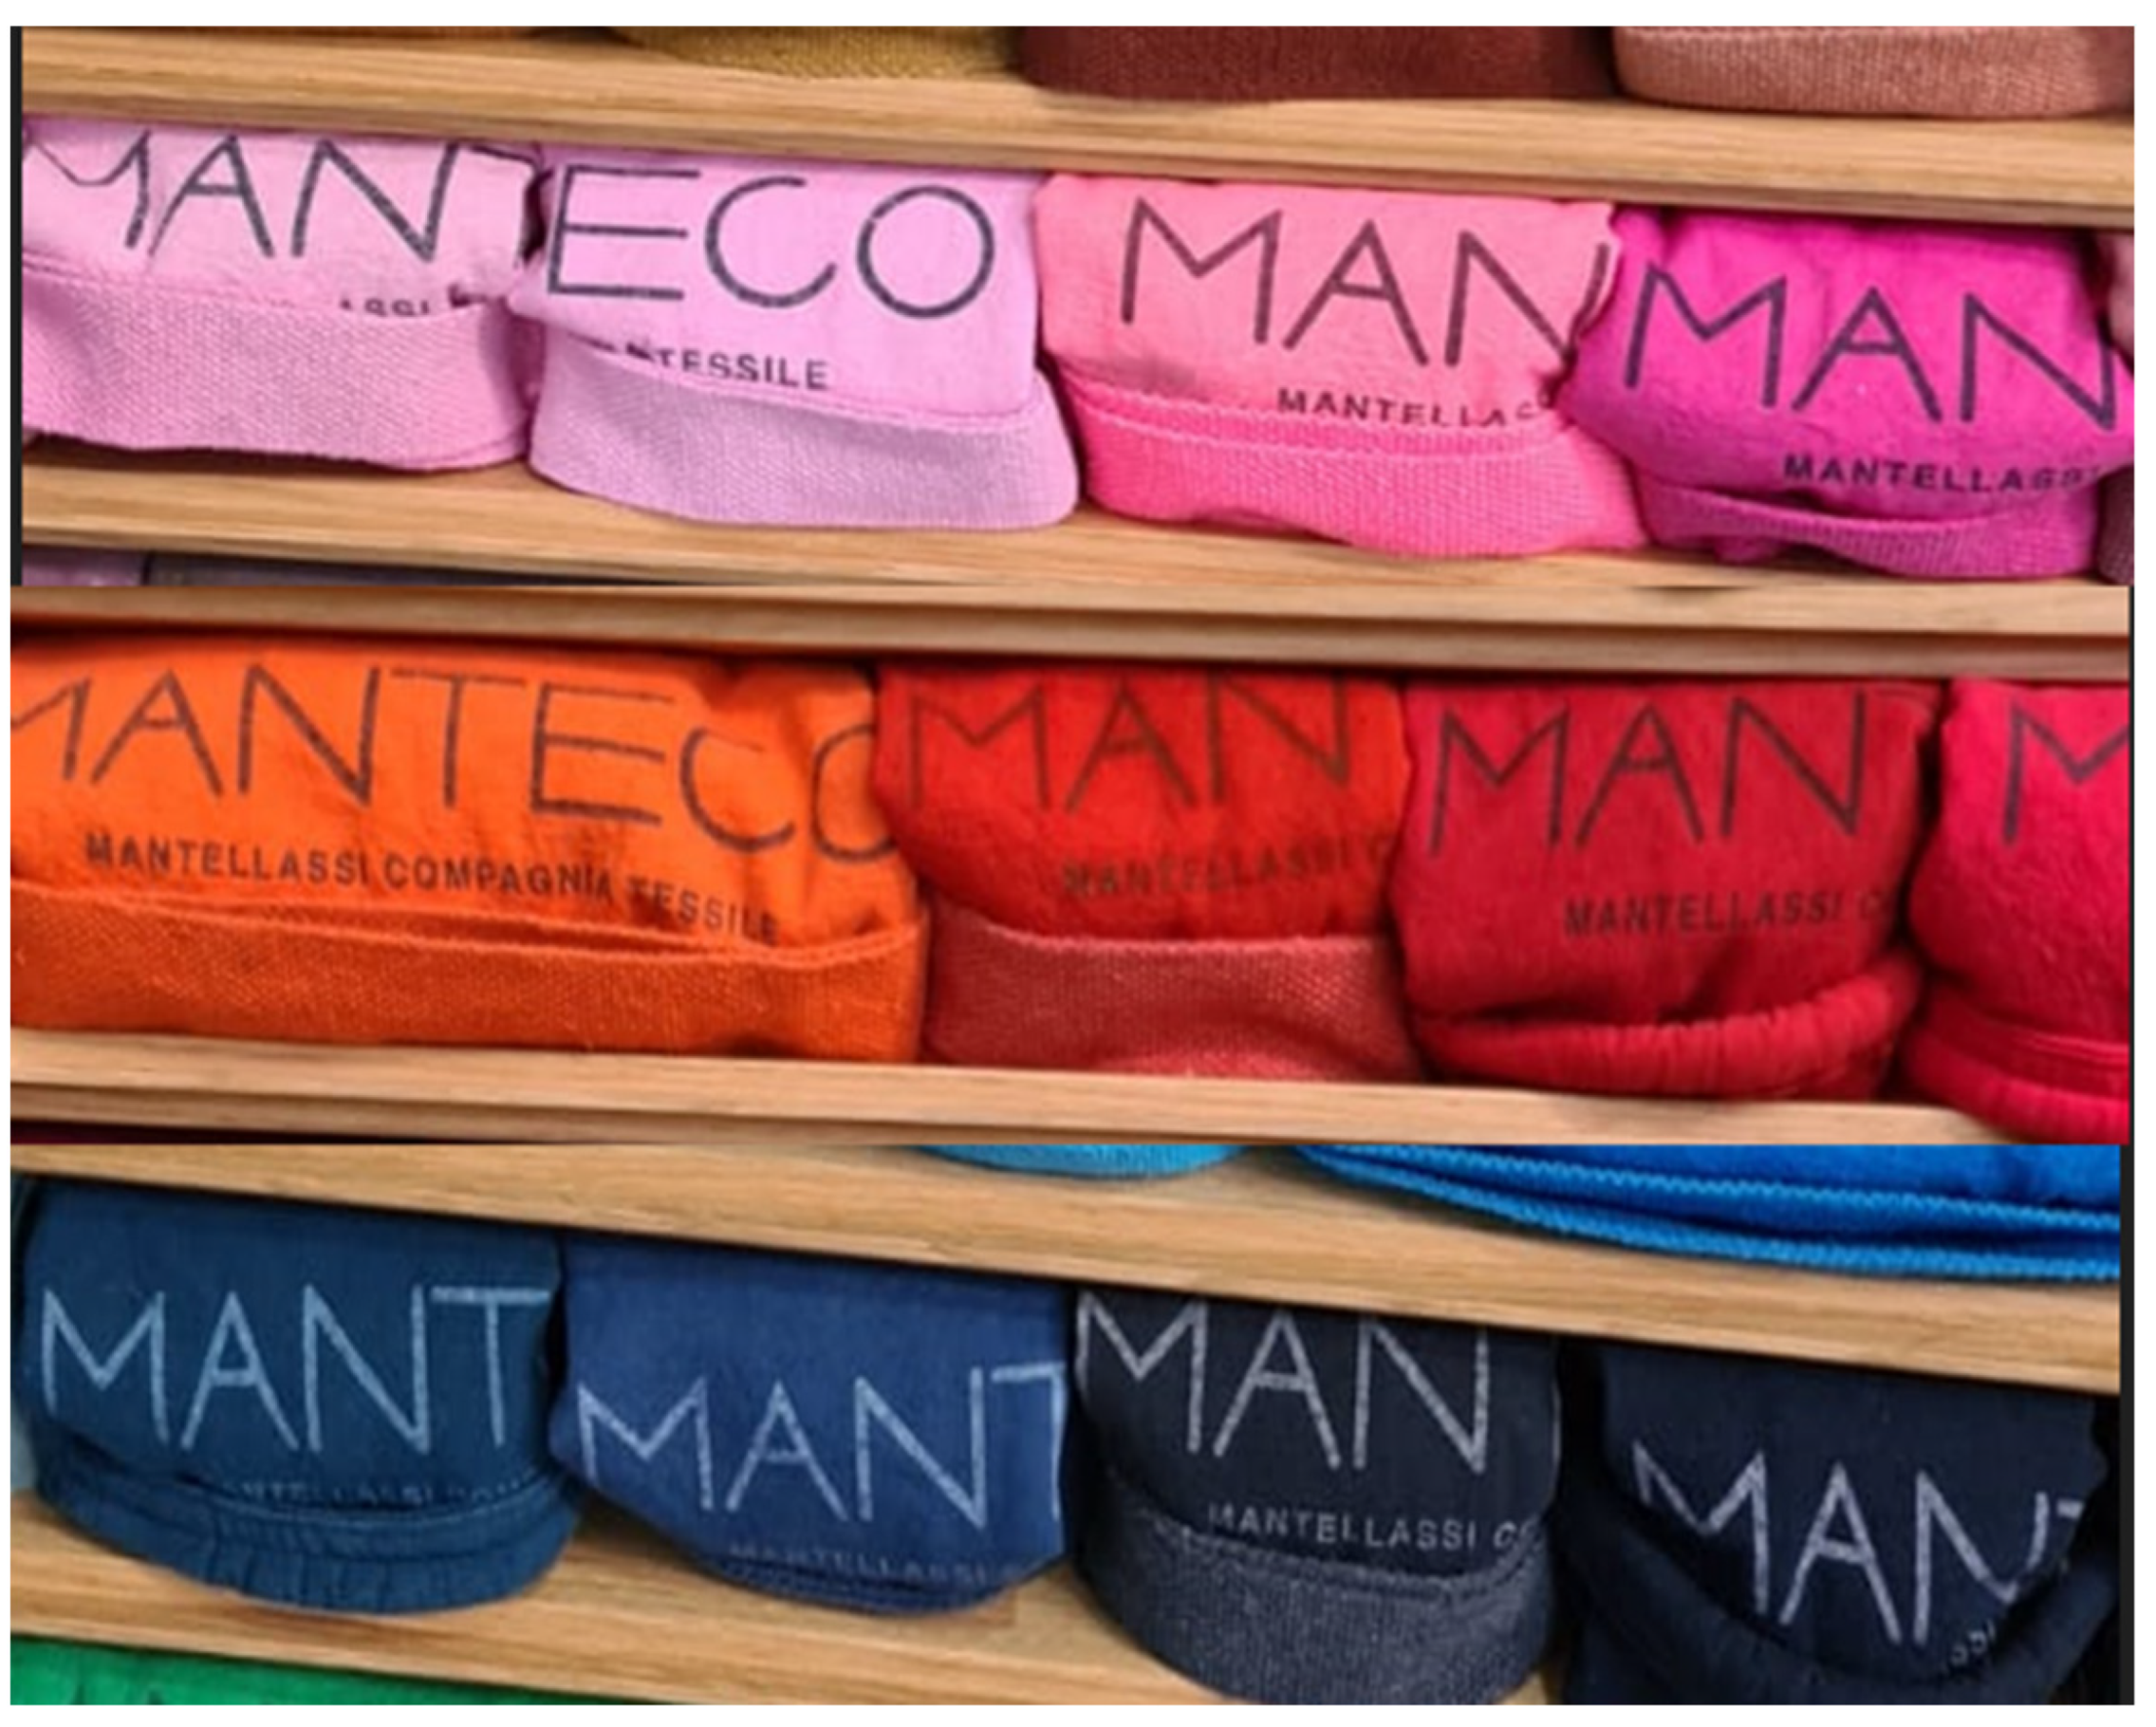
The company pickers (i.e., the experts who sort fabrics based on their color) typically use a two-phase selection process to classify plain, colored fabrics. First, the clothing is arranged into color “families” (such as red, blue, and white), and each family’s members are then further categorized into color classes. For the current work, the catalog provided by an Italian textile company operating in Prato was used to show the viability of the proposed method. This dataset consisted of a target set of 40 fabric samples made of recycled wool, representing all the target colors offered to company customers. Each sample represented a particular color class belonging to a color family. Ten overall color families made up the used catalog, as shown in
Table 1 (i.e., the total number of classes is 40).
Figure 1 shows the four different classes for families “pink,” “red,” and “blue.”
When a new fabric composed of regenerated wool was conferred to the company, the textile experts were required to classify it within one of the aforementioned classes. A fabric sample must be classified in one of the catalog’s families before being assigned to a class, even if there are notable differences between the fabric sample color and one of the colored samples in the catalog. This guarantee that classification is achieved according to textile experts’ criteria. To train a PNN-based color sorting system, it was necessary to collect and properly pre-process a relevant number of fabric samples to be categorized in one of the color classes (and families) of the catalog. In order to create a training dataset that can represent nearly all of the regenerated wool sample colors, 800 fabrics of various colors were gathered. The fabrics were chosen to cover the full spectrum of the catalog’s colors as evenly as possible, with more closely related classes reflecting more similarly the catalog colors.
The company expert staff then classified these fabrics within the aforementioned color families and classes. Such a process is typically not error-free; accordingly, it was necessary to solicit the blind opinions of five pickers in order to minimize classification errors. This time-consuming operation, called “re-picking,” required continuous revision during the entire process since a fabric was effectively classified only when at least 4 out of 5 pickers agreed upon the class and the possible fifth picker classified the fabric in a contiguous class.
Table 1 lists the overall number of samples for each color class and family in which the training set was classified.
2.2. Color Data Collection and Parameter Extraction
Once collected, the fabrics were processed by means of an appositely devised MV system, which was conceived to store high-resolution images. Once such data were retrieved, a number of image processing algorithms were used to define a set of color-related parameters. Finally, such parameters were used to train the neural network.
The MV system consisted of a sealed cabin hosting a Canon EOS 40D camera provided with a 22.2 × 14.8 mm2 CMOS sensor, with a resolution set to 1936 × 1288 pixels2) and a CIE Standard Illuminant D55 lamp (with a temperature of 5503 K, roughly corresponding to mid-morning/mid-afternoon daylight). The camera’s white level was adjusted to 5500 K based on the selected illuminant. The “evaluative 35 zone” camera program was used to evaluate the exposure, and a sample from the white family’s brighter subclass was submitted. All subsequent acquisitions used the recorded exposure settings, and images were captured at a distance of approximately 50 cm. With this system, the acquired area was roughly 150 × 100 mm2 and the image resolution was 13 pixel/mm.
A label is automatically assigned to each acquired image from the training set, according to the coding a/b/c where:
a is an integer in the range 1–800 representing cloth sample number;
b is an integer in the range 1–10 representing the color family;
c is an integer in the range 1–40 representing the assigned color class.
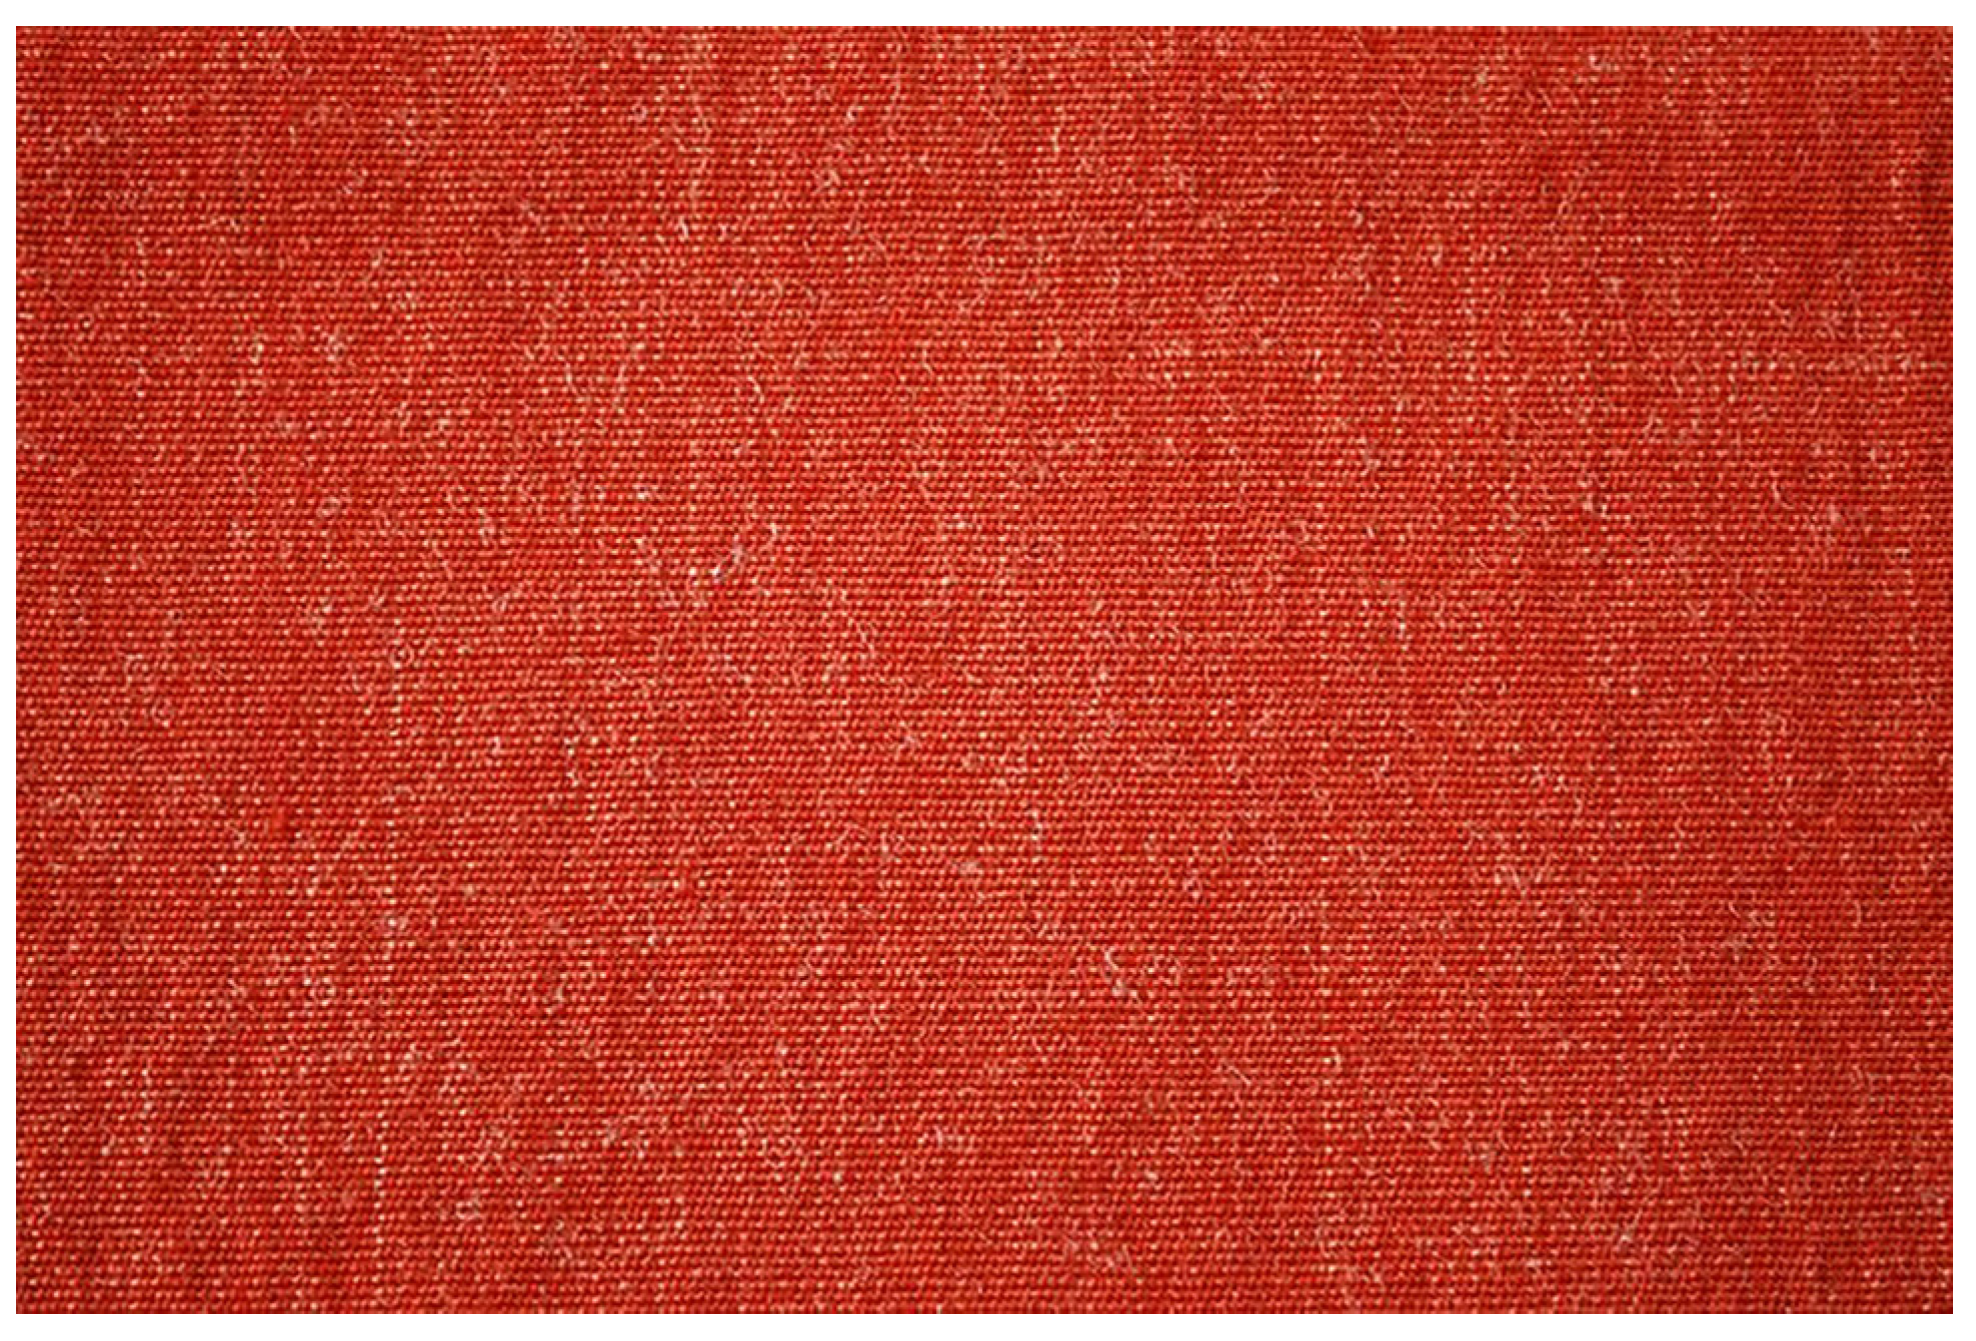
For example, the image labeled with the code 20/6/21 identified the acquired image for sample number 20, classified by the picker in family 6 (i.e., red) and class 21 (see
Figure 2).
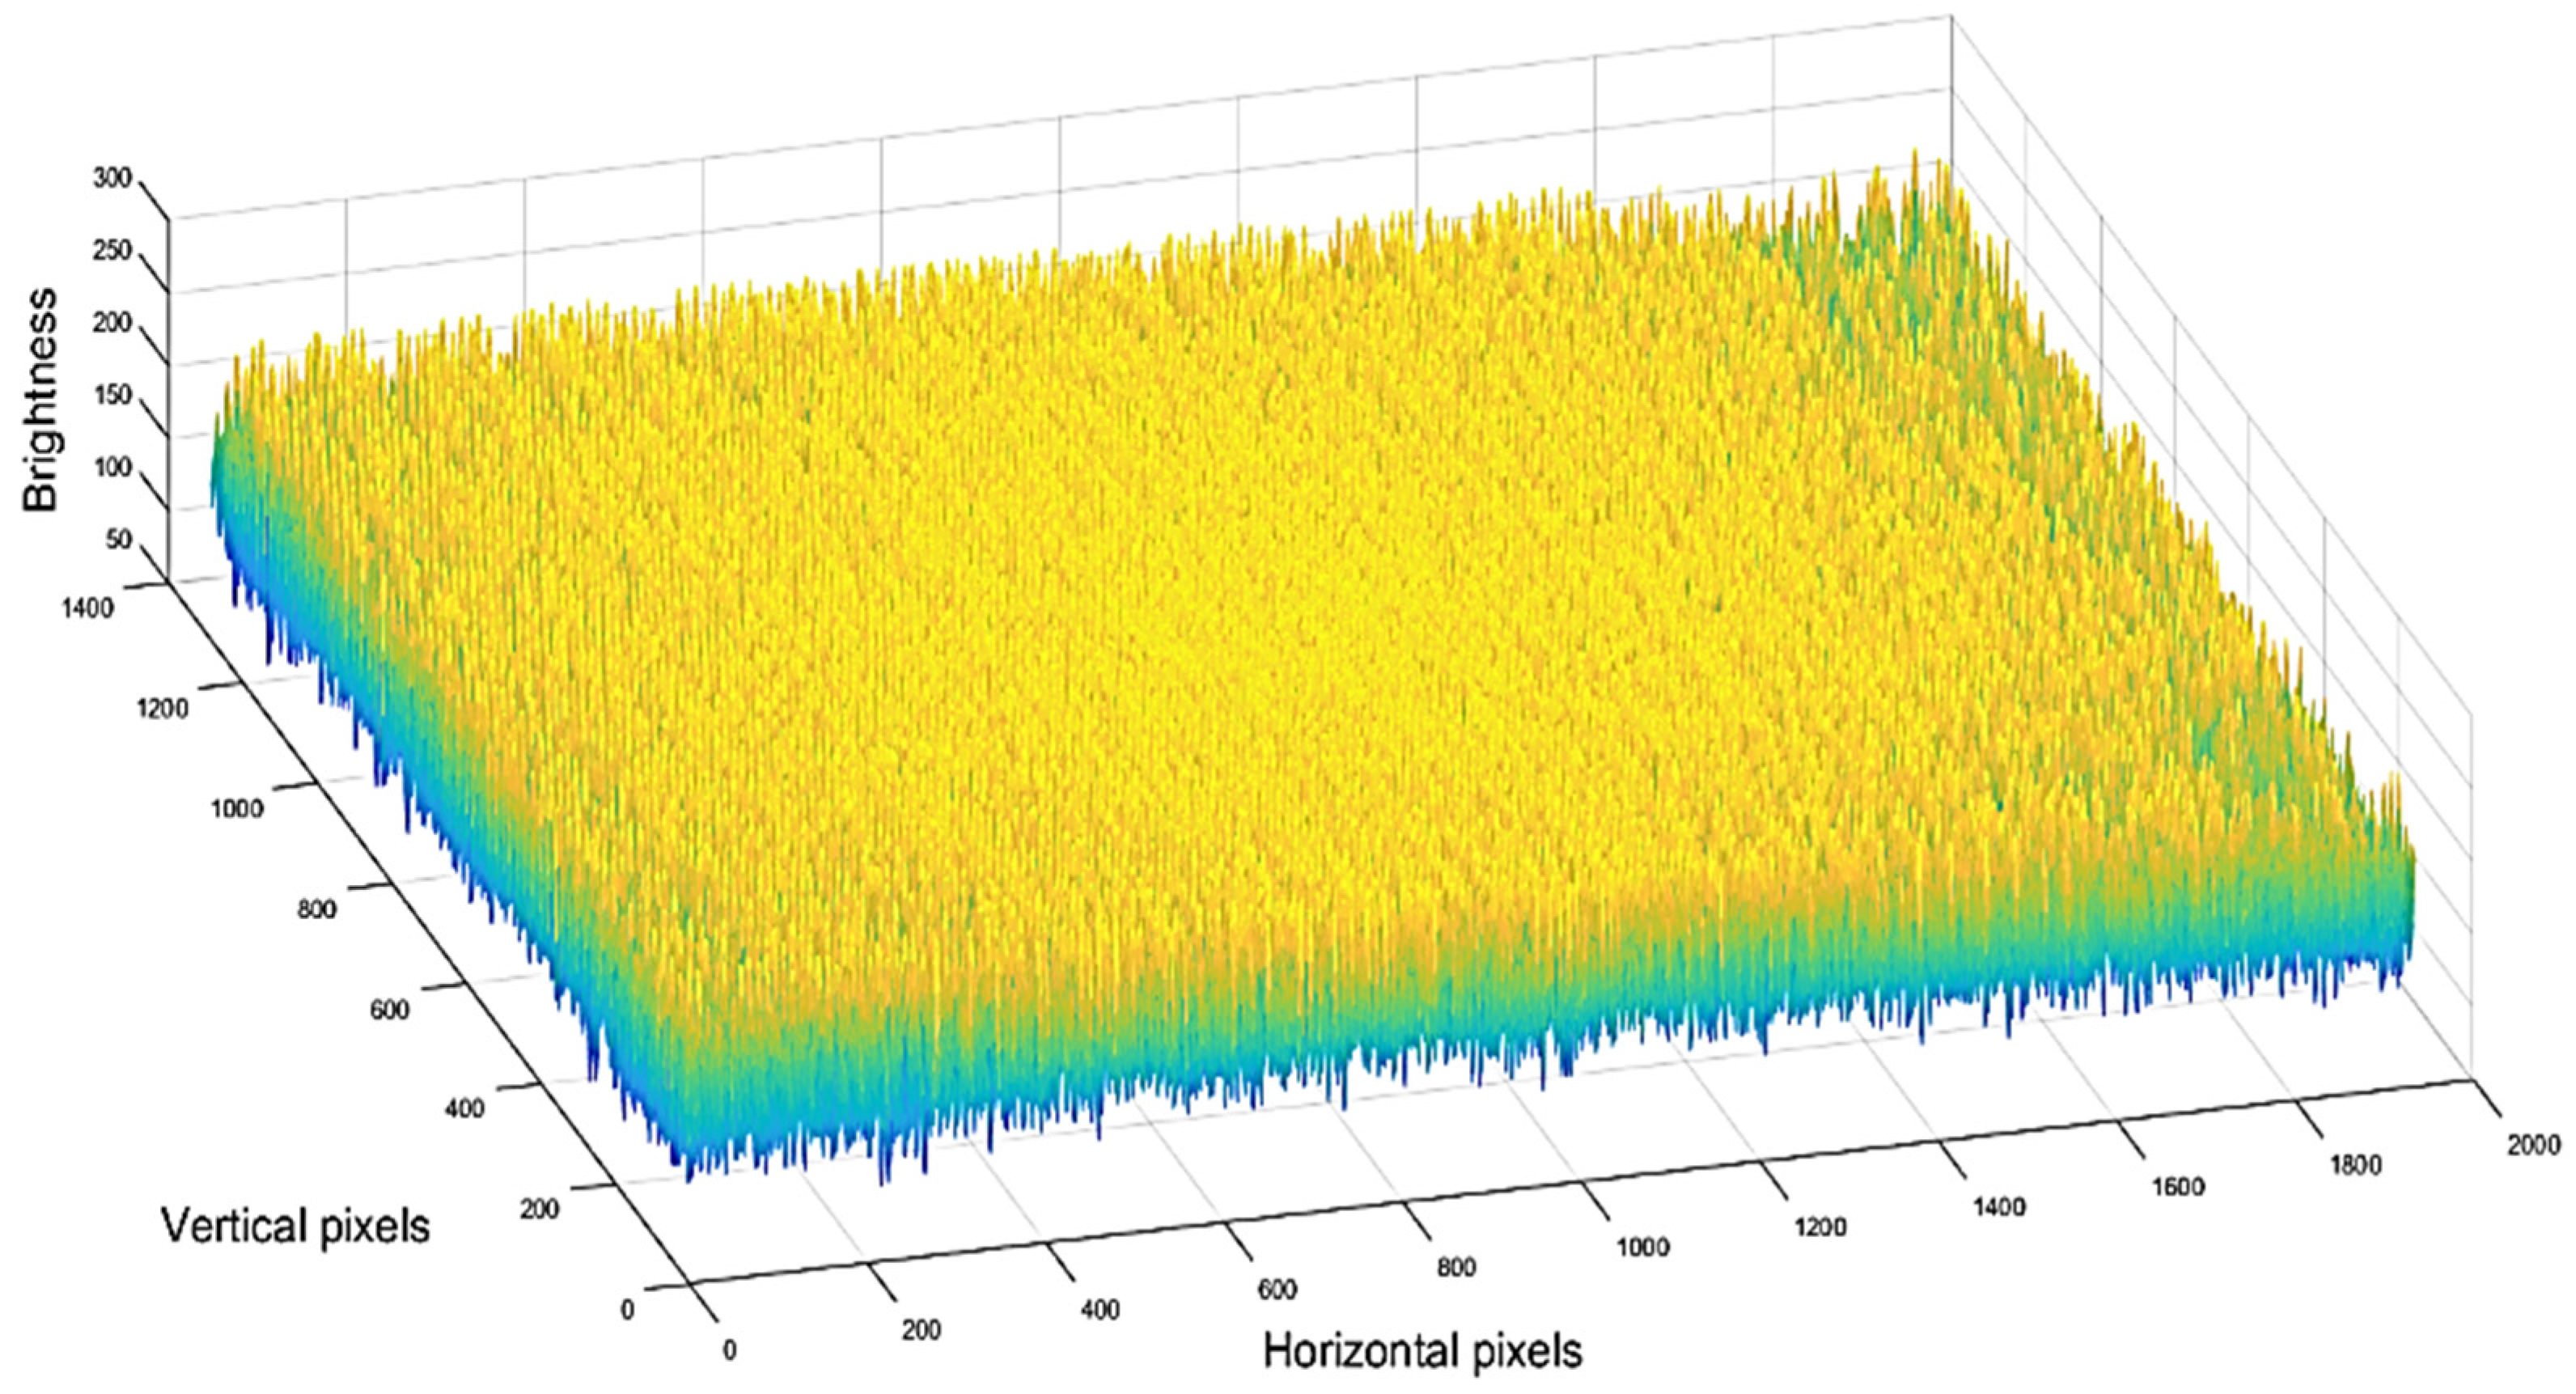
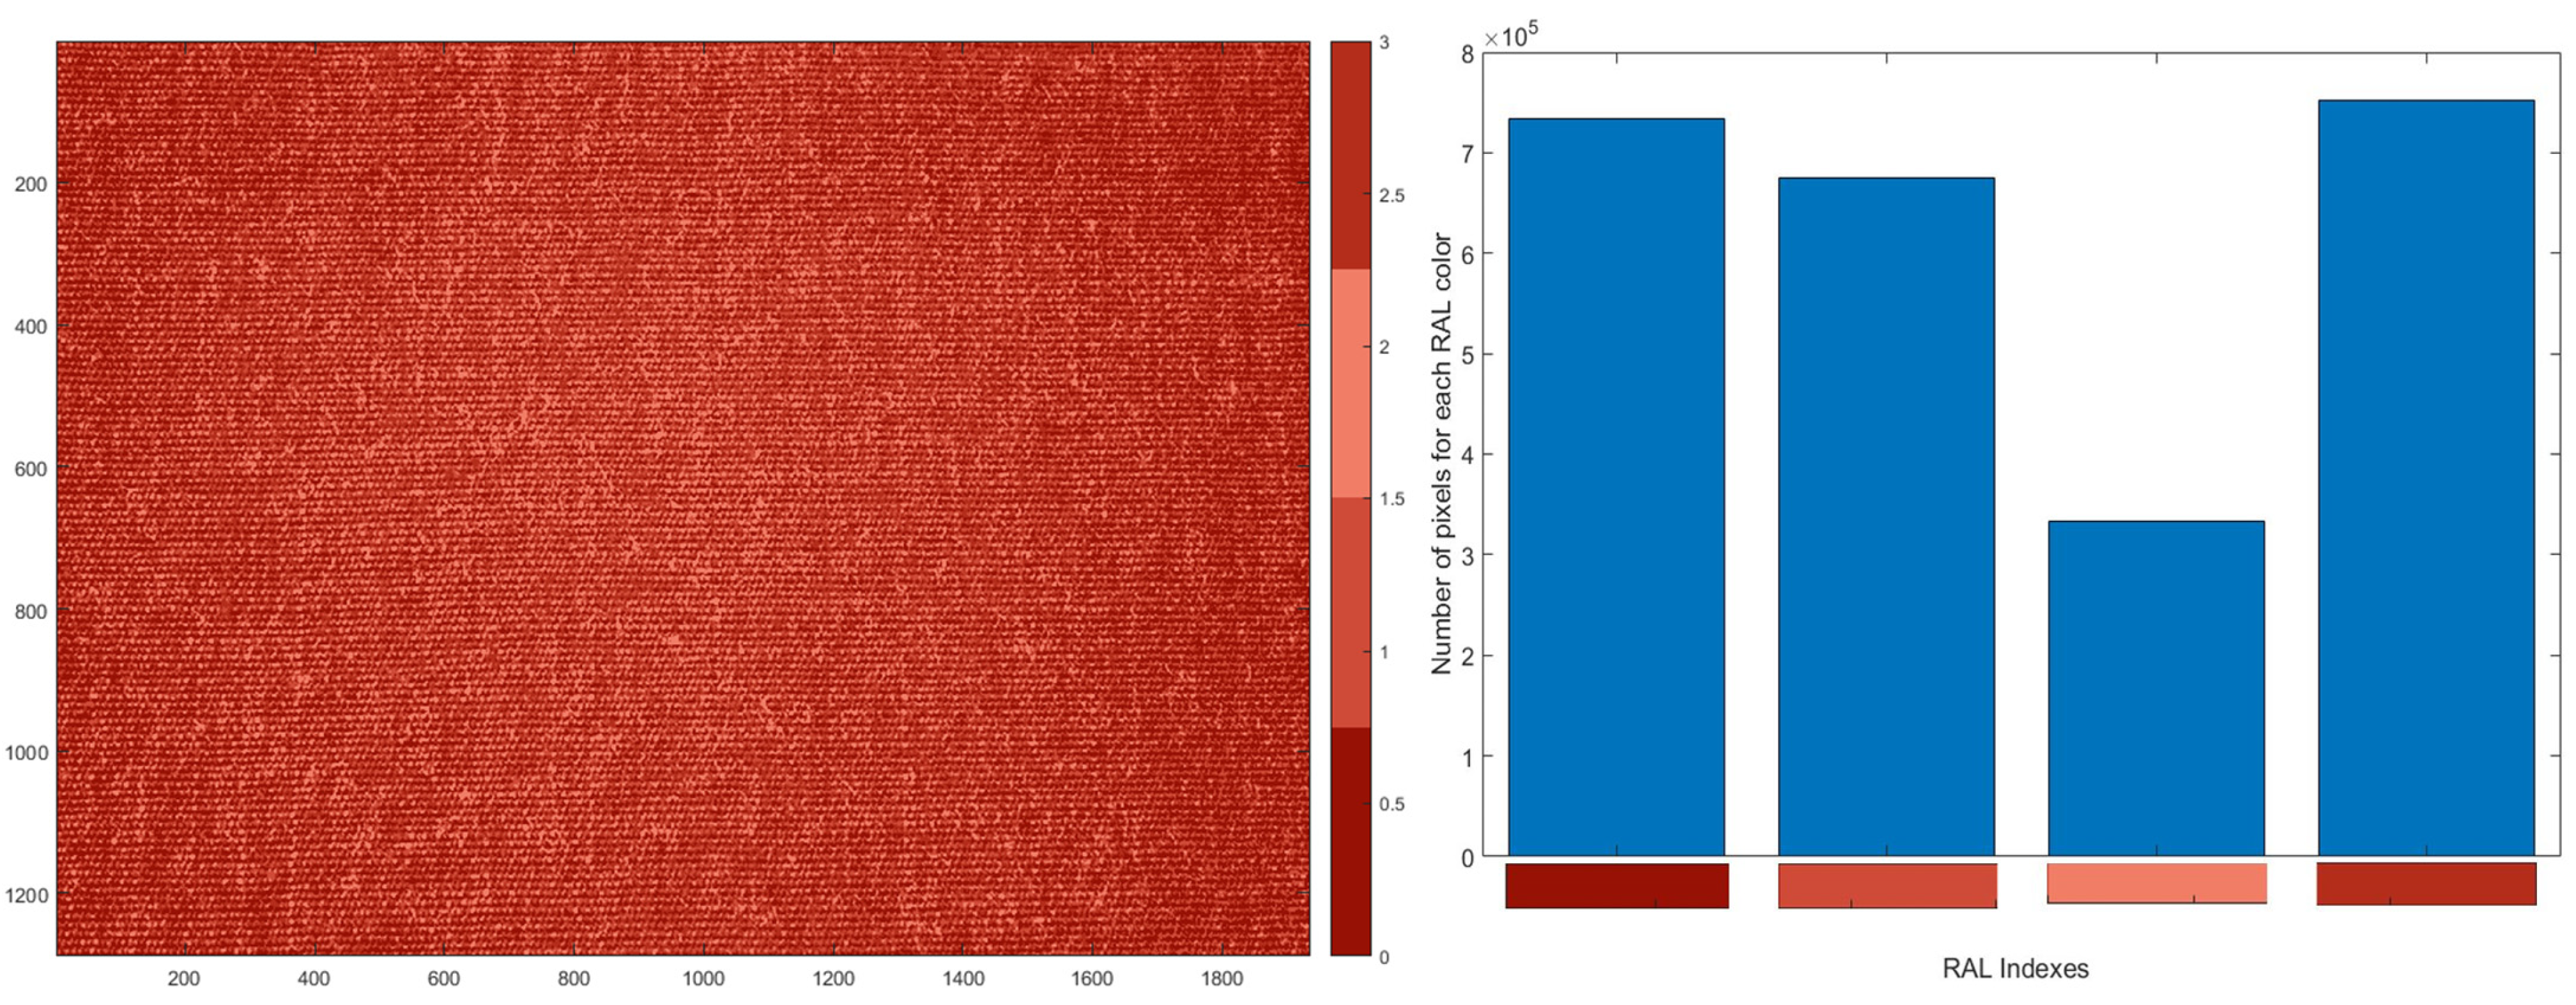
Each acquired image could be represented in the RGB three-dimensional color space where the triplet of its RGB values mapped each pixel. Since the fabric color was not uniform, even in the case of the recycled wool samples being plain fabrics, straightforward use of the RGB values to classify the fabric was not a trivial task. This can be seen in
Figure 3, where the brightness surface of the R channel for the aforementioned fabric is depicted, demonstrating the non-negligible variability of the luminance level.
On the other hand, the use of the entire range of RGB values to describe the color of the acquired image was not feasible since it introduced an excessive, and unnecessary, number of parameters for training the PNN. For these reasons, it was necessary to perform a preliminary image-processing task to simplify the acquired images while maintaining the color information. The pre-processing started from mapping the RGB values to indexed images for a given color map. Many standard color-matching systems are available to this purpose; among them, the most commonly adopted are RAL® and PANTONE®. In the present work, the RAL color chart was used, which consisted of an overall number of 313 colors.
As a result, an indexing algorithm was used to locate the RAL color that was closest to each pixel in the original image in terms of Euclidean distance. As widely recognized [
19], the Euclidean distance refers to the distance between two points in the K-dimensional space. The three elements R, G, and B are equivalent to the x, y, and z-axes of the three-bit space in the RGB color model space. The RGB color space must be uniform in order to use the Euclidean distance to determine the similarity between two colors; unfortunately, this condition was not satisfied since the RGB color space is not spherical. Therefore, prior to indexing, a color conversion from RGB to HSV color spaces was required. This was carried out according to ref. [
20]. Once the image was converted, the algorithm mapped each HSV triplet of the original image to the HSV values of RAL
® images. Finally, the algorithm assigned the RAL triplet to the corresponding pixel in the indexed image, which was eventually converted again from HSV space to RGB.
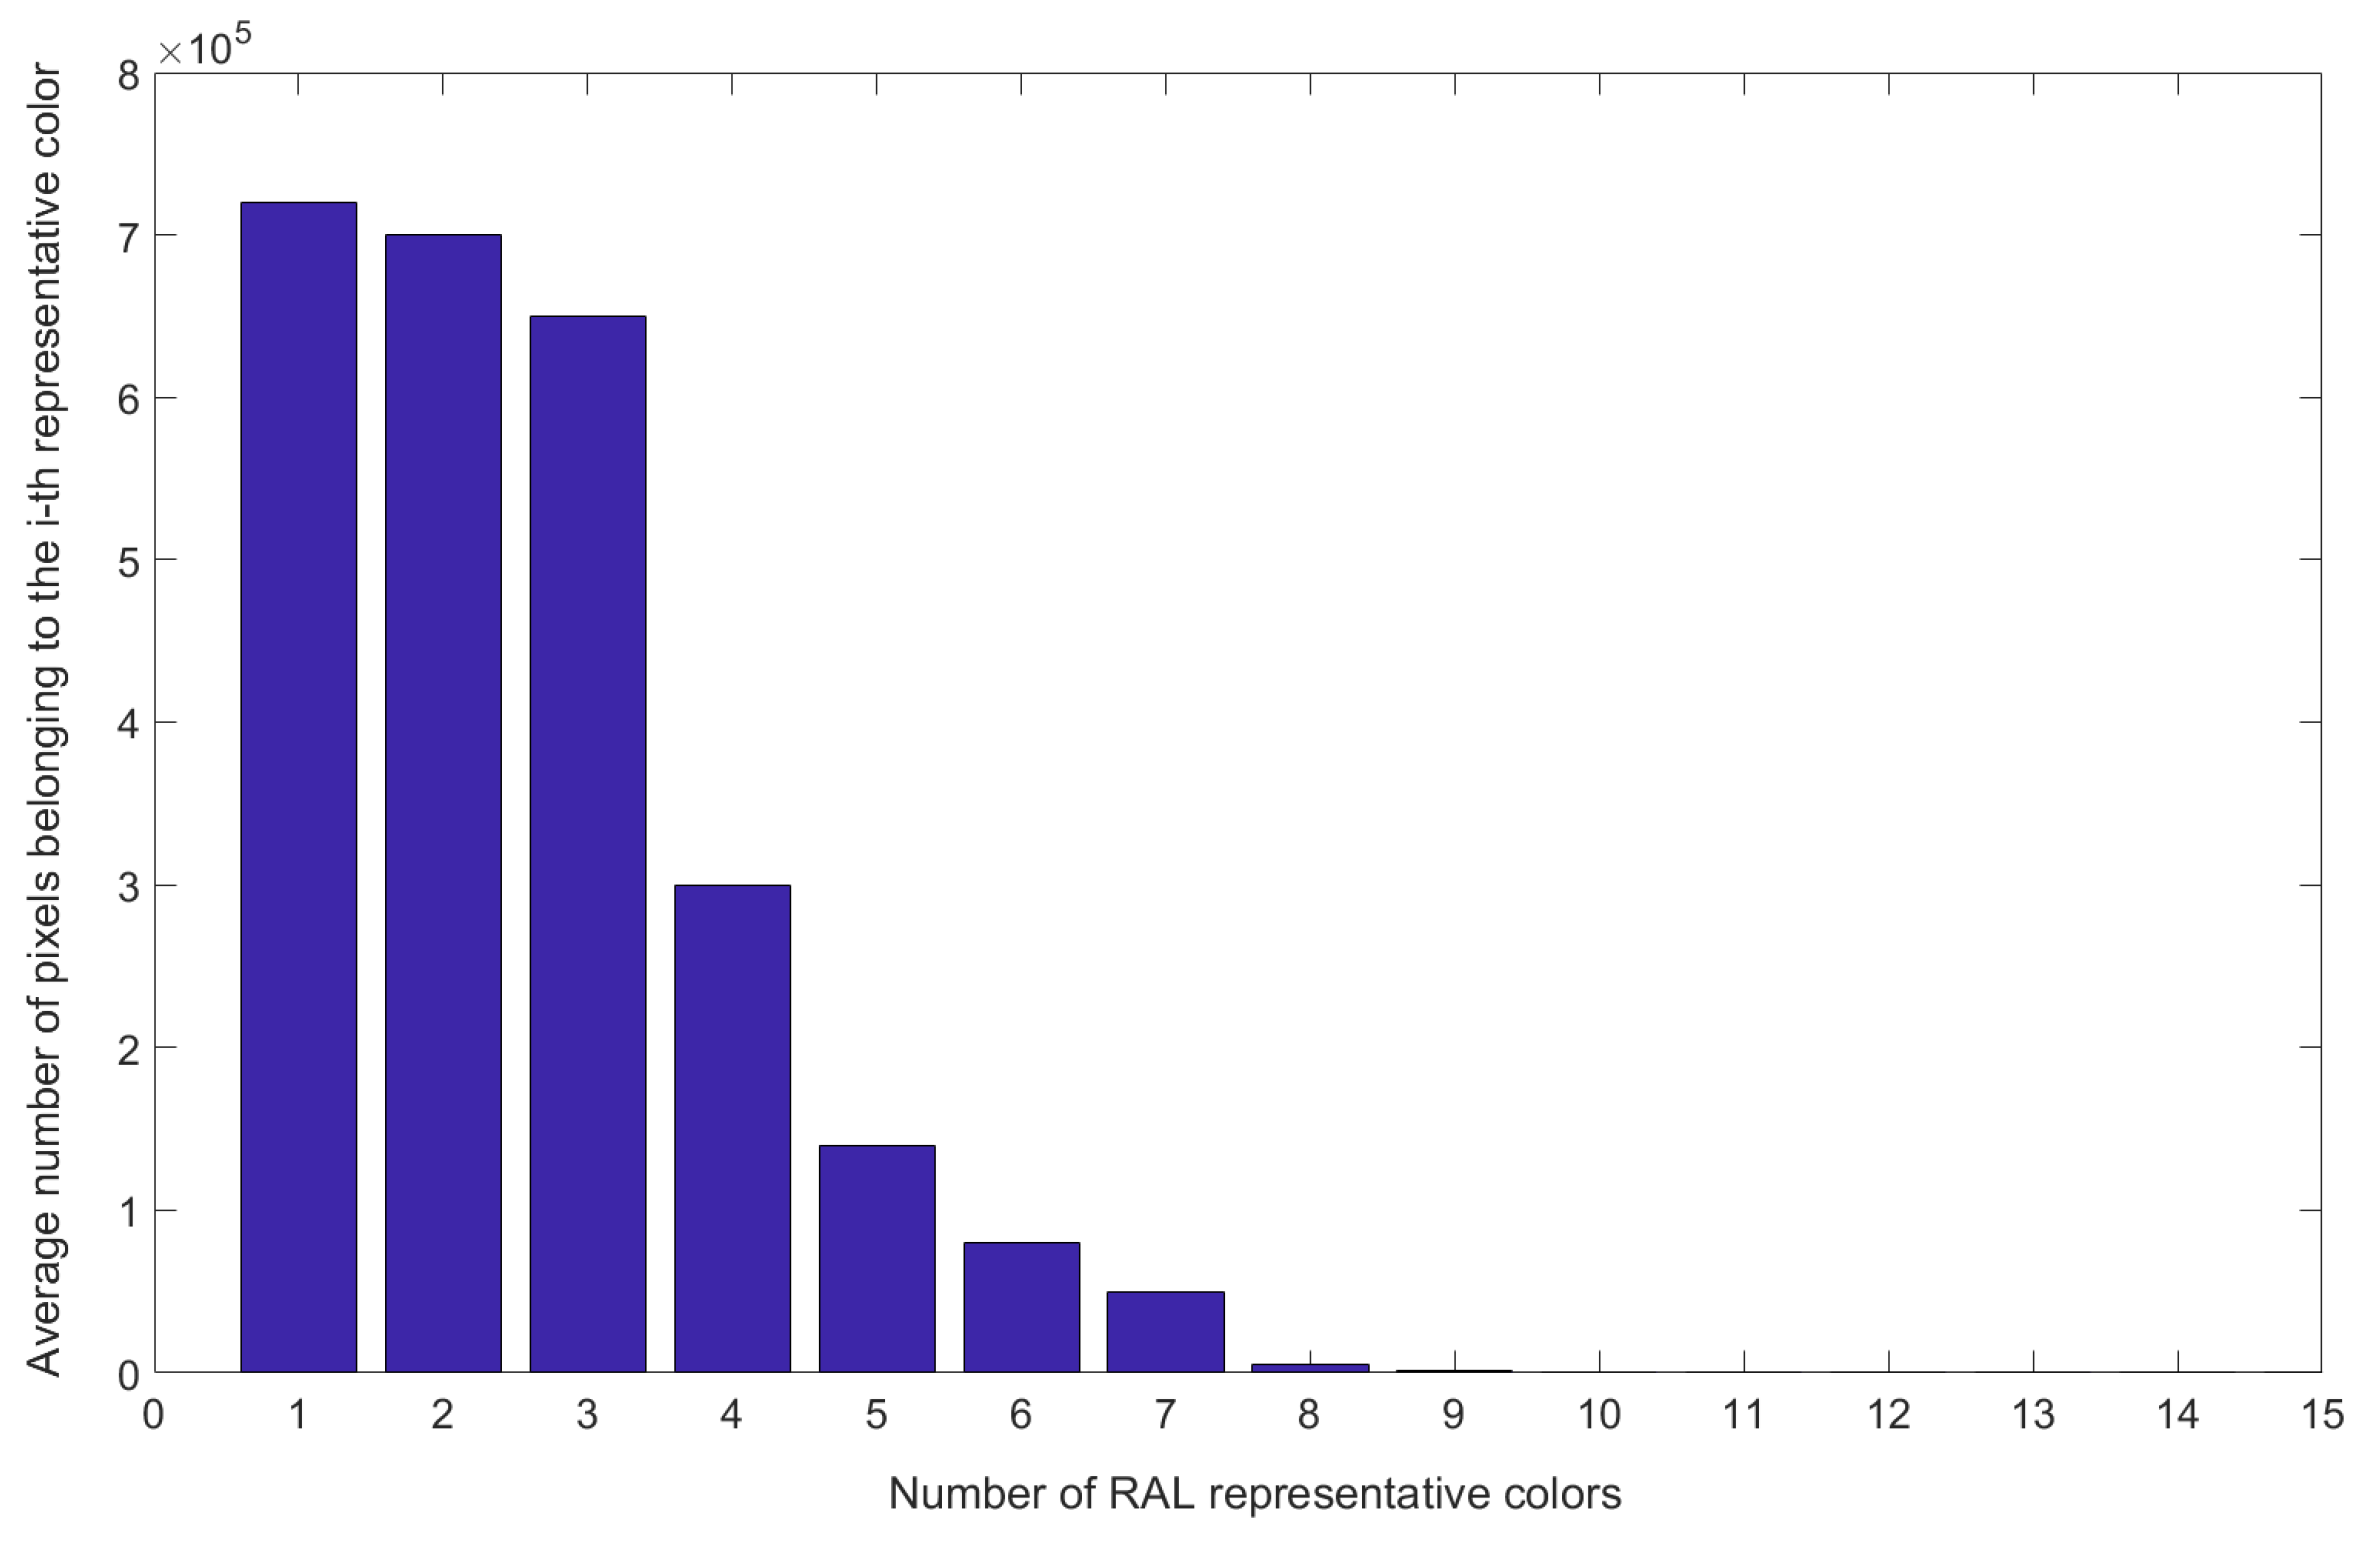
As a result, a limited number of RAL colors, i.e., 313 colors, now composed the processed image. To simplify the problem, only the most representative colors were selected from the image (i.e., those represented by the majority of pixels in the image). To this aim, it was necessary to select a threshold number of colors to limit the number of representative RAL colors.
Accordingly, a number of tests were addressed by varying the number of the most representative colors from 2 to 15. The first six RAL classes, as shown in
Figure 4, contained the largest number of pixels across all dataset images. This can be explained by the fact that the proposed classification system was applied on fabrics with plain colors and therefore the span of possible colors was quite limited. Several configurations of the proposed algorithms were tested using RAL classes from 3 to 6. The variation, in terms of classification accuracy (as explained below, such a value is stated by using Equation (4)), for a given class was in the range of 1–2%. For this reason, the threshold was set to 4 in order to reduce the computational complexity of the PNN without compromising the overall performance of the classification system.
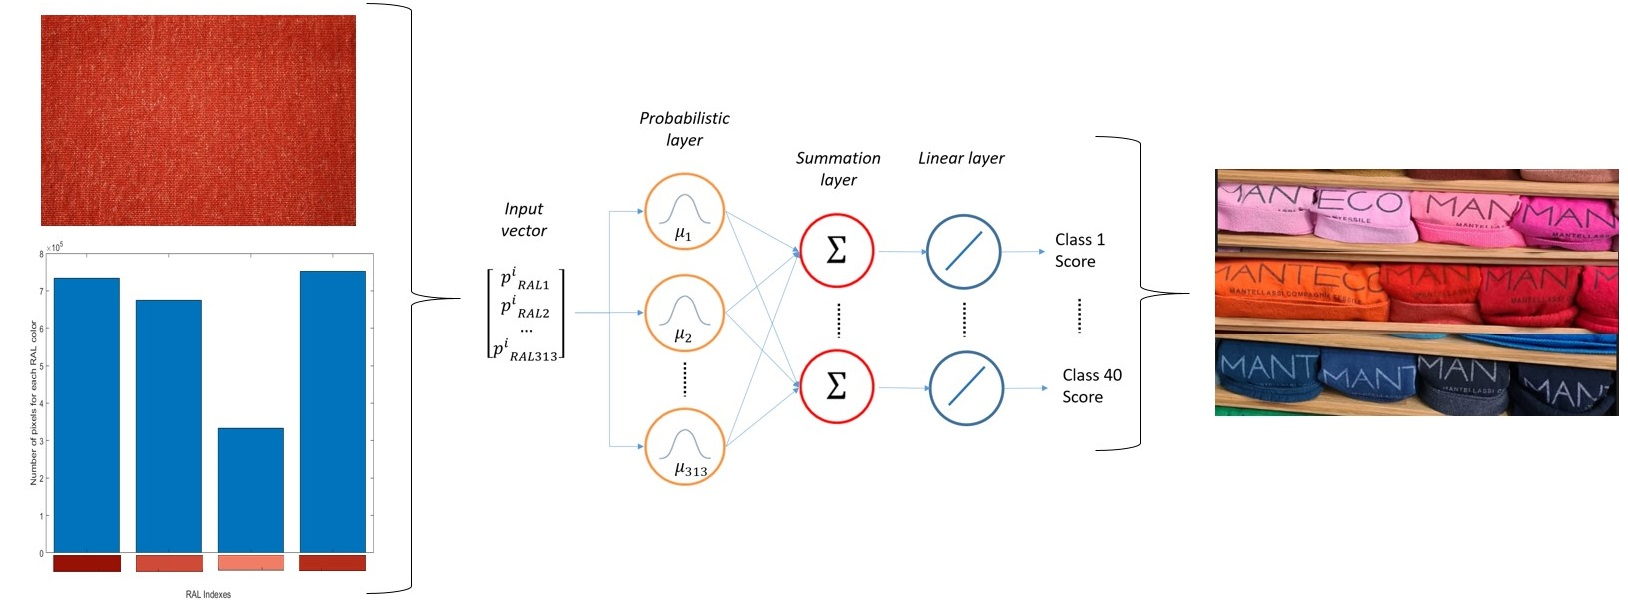
Such values could be represented in the form of an image histogram that displayed the number of pixels connected to each color in the indexed color map (see
Figure 5).
The aforementioned algorithm was applied to all of the fabrics comprising the training set, thus obtaining a set of four parameters for each fabric sample (i.e., the number of pixels in the image belonging to a given RAL color). Since the fabric depicted in
Figure 2 was classified in class 3 for the red family, these parameters should “drive” the sorting system towards a correct classification. As a result, a PNN-based method (described in the next session) was devised to perform the classification.
2.3. PNN-Based Algorithm
As already mentioned in the process described in this paper, the aim was to provide the target class starting from a given image of a fabric. Therefore, as stated above, each element of the training set consisted of four parameters describing the number of pixels belonging to a given RAL color among the 313 possible varieties. The target set, instead, consisted of a given class (from 1 to 40).
In more detail, the training set consisted of the following matrix
(size 313 × 800).
where
is the number of pixels indexed in
jth RAL color for the
ith fabric sample. Such values were normalized using min-max normalization since the image size for all samples was the same. Each column of the target matrix had four values different from zero and the remaining values were equal to zero, since it was decided to limit the number of RAL colors to four. However, increasing the number of indexes in case a researcher aimed to test different solutions was straightforward.
The target set was composed by the matrix (size 1 × 40). The kth column of was a vector with a value equal to 1 in the kth position and 0 elsewhere.
The chosen network could not be unsupervised (such as, for instance, self-organizing mapping [SOM]) since the goal of the current work was to develop a classification system that considered human-related experience. Therefore, the proper structure was a probabilistic neural network. As recognized in the scientific literature [
21,
22], probabilistic neural networks (PNNs) can be used for classification problems.
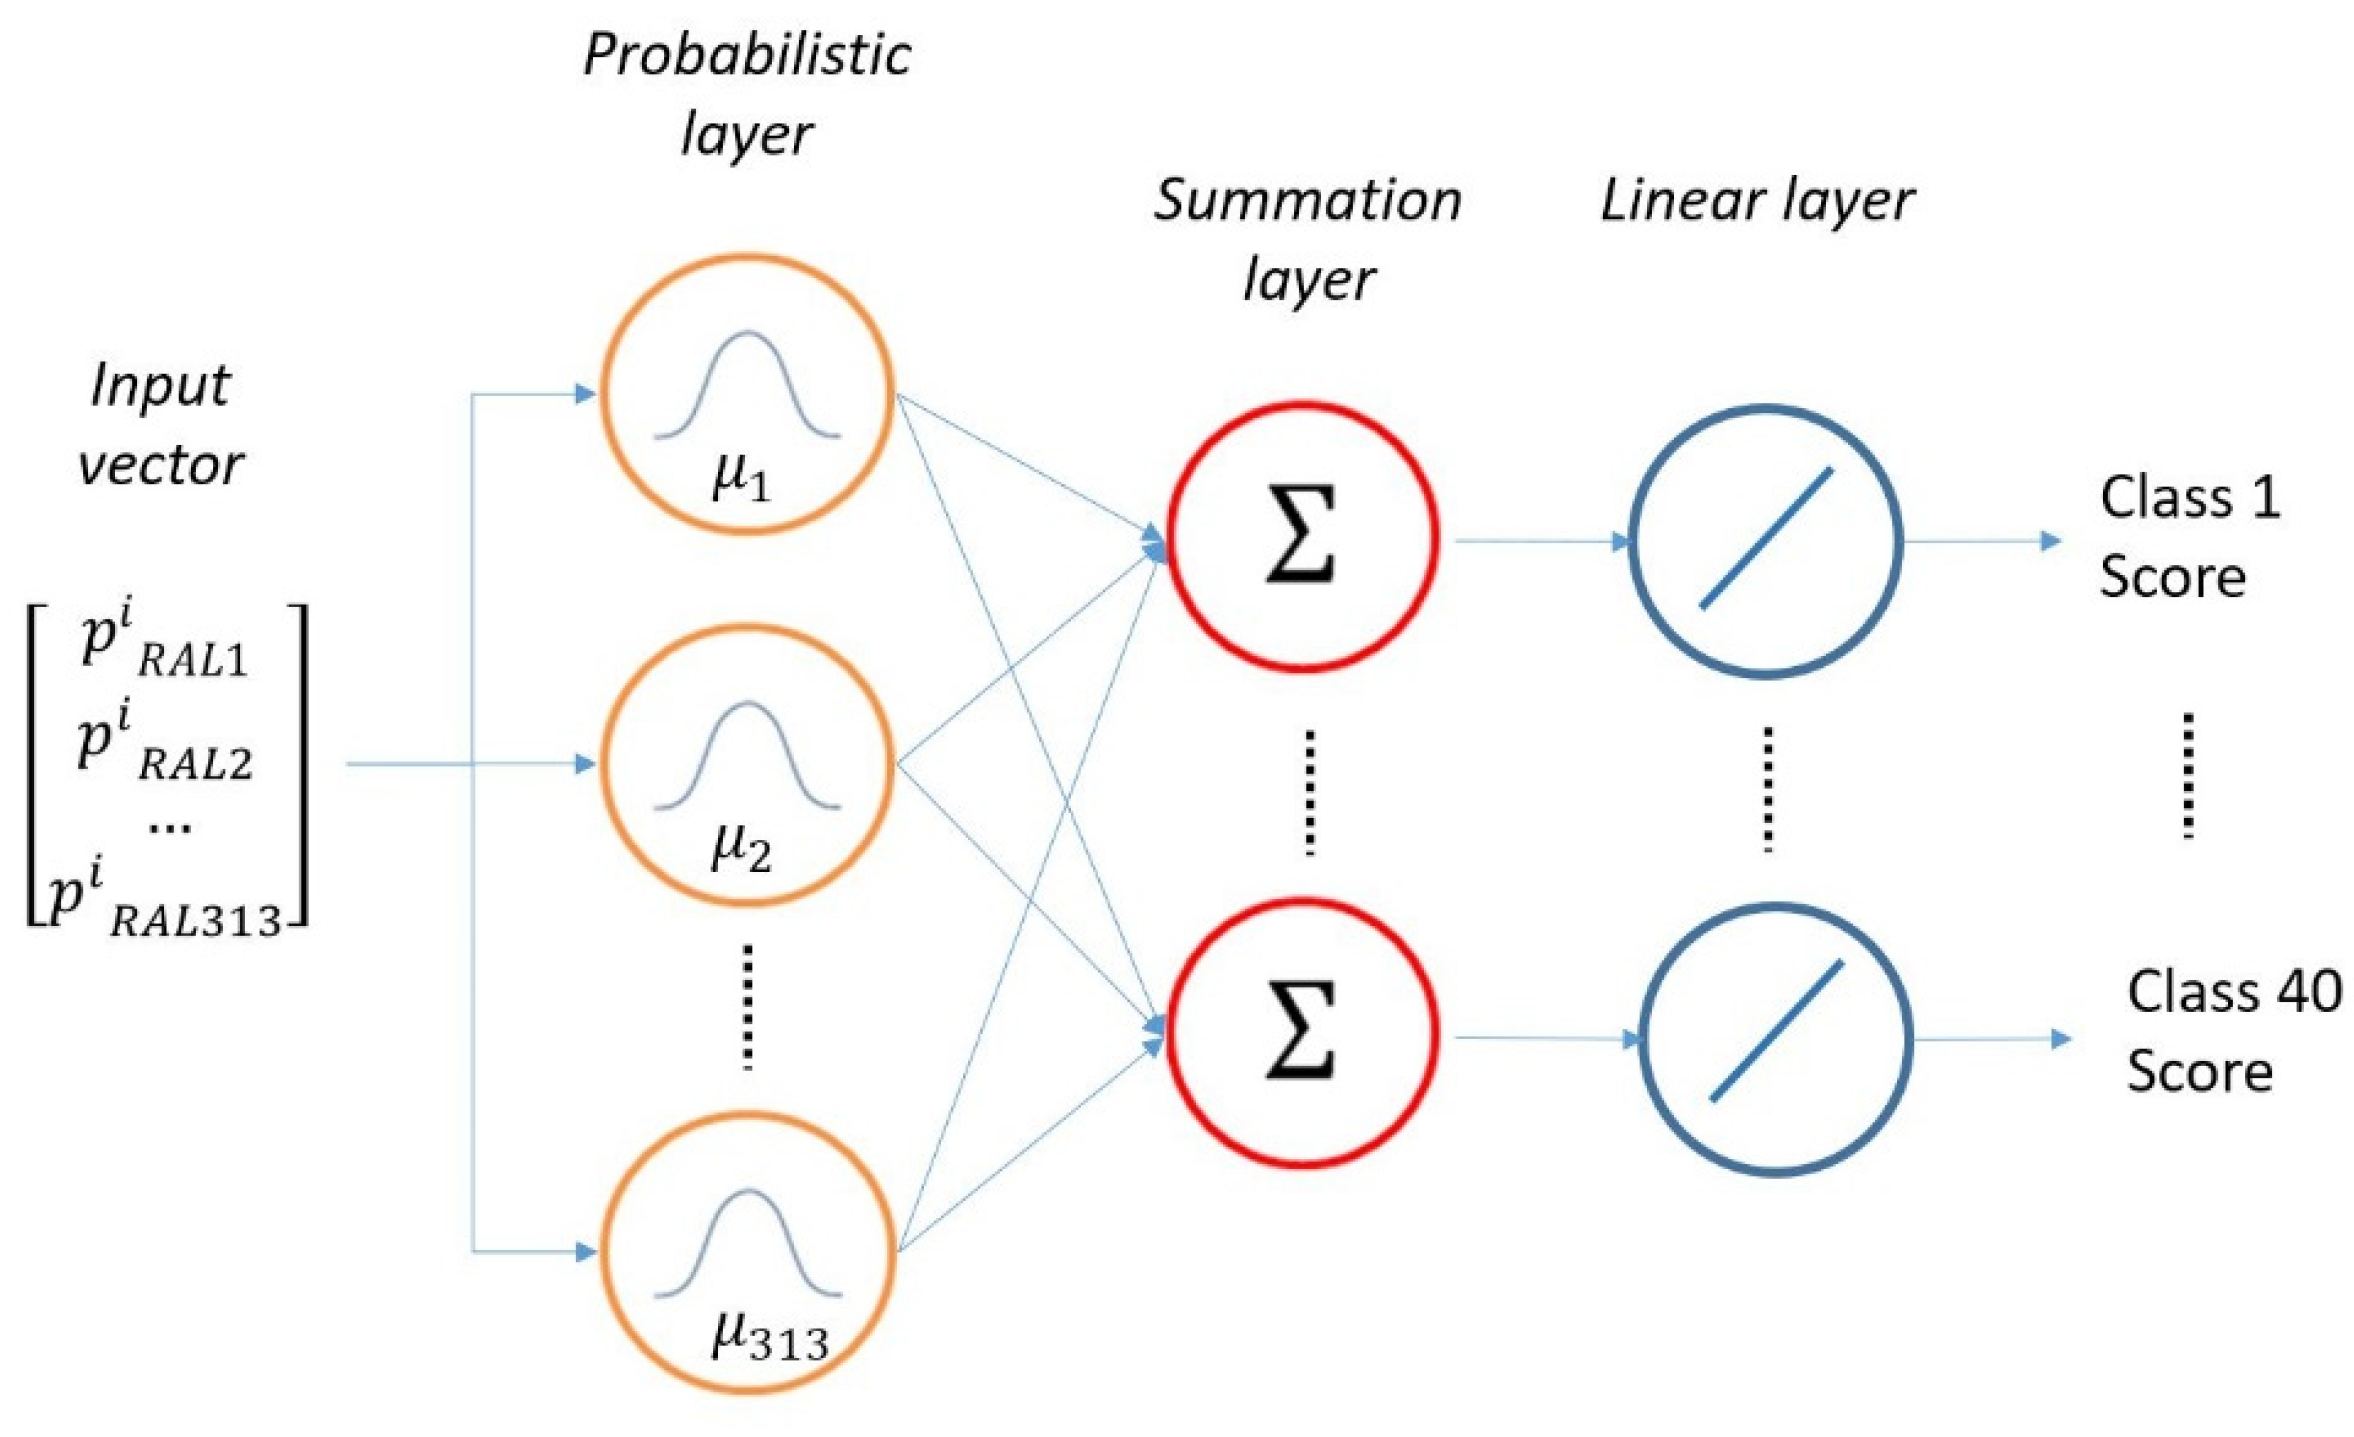
A probabilistic neural network (PNN) is a feed-forward neural network in which connections between nodes do not form a cycle. Therefore, this classifier can estimate the probability density function (PDF) of a given set of data. When an input is presented to such a neural network, a probabilistic layer organizes the learning set by representing each training vector by a hidden neuron that records the features of this vector. During inference, each neuron calculates the Euclidean distance between the input test vector and the training sample, then applies the radial basis kernel function. In this way, it encodes the PDF centered on each training sample or pattern. A second layer, named the summation layer, computes the average of the output of the pattern units for each class. Each class has a single neuron, to which all of the neurons in that class’s pattern layer are connected. A third layer, called the competitive layer, selects the maximum value from the summation layer, and the associated class label is determined accordingly. Since the aim here was to produce a vector of probabilities instead of a single class decision, the competitive layer in the PNN was replaced with a linear layer [
23].
Figure 6 shows the architecture of the selected PNN.
Once trained, the network is able to correlate the training set elements to the target ones. In other words, the network was able to receive, as input, any vector
of the four elements (composed by the number of normalized) pixels:
The PNN will provide, as output, a vector of 40 elements where the
kth value
indicates the probability that the input vector belongs to that class. Hence:
From the output, it was possible to define the most probable class by selecting the position in the vector of the parameter , which corresponded to the probability of falling in such a class. Moreover, it was also possible to detect two or more classes to which the fabric was most likely to be classified. In the present work and were the second class selected by the PNN for the fabric and its likelihood, respectively.
3. Results
The PNN was tested against a new set of 200 fabrics numbered from to . The input values were derived from acquired and processed images. The ANN was then simulated and the results were assessed.
The predicted value had to be compared against the real value (decided by the pool of pickers) in order to assess the reliability of the prediction. An optimal classification system should be able to reliably detect the correct class once a given fabric is given. However, the variability of the possible fabrics conferred to a textile company, especially recycled items, is extremely high. Consequently, an error in classification should be tolerated. Such an error should take into account that an error in classification between two “adjacent” classes is tolerable since the error increases as far as the classification classes drift apart. In fact, after a fabric is classified in a given class, it is mixed together other fabrics of the same class. Thus, if there is a misclassification with “similar” colors, the impact of the misclassification is limited. Conversely, if the misclassification is relevant (e.g., a fabric is classified in class 20 instead of class 24), conferring it to the wrong class may lead to unsatisfactory results.
To this aim, the comparison between the color of the conferred fabric and the color belonging to the catalog may be evaluated by defining a coefficient
, called the “likelihood classification index,” which is given by:
The closer the value is to 1, the greater is the reliability of the prediction for a given fabric. In the case where the PNN classifies the fabric in a class far from the target class, the value rapidly tends to zero.
To provide an example of obtained results, five out the 200 results for the newly tested fabrics are listed together with the prediction error in
Table 2. In order to present the results as accurately as possible, the first two classes (
and
) are listed together with their percentage values (
and
). In the same table, both the best (fabric id.
) and worst (fabric id.
) obtained values for the entire set are listed together with three other randomly selected results. For fabric
, the likelihood of the classification is close to 100% since the classifier detected the correct class according to the pickers and with a high
value. Moreover, the second class estimated by the PNN was close to the correct one. For fabric
, the PNN placed the fabric in the wrong class with a low confidence in the first instance and placed the same fabric in the correct class with an even lower confidence in the second instance. Accordingly, the likelihood parameter was low. Another parameter used to assess the reliability of the classification was the accuracy of the PNN in the overall set of new data. This was evaluated by means of a reliability index [
24], which was defined as follows:
where
is the total number of fabrics correctly classified,
is the number of fabrics classified in the closer class, and
is the number of samples.
4. Discussion
When the whole set of 200 fabrics was considered, the average value for the parameter was 83.2% with a standard deviation of 7.21. The mean value obtained for was 93.34%, thus proving that the system achieved good classification results for the given case study.
In fact, considering the performance evaluation provided in ref. [
11], the accuracy of similar methods based on the use of neural networks varied in the range of 57–80% for a dataset composed of a large number of samples and higher number of colors with respect to the dataset used in this study. The method proposed in this work tended to fail more for gray and black color families, where the reliability of the system was approximately 70%. These results, where available, were comparable to those obtained in several similar studies, as demonstrated in
Table 3. It should be noted that the classification results in ref. [
11] referred to color family rather than color class, whereas the best results from those presented are chosen for comparison with ref. [
12].
In ref. [
18], the reliability index was slightly better (95%) since it used more accurate spectral data to perform the classification. In ref. [
11], better results were obtained for color families that gave less accurate results using the proposed method. For example, the accuracy obtained for the brown color family was approximately 99%, while no data were available for the beige color family. In any case, the average performance was comparable.
The scores obtained in ref. [
11] were comparable with those obtained in this work for color classes blue, orange, and red with a precision of 79%, 90%, and 81%, in the previous work, respectively, against 90%, 85%, and 85% for the present work, respectively. It is important to remark that the main principles behind the two compared classification systems are completely different, as is true for the datasets. Furthermore, the two mentioned studies in the literature made use of more complex networks requiring more computational effort, while the proposed method employed a simple classificatory with a less restricted platform. It should also be considered that, in the present work, the accuracy is incremented by the choice of lowering the classification penalization for classification in a “similar” class.
5. Conclusions
This paper presented a simple, yet effective, MV-PNN-based tool for carrying out reliable color sorting for regenerated wool fabrics according to a personalized color classification. First, a set of color classes against which to classify recycled wool fabrics was described. Then, color data collection of a number of fabric samples was retrieved using an appositely devised MV system and color mapping from RGB to RAL® values to reduce the complexity of the input data. Such parameters were then used to train a PNN able to properly classify new fabrics. Given the simplicity of the proposed approach, which requires textile companies to implement a low-cost machine vision system and run an appositely devised PNN, the obtained results are encouraging. Better results, in fact, are obtainable by implementing approaches that are more complex, such as those cited in literature. Therefore, the proposed method is a viable approach to move forward from manual to automated classification, taking into account that more studies will be required to use it on other complex datasets. Another advantage of the proposed method is that the PNN was trained to cope with the preferred manual/visual color classification assessed by the pickers. In fact, the company decides how to carry out the classification, and it has expert knowledge of how to successfully classify a regenerated fabric (i.e., not merely based on color appearance). This “guided” process leads to more reliable classification results.
The system works under some assumptions and simplifications: as already stated, the number of RAL colors used to map each image is limited to four more representative values. Moreover, the likelihood of the estimation is increased by taking into account that an error in classification could be minimized if the class is close enough to the desired class. Of course, one could decide to increase the number of RAL classes and/or to consider inappropriate any deviation from the correct class.
In such cases, different results could be obtained in replicating the proposed work by enlarging the number of RAL classes, thus considerably increasing the complexity of the PNN. For instance, the size of the training set remains unaltered using eight RAL classes but the number of non-zero elements for each vector is doubled. However, as explained above, the obtained results are only slightly better and so performing this enlargement is not worthwhile. On the other hand, deciding to consider the classification of a fabric in a different class with respect to the one selected by the pickers as erroneous, even if the class is adjacent, leads to an average reduction of the classification accuracy of 5–6%. In any case, the proposed tool demonstrated its effectiveness in a practical application for the textile industry, once experts are made aware of the possible limitations of this study. Despite the system’s demonstrated dependability, it was particularly capable of (1) recognizing new fabrics with a mean error under 10%, and (2) respecting the selection criteria offered by human expertise. Additionally, it offered repeatable selections: a number of acquisitions for the same fabric under various environmental conditions were carried out, and they all produced the same final classification with an average error lower than 0.5%. Future work will address texturized fabrics and regenerated fabrics composed of wool combined with other raw materials.


